Diets for a Better Future: Rebooting and Reimagining Healthy and Sustainable Food Systems in the G20 - EAT Forum
←
→
Page content transcription
If your browser does not render page correctly, please read the page content below
Diets for a Better Future: Rebooting and Reimagining Healthy and Sustainable Food Systems in the G20

Diets For a Better Future

Lead Author                                                            Design and Graphics                                                     Diets for a Better Future investigates current food
Brent Loken PhD                                                        Hannah Olwer                                                            consumption patterns and the efficacy of national
Current Global Food Lead Scientist                                     Senior Graphic Designer
WWF                                                                    EAT
                                                                                                                                               dietary guidelines in G20 countries compared to the
Past Director of Science Translation
                                                                       Jacob Leslie
                                                                                                                                               Planetary Health Diet. It also explores the potential
EAT                                                                                                                                            for reducing greenhouse gas emissions by shifting
                                                                       Graphic Designer
                                                                       EAT                                                                     toward more healthy and sustainable diets and how
Contributing Author                                                                                                                            this could lead to a more equitable distribution of the
Fabrice DeClerck PhD                                                   Acknowledgements                                                        global “carbon budget” for food. The modeling used
Science Director                                                       This report would not be possible without the generous support of       in this report is part of an academic research paper
EAT and Bioversity                                                     the Climate and Land Use Alliance. This report would also not have
                                                                       been possible without the advice and generous contribution of Marco     titled The healthiness and sustainability of national and
                                                                       Springmann whose analysis forms the basis for this paper and is part    global food-based dietary guidelines (Springmann et
Exponential Roadmap modeler                                            of a global study on the healthiness and environmental sustainability
                                                                                                                                               al. 2020).
                                                                       of national dietary guidelines compared to various dietary patterns.
Avit Bhowmik PhD
                                                                       We would also like to thank the numerous individuals at EAT who
Karlstad University and Exponential Roadmap
                                                                       gave their advice and critiques of this report. This includes Gunhild
                                                                       Stordalen MD, PhD, Olav Kjørven, Lujain Alqodmani, BMSc MBBS
                                                                       MIHMEP, Olof Olsson PhD, and Sudhvir Singh MD.
Reviewers
Prof Walter Willett MD
Harvard T.H. Chan School of Public Health and Harvard Medical School   Image credit
Bronson Griscom PhD                                                    Page 7: Unsplash, Johnny McClung
Conservation International
                                                                       Page 12: Getty Images, Wahyu Noviansyah / EyeEm
Marco Springmann PhD
                                                                       Page 16: iStock, Simon Gurney
Oxford Martin Programme on the Future of Food
                                                                       Page 18: Shutterstock, Roman Akhmetov
Jonathan Foley PhD
Project Drawdown                                                       Page 24: Unsplash, Li-An Lim
                                                                       Page 27: Shutterstock, Olga Klochanko

Editor                                                                 Page 32: Getty Images, Artur Debat

Biz Ghormley
Director of Communication and Engagement
EAT
                                                                                                                                                                                                                 2
Diets For a Better Future

Table of Contents
04 Foreword
05 Critical Points
06 Executive Summary

07 Food is Fundamental
12 Guiding The Food Choices we Make
18 Leading The Way
24 The Climate Impact – Food Emissions in the G20
27 Achieving Healthy Diets For All Within Planetary Boundaries
32 A Roadmap For Change
34 Critical Conclusions

35 Methodology Used in this Report
36 Scope and Limitations
37 Glossary And Country Abbreviations
38 Literature
39 About EAT
                                                                                      3
Diets For a Better Future

Foreword                             The future of the food system will be central in shaping the
                                     future of our planet and our civilization.

                                     First, let’s consider the environmental impacts of food. Most
                                                                                                            to the food system are needed, including protecting intact
                                                                                                            ecosystems, improving the sustainability of our farming practices,
                                                                                                            and addressing the tremendous levels of waste in the food system.

                                     people don’t realize it, but our food system and agricultural          But there is one crucial factor that can simultaneously improve our
                                     practices are major drivers of environmental degradation               health, our food security, and our environment at the same time –
                                     worldwide. Already, agricultural land use dominates about 40%          namely, changing our diets.
                                     of the Earth’s land surface and has been the principle driver of
                                     tropical deforestation, habitat loss and degradation, and global       Our dietary choices, especially how much conventionally-
                                     biodiversity loss. Agriculture is also the biggest consumer, and       produced red meat and dairy products we consume, can drive
                                     polluter, of the world’s water resources. Lakes, aquifers, rivers,     health and environmental outcomes across the entire food system.
                                     and even coastal oceans around the world have been disrupted by        Simply put, reducing the consumption of some foods, while
                                     human activities, notably food production. And the food system         increasing the consumption of others, could have tremendous
                                     contributes about 25% of the world’s greenhouse gas emissions,         benefits to the global environment and to human health.
                                     roughly comparable to the emissions resulting from the world’s
                                     production of electricity. In short, nothing else we do has come       This pioneering study by EAT examines how national dietary
                                     close to how food, agriculture, and land use are causing global        guidelines in G20 countries need to be shifted to improve human
                                     environmental harm. Without major changes, our food                    health and environmental outcomes in the food system. The
                                     system will continue to push Earth well beyond its planetary           results strongly indicate the need to change our views on diet and
                                     boundaries.                                                            consider both the human health and environmental sustainability
                                                                                                            implications while setting national food policies. This study helps
                                     Beyond these environmental concerns, the world’s current food          illustrate ways to build a better food system – promoting improved
                                     system also contributes to significant human failures. On the          food security and human health while reducing environmental
                                     one hand, a sizable fraction of the world still faces crippling food   impacts.
                                     insecurity and under-nutrition, while on the other hand, hundreds
                                     of millions of people face serious health challenges – including       In a world where climate change, biodiversity loss, food
   Dr. Jonathan Foley                obesity, diabetes, and heart disease – linked to unhealthy diets.      security, and diet-related illnesses are major concerns,
   Executive Director                                                                                       changing diets may be one of the single most effective
   PROJECTDRAWDOWN                   To address these environmental and social challenges, we must          things we can do to build a better future. And this study is a
   drawdown.org | @ProjectDrawdown   reboot and reimagine our global food system. Numerous changes          powerful reminder of how we can do it.
                                                                                                                                                                                      4
4
Critical                                                                                A shift toward healthy and

Points
                                                                                        sustainable diets should be a

                                                            2                                                                                        6
                                                                                        priority in all G20 countries.
                                                                                        Consumption of less healthy and less
                                                                                        sustainably produced “lose-lose” foods
                                                                                        is too high in most G20 countries, while
                                                                                        intake of healthier “win-win” foods is
                                                                                        consistently too low.
                                            Food is critical in our fight                                                           Following the current national
                                            against climate change and                                                              dietary guidelines of the G20
                                            requires leadership from the                                                            countries will not ensure global
                                            G20. The food we choose to eat,                                                         warming stays below 1.5°C.

                1                                                                                        5
                                            how much is lost or wasted and how                                                      Total food-related GHG emissions in
                                            it is produced will determine whether                                                   G20 countries currently account for
                                            we meet the Paris Agreement and                                                         approximately 75% of the carbon budget
                                            Sustainable Development Goals.                                                          for food, while adopting a healthy
                                                                                                                                    flexitarian diet would reduce this to
                                                                                                                                    approximately 40%.
Dietary choices in G20                                                                  Food-related per-capita
countries are destroying the                                                            emissions in G20 countries as a
planet. Global adoption of current                                                      whole need to be approximately
G20 food consumption patterns by                                                        halved by 2050. Doing so

                                                            3                                                                                        7
2050 would exceed the planetary
                                                                                        would ensure we can feed 10 billion
boundary for food-related GHG
                                                                                        people healthy diets within planetary
emissions by 263%. This would require
                                                                                        boundaries, and enable a more equitable
between one to seven Earths to support.
                                                                                        global distribution of food-related GHG
                                                                                        emissions.
                                          National dietary guidelines are                                                          The G20 countries have a variety
                                          an opportunity for policymakers                                                          of rich and vibrant diets and
                                          to support coherent food and                                                             culinary traditions that require
                                          agriculture priorities aligned                                                           different approaches and scales
                                          with the Paris Agreement and                                                             of intervention to achieve healthy
                                          Sustainable Development Goals.                                                           diets within planetary boundaries.
                                          The national dietary guidelines of G20                                                   Some countries would require more
                                          countries are inconsistent in their dietary                                              ambitious reductions in per-capita food-
                                          recommendations, and few integrate both                                                  related GHG emissions while others may
                                          health and environmental sustainability.                                                 require a slight increase.
Diets For a Better Future

Executive
                                                                  is possible but only with a significant reduction of animal     adopted globally over the coming decades, GHG emissions
                                                                  source foods in some countries (mainly G20 countries)           from food production will nearly double by 2050, largely
                                                                  and universal increase in healthy plant-based foods in          surpassing the “carbon budget” of 5.0 Gt CO2eq for

Summary
                                                                  our diets. Hence, shifting towards flexitarian diets, such      food. These projected consumption trends could trigger
                                                                  as the Planetary Health Diet, composed predominantly of         irreversible global “tipping-points” leading to catastrophic
                                                                  healthy plant-based foods, can optimize human health while      environmental damage and jeopardizing human civilization as
                                                                  reducing environmental impacts. Despite this, most food         we know it.
                                                                  consumption patterns in G20 countries are not aligned with
                                                                  those of a healthy flexitarian diet and most national dietary   At the same time much of the world’s population still faces
                                                                  guidelines (NDGs) are not ambitious enough to bring food        burdens of undernutrition, with more than 820 million people
                                                                  systems within planetary boundaries, including limiting         having insufficient food and many more consuming low-
The food we choose to eat, how much is lost or wasted,            global warming to 1.5°C. This is important because NDGs         quality diets. Given all of this, we need an unprecedented
and how it is produced will determine whether or not we           are a necessary component of food policy and an essential       effort to shift dietary patterns towards healthy and
meet the Paris Agreement and Sustainable Development              first step to promoting healthy eating habits in a country      sustainable food consumption and a global commitment
Goals (SDGs). Food systems must transition from being a           often through educational programs or public awareness          to reverse trends toward unhealthy diets in the rest of the
net source of GHG emissions to a net sink. Shifting toward        campaigns. If NDGs lack ambition or are incompatible            world. Transitions to healthy diets would decrease total global
healthy flexitarian diets is central to this goal. Despite        with the latest science on human health and environmental       food-related GHG emissions and enable more equitable
this, food consumption is rarely considered as a solution         sustainability, then this could influence national level food   distribution of these emissions within planetary boundaries.
by countries in meeting climate targets outlined by their         policy and individual food consumption.                         This would ensure that all countries can adequately address
Nationally Determined Contributions (NDCs). A large body                                                                          all forms of malnutrition while leaving our children a thriving
of evidence has shown that a diet rich in healthy plant-          Although there are significant differences in food              and healthy planet. Without leadership by the G20, the world
based foods and with fewer animal source foods (i.e. up to        consumption—within and between G20 countries—                   cannot achieve this critically important goal.
five servings of animal source foods per week) confers both       reflecting each country’s distinct food traditions and socio-
improved health and environmental benefits. Overall, this         economic circumstances, there is a common trend towards
literature indicates that such diets are “win-win” in that they   increased prevalence of unhealthy diets, characterized
are good for both people and planet.                              by overconsumption of red meat, dairy, sugar, and highly
                                                                  processed foods and under consumption of healthy foods.
The EAT-Lancet Commission on Food, Planet, Health                 This is leading to increasing rates of non-communicable
brought all of this evidence together and proposed scientific     diseases (NCDs) in these countries and at the global level,
targets for healthy diets and sustainable food systems. The       unhealthy diets now pose a greater risk to morbidity and
Commission concluded that achieving healthy diets from            mortality than does unsafe sex, and alcohol, drug, and
sustainable food systems for 10 billion people by 2050            tobacco use combined. If these consumption patterns are

                                                                                                                                                                                                         6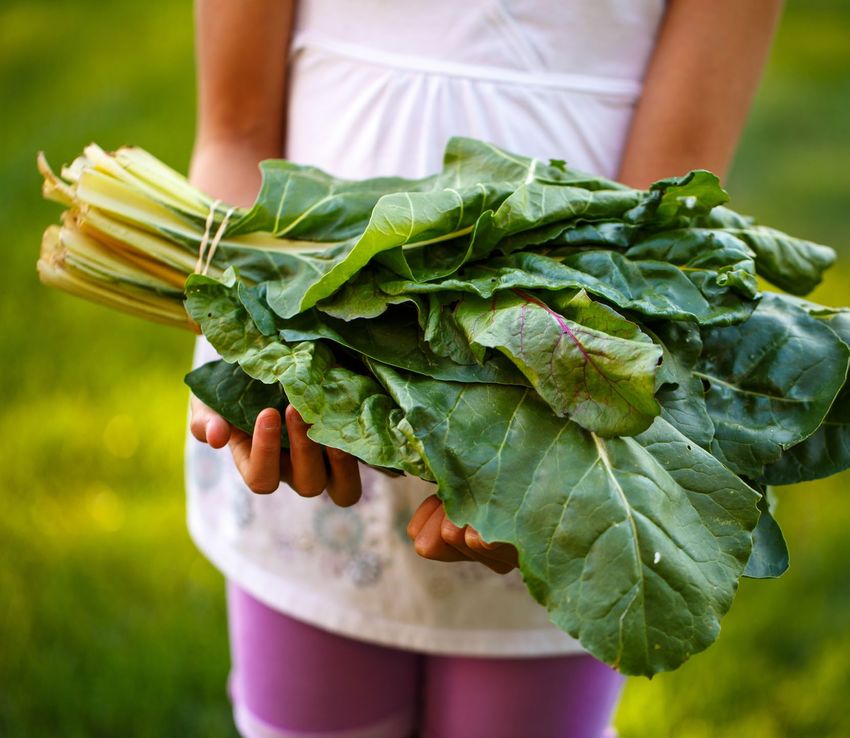
Diets For a Better Future

              Global food production is the single largest human pres-
              sure on Earth, threatening local ecosystems, driving a sixth
              mass extinction of species, and impacting the stability of
                                       ,,
              the entire Earth system.1 2 3 Feeding and producing food
              for our current population of 7.7 billion people accounts for
              approximately 12.5 Gt CO2eq or 24% of annual greenhouse
              gas (GHG) emissions (see Figure 1). Of this, 5.6 Gt CO2eq
              come mainly from livestock production and rotting food

Food is
              waste, while 6.9 Gt CO2eq come from rice production,
              agriculture practices, fertilizer use, land conversion and
                                                      ,
              deforestation mainly for agriculture.1 4 Despite the central
              role of food consumption and production as a major driver

Fundamental
              in the climate and biodiversity crises, food has so far not
              been considered central to global policy agendas such
              as the Paris Agreement, Sustainable Development Goals
              (SDGs), or Convention on Biological Diversity.

                                                                                    7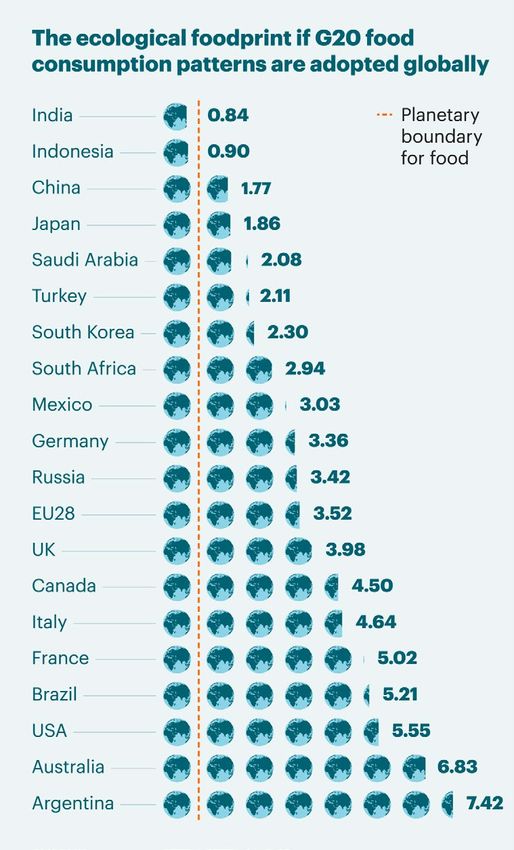
Food is Fundamental                                                                                                                                                                            Diets For a Better Future

     Although global food production of calories has kept                                                                      and reduce catastrophic impacts to human civilization.
     pace with population growth, approximately 820 million          Global Emissions by Sector                                Coupled with this evidence are rapidly growing bottom-
     people still lack sufficient food and many more consume                                                                   up movements demanding action on the Paris Agreement
     an unhealthy diet that contributes to premature death                           Buildings                                 and the biodiversity crisis.13 However, any actions taken
                      ,                                                                               Other
     and morbidity.5 6 Globally, obesity rates are soaring, as                       6%               10%                      on the climate emergency must move from incremental
     nearly 800 million people are considered obese (more                                                                      to exponential following a power law related to GHG
                                                                                                                                                                    ,
     than 2 billion when considering both overweight and                                                                       emissions, termed the Carbon Law.4 14 This roadmap
                                                                            Industry
     obese), and 40 million children under the age of five are              21%                                                outlines the exponential rate of change necessary to reduce
     overweight.7 This is mainly driven by a shift to less healthy                                                             emissions fast enough to limit warming to 1.5°C. According
                                                                                                                 Electricity
     foods, including diets increasingly dominated by refined                                                    25%           to the Carbon Law, emissions need to peak in 2020 and
     carbohydrates, sugars, and red and processed meats. This                                                                  halve every decade with decarbonization happening no
     unhealthy dietary pattern is leading to increasing rates of                                                               later than 2050 (Figure 2).
     non-communicable diseases (NCDs) and unhealthy diets             Transportation
     now pose a greater risk to morbidity and mortality than does     14%
     unsafe sex, and alcohol, drug, and tobacco use combined.8
                                                                                                 AFOLU
     Globally, this double burden of malnutrition is unequally                                   24%
     distributed with many G20 countries largely suffering from
     high rates of overweight and obesity (e.g. 72% of Americans,
     Australia 63%) while many non G20 countries suffering from                                                                  Figure 1.
     undernutrition, with global hunger rates increasing in recent   Agriculture          10%     Forestry and                   Agriculture, Forestry, and Land Use (AFOLU) account for nearly 24% of
            ,                                                                              5%     Land Use               14%     global GHG emissions. Without adequately integrating food consumption
     years.9 10                                                      Methane: Animals
                                                                                                                                 and production into national level decision-making, there is a low chance
                                                                     Nitrous Oxide:               Land Use Change,
                                                                                                                                 of achieving international policy agendas like the Paris Agreement and
                                                                     Fertilizers                  Forestry                9%
     Moving from incremental to exponential action                                                                               Sustainable Development Goals (SDGs). Agriculture, Forestry, and Land
     There is a growing body of scientific evidence for the          & Manure              4%     Other Food,                    Use are commonly grouped into a single sector called AFOLU but have
                                                                     Methane: Rice          1%    Agriculture,                   been separated into two sectors here to highlight the GHG gases (i.e.
     need to keep global warming to well below 2°C, aiming
                , ,                                                                               Land Use                5%     methane and nitrous oxide) we focus on in this report. Data: IPCC WG3
     for 1.5°C.1 11 12 These are the global temperature limits                                                                   FAR Image: Jonathan Foley, Drawdown.org.
     necessary to maintain the stability of the Earth system

                                                                                                                                                                                                                    8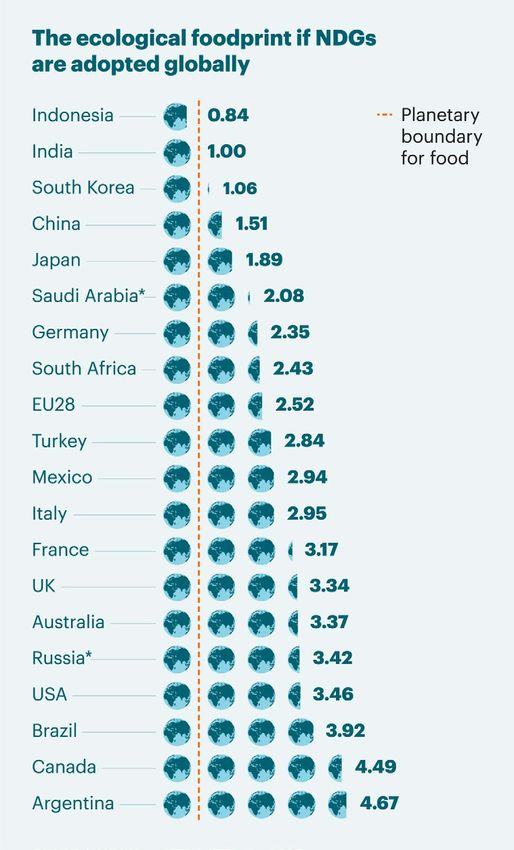
Food is Fundamental                                                                                                                                                      Diets For a Better Future

                                                                                                                       A 'carbon budget' for food
          Roadmap to 1.5°C                                                                                             Of the sectors outlined in Figures 1 and 2, food is unique.
                                                                                                                       Unique in that it is not feasible to reduce emissions to near
                              Reaching Negative             Electricity                                                zero by 2050. This is due to the fact that the biological
                              Emissions in 2039             Agriculture                                                processes that produce emissions for food production are
                                                            Forestry and Land Use                                      intrinsic to crop (i.e. nitrous oxide from fertilizer use) and
                                            Gt CO2eq        Transport                                                  livestock production (i.e. methane from ruminants – see
                                                  50        Industry                                                   Figure 1) and therefore some amount of GHGs will always
                                                            Buildings                                                  be generated by food production practices. While we
                                                  40        Other                                                      can and must set high ambitions for anthropogenic GHG
                                                            Nature Based Sinks                                         emissions reductions, we cannot expect to fully eliminate
                                                  30     Figure 2.                                                     all GHG emissions (i.e methane and nitrous oxide) related
                                                         Total global emissions projections, showing the exponential   to food production.2 Given this, the EAT-Lancet Commission
                                                         decreases necessary to keep global warming to 1.5°C,
                                                                                                                       proposed a scientific target for GHG emissions from food
                                                         across major contributing sectors. The orange and light
                                                  20                                                                   production, which they assessed as both necessary and
                                                         green sectors are emissions from agriculture, forestry
                                                         and land use mainly for food production (e.g. clearing of     hard to reduce further to achieve both healthy diets for
                                                   10    tropical forests for livestock and agriculture). Emissions    nearly 10 billion people and the Paris Agreement by 2050.
                                                         in all sectors, except for agriculture, must peak in 2020
                                                                                                                       The Commission set the upper boundary of emissions from
                                                         and rapidly decrease, halving every decade until 2050.
                                                     0   Emissions from agriculture must reduce to at least 5.0 Gt     food at 5.0 Gt CO2eq, which we also adopt as the boundary
                                                         CO2eq, but reducing even further below this boundary may      or maximum allowable “carbon budget” in this analysis.
                                                         be difficult to achieve while feeding 10 billion people by
                                                  −10    2050. We offer the term “carbon budget” to describe this
                                                         5.0 Gt CO2eq planetary boundary for food. In addition to
                                                         rapid decarbonization, we must also begin storing massive
                                                  −20    amounts of carbon dioxide in nature based sinks (dark
                                                         green in figure). Figure adapted from Willett, Rockstrom,
                                                         Loken, et al. (2019).2
         2020          2030   2040            2050

                                                                                                                                                                                              9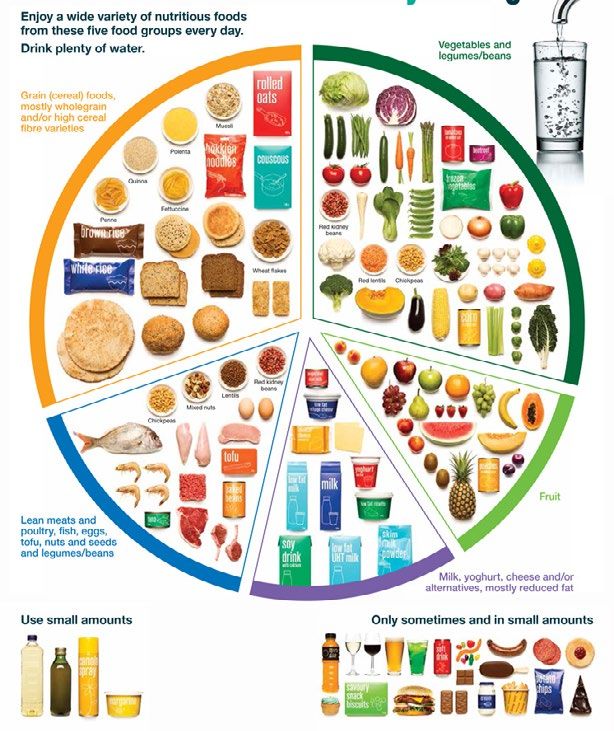
Food is Fundamental                                                                                                                                                                   Diets For a Better Future

     Food is also unique in that it can go
     from being a large part of the climate                         Emissions gap
                                                                    from food production
     change problem to being one of the                                                                                    Gt CO2eq
     most important solutions by driving                                                                                          10
     change in the agriculture, forestry                                                                                    9.8

     and land-use sector.                                                                                                         9

                                                                                                                                  8
                                                                              Business As Usual
     This is possible because these natural systems are both                                                                       7
     sources and very large sinks for carbon (see Figure 2). With
     changes in how and where we produce food and what we                                Healthy and Sustainable Diets +          6
     eat, we can both reduce GHG emissions and use forests,           5.6                Reduced Food Loss and Waste
                                                              ,                                                                   5
     croplands, pastures and peatlands to sequester carbon.1 2                                                              5.0
                                                                    Planetary boundary for food
                                                                                                                                  4    Figure 3.
     However, current food consumption trajectories and                                                                                If we follow a business as usual approach, GHG emissions
     estimated growth of another 2 billion people on the planet                                                                        from food production are projected to rise to 9.8 Gt
                                                                                                                                  3
     by 2050 will largely exceed food’s maximum allowable                                                                              CO2eq. A shift toward healthy flexitarian diets (such as
                                                                                                                                       the Planetary Health Diet) in G20 countries and halving
     “carbon budget”. Behaviorial changes associated with                                                                         2    in food loss and waste can help prevent this gap. To
     rising incomes and urbanization are driving a global dietary                                                                      achieve the Paris Agreement, global emissions from food
     transition in which traditional diets are being replaced by                                                                   1   consumption must not be greater than 5.0 Gt CO2eq

     more homogenous diets higher in animal source foods.8 If                                                                          by 2050. Figure adapted from Exponential Roadmap
                                                                                                                                       (2019).4
     this trend is not broken and reversed, emissions from food                                                                   0
     production will nearly double by 20502 (Figure 3).              2020              2030               2040             2050
                                                                                                  Year

                                                                                                                                                                                                           10
Food is Fundamental Diets For a Better Future
Some foods are "win-win" others are "lose-lose"
Health and environmental A large body of evidence has demonstrated that
impacts of various foods overconsumption of red and processed meat, saturated
Environmental impact fats, and (to a lesser degree) dairy products, are linked to
High increased risk for certain types of preventable diseases
Emphasized foods
(e.g. cancers and heart disease).2 In tandem, a large body
Optional foods
Unprocessed of work has emerged on the environmental impacts of
Limited foods red meat various diets, with most studies concluding that a diet rich
in healthy plant-based foods and with fewer animal source
Processed foods confers both improved health and environmental
red meat
Chicken Fish benefits.15, 16, 17 Overall, this literature indicates that such
diets are “win-win” in that they are good for both people
Dairy and planet (Figure 4). The EAT-Lancet Commission on Food,
Health impact Planet, Health brought all of this evidence together and
Low High proposed scientific targets for healthy diets and sustainable
Nuts Legumes food systems and concluded that achieving healthy diets
Figure 4.
The health and environmental impacts
from sustainable food systems for 10 billion people by 2050
Olive oil Eggs
of various foods. Overconsumption of is possible, but only through an unprecedented global
red and processed meats increases Whole grains transformation of the food system that includes a significant
the risk to both human health and the
reduction of animal source foods in countries where they
environment. Plant foods tend to be Potatoes Refined grains
good for both people and planet. Added Fruits are over consumed, along with a halving of food loss and
sugar is a major driver of poor health but Vegetables waste and significant changes in food production practices.
has much lower environmental impacts.
Added sugar
Source: Clark et al. (2019).17
Low
11Diets For a Better Future
National dietary guidelines (NDGs) are key tools for
changing food systems. NDGs are public, government-
endorsed documents that are intended to provide
generalizable recommendations and advice on healthy diets
Guiding the
and lifestyles.18 They are a key component of public health
policy and an essential first step to promoting healthy eating
habits in a country, often through educational programs
or public awareness campaigns.19 Typically, NDGs set
Food Choices
guidance on the individual foods people should be eating
to maintain and improve good health and can provide either
quantitative recommendations by food groups or more
We Make
general qualitative advice of overall diet.20 Given that NDGs
are a key component of national public health policy and
used to educate the general public, aligning NDGs with
the latest scientific evidence on human health is critical for
promoting public health. Additionally, these guidelines are
increasingly understood as an important opportunity to flag
the climate implications of dietary choices.
12Guiding The Food Choices We Make Diets For a Better Future
The current state of National Dietary Guidelines
Globally, more than 100 countries have developed or are
developing NDGs.20 They are, however largely absent for
low- and middle-income countries.8 Broadly speaking, NDGs
encourage higher consumption of fruits and vegetables
and lower consumption of sugar and salt – trends that are
highly compatible with international guidelines and healthy
flexitarian diets such as the Planetary Health Diet. Less than National Dietary Guidelines of Canada National Dietary Guidelines of China
25% of NDGs recommend reducing or moderating meat
intake and few countries make specific recommendations
for whole grain consumption.8
Many NDGs, however, are taking significant steps to
promote healthy plant-based diets. Canada recently
launched a food guide (see Figure 5) with the words “Eat
Well. Live Well.” across the top of their guidelines. Their
recommendations are to: have plenty of vegetables
and fruits (half of the plate), eat protein foods (quarter
of the plate), choose whole-grain foods (quarter of the
plate), and make water the drink of choice. The “guide
emphasizes getting protein from plant-based sources such
as beans, lentils and nuts, rather than always choosing
animal-based foods such as milk, meat and poultry.”21
The new Chinese guidelines recommend to “eat a variety
of foods, with cereals as the staple; balance eating and
exercise to maintain a healthy body weight; consume
plenty of vegetables, milk, and soybeans; and consume an
appropriate amount of fish, poultry, eggs, and lean meat.”20
13Guiding The Food Choices We Make Diets For a Better Future
Many other countries offer similar recommendations, all
of which are encouraging signs that NDGs are becoming National Dietary Guidelines of Australia National Dietary Guidelines of Indonesia
more closely aligned with the latest science on foods that
optimize human health.
Some NDGs offer only qualitative recommendations*
that are broadly in line with WHO guidance on healthy
diets.22 This approach can make monitoring progress
toward meeting targets more difficult. This also applies
to the WHO dietary recommendations which provide
few concrete intake values or ranges and do not provide
quantitative recommendations on red meat, dairy and sugar
consumption.22 Quantified targets can be useful because
they can help ensure NDGs are in line with the latest science
on foods that optimize human health. In addition, targets
assist with monitoring global and national progress toward
health and environmental outcomes including the SDGs,
Paris Agreement, and the Global NCD Action Plan.23
For those countries that do offer quantified recommen-
dations, there is a wide range of daily intake values for
distinct food groups. An analysis24 of NDGs for G20
countries used in this report found, for example, that
recommended levels of red meat consumption varied from
*Some countries may decide to not offer quantitative targets because these will
35 g/day to approximately 70 g/day, vegetable consumption vary substantially depending on body size and physical activity. For this analysis,
Figure 5.
from approximately 200 g/day to 400 g/day, and dairy however, quantified targets were needed to compare consumption patterns and
Visual representations of the dietary guidelines in Canada, China,
consumption (in milk equivalents) from 200 g/day to over GHG emissions and every effort was made to translate all targets into comparable
Australia, and Indonesia demonstrating a breadth of recommendations
quantified targets. When this was not possible (e.g. Canada), then NDG targets
1000 g/day. This wide variation of recommended intake and communication styles. Source FAO (2019).20
were aligned with current consumption levels. This assumption could have
levels can have large impacts on both human health and an impact in accurately assessing NDG targets in countries that do not offer
environmental sustainability. quantified targets.
14Guiding The Food Choices We Make Diets For a Better Future
Are consumption patterns in
G20 countries aligned with their NDGs?
0
guidelines achieved
1
guideline achieved
2
guidelines achieved
3+
guidelines achieved
G20 Countries G20 Countries G20 Countries
Argentina France Australia
Brazil India China
Canada Italy Indonesia
Integrating environmental sustainability into NDGs Germany South Korea
Japan EU28 Turkey
Very few countries explicitly mention or incorporate
Mexico Austria
environmental sustainability into NDGs.8, 19 Sweden, Brazil, South Africa Belgium EU28
Germany, and Canada are a few of the countries that have United Kingdom Croatia Malta
mentioned climate considerations and the relative impact USA France Spain
Greece
of various food groups. Of these countries, Sweden and EU28 Italy
Brazil have the most embedded message on environmental Bulgaria Lithuania
sustainability, yet their NDGs are not necessarily more Cyprus Luxembourg
Czech Republic Netherlands
climate-friendly than other NDGs. Integrating the health Denmark Romania
and climate action messages is critical to offer citizens a full Estonia Slovenia Figure 6.
understanding of the implications of their diet, given that Finland G20 countries current
Hungary
certain foods, such as red meat and dairy, have much higher Ireland
consumption patterns vs. their
NDG recommendations. No
climate impacts (see Figure 4). Countries that recommend Latvia
countries currently meet at least
higher levels of red meat and dairy consumption may also Poland
three of the recommendations in
Portugal
be inadvertently causing increased levels of GHG emissions. Slovakia their NDGs, while a few meet at last
Even slightly higher recommendations in red meat (from 100 Sweden one or two recommendations. Data
Switzerland from Springmann et al. (2020).24
g/week to 300 g/week) and dairy consumption (from 250g/
day to 500g/day) will increase GHG emissions from the
agricultural sector by nearly 50%, well above the planetary
boundary for food.2
15Guiding The Food Choices We Make Diets For a Better Future
Need for consensus on what is healthy and sustainable
The differences in NDGs outlined above highlights the
imperative for broader scientific consensus on what defines
a healthy and sustainable diet to help ensure that both the
Paris Agreement and SDGs are achieved. A healthy diet
should optimize human health while a sustainable diet
should be produced within the planetary boundaries. For
the analysis completed in this report24 we are adopting
the Planetary Health Diet put forth by the EAT-Lancet
Commission and using the global GHG boundary of 5 Gt
CO2eq for food production, which is consistent with keeping
temperature increases to 1.5°C (Figure 7). We adopt this diet
because, when considering the ranges of this diet outlined
in Figure 7, this healthy flexitarian diet can be adapted to
the multitude of culinary traditions around the world. In
addition, adoption of the Planetary Health Diet would also
help to alleviate all forms of malnutrition.
The food groups in the Planetary Health Diet, which is
based on a 2500 kcal/day diet, can be divided into three
categories: emphasized foods which should form the bulk
of one’s diet; limited foods which could form a moderate
portion of one’s diet and; optional foods which are not
necessary and if consumed should form the smallest portion
of one’s diet. The food groups in each category are listed
below. For more information on the health impacts of each
food, please see the EAT-Lancet report.2
16Guiding The Food Choices We Make Diets For a Better Future
The Planetary Health Diet
s
ain
gr
le
ho
W
b les
eta
eg
hyv
c
S tar
d s
a i r y foo
D
n
Animal sourced protei
Pla
nt s
our
ced
pro
tein
Un
s
atu
rat
ed
Added sugars
pla
nt
oils
Figure 7.
The Planetary Health Diet by intake
values and ranges for major food
groups, visually represented by
relative proportion of these foods
on a plate. Figures adapted from
Willett, Rockström, Loken, et al.
(2019).2 Click for more information.
17Diets For a Better Future
The G20 countries consists of 19 countries plus the
Leading
European Union (EU28). Collectively, the G20 economies
account for around 90% of gross world product, 80% of
world trade, "two thirds" of the global population, and
the Way
approximately half of the global land area.25 Given their
influence, the G20 countries presents a unique “win-win”
opportunity for a shift toward healthy flexitarian diets, such
as the Planetary Health Diet, to improve the overall health of
a majority of the global population while decreasing GHG
emissions from food consumption in line with a 1.5°C world.
A full analysis of food polices in all G20 countries is beyond
the scope of this report and therefore we are using NDGs as
an important starting point to determine if current policies
are ambitious enough to keep warming to 1.5°C.
18Leading the Way Diets For a Better Future
Current consumption and NDGs for
G20 countries compared to optimal intake Current Consumption
National Dietary Guidelines
Planetary Health Diet
% above or below the optimal intake level
600%
Food consumption patterns in G20 countries 500%
Despite significant variations when it comes to food
consumption patterns across the G20 countries, there
are some important shared characteristics. With a few 400%
exceptions, food consumption patterns across these
countries are characterized by an overconsumption of
limited and optional foods. Across all countries, there 300%
is universal underconsumption of emphasized foods.
Furthermore, NDGs for emphasized foods are roughly in
200%
line (except for nuts and legumes) with the Planetary Health
Diet, whereas most NDGs recommend higher consumption
of optional and limited intake foods compared to the 100%
Planetary Health Diet (Figure 8).
0%
Figure 8
Total average consumption* patterns and NDG recommendations for
the G20 compared to optimal intake levels outlined in the Planetary
Health Diet. Data from Springmann et al. (2020).24
Nuts Legumes Fruit Vegetables Fish Poultry Dairy Eggs Sugar Red
meat
*For the analysis in this report, whole grain and starchy vegetable
Emphasized foods Optional foods Limited foods
consumption are not shown due to lack of sufficient data across all
countries. Data on root vegetables was used to attain calorie balance
in the analysis.
19Diets For a Better Future
G20 consumption patterns and NDG recommendations by food groups
Re
Meat Fruit Legumes
Both current consumption and NDG recommended intake Fruit recommendations in most G20 countries are at or NDG recommendations for legumes is at or above the
of red meat in most G20 countries are above intake levels to above the optimal intake level of 200 g/day in the Planetary Health Diet optimal intake level of 75 g/day in only
optimize human health (Figure 9), and more than half of the Planetary Health Diet, but current consumption is below five countries, and current consumption is far below this
countries have current consumption patterns between three this level in all countries except Brazil, Turkey, Canada, intake level in all G20 countries (Figure 13). However, most
to five times the maximum optimal intake value of 28 g/day Italy, and France (Figure 11). Most countries provide countries provide recommendations that fall within the
in the Planetary Health Diet. recommendations within the optimal intake range of 100 to optimal intake range of 0 to 100 g/day.
300 g/day.
Dairy Vegetables Nuts
Dairy consumption is slightly more aligned intake levels to All countries, with the exception of Brazil*, France* and Nut consumption data shows the greatest deviation from
optimize human health with half of the countries providing UK*, have recommendations for vegetable consumption the Planetary Health Diet optimal intake level of 50 g/day,
recommendations that fall within the intake range of 0 to that
Re
are within optimal intake range of the Planetary Health with both NDGs recommendations and consumption well
500 g/day. However, only Japan and South Africa have Diet (200-600 g/day) although consumption levels in all below this intake level (Figure 14). However, all countries
recommendations that are at or below the 250g/day optimal countries are below this optimal intake range except for provide NDG recommendations that fall within the optimal
intake level, whereas China and India are just slightly above Turkey, EU28, Italy, USA, South Korea, and China (Figure 12). intake range of 0 to 75 g/day.
(Figure 10).
*Some countries may decide to not offer quantitative targets because these will vary substantially depending on body size and physical activity. For this analysis,
however, quantified targets were needed to compare consumption patterns and GHG emissions and every effort was made to translate all targets into comparable
quantified targets. When this was not possible (e.g. Canada), then NDG targets were aligned with current consumption levels. This assumption could have an impact in
accurately assessing NDG targets in countries that currently do not offer quantified targets.
20Leading the Way Diets For a Better Future
Figure 9.
Red meat Current red meat consumption in each G20 country com-
grams/day
pared to individual country NDGs and the Planetary Health
160 Diet (orange dashed line represents optimal red meat intake
140 level of 14 g/day with optimal intake range of 0 to 28 g/day
shown in unshaded area). Outside optimal intake range rep-
120
resents increased risk to human heath and the environment.
100 Data from Springmann et al. (2020).24
Increased risk
80
60
40
Optimal 20
intake range:
0
0–28g
Current Consumption
ZAF
KOR
ARG
IND
ITA
JPN
MEX
TUR
USA
RUS
SAU
AUS
BRA
CAN
CHN
DEU
EU28
FRA
GBR
IDN
National Dietary Guidelines
G20 Countries Planetary Health Diet
Figure 10.
Dairy Current dairy consumption* in each G20 country compared
grams/day
to individual country NDGs and Planetary Health Diet (orange
1,500 dashed line represents optimal dairy intake level of 250 g/day
with optimal intake range of 0 to 500 g/day shown in unshad-
1,250 ed area). Outside optimal intake range represents increased
1,000 risk to human health and the environment. Data from Spring-
Increased risk mann et al. (2020).24
750
*Dairy consumption is represented in milk equivalents. Some
500 dairy products, such as cheese, use a large amount of milk
Optimal to make the product (e.g. 50g cheese = approximately 500g
intake range: 250
milk) and therefore have a higher emissions footprint.
0–500g 0
Current Consumption
ARG
AUS
BRA
CAN
CHN
TUR
USA
ZAF
DEU
EU28
FRA
GBR
IDN
KOR
IND
ITA
JPN
MEX
RUS
SAU
National Dietary Guidelines
G20 Countries Planetary Health Diet
21Leading the Way Diets For a Better Future
Figure 11.
Fruit Current fruit consumption in each G20 country compared to
grams/day
individual country NDGs and Planetary Health Diet (orange
400 dashed line represents optimal fruit intake level of 200 g/
day with optimal intake range of 100 to 300 g/day shown in
unshaded area). Data from Springmann et al. (2020).24
300
Optimal
intake range: 200
100–300g
100
0
Current Consumption
ARG
AUS
BRA
CAN
CHN
ZAF
DEU
EU28
FRA
MEX
TUR
USA
GBR
IDN
IND
ITA
JPN
KOR
RUS
SAU
National Dietary Guidelines
G20 Countries Planetary Health Diet
Figure 12.
Vegetables Current vegetable consumption in each G20 country
grams/day
compared to individual country NDGs and Planetary Health
700 Diet (orange dashed line represents optimal vegetable intake
600 level of 300 g/day with optimal intake range of 200 to 600 g/
day shown in unshaded area). Data from Springmann et al.
500 (2020).24
Optimal
intake range: 400
200–600g 300
200
100
0
Current Consumption
ARG
AUS
BRA
CAN
CHN
TUR
USA
ZAF
DEU
EU28
FRA
GBR
IDN
IND
ITA
JPN
KOR
MEX
RUS
SAU
National Dietary Guidelines
G20 Countries Planetary Health Diet
22Leading the Way Diets For a Better Future
Figure 13.
Legumes Current legume consumption in each G20 country
grams/day
compared to individual country NDGs and Planetary Health
225 Diet (orange dashed line represents optimal legume intake
200 level of 75 g/day with optimal intake range of 0 to 100 g/
175 day shown in unshaded area). Data from Springmann et al.
150 (2020).24
125
100
Optimal 75
intake range: 50
0–100g 25
0
Current Consumption
ARG
AUS
BRA
CAN
CHN
DEU
EU28
FRA
KOR
TUR
USA
ZAF
GBR
IDN
IND
ITA
JPN
MEX
RUS
SAU
National Dietary Guidelines
G20 Countries Planetary Health Diet
Figure 14.
Nuts Current nut consumption in each G20 country compared to
grams/day
individual country NDGs and Planetary Health Diet (orange
100 dashed line represents optimal nut intake level of 50 g/day
with optimal intake range of 0 to 75 g/day shown in unshaded
80 area). Data from Springmann et al. (2020).24
60
Optimal
40
intake range:
0–75g 20
0
Current Consumption
ARG
AUS
BRA
CAN
CHN
USA
ZAF
DEU
EU28
FRA
KOR
MEX
TUR
GBR
IDN
IND
ITA
JPN
RUS
SAU
National Dietary Guidelines
G20 Countries Planetary Health Diet
23Diets For a Better Future
The Climate
Impact – Food
Food-related GHG emissions in each G20 country can be
seen in Figure 15 below. Total emissions in G20 countries
are approximately 3.7 Gt CO2eq of a total 5.6 Gt CO2eq or
Emissions in
66% of current total global food-related GHG emissions.
These emissions are driven both by total population in
each country and individual food consumption patterns.
the G20
Currently, the top five most populous countries in the
G20 (excluding the EU28) are China, India, United States,
Indonesia, and Brazil, which are also the countries with the
highest total GHG emissions from food production.26
24The Climate Impact – Food Emissions in the G20 Diets For a Better Future
Potential of reducing emissions from
food consumption patterns in G20 countries
↓ Current consumption ↓ If NDGs are followed ↓ If the Planetary Health
Diet is followed
Food consumption patterns that align with current NDGs Current Emissions:
would reduce total GHG emissions for most G20 countries. 5.6 Gt CO2eq
If NDGs are universally followed in each country, GHG Rest of the World Planetary boundary for food: Planetary boundary for food:
emissions would be reduced by approximately 19%, while 1.9 Gt CO2eq 5.0 Gt CO2eq 5.0 Gt CO2eq
adopting the Planetary Health Diet would reduce food
Rest of the World Rest of the World
related emissions in G20 countries by nearly 46%. These 2.0 Gt CO2eq 3.0 Gt CO2eq
reductions are mainly achieved through reductions in red
meat and dairy consumption. However, adoption of NDGs
or the Planetary Health Diet does not reduce GHG emissions
in all countries. India and Indonesia would see their total
G20
food-related GHG emissions increase slightly if either 3.7 Gt CO2eq
was adopted in each country. This is most likely because
both countries still face burdens of under-nutrition27, 28 and G20
adoption of either the NDGs or the Planetary Health Diet 3.0 Gt CO2eq
would result in increased consumption of nearly all food China India
groups including red meat and dairy. 1,078 573
G20
China India
918 632 2.0 Gt CO2eq
Figure 15.
Total food-related GHG emissions in G20 countries vs the Rest of the Brazil USA EU28
World; all figures are Gt C02eq. Current consumption patterns globally 426 316 259 USA Argentina
195
Japan
62 59
UK
55 India China
exceed the planetary boundary for food by 0.6 Gt CO2 eq while following 592 572
Brazil
Indonesia
Mexico Australia France
142
either NDGs or the Planetary Health Diet could reduce emissions to 101 96 73
314 Germany France Canada USA Mexico Japan
Germany
Turkey
within the 5.0 Gt CO2eq boundary, with various GHG distribution
Japan
EU28 47 47 42 84 33 31 24
Russia UK 59 South Korea Indonesia Argentina
142 66
South Africa 191 Australia
236 EU28 UK France Italy Australia
scenarios presented. Data from Springmann et al. (2020).24
Italy 38 20 19 17
Indonesia
34 33 15
79 South Africa
51 South Africa
Mexico South Korea
Turkey
Argentina Turkey Brazil 14 13 13
192
Germany 26 Italy 35 27 Russia
Canada Saudi Arabia
107 64 42 19 Saudi Arabia 91 36 15 South Korea 92 52 14 13 11 Canada
25The Climate Impact – Food Emissions in the G20 Diets For a Better Future
Per capita GHG emissions from food Current Consumption
consumption patterns in G20 countries National Dietary Guidelines
AUS AUS
ARG ARG
BRA BRA
CAN CAN
FRA FRA
Per capita GHG emissions GBR GBR
Per capita emissions tell a different story, with Australia, USA USA
Argentina, Canada, and France having the highest per RUS RUS* Nil
capita food-related GHG emissions of G20 countries,
MEX MEX
while China and India some of the lowest. Again, NDGs
ITA ITA
and the Planetary Health Diet decrease per capita emissions
in all countries with the exceptions of both India and CHN CHN
Indonesia, where per capita emissions rise slightly when DEU DEU
compared with baseline emission levels (Figure 16). KOR KOR
SAU SAU* Nil
ZAF ZAF
Figure 16.
IDN IDN
Per capita emissions in each G20 country for current consumption
patterns and if national dietary guidelines (NDGs) are followed. The EU28 EU28
orange dashed line represents the 5.0 Gt global planetary boundary for
IND IND
food consumption translated into a per capita planetary boundary for
food consumption. It is difficult to propose a single per capita boundary JPN JPN
for food consumption because the actual per capita boundary would TUR TUR
vary depending on local conditions. However, this exercise allows us
to see roughly the level of ambition needed in each country to ensure
food-related emissions are compatible with a 1.5ºC world. Data from 0 1 2 3 4 0 1 2 3 4
Springmann et al. (2020).24
Planetary boundary Emissions in tCO2eq Planetary boundary Emissions in tCO2eq
*NDGs are not available in these countries. for food for food
26Diets For a Better Future
In addition to setting scientific targets for healthy diets
and sustainable food production, the EAT-Lancet
Achieving Healthy
Commission sought to determine if it was possible to
achieve these targets while feeding 10 billion people. In
short, the answer is yes, but just barely. Feeding 10 billion
people a healthy flexitarian diet (e.g. Planetary Health Diet)
Diets for All
within the 5 Gt CO2eq GHG planetary boundary for food
production requires a theoretically near universal adoption
of healthy diets across the globe by 2050, improvements in
Within Planetary
technology and management at the farm level and halving
food loss and waste.
In the previous section we assessed food consumption
Boundaries
in G20 countries. In this section we use these results to
draw insights on the global implications of current food
consumption patterns in G20 countries and how the
5 Gt CO2eq food budget may need to be more equitably
distributed to achieve healthy diets for all.
27Achieving Healthy Diets for All Within Planetary Boundaries Diets For a Better Future
Numerous studies in recent months have demonstrated that Reducing emissions to within
a shift toward healthy diets, such as the Planetary Health
Diet, is the single greatest lever for reducing food related
the planetary climate boundary
GHG emissions.1, 2, 4, 17 The Exponential Roadmap4 report for food can be accomplished by
built upon this growing body of scientific evidence and preventing an unhealthy dietary
outlined specific solutions to halve current levels of global
transition in many parts of world
GHG emissions by 2030. For food consumption, achieving
this required different approaches for G20 countries than and implementing ambitious dietary
for the rest of the world. First, a rapid rise in food-related shifts in G20 countries with at
emissions (from 5.6 to 6.8 Gt by 2030) must be prevented
least 40% of the global population
by reversing shifts in many developing countries towards
unhealthy “Western” diets. Second, countries with high adopting healthy diets by 2030
food-related emissions (i.e. many of the G20 countries) must and 75% by 2050. This dietary shift
rapidly adopt healthy flexitarian diets, such as the Planetary
must also be coupled with efforts to
Health Diet. When these approaches are coupled with a
50% reduction in food loss and waste, global food-related reduce food loss and waste by 50%.
emissions can be brought within the planetary climate
boundary for food by 2050 (see Figure 3).
28Achieving Healthy Diets for All Within Planetary Boundaries Diets For a Better Future
An unsustainable path
Projected food-related GHG emissions if The previous section highlighted that current food
G20 consumption patterns are adopted globally consumption patterns in G20 countries could be more
healthy and sustainanble, and largely trending in the wrong
↓ Current consumption ↓ If NDGs were followed ↓ If the Planetary Health direction. If these trends continue within and beyond the
Diet was followed G20 countries, food-related GHG emissions
will exceed the 5 Gt CO2eq climate boundary for food by
% above or below the planetary boundary for food approximately 263% by 2050 (Figure 17). The majority
of these emissions in G20 countries arises from an
300%
overconsumption of limited intake and optional foods
in nearly every country, trends that are also on the rise
+263% elsewhere. However, even if the NDGs of G20 countries
are adopted globally, the planetary climate boundary for
200%
food would still be exceeded by approximately 178%. This
+178% highlights that current NDGs are not ambitious enough to
keep total global warming to 1.5ºC.
100%
Global adoption of the Planetary Health
Diet would decrease emissions to within
the planetary GHG boundary for food
0% Planetary
–1% boundary but requires near universal adoption
for food
(Figure 17).
50%
When coupled with a 50% reduction in food loss and waste,
Figure 17. a 75% global adoption of the Planetary Health Diet would
The projected impact on food-related GHG emissions by 2050 if either current
reduce emissions within the global boundary for food
consumption patterns or NDGs of G20 countries are adopted globally and if a
local adaptation of the Planetary Health Diet is adopted in all countries. Each case (Figure 17). However, when significant changes in food
assumes improvements in technology and management at the farm level, as well production are combined with a dietary shift and halving of
as reductions in food loss and waste see Springmann et al. (2018).29 The orange food loss and waste, there is evidence that we can produce
dashed line represents the planetary climate boundary for food. Data from
food for 10 billion people within all planetary boundaries
Springmann et al. (2020).24
(i.e. climate, land-use, water, nitrogen, phosphorus, and
biodiversity loss) for food.2
29Achieving Healthy Diets for All Within Planetary Boundaries Diets For a Better Future
Scenarios of a more equitable distribution
of the global carbon budget for food
Unbalanced global consumption of food
Currently the food systems in G20 countries are emitting
↓ Current consumption ↓ If NDGs are followed ↓ If the Planetary Health
approximately 3.7 Gt CO2eq, nearly 75% of the total global Diet is followed
carbon budget for food. The grand challenge facing
Current Emissions:
humanity is how we will sustainably feed healthy diets to
5.6 Gt CO2eq
nearly 10 billion people by 2050 and do this within the
planetary boundary for food-related GHG emissions, a Planetary boundary for food: Planetary boundary for food:
boundary we are already exceeding by 12% (see Figure 18). 5.0 Gt CO2eq 5.0 Gt CO2eq
The majority of the projected population increase will take
place in developing countries,30 many of which are facing
high rates of malnutrition with nearly 820 million people
currently suffering from hunger and hundreds of millions Rest of the World
from stunting and wasting.2 34%
Rest of the World
40%
19%
reduction
Figure 18. Rest of the World
Scenarios of current and future distributions of total global food- 61%
related emissions. Currently, G20 countries are consuming the
majority of the total global carbon budget for food. However, adoption Additional
of the Planetary Health Diet in G20 countries will help to more 28%
equitably balance the total global carbon budget for food especially reduction
as population grows in non G20 countries. The orange dashed line
represents the 5 Gt CO2eq planetary climate boundary for food
production, which is currently exceeded by approximately 12%. Data
from Springmann et al. (2020).24
G20 G20 G20
66% 60% 39%
30Achieving Healthy Diets for All Within Planetary Boundaries Diets For a Better Future
Central to solving this dilemma is a more equitable growth.31 A recent analysis by Gerten (et al. 2020) showed
distribution of the global carbon budget for food to enable that it is possible to feed 10 billion people within planetary
all countries to alleviate all forms of malnutrition, while boundaries but only with a transformation toward more
keeping total food-related GHG emissions within the sustainable production and consumption patterns. However,
planetary climate boundary for food (Figure 18). To do this ensuring healthy and sustainable diets to everyone on the
we need to lower total global food related emissions from planet becomes increasingly unlikely past this population
5.6 Gt CO2eq to at least 5.0 CO2eq by rapidly shifting diets in threshold.32
G20 countries to healthy and sustainable diets that are more
ambitious than those currently proposed by NDGs. This A "win-win" solution for people and planet
would require an on average approximate halving of current Rebalancing the global distribution of food emissions as
per capita GHG emissions in G20 countries. In addition, we outlined in Figure 18 would not only keep total global food
need to work to ensure that unhealthy diets are not adopted related emissions within the planetary climate boundary
in parts of the world where current consumption aligns for food but would also have the co-benefit of improving
more closely with healthy flexitarian diets. Overconsumption and saving lives. The EAT-Lancet Commission showed
of red meat, highly processed foods, and sugar in these that adopting the Planetary Health Diet would save
countries will not only result in higher incident of poor approximately 11 million lives per year.2 Current NDGs in G20
health, but also in a nearly doubling of current food-related countries are not ambitious enough to meet climate goals
GHG emissions. but they will help countries make progress toward achieving
the SDG Goal 3 Target 3.4 of reducing premature mortality
Although we use 2050 as a cutoff in the analysis done for by 2030.33 However, adopting more ambitious dietary
this report, the issues discussed extend well beyond 2050. patterns, such as the Planetary Health Diet, would enable
Global population is expected to exceed 11 billion people these countries to achieve additional SDGs.
by 2100 unless actions are taken to stabilize population
31Diets For a Better Future
The IPCC 1.5 Special Report and other recent research
firmly conclude that stabilizing temperature at 1.5°C
above pre-industrial levels is essential and will require
A Roadmap
an extraordinary transformation of lifestyles, behaviors,
norms and values in our society.1, 4, 11, 12 Not doing so risks
the potential of crossing irreversible climate tipping
for Change
points which may result in a cascade of unstoppable or
runaway events such as the irreversible loss of ice sheets
or forests.34 These tipping points could be exceeded even
between 1°C and 2°C of warming, which makes the 1.5°C
target even more critical.12 Despite this existential threat to
humanity, current country level commitments (i.e. Nationally
Determined Contributions or NDCs) puts the world on a
path of at least 3.0°C warming. To make matters worse,
emissions are currently rising at a rate of 1.5% per year with
G20 countries being responsible for approximately 78% of
global emissions.35
The Carbon Law outlines the pace of change required to
limit global warming to 1.5°C by 2100 for all sectors (see
Figure 2). However, as pointed out in this report, food-
related emissions are slightly different. The global objective
with the food sector should be to prevent current food
related emissions from rising further and reduce current
total food-related emissions roughly 12%, from 5.6 Gt CO2eq
to 5.0 Gt CO2eq. When coupled with reductions in food loss
and waste, this can be achieved by a 40% global shift to
healthy and sustainable diets by 2030 and 75% by 2050.4
The majority of this 40% shift by 2030 toward healthy
flexitarian diets needs to happen in the G20 countries as
these are the countries that currently have the largest food-
related GHG emissions.
32A Roadmap for Change Diets For a Better Future
Figures 19 and 20.
By 2050, the number of Earths that would be needed (ecological food-
print) to support food production within the planetary climate boundary if
all countries globally adopted either current consumptions patterns or the
NDGs of individual G20 countries. Data from Springmann et al. (2020). 24
*Current consumption estimates were used since NDGs do not exist.
However, consumption patterns in G20 countries vary
considerably and some countries will require deeper
transformations than others and adoption of more
ambitious NDGs.
If the global population followed current
consumption patterns in individual G20
countries or adopted their NDGs only
India and Indonesia would have food
consumption patterns that are within
the planetary climate boundary for food
(Figures 19 and 20).
Global adoption of current food consumption patterns in
G20 countries would require between one to nearly 7.4
Earths (Figure 19). NDGs perform slightly better but are still
not ambitious enough to stay within the planetary boundary
for food-related GHG emissions for most countries. Global
adoption of the NDGs of G20 countries would require
between one to nearly 4.7 Earths (Figure 20). Only global
adoption of the NDGs of Indonesia and India would keep
total global emissions within the boundary.
33You can also read