Renewable Waste-to-Energy in Southeast Asia: Status, Challenges, Opportunities, and Selection of Waste-to-Energy Technologies - MDPI

Page created by Dustin Bishop
 
CONTINUE READING
Renewable Waste-to-Energy in Southeast Asia: Status, Challenges, Opportunities, and Selection of Waste-to-Energy Technologies - MDPI
applied
           sciences
Review
Renewable Waste-to-Energy in Southeast Asia: Status,
Challenges, Opportunities, and Selection of
Waste-to-Energy Technologies
Maw Maw Tun 1,2, * , Petr Palacky 1 , Dagmar Juchelkova 1           and Vladislav Sít’ař 3
 1   Faculty of Electrical Engineering and Computer Science, VŠB-Technical University of Ostrava,
     17. listopadu 2172/15, 70800 Ostrava-Poruba, Czech Republic; petr.palacky@vsb.cz (P.P.);
     dagmar.juchelkova@vsb.cz (D.J.)
 2   Department of Technical and Vocational Education and Training, Ministry of Education, Office No. 21,
     Naypyitaw 15011, Myanmar
 3   Faculty of Mechanical Engineering (FME), J. E. Purkyně University in Ústí nad Labem,
     40096 Ústí nad Labem, Czech Republic; Vladislav.Sitar@ujep.cz
 *   Correspondence: maw.maw.tun.st@vsb.cz or bdtmawmawtun@gmail.com; Tel.: +95-976-764-9249
                                                                                                     
 Received: 15 September 2020; Accepted: 13 October 2020; Published: 19 October 2020                  

 Abstract: Rapid urban population growth that boosts increased waste generation and electricity
 demand has led to a possible alternative waste-to-energy solution in Southeast Asia. Despite some
 issues related to the development of the waste-to-energy sector such as public perception,
 all stakeholder involvement, public–private partnerships, funding, and climate factors, some Southeast
 Asian countries have made a reasonably successful step toward the developed technologies. Therefore,
 this study aimed to highlight an overview of the waste-to-energy sector in Southeast Asian countries
 to specify the status, challenges, opportunities, and selection of the technologies suited for the specific
 country. In order to achieve this aim, the study collected, synthesized, and evaluated data about waste
 resources, current waste management, waste-to-energy utilization, and its potential in the region
 based on published research papers and policy reports. It was found that the major waste-to-energy
 technologies in the region are incineration, landfills with gas capture, and anaerobic digestion.
 The total quantity of the waste-to-energy capacity from landfill biogas plants, incineration plants,
 and other waste-to-energy practices in the region accounts for over 323 MW at present and is
 expected to grow to double its current size by 2022. Meanwhile, by 2030, the realizable generation
 potential from renewable municipal waste in six Southeast Asian countries (Indonesia, Malaysia,
 Philippines, Singapore, Thailand, and Vietnam) amounts to 17.26 terawatt-hours (TWh). The study
 also specifies the requirements and considerations for the selection of waste-to-energy technologies,
 as well as the dimensions related to the development of the technologies. Additionally, four major
 aspects—technical, financial, environmental, and social and political—regarding the challenges
 and opportunities for the development of these technologies are considered. The challenges and
 opportunities related to the development of waste-to-energy in the region reveal how to overcome the
 drawbacks and to grasp the benefits at present and in the near future. Finally, the study is concluded
 with suggestions for the selection of the technologies in the region.

 Keywords: energy from waste; renewable energy; waste management; waste-to-energy technologies;
 Southeast Asia

1. Introduction
    As the world hurtles toward its urban future, the amount of municipal solid waste (MSW),
one of the most important by-products of an urban lifestyle, is growing even faster than the rate of

Appl. Sci. 2020, 10, 7312; doi:10.3390/app10207312                               www.mdpi.com/journal/applsci
Renewable Waste-to-Energy in Southeast Asia: Status, Challenges, Opportunities, and Selection of Waste-to-Energy Technologies - MDPI
Appl. Sci. 2020, 10, 7312                                                                                             2 of 25
Appl. Sci. 2020, 10, x FOR PEER REVIEW                                                                                2 of 27

urbanization
urbanization [1].     The amount
                 [1]. The  amount of  of MSW
                                         MSW generation
                                                 generation ofof the
                                                                  the cities
                                                                       cities around
                                                                              around the
                                                                                       the world
                                                                                           world might
                                                                                                   might increase
                                                                                                          increase from
                                                                                                                    from
1.3
1.3 billion tons per year to 2.2 by 2025, and waste generation rates might double over the
    billion  tons  per  year   to 2.2  by  2025,  and   waste  generation     rates might   double   over  the next
                                                                                                                next two
                                                                                                                     two
decades   in  developing     countries
decades in developing countries [1,2].   [1,2].
     The
     The East
           East Asia
                  Asia and
                        andPacific
                              Pacific(EAP)
                                      (EAP)region
                                               regionhashasaahigher
                                                              higherurban
                                                                        urbanpopulation
                                                                               population  than
                                                                                             thanother regions,
                                                                                                   other regions,and
                                                                                                                   andit is
                                                                                                                         it
projected  to  reach   1229  million   in  2025, up   from  777  million   in 2012  (Figure  1). Despite
is projected to reach 1229 million in 2025, up from 777 million in 2012 (Figure 1). Despite the lower     the  lower  per
capita  wastewaste
per capita     generation    rate in the
                       generation    rateregion
                                            in thecompared     to the Organization
                                                     region compared                  for Economicfor
                                                                            to the Organization       Co-operation
                                                                                                         Economic and Co-
Development      (OECD)     in 2012,  it will be  increased  by  60%    in 2025. Since  the Southeast
operation and Development (OECD) in 2012, it will be increased by 60% in 2025. Since the Southeast      Asian   countries
(Brunei   Darussalam,
Asian countries           Cambodia,
                       (Brunei            Indonesia,
                                  Darussalam,           Laos PDR,Indonesia,
                                                    Cambodia,        Malaysia, Laos
                                                                                  Myanmar,
                                                                                         PDR,Philippines,
                                                                                                 Malaysia, Singapore,
                                                                                                              Myanmar,
Thailand,
Philippines, Singapore, Thailand, and Vietnam) belong to the East Asia and Pacificpopulation
           and    Vietnam)   belong   to  the East  Asia  and Pacific   region, the annual   urban   region, theof  these
                                                                                                                  annual
countries,  as  per  the World    Bank   Report  [1], is expected   to grow   considerably
urban population of these countries, as per the World Bank Report [1], is expected to grow    by 2025, hence  increasing
the amount ofbyannual
considerably                 waste increasing
                      2025, hence    generation.the  However,
                                                       amount of  only   30–70%
                                                                     annual       of waste
                                                                               waste          can beHowever,
                                                                                      generation.     collectedonly
                                                                                                                 in most
                                                                                                                      30–
developing     countries,   including    Myanmar,      Laos  PDR,   and    Cambodia,    whereas
70% of waste can be collected in most developing countries, including Myanmar, Laos PDR, and      developed    countries
have  a 76–100%
Cambodia,           collection
              whereas            efficiency
                         developed            [1,3]. have a 76–100% collection efficiency [1,3].
                                        countries

      Figure 1.1. AAcomparison
                     comparisonof of  urban
                                   urban      population
                                         population   and and  per capita
                                                          per capita waste waste  generation
                                                                           generation  in worldinregions
                                                                                                   worldbetween
                                                                                                          regions
      between
      the       the year
          year 2012   and2012
                          2025and
                               [1].2025 [1].EAP:
                                    Note:    Note:East
                                                   EAP:  East
                                                       Asia   Asia
                                                            and    and Pacific
                                                                Pacific region;region; ECA: Europe
                                                                                 ECA: Europe          and Central
                                                                                               and Central   Asia
      Asia region;
      region;          SAR:Asia
              SAR: South     South   AsiaOECD:
                                 region;    region;  OECD: Organization
                                                  Organization  for Economic for  Economic and
                                                                               Co-operation   Co-operation    and
                                                                                                   Development;
      Development;
      AFR:             AFR: LCR:
            Africa region;   Africa region;
                                  Latin      LCR: and
                                         America    Latin America
                                                        the         andregion;
                                                            Caribbean   the Caribbean    region; MENA:
                                                                                MENA: Middle     East andMiddle
                                                                                                           North
      East and
      Africa     North Africa region.
             region.

     With accelerated
             accelerated urbanization,
                            urbanization, economic growth, and changing   changing lifestyles [4], Southeast
                                                                                                        Southeast Asia’s
                                                                                                                     Asia’s
urban population is projected to rise to nearly    nearly 400
                                                           400 million
                                                                million byby 2030
                                                                               2030 [5].
                                                                                     [5]. Additionally, the growth of
electricity demand is also prompting countries to more than double generation capacity             capacity byby 2040
                                                                                                                   2040 [5].
                                                                                                                         [5].
The
The projected
      projectedrise
                  riseof of
                         energy   demand
                             energy   demandin Southeast    Asia will
                                                  in Southeast     Asiahave
                                                                         willa considerable    effect on CO
                                                                                have a considerable           2 emissions,
                                                                                                           effect  on CO2
which  are projected
emissions,   which are  toprojected
                            rise from to
                                       3.5%
                                          risetoday
                                                fromto  5% today
                                                      3.5%   by 2030to[6,7].
                                                                       5% by  Figure  2 shows
                                                                                2030 [6,7].      the access
                                                                                             Figure   2 showsto the
                                                                                                                electricity,
                                                                                                                     access
per capita  electricity  consumption,     and   per capita
to electricity, per capita electricity consumption, and    CO  2 emission
                                                                    per capita CO2 emission in Southeast capita
                                                                             in Southeast   Asian   countries.  Per   Asian
electricity
countries. consumption         in the majority
             Per capita electricity    consumptionof thein
                                                         countries   is below
                                                            the majority   of the2500  kWh per
                                                                                   countries       capita,2500
                                                                                                is below    and kWh
                                                                                                                  their per
capita
capita,COand2 emissions
               their per are    below
                             capita  CO4500    kg. The are
                                         2 emissions     average
                                                              belowcarbon
                                                                      4500 emission
                                                                              kg. The in    Southeast
                                                                                         average         Asian
                                                                                                    carbon       countries
                                                                                                             emission     in
has been increased
Southeast              by over 5%
             Asian countries       hasdue
                                       beento increased
                                               the fast economic
                                                           by overgrowth
                                                                     5% dueinto  thethe
                                                                                      region  [8,9]. Though
                                                                                         fast economic         Singapore,
                                                                                                           growth    in the
Malaysia,
region [8,9].Brunei
               Though Darussalam,
                           Singapore,and     Thailand
                                         Malaysia,       haveDarussalam,
                                                      Brunei    already allowed       100% access
                                                                                and Thailand      havetoalready
                                                                                                         their electricity,
                                                                                                                   allowed
other
100% countries     like Philippines
       access to their    electricity, and
                                       otherVietnam
                                               countriesarelike
                                                             projecting  to reach
                                                                Philippines     andthis   100% are
                                                                                     Vietnam     access  by 2020 to
                                                                                                     projecting    [9].reach
this 100% access by 2020 [9].
Renewable Waste-to-Energy in Southeast Asia: Status, Challenges, Opportunities, and Selection of Waste-to-Energy Technologies - MDPI
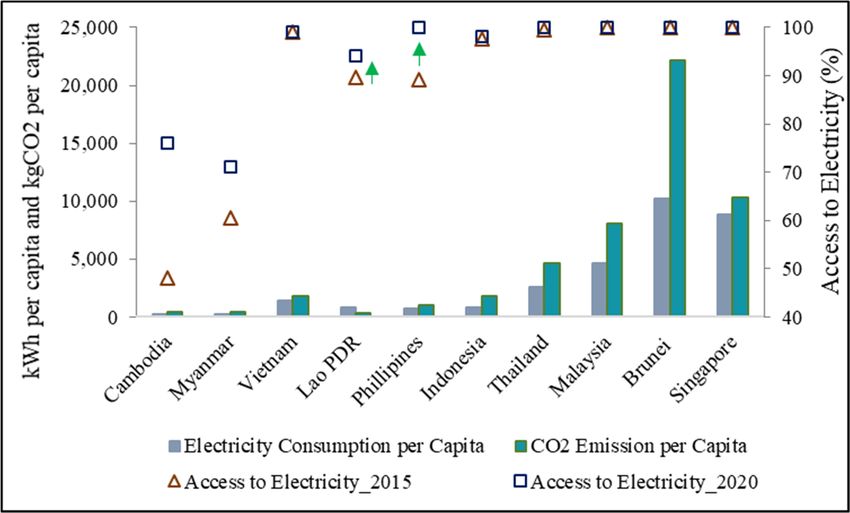
Appl. Sci. 2020, 10, 7312                                                                                               3 of 25
Appl. Sci.
Appl. Sci. 2020,
           2020, 10,
                 10, xx FOR
                        FOR PEER
                            PEER REVIEW
                                 REVIEW                                                                                33 of
                                                                                                                          of 27
                                                                                                                             27

      Figure 2.
      Figure
      Figure 2. Access
             2. Access
                Access toto  electricity (2015
                         to electricity
                             electricity (2015 and
                                         (2015 and 2020),
                                               and 2020), electricity
                                                   2020), electricity consumption
                                                          electricity  consumption per
                                                                       consumption per capita
                                                                                   per capita (2014),
                                                                                       capita (2014), and
                                                                                              (2014), and CO
                                                                                                      and CO22
                                                                                                          CO2
      emission per
      emission  per capita
                    capita (2014)
                            (2014) in
                                    in Southeast
                                       Southeast Asian
                                                 Asian countries
                                                 Asian countries [9].
                                                       countries  [9].
                                                                  [9].

     The total
     The   total electricity
                  electricity generation
                               generation fromfrom the
                                                     the renewables
                                                           renewables and  and non-renewables
                                                                                non-renewables in  in the
                                                                                                       the Southeast
                                                                                                            Southeast Asia
                                                                                                                        Asia
region amounted
        amounted to approximately
                          approximately 856  856 terawatt-hours
                                                  terawatt-hours (TWh)  (TWh) inin 2014,
                                                                                   2014, out
                                                                                          out of which
                                                                                                  which 20% came from
renewable energy
renewable      energy(74.1%
              energy    (74.1%hydropower,
                        (74.1%   hydropower,
                                 hydropower,        12.6%
                                                12.6%
                                                   12.6%     biofuels,
                                                          biofuels,
                                                             biofuels,   11.5%
                                                                     11.5%       geothermal,
                                                                             geothermal,
                                                                         11.5%                  1.2%
                                                                                           1.2%1.2%
                                                                                 geothermal,            solar
                                                                                                 solarsolar   photovoltaic
                                                                                                         photovoltaic   (PV),
                                                                                                              photovoltaic
(PV),0.6%
and
(PV),  andwind)
       and    0.6% wind)
              0.6%   wind)As
                     [10].   [10].  As shown
                                shown
                             [10].  As    shown
                                          in Figurein 3,
                                                   in   Figure   3, the
                                                                     the bioenergy
                                                          the bioenergy
                                                        Figure   3,        bioenergy   demand
                                                                             demand demand
                                                                                      in  non-OECDin non-OECD
                                                                                                  in non-OECD        Asia is
                                                                                                          Asia is projected
                                                                                                                     Asia    is
projected
to grow      to  grow
         dramatically   dramatically
                            by 2035.   Itby  2035.
                                           has been  It  has
                                                      observedbeen   observed
                                                                    that  the    that
                                                                               demand the
                                                                                        fordemand
                                                                                             biofuels
projected to grow dramatically by 2035. It has been observed that the demand for biofuels in this     for
                                                                                                        in biofuels
                                                                                                           this regionin  this
                                                                                                                         will
region will
        willrise
potentially
region          potentially  rise from
                   from 2 million
               potentially   rise  from
                                     tons22ofmillion
                                             million    tons of
                                              oil equivalent
                                                        tons  of(Mtoe)
                                                                 oil equivalent
                                                                 oil  equivalent
                                                                          in 2009 to(Mtoe)
                                                                                     over 30
                                                                                   (Mtoe)   inMtoe
                                                                                            in  2009in
                                                                                                2009  to2035,
                                                                                                      to  overwhereas
                                                                                                          over  30 Mtoe
                                                                                                                30  Mtoethe in
                                                                                                                            in
2035,
demand whereas
          for      the
                biomass demand
                           and     for
                                waste   biomass
                                        might    be and    waste
                                                     increased    might
                                                                  by        be increased
                                                                       approximately      by
                                                                                         50%
2035, whereas the demand for biomass and waste might be increased by approximately 50% from   approximately
                                                                                               from  480   Mtoe   50%
                                                                                                                  in    from
                                                                                                                     1990   to
480 Mtoe
over
480 Mtoe    in 1990
      700 Mtoe
           in   1990  to over
                         over 700
                   in 2035.
                      to       700 Mtoe
                                    Mtoe in in 2035.
                                               2035.

              Figure 3.
              Figure 3. Actual
                        Actual and
                               and projected
                                   projected bioenergy
                                             bioenergy demand
                                                       demand in
                                                              in non-OECD
                                                                 non-OECD Asia,
                                                                          Asia, 1990–2035
                                                                                1990–2035 [11].
                                                                                          [11].

Waste to Energy in Asia
1.1. Waste
1.1. Waste to
            to Energy
                Energy in
                       in Asia
                          Asia
     Due to the potential depletion of fossil fuel and climate change, Southeast Asian countries
     Due to
     Due   to the
               the potential
                   potential depletion
                              depletion of
                                        of fossil
                                           fossil fuel
                                                  fuel and
                                                        and climate
                                                             climate change,
                                                                      change, Southeast
                                                                                Southeast Asian
                                                                                           Asian countries
                                                                                                   countries have
                                                                                                             have
have looked to renewable and alternative energies to reduce greenhouse gas emissions and other
looked   to  renewable     and   alternative energies     to  reduce   greenhouse     gas
looked to renewable and alternative energies to reduce greenhouse gas emissions and other  emissions   and  other
environmental impacts from the energy sector [9]. On the other hand, the growing urban population
environmental impacts
environmental     impacts from
                            from the
                                  the energy
                                      energy sector
                                             sector [9].
                                                      [9]. On
                                                           On the
                                                               the other
                                                                   other hand,
                                                                          hand, the
                                                                                 the growing
                                                                                     growing urban
                                                                                               urban population
                                                                                                      population
will accelerate the amount of annual waste generation (approximately 97 million tons per year in
will accelerate   the amount    of  annual  waste   generation   (approximately     97 million
will accelerate the amount of annual waste generation (approximately 97 million tons per year    tons per year in
                                                                                                               in
2015 to
2015  to 165
         165 million
              million tons
                       tons per
                             per year
                                 year by
                                       by 2025)
                                          2025) in
                                                 in these
                                                    these countries
                                                            countries [1,12],
                                                                       [1,12], requiring
                                                                               requiring significant
                                                                                          significant investment
                                                                                                      investment
Renewable Waste-to-Energy in Southeast Asia: Status, Challenges, Opportunities, and Selection of Waste-to-Energy Technologies - MDPI
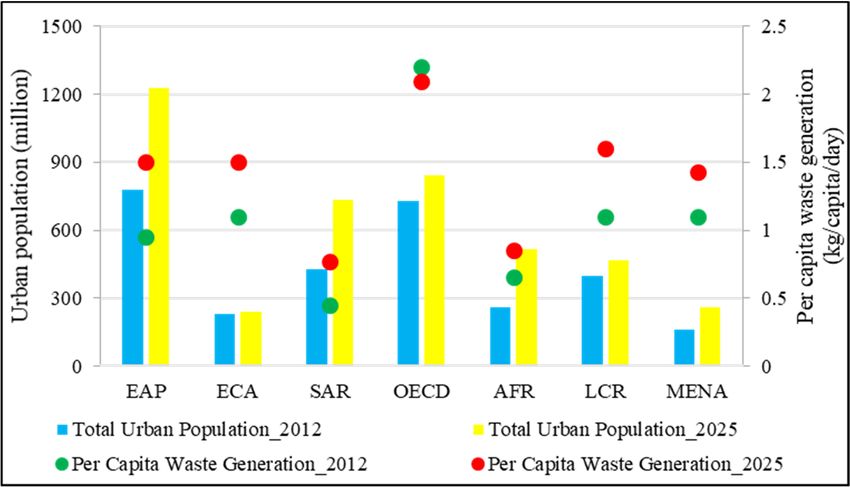
Appl. Sci. 2020, 10, 7312                                                                                          4 of 25

2015 to 165 million tons per year by 2025) in these countries [1,12], requiring significant investment in
waste management to cope with the increase in waste [5]. The rapid urban population growth that has
boosted waste generation and electricity demand has led to a possible alternative solution in Southeast
Asia. Waste-to-energy—a catch-all for different technologies that allows countries to get rid of waste
and generate electricity at the same time—is one obvious and quick solution to these two needs [5].
Therefore, the technologies constitute a meeting point for the waste management and energy sectors to
work together and benefit from each other in the most efficient manner [2].
      Actually, waste-to-energy is also a kind of biomass energy, offering benefits not only to minimize
the waste crisis but also to meet the actual fossil-free high demand [2] and to reduce the greenhouse
gas emissions and climate change impacts [13]. Nowadays, it has become a type of renewable energy
utilization that can provide environmental and economic benefits in the world [13]. Currently, there are
more than 2200 thermal waste treatment plants all over the world with a total capacity of 300 million
tons per year, and it has been estimated that more than 600 new waste-to-energy facilities will be
built with a capacity of 170 million tons per year by 2025 [2,14]. China had 7.3 gigawatts of energy
production across 339 power plants in 2017, and they are expecting to grow to 10 gigawatts and
600 plants by 2020 [5]. The selection of the most suitable technology is based on social, economic,
and technical factors, as well as environmental strategies to ensure the best outcomes [2]. In Europe,
the most widespread options for upgrading waste treatment are the incineration of grey waste and
anaerobic digestion (AD), often combined with the composting of the separated fraction of organic
waste [3]. When it comes to waste-to-energy plants, there are regional preferences—gasification is in
favor in South Asia, while grate incineration is generally used in Europe [3].
      As described in Figure 4, the most common waste-to-energy technologies in the developing world
include [2,15–17];

(i)   Thermal conversion (incineration, pyrolysis, gasification, and plasma gasification).
(ii)  Biochemical conversion (fermentation, anaerobic digestion, landfills with gas capture, and microbial
      fuel cell).
(iii) Chemical conversion (esterification).
       Appl. Sci. 2020, 10, x FOR PEER REVIEW                                                            5 of 27

       Figure 4. Most
           Figure     common
                  4. Most    waste-to-energy
                          common              technologies
                                 waste-to-energy           [15,16].
                                                 technologies       Note:
                                                              [15,16].    CHP
                                                                       Note:   is Combined
                                                                             CHP            Heat
                                                                                  is Combined    and
                                                                                              Heat   Power.
                                                                                                   and
            Power.

             Nowadays, waste-to-energy plants are most often tailor made, depending on very specific local
       requirements. Thus, construction costs vary widely, and a typical range in Europe is around 500–700
       Euro per ton per year in installed capacity, not including the cost for the site and project development
       [21]. Globally, the estimated cost for the waste-to-energy technologies in the lower middle income
Renewable Waste-to-Energy in Southeast Asia: Status, Challenges, Opportunities, and Selection of Waste-to-Energy Technologies - MDPI
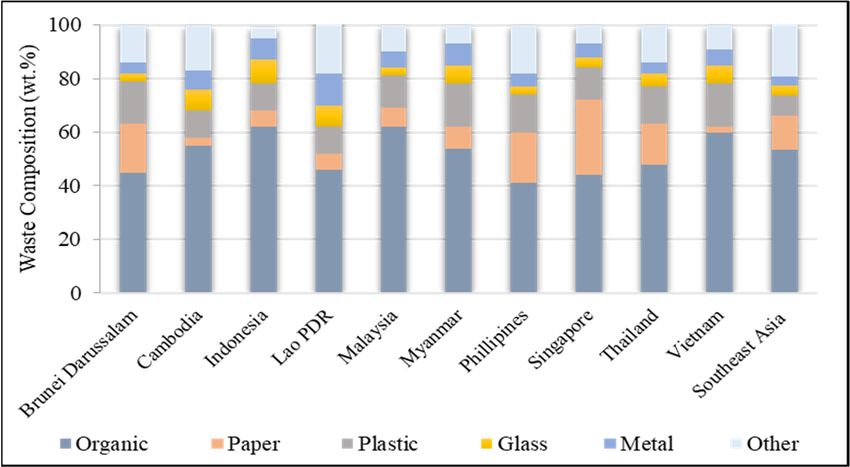
Appl. Sci. 2020, 10, 7312                                                                                                           5 of 25

      The future trends in the area are in the direction of biological hydrogen production
(photo-biological process and dark fermentation), bio-electrochemical processes (microbial fuel cells
(MFCs), microbial electrolysis cells (MECs), and hydrothermal carbonization [2].
      Technologies such as the incineration process have been advantageous, not only for reductions in
the mass and volumes of initial waste but also for energy recovery and the reduction of land use for
landfills [18]. When incinerated, waste can be reduced to 80–85% by weight and 95–96% by volume [19].
Additionally, incineration can be considered as a net greenhouse gas (GHG) reducer if GHG reductions,
achieved by accounting for waste-to-energy, exceed GHG emissions [20].
      Nowadays, waste-to-energy plants are most often tailor made, depending on very specific
local requirements. Thus, construction costs vary widely, and a typical range in Europe is around
500–700 Euro per ton per year in installed capacity, not including the cost for the site and project
development [21]. Globally, the estimated cost for the waste-to-energy technologies in the lower middle
income countries is in the range of 40–100 US dollar (USD) per ton for incineration and 20–80 USD per
ton for anaerobic digestion (AD), while the estimated cost in high income countries is in the range
of 70–200 USD per ton for incineration and 65–150 USD per ton for AD [1]. Figure 5 illustrates that
the application of waste-to-energy technologies in low-income and lower middle-income countries is
merely at the development stage compared to the upper middle-income and high-income countries,
which    are actively using these technologies.
Appl. Sci. 2020, 10, x FOR PEER REVIEW                                                            6 of 27

                                  Most Southeast Asian countries
                                  include among low-income and
                                  lower-middle income countries.

                                            Figure 5. Waste
                                                      Waste disposal method by income [1].

     In Figure 6a, the forecast shows that, globally, the growth of waste-to-energy technologies is
projected to reach 24.5 million USD in 2024 from 2.1 million USD
                                                              8000in 2010. Meanwhile, the regional market
      30
investment   in incineration in Asia will have 24.5
                                               grown from 616 million USD in 2006 to 6463 million      USD
                                                                                               6423
                                                                      Market Investment

in 2021, representing an investment increase by a factor of 106000
                                                               (Figure 6b). Additionally, the Asia-Pacific
                                                                                                    5112
                                                                       (Million USD)
  Billion USD

waste-to-energy
      20           market is projected to grow at an annual rate of over 15% and will reach a value of
13.66 billion USD by 2023 [22]. Thus, it is seen that the waste-to-energy
                                                              4000              sector in Asia has a great
                                                                                      2853
potential in technological transfer and investment [15,23].                2316            2282
                10                                                                                             1749
                                                                                          2000              957
                                                                                                    616
                      2.1
                                                                                                 187
                 0                                                                           0
                     2010      2014         2018       2022                                         2006         2011        2021
                                                                                            North America               Asia
                              All WtE Technologies                                          Europe                      Expon. (Asia)

                                      (a)                                                                  (b)
                Figure 6. (a) Growth forecast of all waste-to-energy technologies globally (b) regional market for
                incineration [15,23]. Note: WtE: Waste to Energy.
Renewable Waste-to-Energy in Southeast Asia: Status, Challenges, Opportunities, and Selection of Waste-to-Energy Technologies - MDPI
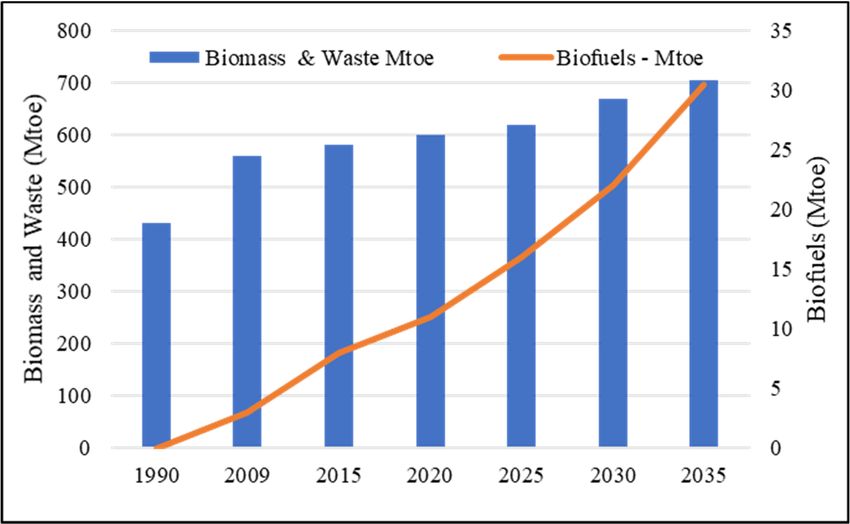
Appl. Sci. 2020, 10, 7312                  Figure 5. Waste disposal method by income [1].                                                 6 of 25

                                                                                         8000
                 30
                                                             24.5                                                                 6423

                                                                     Market Investment
                                                                                         6000                                            5112

                                                                      (Million USD)
   Billion USD

                 20
                                                                                         4000
                                                                                                                       2853
                                                                                                         2316      1749     2282
                 10
                                                                                         2000                   957
                                                                                                   616
                      2.1
                                                                                                187
                  0                                                                         0
                      2010    2014         2018       2022                                         2006               2011        2021
                                                                                           North America                     Asia
                             All WtE Technologies                                          Europe                            Expon. (Asia)

                                     (a)                                                                        (b)
             Figure 6.
             Figure  6. (a) Growth forecast of all
                                                all waste-to-energy
                                                    waste-to-energy technologies
                                                                    technologies globally (b) regional
                                                                                              regional market
                                                                                                       market for
                                                                                                              for
             incineration [15,23].
             incineration  [15,23]. Note: WtE: Waste to Energy.
                                                        Energy.

      Currently,
       Nowadays,waste  mostincineration
                              Southeast is    uncommon
                                             Asian  countries  in developing
                                                                    are facing countries,      and, generally,
                                                                                   several issues      related toit is   not
                                                                                                                      waste
successful
management,  or experiences
                  such as thefinancial
                                increasingandannual
                                               operational
                                                      waste difficulties
                                                                generationduethattohas
                                                                                     therequired
                                                                                          high capital
                                                                                                   morecost   of the
                                                                                                           waste      plant,
                                                                                                                   disposal
operation   and maintenance
sites, the scarcity              costs, environmental
                       of land areas,    the high moisture       content and
                                                            pollution,    of MSW,
                                                                               growthandintheenergy
                                                                                               need for  sorting[4,5,7,27].
                                                                                                      demand       facilities
and
Sincepretreatment
         these issues processes  [1,18]. However,
                          are especially             energy-oriented
                                             important     to be tackled   conversion    technologies
                                                                               in Southeast      Asia, for  waste-to-fuel
                                                                                                         waste-to-energy
and   waste-to-energy
technologies      can play have
                              anbeen   well-developed
                                   essential                around the waste
                                               role in sustainable          world to   create energy/fuel
                                                                                    management        and the from   waste,
                                                                                                                   relief  of
reduce    dependency      on fossil  fuel,  reduce  land    use   for  waste  disposal,
environmental matters [17,25,26]. Meanwhile, some aspects such as regulation, finance, and and  ensure   socio-economic
and   environmental
technological           benefits
                  suitability     [24–26].
                              should         Though considered
                                       be carefully    there is stillto a long  waythe
                                                                          develop     until a global sustainable
                                                                                         waste-to-energy     sector waste
                                                                                                                      in the
management       strategy is achieved [15], developing countries can learn the lessons about and gain
region [2,12,15,16,18,24].
technology
       Severaltransfers    from to
                studies have,     thea waste-to-energy
                                       reasonable extent,    technologies
                                                                 overviewed,  and   waste management
                                                                                 analyzed,    and evaluated  practices
                                                                                                                 the waste in
developed
management    countries.
                 and waste-to-energy sectors in Southeast Asian countries [1,28], but most have focused
on theNowadays,      most Southeast
           waste-to-energy     sector Asian   countries
                                        in specific       are facing
                                                      countries         several
                                                                      such       issues related
                                                                            as Thailand           to waste
                                                                                            [29,30],        management,
                                                                                                      Malaysia      [31–33],
such   as the increasing   annual  waste    generation   that  has   required  more   waste
Vietnam [17], and Myanmar [13]. Despite some issues such as public perception, public–private disposal  sites, the  scarcity
of land areas, environmental
partnerships,     all stakeholder  pollution,  and growth
                                      involvement,      funding,in energy   demand factors,
                                                                      and climate     [4,5,7,27].  SinceSoutheast
                                                                                                some      these issues    are
                                                                                                                      Asian
especially  important    to be tackled   in Southeast   Asia,    waste-to-energy    technologies
countries have made a reasonably successful step toward waste-to-energy technologies. Therefore,    can  play  an  essential
role
this in  sustainable
      study  aimed towaste    management
                         highlight  an overviewand of
                                                   thetherelief   of environmental
                                                            waste-to-energy            matters
                                                                                  sector         [17,25,26].
                                                                                          in Southeast        Meanwhile,
                                                                                                          Asian   countries
some    aspects
to specify    thesuch  as regulation,
                   status,  challenges,finance,  and technological
                                          opportunities,                  suitability
                                                              and selection            should be carefully
                                                                                of technologies     suited forconsidered
                                                                                                                 a specific
to develop the waste-to-energy sector in the region [2,12,15,16,18,24].
      Several studies have, to a reasonable extent, overviewed, analyzed, and evaluated the waste
management and waste-to-energy sectors in Southeast Asian countries [1,28], but most have focused on
the waste-to-energy sector in specific countries such as Thailand [29,30], Malaysia [31–33], Vietnam [17],
and Myanmar [13]. Despite some issues such as public perception, public–private partnerships,
all stakeholder involvement, funding, and climate factors, some Southeast Asian countries have made
a reasonably successful step toward waste-to-energy technologies. Therefore, this study aimed to
highlight an overview of the waste-to-energy sector in Southeast Asian countries to specify the status,
challenges, opportunities, and selection of technologies suited for a specific country. As a major
contribution, the study especially focuses on waste-to-energy alternatives, their potential, and the
feasibility to implement them in the Southeast Asian countries where important data are not available.
      The study consists of five major sections: introduction, methodology, results and discussion,
recommendation, and conclusion. The introduction section describes an overview of waste management
and waste-to-energy in Asian countries, whereas the methodology section specifies how the study
was carried out. The results and discussion section conveys information about waste management,
the status of waste-to-energy technologies, the requirements and considerations for the selection
of the technologies, and the dimensions, challenges, and opportunities in Southeast Asia. Then,
Appl. Sci. 2020, 10, 7312                                                                              7 of 25

the study provides recommendations for the way forward regarding the waste-to-energy sector before
a brief conclusion.

2. Methodology
     Since most countries in Southeast Asia are developing countries, their MSW management is not
well-developed. Meanwhile, their waste-to-energy sectors are also at the development stage. As a
result, there are some difficulties in collecting updated data about their MSW management systems and
waste-to-energy sectors; most of these data are not fully accessible. Therefore, the data related to the study
were collected, to a feasible extent, from previous research papers [13,17,28–38], review papers [9,39–41],
policy reports by the World Bank [1], the United Nations Environment Programme [12,42], the International
Energy Agency [3,7], the International Renewable Energy Agency [43,44], the World Energy Council [15],
and other accessible reports. Then, the study synthesized, analyzed, and evaluated data about waste
resources, current waste management, and waste-to-energy utilization in Southeast Asian countries in
order to highlight a comparison of MSW management systems and the status of waste-to-energy processes
among the countries. The study also specifies the requirements and considerations for the selection of
waste-to-energy technologies, as well as the dimensions regarding the development of these technologies.
Additionally, four major aspects—technical, financial, environmental, and social and political—regarding
the challenges and opportunities for the development of waste-to-energy technologies are described.
Finally, the study provides suggestions for the selection of waste-to-energy technologies in the region.

3. Results and Discussion

3.1. MSW Management in Southeast Asia
      The generation and characteristics of waste mainly rely on population growth, the rate of
urbanization, the degree of industrialization, income level, consumption habits, local climate,
and economic policies [2,15]. The major portion of waste composition in Southeast Asia countries is
composed of organic waste, followed by plastic and paper. Typical waste composition in Southeast
Asia comprises 51% organic waste, 12.9% paper, 7.2% plastics, 4% glass, 3.3% metal, and 19.6% other.
(Figure 7). The average per capita waste generation in the region accounts for approximately 1 kg per
capita per day [1].
Appl. Sci. 2020, 10, x FOR PEER REVIEW                                                          8 of 27

                  Figure 7. A
                            A comparison
                              comparison of waste composition in Southeast Asian countries [1,12].

      Table 1 shows some brief demographic context, waste generation, and waste management data
in Southeast Asian countries. The
                              The urban
                                  urban population
                                         population in most of these countries has below 50% of the
total waste, most from low-income and lower middle-income countries. Low economic development
countries regionally experience lower per capita waste generation rates, accounting for below 1 kg
per capita per day. Additionally, source segregation and collection rates—at below 50% and 70%,
respectively, compared to the rates of the developed countries—are affected by this low economic
development [1]. In average, Southeast Asian countries practice 5% compost, 9% incineration, 59%
solid waste disposal, and 27% other, including recycling, waste-to-energy, and other waste disposal
Appl. Sci. 2020, 10, 7312                                                                           8 of 25

countries regionally experience lower per capita waste generation rates, accounting for below 1 kg
per capita per day. Additionally, source segregation and collection rates—at below 50% and 70%,
respectively, compared to the rates of the developed countries—are affected by this low economic
development [1]. In average, Southeast Asian countries practice 5% compost, 9% incineration,
59% solid waste disposal, and 27% other, including recycling, waste-to-energy, and other waste
disposal methods [12]. More details about the demographic context and waste management of each
Southeast Asian country are described below.

(a)    Brunei Darussalam

     Brunei Darussalam has 423,188 residents, and its urban population was 77% of the total in 2015.
Along with the waste generation of 0.87 kg per capita per day [1], the total annual waste generation in
2015 amounted to 210,000 tons per year, and the collection efficiency was 90% [12,42]. The country
disposes of the majority of waste to disposal sites, but it only composts 2% of its waste [1]. With costly
waste management infrastructure and limited land area, the country has encountered a lack of capacity
in the design, implementation, and monitoring of policies, programs, and projects [42]. However,
the country is developing projects based on a public–private partnership (PPP) mechanism for the
waste management sector [42]. It is expected to contribute 10% renewable energy share in power
generation by 2035, excluding hydropower [45]. The potential share of renewable energy, in total,
of the primary energy supply has been projected to reach 4% in 2025 and 7% in 2030 [44].

(b)    Cambodia

     Cambodia has 15,577,899 residents, and its urban population was 21% of the total in 2015 [12].
Along with the waste generation of 0.6 kg per capita per day [1], the total annual waste generation in
2014 amounted to 1,089,000 tons per year, and the collection efficiency was 80% [12,42]. The recycling
sector contributes 20% of the total waste generation. Despite a lack of policies and programs that
address significant reduction of MSW, the country is preparing an integrated solid waste management
strategy for the future development of the MSW management sector [42]. However, there is still
limited awareness and behavior of people related to the concept of sustainable cities/green cities [42].
The country has set a target of 27% emission reduction by 2030 relative to business-as-usual (BAU) in
the energy industry [41]. The potential share of renewable energy in total primary energy supply is
projected to reach 35% in 2025 and 44% in 2030 [44].

(c)    Indonesia

     Indonesia has 255,993,674 residents, and its urban population was 54% in 2015 [12]. Along with the
waste generation of 0.52 kg per capita per day [1], the total annual waste generation in 2012 amounted to
22,500,060 tons per year, and the collection efficiency ranged from 56% to 75% [1,12,42]. Indonesia has
set major policies, programs, strategies, and projects for MSW [42], and it has successfully implemented
the concept of an MSW management system despite it currently being not well-implemented and
enforced at all government levels. Twelve waste-to-energy plants are expected to be completed in
2022 and produce 234 megawatts (MW) of electricity [22]. However, there is still a lack of knowledge
and skills at the technology, financial, and institutional levels with high investment costs and limited
project support [42]. The target for biomass and waste policy in Indonesia is expected to achieve
810 MW by 2025 [15] and to contribute a 23% non-renewable energy share in the energy mix in 2025 [45].
The country has targeted the achievement of a 29–41% emission reduction by 2030 by means of the
promotion of clean and renewable energy and energy conservation [41].

(d)    Laos PDR

    Laos PDR has 6,802,023 residents, and its urban population was 39% in 2015 [12]. Along with the
waste generation of 0.7 kg per capita per day [1], the total annual waste generation in 2015 amounted
Appl. Sci. 2020, 10, 7312                                                                             9 of 25

to 77,000 tons per year, and the collection efficiency was in the range of 40–70% [12,42]. Regarding the
MSW management system, the country has well-set environmentally sustainable city guidelines related
to the future development of the MSW sector [42]. Incineration as a waste-to-energy technology option
currently contributes 2% out of the total waste disposal methods. However, the country still lacks
comprehensive policies, programs, equipment, and technology for MSW management, in addition to a
limited awareness and behavior of people regarding the concept of sustainable cities/green cities [42].
Laos PDR is projected to achieve a 30% renewable energy share of total energy consumption by 2025,
excluding hydropower [45], and 10% biofuel use in transport sectors by 2025 [41].

(e)    Malaysia

     Malaysia has 30,331,007 residents, and its urban population was 75% in 2015 [12]. Along with the
waste generation of 1.52 kg per capita per day [1], the total annual waste generation in 2015 amounted
to 10,680,000 tons per year, and the collection efficiency was above 70% [12,42]. Coordination among
relevant local, state, and federal agencies in the waste sector is a key prerequisite for effective waste
management [42]. The incineration plant in Selangor has a capacity of 1000 tons per day or 8.9 MW of
electricity generation, and, while in operation with 70% of its actual capacity, it can generate 5 MW of
electricity [12]. The total capacity of operating landfill biogas plants registered under the feed-in-tariff
(FiT) scheme from 2012 to 2018 was around 13.8 MW, and the planned capacity in three more new
projects is about 11.7 MW [32]. Located in Tanah Merah, Negeri Sembilan, the first waste-to-energy
plant project is planned to facilitate 1000 metric tons of solid waste daily and to produce 20–25 MW of
electricity for powering 25,000 households [22]. However, the country lacks a strong understanding of
waste composition, an adequate awareness of the 3Rs (Reduce, Reuse and Recycle) practice, and the
budget for raising awareness programs [42]. The country will increase the capacity of renewables
to 2.08 GW by 2020 [39] and 4 GW renewable energy in installed capacity by 2030, which excludes
hydropower [45]. Additionally, the country has set a target to achieve a 35% GHG reduction by 2030
from the 2005 level—or up to 45% with international support [39].

(f)    Myanmar

      Myanmar has 53,897,154 residents, and its urban population was 34% in 2015 [12]. Along with the
waste generation of 0.44 kg per capita per day [1], the total annual waste generation in 2015 amounted
to 1,130,040 tons per year, but the collection efficiency remained below 50% [12,42]. The recycling sector
contributes 5% in Yangon City [13]. Despite the policies and programs set for MSW, the country has
been weak in developing an action plan and projects [42]. Additionally, the country lacks knowledge,
experts, and skilled personnel, and it has had few projects and a limited awareness of people related
to the concept of sustainable cities/green cities [42]. The capacity of the first waste-to-energy plant
operated in Yangon in 2017 was 0.76 MW [46]. The country has set a target of a 15%–20% renewable
energy share in its installed capacity by 2030, excluding hydropower [45]. Moreover, the country has
planned to reduce its GHG emissions by 16% below the BAU level by 2020 and to stabilize its GHG
emissions by around 2030 without reaching a peak limit [39].

(g)    Philippines

      Philippines has 100,998,376 residents in 2015, and its urban population was 44% [12]. Along with
a waste generation of 0.5 kg per capita per day [1], the total annual waste generation in 2015 amounted
to 14,400,000 tons per year, and the collection efficiency ranged from 40% to 90%, depending on the
city [12,42]. Though the country has set MSW policies and programs, the regulations related to different
MSW components need to be integrated and improved [42]. The informal private sector is, in a major
way, involved in collection, transportation, and disposal in areas other than the metropolitan areas [42].
Due to high investment cost for MSW management, the country has limited projects and awareness of
people concerning the concept of sustainable cities/green cities [42]. The biomass and waste policy
Appl. Sci. 2020, 10, 7312                                                                         10 of 25

target in Philippines has been set to achieve 267 MW by 2030 [15] and 15 GW of installed capacity in
2030 [45]. The country has also planned to reduce 70% of its CO2 emission by 2030 relative to its BAU
scenario [41].

(h)    Singapore

     Singapore has 5,540,000 residents, with a 100% urban population in 2015 [12]. Along with
a waste generation of 1.49 kg per capita per day [1], the total annual waste generation in 2015
amounted to 7,670,000 tons per year. The amount of the organic waste is 1,520,000 tons per year,
and the collection efficiency is above 90% [12,42]. The country has long-been a regional leader in
waste-to-energy development that is currently aiming to reduce the average daily amount of waste sent
to Semakau landfill by 30% [22]. Currently, the country’s solid waste disposal infrastructure consists of
four waste-to-energy plants: Tuas (47.8 MW), Senoko (55 MW), Tuas South (132 MW), and Keppel
Seghers Tuas Plant (KSTP) (22 MW), in addition to the Semakau Landfill [22,47–49]. The country’s
biggest constraint is its amount of land, considering the growth of waste generation and technological
options [42]. The largest waste-to-energy plant (moving grate system) has a capacity of 4300 tons of
mixed MSW per day [16]. The country has set a target to achieve a 36% emission intensity reduction
by 2030 from its 2005 level [41]. Additionally, the potential share of renewable energy in total primary
energy supply has been projected to reach 3% in 2025 and 4% in 2030 [44].

(i)    Thailand

     Thailand has 67,959,259 residents, and its urban population was 50% in 2015 [12]. Along with the
waste generation of 1.76 kg per capita per day, the total annual waste generation in 2015 amounted to
26,850,000 tons per year, and the collection efficiency was above 80% [12,24]. Though the country has
set policies, regulatory frameworks, programs, and plans, there is a need for cost-effective technology
for biomass utilization and sustainable financial and technical resources for MSW management [42].
The 10-year alternative energy development plan (2012–2021) is aimed to boost alternative energy
usage (waste-to-energy) up to 25% of overall usage by increasing from 44.324 MW of its current capacity
to 160 MW of power and 100 kilotons of oil equivalent (ktoe) of thermal power (current capacity,
landfill gas: 22.23 MW; incineration and gasification: 20.06 MW; biogas: 2.034 MW; thermal: 78.59 ktoe;
biomass: 1.28 ktoe; and refuse derived fuel (RDF): 77.31 ktoe) [50]. The country has set a target to
achieve a 30% renewable energy share in total energy consumption by 2036, excluding hydropower [45],
and a 20% GHG reduction by 2030 relative to BAU—and up to 25% with international assistance [41].

(j)    Vietnam

     Vietnam has a total population of 91,700,000 residents, with a 34% urban population in 2015 [12].
Along with the waste generation of 1.46 kg per capita per day, the total annual waste generation in 2015
amounted to 12,800,000 tons per year, and the collection efficiency was in the range of 80–82% [12,42].
The country has developed a regulatory framework with an integrated solid waste management
strategy, but it still lacks financial resources for implementing interventions and investing in GHG
reduction projects in the waste sector [42]. Attracting investor interest from China, Japan, and other
countries [22], the Ho Chi Minh City Municipality has released a set of criteria for investing in
waste-to-energy projects that can process domestic waste up to 9300 tons per day [22]. Additionally,
the government has set a high electricity purchasing price for waste-to-energy of up to USD 10.05 cents
per kWh, which is even higher than prices for wind and solar power [22]. The country has targeted to
achieve a 27 GW renewable energy installation in 2030 (excluding hydropower) [45] and an 8% GHG
emission reduction—or 25% with international support—by 2030 relative to BAU [41].

3.2. Status of Waste-to-Energy Energy and Biomass Energy in Southeast Asian Countries
    Table 2 shows the status of waste-to-energy and biomass energy in Southeast Asian countries.
The status of the technologies in most Southeast Asian countries is at an emerging stage. However,
Appl. Sci. 2020, 10, 7312                                                                       11 of 25

in the near future, the development of waste-to-energy technologies could be seen to be comparatively
widespread across the region due to the promotion of renewable energy supplies in the region,
particularly in Indonesia, Malaysia, Thailand, and Singapore. For instance, all twelve waste-to-energy
plants in Indonesia are expected to produce 234 MW of electricity in 2022. In Malaysia, the current
installed capacity from incineration and landfills is 18.8 MW. Its overall waste-to-energy potential is
400 MW. In Thailand, the total capacity of the current waste-to-energy potential is 43.324 MW and it
targeted to reach 160 MW by 2021. Overall, the total amount of capacity from landfill biogas plants,
incineration plants, anaerobic digestion, and gasification in the region is over 323 MW at present and
is expected to reach to 700 MW by 2022. Meanwhile, by 2030, the realizable generation potential
from renewable municipal waste in six Southeast Asian countries (Indonesia, Malaysia, Philippines,
Singapore, Thailand, and Vietnam) will be 17.26 TWh.
Appl. Sci. 2020, 10, 7312                                                                                                                                                  12 of 25

                                  Table 1. Demographic context, waste generation, and waste management in Southeast Asian countries [1,12,42,46,51].

                                             Brunei
              Description                                Cambodia     Indonesia       Laos       Malaysia     Myanmar      Philippines   Singapore      Thailand      Vietnam
                                            Darussalam
 Population (2015)                           423,188     15,577,899   255,993,674   6,802,023    30,331,007   53,897,154   100,998,376    5,540,000     67,959,259    91,700,000
 Urban Population                             77%          21%           54%          39%          75%           34%          44%           100%           50%           34%
 Per Capita GDP (USD) (2015)                 31,164.6     1162.9        3331.7       2134.7        9955.2       1287.4       3001.0        55,646.6       5840.0        2085.1
 Waste Generation (tons/year)                            1,089,000    22,500,060
                                             210,000                                 77,000      10,680,000    1,130,040    14,400,000    7,670,000     26,850,000    12,800,000
 (2015)                                                    (2014)       (2012)
 Per Capita Waste Generation
                                               0.87         0.6          0.52          0.7          1.52         0.44          0.5           1.49          1.76          1.46
 (kg/capita/day)
 Source Segregation
Appl. Sci. 2020, 10, 7312                                                                                                                                                                        13 of 25

                                                            Table 2. Waste-to-energy and biomass energy potential [1,5,7,9,22,30,46–50].

                                                                                                                                                      Overall Bio- Energy      Overall Renewable
                      Waste Generation     Waste Generation        Status of WtE     Installed WtE Capacity
      Country                                                                                                      Energy Potential from Waste       Potential from Biomass    Energy Target across
                      (Tons/Year) (2015)   (Tons/Year) (2025)      Technologies    (Landfills/AD/Incineration)
                                                                                                                                                       across the Country          the Country
      Brunei                                                                                                                                                                  10% RE share in power
                             210,000            202,210              Emerging                   -                                -                              -
    Darussalam                                                                                                                                                                 generation by 2035 *
                                                                                                                                                                                More than 2 GW of
     Cambodia          1,089,000 (2014)            -                 Emerging                   -                                -                     18.852 (GWh/year)
                                                                                                                                                                               hydropower by 2020
                                                                                                                    (a) 234 MW of electricity from
                                                                                                                         12 WtE plants in 2022
                                                                                                                     (b) 7.71 TWh as a realizable
                                                                                                                                                                               23% non-renewable
                                                                                             2 MW                     generation potential from       Bioenergy Potential:
     Indonesia        22,500,060 (2012)        55,451,165           Developing                                                                                                energy share in energy
                                                                                             (2010)                renewable municipal waste for          50,000 MW
                                                                                                                                                                                   mix in 2025
                                                                                                                               RE to 2030
                                                                                                                  (c) 810 MW as biomass and WtE
                                                                                                                             target by 2025
                                                                                                                                                                               30% RE share of total
        Laos                 77,000            1,516,210             Emerging                   -                                -                         > 200 MW            energy consumption
                                                                                                                                                                                     by 2025
                                                                                                                       (a) 400 MW from MSW
                                                                                                                             (theoretical)
                                                                                                                   (b) 11.7 MW (planned landfill
                                                                                   (a) 13.8 MW (landfill biogas
                                                                                                                    capacity from new projects)       Bioenergy Potential:      4 GW RE installed
      Malaysia              10,680,000         18,854,075           Developing       plants during 2012–2018)
                                                                                                                    (c) 1.06 TWh as a realizable          29,000 MW             capacity by 2030 *
                                                                                      (b) 5 MW (incineration)
                                                                                                                     generation potential from
                                                                                                                  renewable municipal waste for
                                                                                                                              RE to 2030
                                                                                                                                                      Bio-energy potential:
                                                                                                                                                                                15–20% RE share in
                                                                                                                                                      11,640 MW (Biomass
     Myanmar                1,130,040          7,669,380             Emerging               0.76 MW                              -                                             installed capacity by
                                                                                                                                                       energy: 6899 MW;
                                                                                                                                                                                       2030 *
                                                                                                                                                       biogas: 4741 MW)
                                                                                                                    (a) 3.02 TWh as a realizable
                                                                                                                     generation potential from
                                                                                                                                                                              15 GW installed capacity
    Philippines             14,400,000         28,388,240           Developing                  -                 renewable municipal waste for                 -
                                                                                                                                                                                     in 2030 *
                                                                                                                             RE to 2030
                                                                                                                        (b) 267 MW by 2030
Appl. Sci. 2020, 10, 7312                                                                                                                                                                        14 of 25

                                                                                            Table 2. Cont.

                                                                                                                                                    Overall Bio- Energy       Overall Renewable
                      Waste Generation     Waste Generation     Status of WtE       Installed WtE Capacity
      Country                                                                                                    Energy Potential from Waste       Potential from Biomass     Energy Target across
                      (Tons/Year) (2015)   (Tons/Year) (2025)   Technologies      (Landfills/AD/Incineration)
                                                                                                                                                     across the Country           the Country
                                                                                                                   (a) 0.21 TWh as a realizable
                                                                                                                    generation potential from
                                                                                                                 renewable municipal waste for
                                                                                                                              RE to 2030
                       MSW: 7,670,000                                                                             (b) 9.9 MW of electricity from
                                                                                        256.8 MW from 4                                                                         350 MW installed
     Singapore         Organic Waste:          3,353,255           Mature                                        mix of waste biomass and solar              -
                                                                                       incineration plants                                                                   capacity of solar by 2020
                         1,520,000                                                                                          power (2013)
                                                                                                                     (c) Potentially, 0.9 MW of
                                                                                                                  electricity and 5.4 MW of heat
                                                                                                                            from biomass
                                                                                                                         co-generation plant
                                                                                                                 (a) 160 MW from MSW by 2021
                                                                                   44.324 MW (landfills: 22.23
                                                                                                                   (b) 2.41 TWh as a realizable                               30% RE share in total
                                                                                      MW; incineration and                                          Bio energy potential:
      Thailand              26,850,000         20,685,645        Developing                                         generation potential from                                energy consumption by
                                                                                     gasification: 20.06 MW;                                             7000 MW
                                                                                                                 renewable municipal waste for                                       2036 *
                                                                                       biogas: 2.034 MW)
                                                                                                                            RE to 2030
                                                                                                                   (a) 2.85 TWh as a realizable
                                                                                                                    generation potential from      Theoretical bioenergy     27 GW RE installation in
      Vietnam               12,800,000         26,611,785        Developing                     -
                                                                                                                 renewable municipal waste for     potential: 318,630 MW            2030 *
                                                                                                                            RE to 2030
      Note: Status of waste-to-energy technologies is determined by use of technologies, skills, economic growth, policies and practices in a country. WtE: waste-to-energy; RE: renewable energy;
      * excluding hydropower.
Appl. Sci. 2020, 10, 7312                                                                          15 of 25

3.3. Requirements and Considerations for Selection of Waste-to-Energy Technologies
      Whether incineration and waste-to-energy are a net positive can depend on the efficiency of
the process and the energy mix that waste-to-energy is replacing, including far better pollution and
dioxin filters to protect the environment and human health [22]. Most waste-to-energy projects aim
to demonstrate the full-scale utilization of municipal waste through the reduction of waste flow at
disposal sites, GHG reduction, resource efficiency, energy recovery, and employment creation [42].
However, there are several requirements and considerations for the selection of suitable technologies
regarding waste characteristics, plant sizes, climate and seasonal variations, and economic conditions,
as described in Table 3. Waste-to-energy plants such as incineration, pyrolysis, and plasma gasification
ones need huge volumes of waste—above 100 tons of waste per day and, at best, 500 tons of waste
per day—to sustain the continuous combustion in the furnace of boilers to produce a consistent heat
to supply to boilers for steam production [32]. For waste-to-energy production, the AD process can
accept a wide range of MSW volumes starting at 25 tons of waste per day, whereas landfilling needs
at least a consistent volume of MSW with a capacity of above 500 tons per day to produce a steady
stream of electricity supply for the grid [34].
      Some advantages of waste-to-energy technology include that when well-managed, this technology
has a smaller plant footprint with a smaller area of land required to operate, a reduction of need
for physical waste storage, lower carbon emissions, minimal land contamination, chemically stable
by-products from incineration, a higher density of energy recovery per ton of MSW, and the utilization
of a domestically-available and sustainable resources for electricity production [5,24,32]. Additionally,
it is good for areas with a lack of land for landfills to adopt alternative solutions in some Southeast
Asian countries such as Singapore and Brunei Darussalam [22]. For the meaningful use of the produced
energy, it is very desirable to use the produced heat on site, e.g., for drying biodegradable municipal
waste. Control of the electricity generator and the methods of connection to the electricity grid can also
play important roles.
      While the calorific values of MSW in developed countries are in the range of 8.4–17 MJ/kg [52],
the calorific values of the MSW in Southeast Asian countries are estimated at 5.82–10.11 MJ per
kg in Malaysia [53], 5.163–6.121 MJ per kg in Thailand [37], 5.52–9.37 MJ per kg in Lao PDR [38],
and 5.163–7.5 MJ/kg in Myanmar [13,46]. The calorific value of waste can vary with the composition of
the waste and the country’s economic development, consumption habits, educational standard, time,
season, etc. [2,15]. As a result, some Southeast Asian countries have lower quality waste, with calorific
values ranging from 5 to 11 MJ/kg, especially due to major portions of organic waste and the high
moisture content of the waste. Hence, a country is suited for waste-to-energy process if pretreatment
processes such as bio-drying and solar drying could be carried out. Additionally, a combination of
systems, such as the cooperation of solar systems for the pre-preparation of biodegradable waste before
its thermal treatment or the use of excess heat and electricity in the form of accumulation (power to X),
could play an important role. Additionally, a combination of AD and incineration or other disposal
methods could offer more benefits for waste-to-energy process in the region.
Appl. Sci. 2020, 10, 7312                                                                                     16 of 25

          Table 3. A technical parameters chart for various waste-to-energy projects [32], cited from [34].
                                                             √
         Indicators                           Most Suitable ( ); Moderate (M); Not Suitable (×)
                                                     WASTE-TO-ENERGY Technologies
  Technical Parameters
                              Anaerobic                                           Plasma            Landfill Gas
                                               Incineration       Pyrolysis
                            Digestion (AD)                                      Gasification      Extraction (LFG)
                                               Waste Characteristics
   High calorific value,                             √                 √             √
   >1200 Kcal/kg (or)              ×                                                                     ×
      [5.024 MJ/kg]
   High bio-degradable             √                                                 √                   √
                                                    M                  M
      matter, >50%
                                   √                                                 √                   √
   Fixed carbon, 25%             ×                 ×                   ×                              M
                                   √                                                 √
    C:N ratio, 20–30:1                             N/A                 M                               N/A
  Mixed with all types of                                                            √
                                   ×                M                  M                                M
         waste
                                                      Climate
                                   √                 √                 √             √                   √
   Hot climate, >35 ◦ C
    Moderate climate,                                √                 √             √                   √
                                   M
       15–25 ◦ C
  High moisture content,           √                                                 √
                                                     ×                 M                                 ×
         >55%
                                   √                                                 √
     High rainfall area                              ×                 M                                 ×
                                                     Plant Size
                                   √
       Up to 25 TPD                                  ×                   ×           ×                   ×
                                   √
        25–50 TPD                                    ×                   ×           ×                   ×
                                   √
        50–100 TPD                                   ×                   ×           ×                   ×
                                   √                 √                               √                   √
       100–500 TPD                                                     M
                                   √                 √                 √             √                   √
         >500 TPD
                                                Economic Condition
                                Low to
        Capital cost                               High             High         Very High           Very High
                               Moderate
                                  √                  √                 √             √                   √
  Resource conservation
       Carbon credit               √                                                 √
                                                    M                  M                                M
       Advantages
                                              Note: TPD: tons per day.

     Figure 8 illustrates a comparison of different waste-to-energy technologies in term of
plant capacity, energy potential, capital cost, operation and maintenance (O and M) cost,
and planning-to-commissioning costs, and emissions produced from each technology. It can be
seen that waste-to-energy technologies such as incineration, gasification, and pyrolysis have higher
energy potentials than others, but they also have higher plant capacities, ranging from 900 to 1300 tons
of waste per day for incineration and gasification. Additionally, the capital cost of these technologies is
much higher, being in the range of USD 30–180 million for incineration, USD 50–80 million for plasma
gasification, and USD 16–90 million for pyrolysis. Meanwhile, the O and M cost ranges approximately
from USD 80 to 120 per ton of waste for incineration and from USD 80 to 150 per ton of waste for plasma
gasification and pyrolysis. It has been observed that since sanitary landfills have the lowest capital
and O and M costs, most Southeast Asian countries practice it as a major waste disposal method [1].
Appl. Sci. 2020, 10, 7312                                                                                                                                                                                                                          17 of 25

            Appl. Sci. 2020, 10, x FOR PEER REVIEW                                                                                                                                                                                      3 of 27
Additionally, the waste management cost for sanitary landfills in developing countries ranges from 10
to 45 USD perThe tonemissions
                       [12]. from an incineration plant are 1.6 kg of CO2 equivalent per kWh, 191.2 g of NOx
          per ton of waste processed, and 94.6 g of SO2 per ton of waste processed. Dioxin emissions from
      The incineration
          emissions plants
                         fromhavean incineration         plantinare
                                       stringent regulations       other1.6   kg of CO
                                                                           developing    and   equivalent
                                                                                            2 developed        per kWh,
                                                                                                           countries, being 191.2 g of
NOx per limited
          ton oftowaste
                      1 ng/mprocessed,
                             3 toxic equivalentand[32,54].
                                                    94.6 g In of
                                                              theSO      per
                                                                   case2 of theton   of waste processed.
                                                                                thermo‐chemical                   Dioxin
                                                                                                    treatment of MSW    via emissions
          incineration,
from incineration        gasification,
                       plants    haveand     pyrolysis,regulations
                                         stringent      a facility distance   of up todeveloping
                                                                         in other      10 km for the exposed    population countries,
                                                                                                       and developed
          for all MSW incinerators      still gives negative health impacts in the long‐term [34]. The disposal of
being limited   to 1 ng/m3 toxic equivalent           [32,54]. In the case of the thermo-chemical treatment of MSW
          bottom ash and fly ash from incinerators into landfills remains a serious environmental issue due to
via incineration,
          the presence of 8–12% ferrous metals anda0.5–1.5%
                    gasification,    and    pyrolysis,     facilitynon‐ferrous
                                                                      distance of     up to
                                                                                   metals   in 10 km
                                                                                               such    for
                                                                                                     ash    the exposed population
                                                                                                         [32].
for all MSW incinerators
               However, in thestillcasegives
                                         of AD, negative
                                                 although ithealth
                                                               is not asimpacts      in theaslong-term
                                                                          energy efficient                    [34]. The
                                                                                                the other methods,    whichdisposal of
bottom ashcanand
               yieldfly
                      high
                        ashenergy
                             from potentials
                                     incinerators with into
                                                        high landfills
                                                              environmental      costs, athe
                                                                            remains          produced
                                                                                           serious       digestate may be
                                                                                                      environmental       issue due to
          beneficial to rural countries. The digestate contains a high proportion of nutrients and can be used as
the presence   of 8–12% ferrous metals and 0.5–1.5% non-ferrous metals in such ash [32].
            a fertilizer in agriculture and horticulture to avoid the use of chemical fertilizer.

                                          1500                                                                            800

                                                                                                                                Energy Potential (kWh/ton MSW)
                                                                                                                                                                                     200
              Plant Capacity (Tons/day)

                                                                                                                                                                       Million USD
                                          1200                                                                                                                                       150
                                                                                                                          600
                                             900                                                                                                                                     100
                                                                                                                          400
                                             600                                                                                                                                      50
                                                                                                                          200
                                             300                                                                                                                                      0

                                                    0                                                                     0

                                                            Plant Capacity                                 Energy Potential                                                                    Capital Cost
                                                                                                     (a)                                                                                          (b)
                                                    160                                                                                                                              120
                                                    120                                                                                                                               90
                                          USD/ton

                                                                                                                                                                       Months

                                                     80                                                                                                                               60
                                                     40                                                                                                                               30
                                                        0                                                                                                                             0

                                      O PEER
             Appl. Sci. 2020, 10, x FOR and MREVIEW
                                              Cost                                                                                                                                         Planning-to-Commissioning                     4 of 27

                                                                                                     (c)                                                                                          (d)

                                                                                                     250                                                                                         100
                                                                    Kg of CO2 eq per kWh generated

                                                                                                                                                                                                        Emissions gm per ton of waste

                                                                                                     200                                                                                         80
                                                                                                                                                                                                                 processed

                                                                                                     150                                                                                         60

                                                                                                     100                                                                                         40

                                                                                                      50                                                                                         20

                                                                                                       0                                                                                         0
                                                                                                            Anaerobic Gasification Incineration Landfill Gas
                                                                                                            Digestion                             Capture

                                                                                                     NOx    CO2 equivalents per Unit Power Generated                                            SO2          PM

                                                                                                                                                                 (e)
                  Figure 8. Comparison
      Figure 8. Comparison                of different
                                of different            waste-to-energy
                                                waste-to-energy         technologiesin
                                                                     technologies    interm
                                                                                        term of
                                                                                             of (a)
                                                                                                (a) plant
                                                                                                    plantcapacity
                                                                                                          capacityandand energy
                  energy potential (b) capital cost (c) operation and maintenance (O and M) cost, and (d) planning-to-
      potential (b) capital cost (c) operation and maintenance (O and M) cost, and (d) planning-to-commissioning
                  commissioning cost, and (e) emissions [15,35,55]. Note: Capital cost, O and M cost, and planning-to-
      cost, and (e) emissions [15,35,55].
                  commissioning  cost are basedNote:    Capital
                                                 on plant        cost, O and M cost, and planning-to-commissioning cost
                                                           capacity.
      are based on plant capacity.
             3.4. Dimensions, Challenges, Opportunities Related to Waste-to-Energy in Southeast Asia
                   Based primarily on the United Nations Environment Programme (UNEP) [42] and the World
             Bank [1], the dimensions related to the development of waste-to-energy technologies in Southeast
             Asian countries are illustrated in Table 4. The 13 indicated dimensions—namely (a) policy and
             institutions, (b) market development, (c) the cooperation of private sector, (d) the involvement of
             stakeholders, (e) the knowledge level of the nations, (f) skilled personnel and training facilities, (g)
Appl. Sci. 2020, 10, 7312                                                                                                                                                            18 of 25

     However, in the case of AD, although it is not as energy efficient as the other methods, which can
yield high energy potentials with high environmental costs, the produced digestate may be beneficial
to rural countries. The digestate contains a high proportion of nutrients and can be used as a fertilizer
in agriculture and horticulture to avoid the use of chemical fertilizer.

3.4. Dimensions, Challenges, Opportunities Related to Waste-to-Energy in Southeast Asia
      Based primarily on the United Nations Environment Programme (UNEP) [42] and the World
Bank [1], the dimensions related to the development of waste-to-energy technologies in Southeast Asian
countries are illustrated in Table 4. The 13 indicated dimensions—namely (a) policy and institutions,
(b) market development, (c) the cooperation of private sector, (d) the involvement of stakeholders,
(e) the knowledge level of the nations, (f) skilled personnel and training facilities, (g) public awareness,
(h) data availability and reliability, (i) technology, (j) financial resources, (k) culture and climate
impact, (l) the role of informal sector, and (m) research development—are considered. It has been
observed that most Southeast Asian countries, except for Singapore, Malaysia and Thailand, are at a
development stage regarding the indicated dimensions. However, as mentioned above, due to the
targeted promotion of renewable energy share to the total primary energy supply in each country
across the region, most dimensions are expected to reach a higher degree, namely policy and institution,
all stakeholder involvement, the cooperation of the private sector, and research and development.
Additionally, the regionalized cooperation and collaboration among the governments of Southeast
Asian countries can help enhance the development of the indicated dimensions in the region.

        Table 4. Status of dimensions related to the development of waste-to-energy technologies [1,5,9,10,12,13,22,30,42].
                                                                                        Skilled                    Data
                                              Cooperation   Involvement                                                                                 Culture and    Role of
                  Policy and      Market                                 Knowledge    Personnel      Public     Availability                Financial                            Research and
  Description                                  of Private       of                                                             Technology                Climate      Informal
                 Institutions   Development                                Level     and Training   Awareness      and                      Resources                            Development
                                                 Sector     Stakeholders                                                                                  Impact       Sector
                                                                                       Facilities               Reliability
    Brunei                                                                                                                                                  √
                      L             L             L             L           L             L            L             L             L           L                         H            L
  Darussalam
                                                                                                                                                            √
   Cambodia           L             L             L             L           L             L            L             L             L           L                         H            L
                                                                                                                                                            √
   Indonesia         M              M             M             L           L             L            L            M              L           M                         H            L
                                                                                                                                                            √
    Lao PDR           L             L             L             L           L             L            L             L             L           L                         H            L
                                                                                                                                                            √
    Malaysia         M              M             M             M           L             L            L            M              M           M                         M            M
                                                                                                                                                            √
   Myanmar            L             L             L             L           L             L            L             L             L           L                         H            L
                                                                                                                                                            √
   Philippines        L             L             L             L           L             L            L             L             L           L                         H            L
                                                                                                                                                            √
   Singapore          H             H             H             H           H             H            H             H             H           H                         -            H
                                                                                                                                                            √
    Thailand         M              M             M             M           L             L            L            M              M           M                         M            M
                                                                                                                                                            √
    Vietnam          M              M             L             L           L             L            L             L             L           L                         H            M

                                                                      Note: L: low; M: median; H: high.

      A summary of challenges and opportunities related to the development of the waste-to-energy sector
in the region is shown in Table 5. Four aspects were considered for challenges and opportunities—technical
aspects, financial aspects, environmental aspects, and social and political aspects. On one hand, it was found
that some Southeast Asian countries such as Singapore, Malaysia, and Thailand have made a reasonably
successful step toward waste-to-energy technologies, but the development of the waste-to-energy sector in
Cambodia, Laos PDR, and Myanmar still encounters big challenges such as a lack of policies and programs
related to MSW management, limited budget allocation, a lack of co-operation between stakeholders, and a
limited awareness and behavior of people related to the concept of sustainable cities/green cities. [16,42].
Hence, most of the challenges are often complicated, and it may take a long time to create large-scale
waste-to-energy processes in these countries.
      On the other hand, there are several favorable opportunities that can be had from waste-to-energy
technologies. These opportunities account for renewable energy supply, resource conservation, revenue,
profits, carbon credits, inclusive growth, community empowerment, green job creation, enterprise
development, and education and training opportunities for vocational education, etc. [2,15,32,42].
The key drivers for overcoming the challenges and opening opportunities in the region are the
movement to the green and sustainable cities, changes of government policy and regulations,
regionalized cooperation and coordination among the governments, all stakeholder involvement,
public–private partnerships, and cooperation with international organizations including the UNEP,
You can also read