A Systematic Review of Salt Reduction Initiatives Around the World: A Midterm Evaluation of Progress Towards the 2025 Global Non-Communicable ...
←
→
Page content transcription
If your browser does not render page correctly, please read the page content below
REVIEW

                                                                                                                                                                                                     Downloaded from https://academic.oup.com/advances/advance-article/doi/10.1093/advances/nmab008/6159028 by guest on 22 May 2021
A Systematic Review of Salt Reduction Initiatives
Around the World: A Midterm Evaluation of
Progress Towards the 2025 Global
Non-Communicable Diseases Salt Reduction Target

Joseph Alvin Santos,1 Dejen Tekle,1 Emalie Rosewarne,1 Nadia Flexner,2,3 Laura Cobb,4 Ayoub Al-Jawaldeh,5
Warrick Junsuk Kim,6 Joao Breda,7 Stephen Whiting,7 Norm Campbell,8 Bruce Neal,1 Jacqui Webster,1 and Kathy Trieu1
1 The George Institute for Global Health, University of New South Wales, Newtown, NSW, Australia; 2 University of Toronto, Toronto, Ontario, Canada; 3 Pan
American Health Organization—World Health Organization Regional Office for the Americas, Washington, DC, USA; 4 Resolve to Save Lives, An Initiative of
Vital Strategies, New York City, NY, USA; 5 World Health Organization Regional Office for the Eastern Mediterranean, Cairo, Egypt; 6 World Health Organization
Regional Office for the Western Pacific, Manila, Philippines; 7 World Health Organization Regional Office for Europe, Copenhagen, Denmark; and 8 University
of Calgary, Alberta, Canada

  ABSTRACT
In 2013, the WHO recommended that all member states aim to reduce population salt intake by 30% by 2025. The year 2019 represents the midpoint,
making it a critical time to assess countries’ progress towards this target. This review aims to identify all national salt reduction initiatives around the
world in 2019, and to quantify countries’ progress in achieving the salt reduction target. Relevant data were identified through searches of peer-
reviewed and gray literature, supplemented with responses from prefilled country questionnaires sent to known country leads of salt reduction
or salt champions, WHO regional representatives, and international experts to request further information. Core characteristics of each country’s
strategy, including evaluations of program impact, were extracted and summarized. A total of 96 national salt reduction initiatives were identified,
representing a 28% increase in the number reported in 2014. About 90% of the initiatives were multifaceted in approach, and 60% had a regulatory
component. Approaches include interventions in settings (n = 74), food reformulation (n = 68), consumer education (n = 50), front-of-pack labeling
(n = 48), and salt taxation (n = 5). Since 2014, there has been an increase in the number of countries implementing each of the approaches, except
consumer education. Data on program impact were limited. There were 3 countries that reported a substantial decrease (>2 g/day), 9 that reported
a moderate decrease (1–2 g/day), and 5 that reported a slight decrease (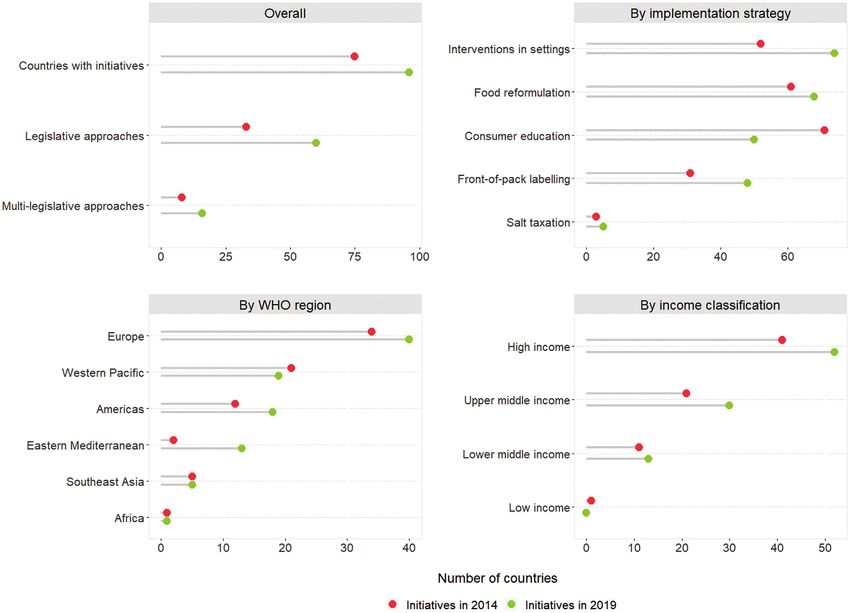
is therefore considered a priority action for all countries.                                           CRD42019133145. The study was approved by the University
In 2014, a systematic review of salt reduction initiatives                                             of New South Wales’ Human Research Ethics Committee
around the world (11) reported that a total of 75 countries                                            (HC190243).
had national salt reduction initiatives in place, twice the
number reported in 2010 (12). The approaches comprised                                                 Identification of countries with national salt reduction
food reformulation to reduce the salt content of products,                                             strategies
consumer education, front-of-pack labeling schemes, salt                                               Search strategy.
taxation, and interventions in settings (11). A subsequent                                             The search strategy employed in the previous review was
review reported the effects of these national-level initiatives                                        followed (11). Briefly, national salt reduction initiatives were

                                                                                                                                                                          Downloaded from https://academic.oup.com/advances/advance-article/doi/10.1093/advances/nmab008/6159028 by guest on 22 May 2021
in reducing salt consumption (13). In recognition that                                                 identified through a series of steps designed to maximize
not all salt reduction interventions are conducted at the                                              coverage. First, a search for published literature was con-
national level, another review of state- and community-level                                           ducted using MEDLINE, EMBASE, the Cochrane Central
initiatives demonstrated that these actions were also effective                                        Register of Controlled Trials, the Cochrane Database of
(14), although it is notable that most of the interventions                                            Systematic Reviews, the Cochrane Public Health Group
were carried out in high-income countries. In 2016, the                                                Specialized Register, the Trials Register of Promoting Health
WHO published the SHAKE Technical Package for Salt                                                     Interventions, the Effective Public Health Practice Project,
Reduction, to further support member states in carrying                                                Web of Science, and the Latin American and Caribbean
out salt reduction strategies through 5 key action areas:                                              Health Sciences Literature database between January 2014
surveillance, harnessing industry, adopting standards for                                              and December 2019. The search comprised 2 groups of
labeling, knowledge, and environment (15). This was pub-                                               terms: 1) dietary salt or sodium; and 2) salt reduction
lished with the view that countries would adapt, implement,                                            implementation strategies, including food reformulation, salt
and translate this knowledge into effective policies and                                               taxes, nutrition policies and interventions in settings, front-
interventions. Continuous monitoring and evaluations of salt                                           of-pack food labeling, and consumer education. Second,
reduction initiatives are essential for knowledge sharing and                                          a search for gray literature was carried out using Open
identifying areas that require support.                                                                Grey, Google Scholar, and institutional websites, including
    The objective of this review is to identify national salt                                          the WHO regional office databases, WHO NCD document
reduction initiatives around the world in 2019, with a                                                 repository, Caribbean Food and Nutrition Institute, Center
view to quantify and describe countries’ progress in the                                               for Science in the Public Interest, World Action on Salt
implementation of salt reduction initiatives since the last                                            and Health, World Cancer Research Fund NOURISHING
review in 2014. This is critical, as 2019 is the midway point                                          database, CDC, Institute of Medicine, and Public Health
between the year the global salt target was endorsed (2013)                                            Agency of Canada resources. Supplemental Table 1 lists
and the year it should be achieved (2025).                                                             the full search strategy used in MEDLINE, which was
                                                                                                       adapted to take into account differences in syntax rules across
Methods                                                                                                databases. The search was not restricted by language or study
The systematic review protocol was registered at the In-                                               type.
ternational Prospective Register of Systematic Reviews as
                                                                                                       Study selection and data extraction.
The authors reported no funding received for this study.                                               Articles identified from the online searches were exported to
Author disclosures: JAS is supported by a National Health and Medical Research Council                 EndNote X9 (Clarivate Analytics). Two authors (JAS and DT)
(NHMRC) Postgraduate scholarship (1168948). ER is supported by a University of New South
Wales University Postgraduate Award (00889665). NC was a paid consultant to the Novartis
                                                                                                       independently screened the titles, abstracts, and the full texts
Foundation (2016–2017) to support their program to improve hypertension control in low- to             of potentially relevant articles based on the inclusion and
middle-income countries, which includes travel support for site visits and a contract to develop       exclusion criteria detailed below. Disagreements at any stage
a survey; has provided paid consultative advice on accurate blood pressure assessment to
Midway Corporation (2017); and is an unpaid member of World Action on Salt and Health. JW
                                                                                                       of the screening process were resolved through consultation
is the Director of the WHO Collaborating Centre on Population Salt Reduction; is supported by          with a third review author (KT). Data extraction was then
a National Heart Foundation Career Development Fellowship (1082924); and receives                      carried out by 1 review author (JAS), and a second reviewer
additional funding for work on salt reduction from NHRMC, the Victorian Health Promotion
Foundation, Vital Strategies, and the WHO. KT is supported by an NHMRC Early Career
                                                                                                       (KT) checked the data for accuracy. Inconsistencies were
Fellowship (1161597) and a Postdoctoral Fellowship (102140) from the National Heart                    resolved through discussion until consensus was reached.
Foundation of Australia. BN, JW, and KT are supported by NHMRC Centre of Research                      Included studies were organized according to the country of
Excellence on food policy interventions to reduce salt (1117300). AA-J, WJK, JB, and SW are
staff members of the WHO. DT, NF, and LC, no conflicts of interest.
                                                                                                       study; for each country, standard information relating to the
The writing group takes sole responsibility for the content of this article, and the content of this   core characteristics of the national salt reduction initiatives
article reflects the views of the authors only. The WHO is not liable for any use that may be          was extracted, similar to the process used in previous reviews
made of the information contained therein.
Supplemental Tables 1 and 2 and Supplemental Material 1 and 2 are available from the
                                                                                                       (11, 12). This included information regarding: 1) leadership
“Supplementary data” link in the online posting of the article and from the same link in the           and strategic approach; 2) baseline assessments and mon-
online table of contents at https://academic.oup.com/advances/.                                        itoring; 3) implementation strategies; and 4) evaluation of
Address correspondence to JAS (e-mail: jsantos@georgeinstitute.org.au).
Abbreviations used: CVD, cardiovascular disease; DALY, disability-adjusted life year; KAB,
                                                                                                       program impact. Supplemental Material 1 provides more
knowledge, attitudes, and behaviors; NCD, noncommunicable disease; NGO, nongovernmental                details on the data extracted from each study. The extracted
organization.                                                                                          information was used to update the Database of National Salt

2    Santos et al.
Reduction Initiatives, which was established during the 2014 Data analysis
review (11). The synthesis of findings based on all country information
collected was divided into 2 stages. First, for countries
Verifying information from country or regional program identified as having a national salt reduction initiative in the
leaders and global experts in salt reduction. previous review, the analysis concentrated on summarizing
The questionnaire used in the previous review to verify the evidence of implementation since, identifying changes
and supplement the details of a country’s salt reduction in the strategy, monitoring the country’s progress in salt
initiative was refined and pilot tested with 4 countries (Sup- reduction, and evaluating the impact of the program. Second,
plemental Material 2). Questionnaires were prefilled with for newly identified countries, the analysis focused on
Downloaded from https://academic.oup.com/advances/advance-article/doi/10.1093/advances/nmab008/6159028 by guest on 22 May 2021
existing information from the database (i.e., information examining the core characteristics of the initiative, including
from the previous review and new data from the online government involvement and leadership, baseline assess-
searches) for each country. The questionnaire was sent to ments that informed the strategy, implementation strategies,
70 known country leads of salt reduction initiatives from and evaluations of the impact. Further, the national salt
governments and nongovernmental organizations (NGO) or reduction initiatives were classified as being either planned
salt champions who were mainly involved in the development (the action plan is still being developed; the action plan
or implementation of the country’s salt reduction initiative. has been developed but there was no evidence of program
They were asked to review and add further details to the implementation; or all the implementation approaches are
questionnaire. Furthermore, global experts in salt reduction still in the planning phase) or implemented (with at least
and regional program leaders (mainly WHO representatives) 1 type of strategy being implemented, regardless of whether
were contacted to identify any other countries with salt the other implementation strategies are in the planning
reduction initiatives not captured by the searches, and to pass phase). Data were also analyzed by the country’s region based
on the questionnaire to their contacts to gather more in- on the WHO regional classification (16) and by the country’s
formation. Additional data acquired from the questionnaire income level based on the 2019 World Bank classification
responses were used to update the database. (17).
Inclusion and exclusion criteria
Articles of any type were considered if they provided Results
information relevant to the development, implementation, Search results and sources of information
progress, monitoring, or evaluation of salt reduction initia- The initial peer-reviewed and gray literature search identified
tives that were national in approach and aimed at reducing 148 articles with relevant information. An additional 128
population salt intake. As with the previous review (11), documents or web pages were obtained through contact
a national salt reduction initiative was defined as having with salt reduction program leaders, WHO regional repre-
government involvement and at least 1 of the following sentatives, or international experts in salt reduction, and by
components: 1) a document or statement highlighting the review of reference lists of included studies. Furthermore,
country’s plan of action to reduce the population-level salt out of the 70 country questionnaires sent to known country
intake; 2) a program that involves work with the food contacts, 35 returned the questionnaire (50% response rate).
industry to decrease salt levels in foods; 3) a consumer Overall, in 2019 there were 96 national salt reduction
education or awareness campaign to improve knowledge, initiatives identified (68 ongoing since 2014 and 28 newly
attitudes, and behaviors (KAB) towards salt specifically; 4) identified; Figure 1), with an additional 16 countries in their
a salt-specific front-of-pack labeling scheme; 5) a policy planning stages.
that involves taxing salt, high-salt foods, or unhealthy Of the 75 countries with national salt reduction initiatives
foods, where the definition of unhealthy includes high salt in 2014, evidence of ongoing implementation was uncertain
or sodium; or 6) salt-related initiatives in settings (e.g., for 7 countries (i.e., no information was found from the
food procurement policies with a salt criteria, voluntary search or through contact with stakeholders). Of the re-
guidelines for reducing salt content for foods, education maining 68 countries, information about progress or changes
regarding salt, menu labeling) such as schools, hospitals, to the strategies since 2014 was confirmed for 30 through
workplaces, government offices, and food chains or outlets. returned questionnaires; for other countries, information
Studies were deemed ineligible if they only provided baseline was obtained from the documents or webpages retrieved.
assessments of salt intake, salt levels in foods, KAB, or In addition, unless there was any evidence of change or
sources of salt in the diet, or if the primary purpose was discontinuation, countries with initiatives that incorporated
expanding the evidence base on salt but without a discussion mandatory regulations or structural approaches, such as tar-
about developing or implementing a salt reduction initia- gets for salt levels in foods (mandatory or voluntary), front-
tive. Countries that only implemented consumer awareness of-pack labeling (mandatory or voluntary), salt taxation, and
campaigns where salt reduction messages were part of procurement policies or voluntary guidelines in settings were
broader nutrition or healthy-eating topics (i.e., not salt- assumed to have continued with these approaches.
specific) were not considered to have a national salt reduction Of the 28 new countries in the implementation phase,
initiative. 3 were verified through completed questionnaires, while
Salt reduction initiatives around the world in 2019 3FIGURE 1 Identification of national salt reduction strategies around the world. Downloaded from https://academic.oup.com/advances/advance-article/doi/10.1093/advances/nmab008/6159028 by guest on 22 May 2021
the rest was based on information from the search or of 2 or more implementation strategies (Figure 2).
communication with stakeholders. Lastly, information on Interventions in settings were the most common approach,
16 countries currently in the planning phase to implement with 74 countries (77%) implementing this type of
a salt reduction initiative was obtained from the search strategy. This was followed by food reformulation through
and documents provided by stakeholders, with 2 confirmed engagement with the food industry (68/96; 71%), consumer
through returned questionnaires. education interventions (50/96; 52%), front-of-pack labeling
schemes (48/96; 50%), and salt taxation (5/96; 5%).
Characteristics of national salt reduction initiatives Supplemental Table 2 shows the detailed activities for each
Of the 96 national salt reduction initiatives, 89 (93%) were implementation strategy of the 96 national salt reduction
multifaceted in approach, characterized by a combination initiatives.
4 Santos et al.Downloaded from https://academic.oup.com/advances/advance-article/doi/10.1093/advances/nmab008/6159028 by guest on 22 May 2021
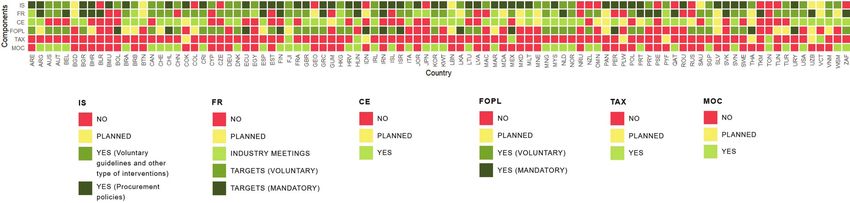
FIGURE 2 Characteristics of national salt reduction initiatives around the world (n = 96). For IS, some countries implemented multiple
initiatives in different settings. If at least 1 initiative is a procurement policy, then IS was marked as “YES (procurement policies)” in this
figure. The same rule applies to FR and FOPL (if at least 1 initiative is mandatory). MOC refers to changes in either salt intake, salt levels in
foods, or KAB towards salt, that were measured using the same methods (i.e., comparable methods of assessment over time). The specific
activities for each implementation strategy per country, the details on the measures of change, and the sources of information are shown
in Supplemental Table 2. Abbreviations: CE, consumer education; FOPL, front-of-pack labeling; FR, food reformulation; IS, interventions in
settings; KAB, knowledge, attitudes, and behaviors; MOC, measure of change; TAX, salt taxation.
r Interventions in settings. There were 74 countries with (n = 50) or planned (n = 11) consumer education pro-
existing initiatives that target salt reduction in settings, grams that include a salt reduction component since
while a further 6 countries were in the planning 2014. All but 1 country were implementing or planning
phase. Most countries (50/74) were implementing a to implement this intervention in conjunction with
mix of interventions in multiple settings. The majority other strategies. Of the 50 existing consumer education
of interventions were targeted at schools (70/74), programs, 38 were led solely by the government, 3 led
followed by workplaces (25/74), fast-food chains or solely by an NGO, and 9 by shared leadership between
restaurants (21/74), hospitals (19/74), government the government, an NGO, or the food industry.
offices (14/74), and other settings (9/74). Healthy r Front-of-pack labeling. There were 48 countries with
food procurement policies (44/74), voluntary nutrition a front-of-pack labeling scheme that accounts for
guidelines (29/74), and education (25/74) were the sodium or salt content, while an additional 16 coun-
most common interventions in these settings. tries were in the planning phase. A mandatory ap-
r Food reformulation. In all, 68 countries were working proach has been adopted in 12 countries through
with the food industry: 11 countries had meetings warning labels (6/12), traffic lights (4/12), health mes-
and/or voluntary agreements to lower salt levels in sages (3/12), and percentage daily intake or guideline
foods, and 57 countries had taken the next step daily amount (2/12). In addition, 41 countries have
and established salt targets. Thirteen countries were voluntary schemes (5 countries have both mandatory
planning to implement food reformulation strategies. and voluntary schemes in place). These included
Of the 57 countries with salt targets, 19 have mandatory endorsement logos and symbols (19/41), percentage
maximum salt limits for foods. Half of these coun- daily intake or guideline daily amount (15/41), traffic
tries set mandatory targets solely for bread (Bahrain, lights (7/41), ratings (3/41), and health messages
Belgium, Hungary, Netherlands, Palestine, Paraguay, (2/41). Examples of endorsement logos and symbols
Portugal, Qatar, Spain, and Turkmenistan), while the used in different countries were the healthy choices
other half covered a wider range of foods, including logo (Belgium, Czechia, Malaysia, Poland, and Thai-
processed meats, cheeses, crisps and snacks, soups land), the keyhole logo (Denmark, Iceland, Lithuania,
and stocks, canned fish, tomato products, and fruit Norway, and Sweden), the heart symbol (Finland),
and vegetables (Argentina, Belarus, Bulgaria, Finland, the healthy living guarantee mark (Croatia), and the
Greece, Iran, Slovakia, South Africa, and Uzbekistan). protective food logo (Slovenia). Rating systems such as
There were 48 countries with voluntary salt targets in the Health Star Rating and Nutri-score were being used
place, with a range in the number of food categories in Australia and New Zealand, and France respectively.
and type of products (within categories) being targeted r Salt taxation. There were 5 countries—Fiji, Hun-
for reformulation. Finally, 10 countries have a mix gary, Mexico, Saint Vincent and the Grenadines, and
of mandatory and voluntary salt targets in their food Tonga—that adopted taxes on foods high in salt. In
reformulation scheme. these countries, the tax on high-salt foods is being
r Consumer education. While most countries imple- implemented as part of a broader set of taxes that
mented consumer awareness campaigns in relation to cover other nutrients or foods. In Fiji, import taxes
overall nutrition and health, 61 countries have initiated were applied to monosodium glutamate and palm
Salt reduction initiatives around the world in 2019 5Downloaded from https://academic.oup.com/advances/advance-article/doi/10.1093/advances/nmab008/6159028 by guest on 22 May 2021
FIGURE 3 Summary of progress in implementing salt reduction initiatives since 2014.
oil. In Hungary, a public health product tax is in in 2019. In terms of implementation strategy, there have
place, encompassing a variety of prepackaged foods, been increases in the number of countries implementing
including salty snacks and condiments that exceed interventions in settings (from 52 in 2014 to 74 in 2019),
recommended salt limits. In Mexico, an 8% tax applies food reformulation approaches (from 61 to 68), front-of-
to nonessential foods that exceed energy density limits, pack labeling schemes (from 31 to 48), and salt taxation (from
including salty snacks. In Saint Vincent and the 3 to 5) (Figure 3). More specifically, more countries are now
Grenadines, a 15% value-added tax was placed on salt, implementing mandatory targets (from 9 to 19) or voluntary
sugar, and sweetened beverages in 2016. In Tonga, an (from 36 to 48) targets for salt content in foods, mandatory
excise tax on unhealthy foods, including turkey tails, (from 8 to 12) or voluntary (from 26 to 41) front-of-pack
mutton flaps, chicken legs, and other high-salt foods, labeling schemes, and procurement policies (from 23 to 44)
such as instant noodles, was introduced in 2015. An or voluntary nutrition guidelines (from 19 to 29) in settings.
additional 5 countries (Cook Islands, French Polynesia, In contrast, the number of countries reporting consumer
Indonesia, Palau, and Thailand) were considering salt education programs fell from 71 in 2014 to 50 in 2019.
taxation. In Thailand, the government proposed a
salt tax (2019) that will target salty foods such as
National salt reduction initiatives by WHO region
frozen products, canned foods, and instant noodles.
Of the 96 national salt reduction initiatives identified, 40 were
In Portugal, a proposed tax on foods high in salt was
in Europe, 19 in the Western Pacific, 18 in the Americas,
considered in 2018 but ultimately not approved by the
13 in the Eastern Mediterranean, 5 in Southeast Asia, and 1 in
Parliament.
Africa. Since 2014, there have been increases in the number
of initiatives in Europe (by 6), the Americas (by 6), and the
Implementation progress since 2014 Eastern Mediterranean (by 11); no changes in Africa and
Overall, there has been a 28% increase in the number of Southeast Asia; and there has been a decrease in the number
national salt reduction initiatives, from 75 in 2014 to 96 of initiatives in the Western Pacific (by 2; Figure 3).
6 Santos et al.Downloaded from https://academic.oup.com/advances/advance-article/doi/10.1093/advances/nmab008/6159028 by guest on 22 May 2021
FIGURE 4 Summary of progress in implementing salt reduction initiatives by WHO region. Abbreviations: AFRO, Regional Office for
Africa; AMRO, Regional Office for the Americas; CE, consumer education; EMRO, Regional Office for the Eastern Mediterranean; EURO,
Regional Office for Europe; FOPL, front-of-pack labeling; FR, food reformulation; IS, intervention in settings; SEARO, Regional Office for
Southeast Asia; TAX, salt taxation; WPRO, Regional Office for the Western Pacific.
r Europe. In this region, 40/53 (75%) countries/ r Americas. In the Americas, 18/49 (37%)
territories have existing national salt reduction countries/territories have a national salt reduction
initiatives. An additional 5 countries were in the initiative, with a further 6 countries in the planning
planning phase, including Luxembourg, which was stage, and 24 without an initiative. One country
identified as implementing an initiative in 2014, (Cuba) was previously identified in 2014, but we
but no evidence of continuing implementation was found no evidence of implementation since. The
found since. However, the country’s recent National main implementation approaches [interventions
Nutrition Plan (2018–2025) includes a proposal in settings (16/18); food reformulation approaches
to create a working group to develop strategies to (12/18); consumer education (11/18); and front-of-
reduce salt levels in foods. There were 8 countries pack labeling (8/18)] were similar to those in the
with no identified initiative. Interventions in settings other regions. Of all the regions, the Americas has the
(34/40) and food reformulation (30/40) were the most highest number of mandatory front-of-pack labeling
commonly used approaches, followed by front-of-pack schemes (n = 6).
labeling (25/40; Figure 4). Across all regions, Europe r Eastern Mediterranean. From only 2 countries identi-
has the highest number of countries implementing fied in the previous review, this region now has 13/22
mandatory targets for salt levels in foods (n = 12). (59%) countries with a national salt reduction initia-
r Western Pacific. In this region, 19/37 (51%) coun- tive. All 13 countries work with the food industry to
tries/territories/areas have national salt reduction ini- reduce salt levels in foods, through meetings or agree-
tiatives in place, including 3 new initiatives (Guam, ments (5/13), voluntary targets for food categories
Hong Kong, and Macao) since the 2014 review; there (4/13), and/or mandatory targets (4/13). In this region,
is also 1 initiative in the planning phase (Vanu- 5 countries have implemented consumer education
atu). There were 12 countries/territories/areas with programs, 7 countries carry out work in settings, and
no identified initiative. There were 5 Pacific Island 3 countries have a front-of-pack labeling scheme.
countries (Federated States of Micronesia, Marshall r Southeast Asia. As in 2014, 5/11 (45%) countries have a
Islands, New Caledonia, Solomon Islands, and Tuvalu) national salt reduction initiative in this region, 2 are in
identified to be conducting industry meetings and/or the planning stage and 4 are without an initiative. There
consumer awareness campaigns in 2014, but we found are 3 countries implementing consumer education
no evidence of continuing implementation of these programs and front-of-pack labeling schemes, while all
activities since; therefore, these countries were not 5 with initiatives are in the planning phase to carry out
counted, which explains the decline in the number food reformulation strategies.
of identified initiatives in this region. Interventions in r Africa. The only country with a national salt reduction
settings (15/19), food reformulation through industry initiative in this region is South Africa (1/47; 2%),
meetings and voluntary targets for salt levels in foods although 2 countries (Ethiopia and Nigeria) are in the
(12/19), and consumer education programs (12/19) planning phase. South Africa has mandatory targets for
were the main approaches, followed by voluntary front- salt levels in foods, a voluntary front-of-pack labeling
of-pack labeling (8/19). scheme, and consumer education programs.
Salt reduction initiatives around the world in 2019 7Downloaded from https://academic.oup.com/advances/advance-article/doi/10.1093/advances/nmab008/6159028 by guest on 22 May 2021 FIGURE 5 Summary of progress in implementing salt reduction initiatives by income classification. Abbreviations: CE, consumer education; FOPL, front-of-pack labeling; FR, food reformulation; IS, intervention in settings; TAX, salt taxation. National salt reduction initiatives by income from 12/75 in 2014), change in salt content of foods (31/96, classification from 19/75), and change in KAB towards salt (19/96, from Using the World Bank’s 2019 income classification, national 7/75). In terms of change in salt intake, 11 countries salt reduction initiatives are now in place in 52 high- reported changes using 24-hour urine samples; 10 using income countries (from 41 in 2014), 30 upper-middle– dietary-based assessment methods, such as 24-hour dietary income countries (from 21), 13 lower-middle–income coun- recalls and food records; 2 based on total diet studies; tries (from 11), and 1 country that is unclassified. Apart 1 using spot urine samples; and 1 using unspecified methods from salt taxation, which is missing from lower-middle– (Table 1). Based on these data, 3 countries reported a income countries, all forms of implementation strategies are substantial decrease (>2 g/day), 9 a moderate decrease (1– present in the 3 income groups. Interventions in settings 2 g/day), and 5 a slight decrease (
TABLE 1 Countries with reported data on change in mean salt intake over time

                                                                                                                    Change in salt intake, g;
           Country (Reference)                       Timescale                  Assessment method                percent change from baseline
           Argentina (18)                            2011–2015                  24-hour urine                   11.2g to 9.2g; −18%
           Australia1 (19)                           2011–2014                  24-hour urine                   Victoria
                                                                                                                7.9g to 7.8g; −1%
           Austria (20)                             2008–2012                   24-hour diet recall             8.3g to 8.2g; −1%
           Canada (21)                              2004–2015                   24-hour diet recall             8.5g to 6.9g; −19%
           China (22)                              2000–2009/12                 Total diet study                11.8g to 9.1g; −23%

                                                                                                                                                                  Downloaded from https://academic.oup.com/advances/advance-article/doi/10.1093/advances/nmab008/6159028 by guest on 22 May 2021
           Denmark (11)                             2006–2010                   Spot urine                      M: 10.7g to 9.9g; −7%
                                                                                                                F: 7.5g to 7.0g; −7%
           Fiji (23)                             2012/13–2015/16                24-hour urine                   11.7g to 10.3g; −12%
           Finland1 (20, 24)                        1979–1987                   24-hour urine                   Kuopio area
                                                                                                                M: 13.1g to 12.0g; −8%
                                                                                                                F: 10.4g to 9.5g; −9%
                                                     1979–2002                                                  North Karelia
                                                                                                                M: 12.9g to 9.5g; −26%
                                                                                                                F: 10.4g to 7.4g; −29%
                                                     1982–2002                                                  Southwestern Finland
                                                                                                                M: 11.6g to 9.8g; −16%
                                                                                                                F: 9.1g to 7.4g; −19%
           France (20)                           1998/99–2015/16                7-day food record               8.0g to 7.5g; −6%
           Iceland (11, 25)                       2002–2010/11                  24-hour diet recall             8.4g to 7.9g; −6%
           Ireland (11)                             2001–2011                   4-day food record               8.1g to 7.0g; −14%
           Italy (26)                             2009/10–2012                  24-hour urine                   M: 10.6g to 9.3g; −12%
                                                                                                                F: 8.3g to 7.2g; −13%
           Japan (27)                               2011–2017                   Dietary record                  9.9g to 9.4g; −5%
           Lithuania (11, 28)                      2007–2013/14                 24-hour diet recall             8.8g to 7.1g; −19%
           Netherlands (29)                         2006–2015                   24-hour urine                   M: 9.9g to 9.7g; −2%
                                                                                                                F: 7.9g to 7.4g; −6%
           New Zealand (30)                          2009–2016                  Total diet study                M: 7.3g to 7.2g; −1%
                                                                                                                F: 5.1g to 5.2g; +2%
           Portugal (31)                             Unknown                    Unknown                         −1.7g reduction
           Samoa (32)                                2013–2015                  24-hour urine                   7.3g to 7.5g; +3%
           Singapore (Q2019)                         1998–2018                  Dietary survey                  9.0g to 9.0g; 0%
           Slovenia (33)                             2007–2012                  24-hour urine                   M: 14.3g to 12.9g; −10%
                                                                                                                F: 11.0g to 10.7g; −3%
           South Korea (34)                         2005–2015                   Dietary survey                  13.2g to 9.7g; −27%
           Switzerland (20)                         1984–2011                   24-hour urine                   8.4g to 9.2g; +10%
           Turkey (35)                              2008–2012                   24-hour urine                   18.0g to 15.0g; −17%
           United Kingdom (36)                    2005/6–2018/19                24-hour urine                   8.1g to 7.5g; −7%
           United States (37, 38)                2011/12–2015/16                24-hour diet recall             8.7g to 8.5g; −2%
           Includes data on changes in salt intake measured using comparable assessment methods over time. Abbreviations: F, female; M, male; Q2019,
           information obtained from country questionnaire 2019.
           1
             Change in salt intake measured at the subnational level.

Discussion                                                                        that more countries are now reporting data on changes
This review demonstrated that there has been an increase                          in salt intake (25/96), it is important to note that some
in the number of countries with national salt reduction                           of the reported data were at the subnational level and
initiatives from 2014 to 2019. While the relative increase                        some were outdated, while less than half of the countries
from 2010 to 2014 (134% increase) shown in the previous                           employed the gold standard 24-hour urine collection. Some
review (11) was considerably larger compared to what was                          countries have data available over multiple periods but
recorded in our current review (28% increase from 2014                            the methods of assessment were not comparable between
to 2019), the existing national salt reduction initiatives in                     time points; hence, these data were excluded from our
2019 (n = 96) represent about 50% of all the Member                               analyses. While 17 countries have demonstrated a slight
States of the United Nations. However, despite the increase                       (2 g/day) decrease in salt intake
in the number of countries adopting strategies to reduce                          over time, none have yet met the targeted 30% relative
their population-level salt intake, more action is needed to                      reduction in mean salt intake from baseline or achieved
ensure that countries monitor and evaluate their strategies,                      the recommended daily limit of 5 g/day. An in-depth
and accelerate their efforts to achieve the targeted 30%                          evaluation of changes in salt intake as a result of population-
reduction in salt intake. While it is encouraging to see                          level salt reduction interventions will be published in a

                                                                                                        Salt reduction initiatives around the world in 2019   9
separate review. More regular evaluations of national salt initiatives in the Americas and European regions, with over a
reduction initiatives are needed to understand what works; third and 75% of countries in the regions, respectively, having
particularly, interim evaluations are needed during the life of a national salt reduction initiative. These 2 regions also have
the strategy (rather than just at the end of the intervention) the highest numbers of countries that are currently in the
so that necessary adaptations can be made to ensure the planning stages (6 and 4, respectively). The increases in the
strategy effectively reduces salt intake (39, 40). As measuring number of initiatives in these 2 regions may be attributed to
changes in population salt intake regularly is complex and their ongoing regional collaboration, facilitated by the WHO
costly, process evaluations that examine the implementa- European Salt Action Network, and the Pan American Health
tion progress, process indicators, and existing barriers and Organization and the Network of Action on Strategies for
Downloaded from https://academic.oup.com/advances/advance-article/doi/10.1093/advances/nmab008/6159028 by guest on 22 May 2021
facilitators of implementation are likely more feasible and Reducing Sodium Consumption and Prevention and Control
informative for identifying those areas requiring adaptation of Cardiovascular Disease in the Americas and the Caribbean
(40). (47, 48). In contrast, there have been no changes in the
The main implementation strategies were interventions Southeast Asian and African regions, although this may be
in settings, food reformulation, consumer education, front- partially due to gaps in the published literature and fewer
of-pack labeling, and salt taxation. There has been an completed country questionnaires (n = 2). Lastly, in the
increase in the number of countries applying each of these Western Pacific region, there were 5 Pacific Island countries
approaches since 2014, apart from consumer education. where we were unable to find evidence of continuing
The notable decline in consumer education programs (30% implementation since 2014. We speculate that this is due to
decrease) might be due in part to the lower rate of country the short-term nature of the implementation strategies (i.e.,
questionnaire responses in the current review compared industry meetings and/or consumer awareness campaigns)
to the previous review (50% and 79%, respectively), given identified in 2014 for these 5 countries, as well as a lack of
that much of the information about salt-specific consumer information from the literature and the absence of completed
awareness campaigns was previously obtained from the country questionnaires to assess whether these strategies
questionnaire. Another possible reason might be because were continuing. Unlike structural or policy-based initia-
consumer education is usually done at the start of an tives, we did not assume that these initiatives have continued
intervention but may not be maintained, since it is resource- since the last review. However, 3 new countries in the Western
and time-intensive (41, 42). However, the increases in uptake Pacific region were identified to have a salt reduction strategy
for the other approaches suggest that more countries are in place, which suggests that salt-related activities are present
now incorporating structural and policy-based initiatives— in the region, although the extent of implementation appears
focusing on changing the food environment—to make it eas- to vary across countries. The establishment of regional
ier for consumers to make better food choices and eat less salt. networks that facilitate knowledge sharing, particularly
In fact, in terms of regulatory approaches to salt reduction among countries with similar sources of salt and dietary
(i.e., mandatory targets for salt levels in foods, mandatory habits, may help increase adoption of national salt reduction
front-of-pack labeling, mandatory nutrition standards in initiatives.
settings, and salt taxation), the number of countries with such There have been increases in the number of national
measures increased by 82% since 2014; also, 16 countries salt reduction initiatives across income groups: by 27%,
have more than 1 type of regulation aimed at lowering salt 43%, and 18% from high-income, upper-middle–income,
intake, compared to 8 countries in 2014. Furthermore, of and lower-middle–income countries, respectively. In both
the 28 newly identified national salt reduction initiatives, the high-income and upper-middle–income groups, more
61% have a regulatory component. Previous systematic countries have incorporated some element of food refor-
reviews and modeling studies have shown that mandatory mulation, front-of-pack labeling schemes, and interventions
or legislative approaches may be more effective, and may in settings in their salt reduction initiative. With packaged
produce larger reductions in population salt intake (43–45). or processed foods recognized as contributing about 75%
Continuous monitoring and reporting of progress of each of the daily salt intake in many high-income countries,
intervention approach is essential to assess whether these and the increasing trend of processed food consumption
policies work, identify gaps, and understand how they can in lower-middle–income and upper-middle–income coun-
be better applied to lower salt intakes in populations with tries (49, 50), these strategies might bring more positive
different contexts and dietary sources of salt. changes in salt reduction in these contexts. However, in
As with the previous review, all WHO regions have countries where salt mainly comes from discretionary
national salt reduction initiatives in place. However, progress sources added by the consumer during cooking or at the
in terms of the number of initiatives varied markedly by table—a trend that is common in many low- and middle-
region. The Eastern Mediterranean region recorded the income countries—interventions that change consumer salt
largest increase since 2014 (from 2 to 13 countries), which practices or replace salt with salt substitutes might be more
reflects the concerted efforts led by the WHO Regional relevant. Nevertheless, a multi-component approach in salt
Office to provide a regional framework for action and to reduction—that considers structural or policy-based means
hold a series of meetings on reducing population salt intake together with consumer education—is recommended (43,
(46). Similarly, there have been increases in the number of 51, 52). Lastly, while we have seen positive developments
10 Santos et al.in the other income groups, there has been a gap in the Acknowledgments
implementation of national salt reduction initiatives in low- We thank the country contacts who responded to the
income countries. Although the contribution of high-salt questionnaire and provided additional information about
diet to cardiovascular disease burden is lowest in low- their national salt reduction initiatives. We would also like
income countries compared to the other income groups to acknowledge the WHO staff and global experts in salt
(53), additional support is still warranted to develop policies reduction, who helped to identify national salt reduction
and interventions to reduce excess salt intakes in low- initiatives and implementation strategies.
income countries, particularly those experiencing a nutrition The authors’ responsibilities were as follows—JW, KT,
transition towards greater intake of processed and packaged and JAS: conceived the paper; JAS: conducted the literature
Downloaded from https://academic.oup.com/advances/advance-article/doi/10.1093/advances/nmab008/6159028 by guest on 22 May 2021
foods. search, extracted the data, updated the Database of National
This review has a number of strengths and limitations. Salt Reduction Initiatives, prefilled the questionnaires, wrote
The work reported here builds on the growing Database the paper; JAS and DT: screened the titles and abstracts of the
of National Salt Reduction Initiatives established in 2014, articles and full texts; KT: checked the Database of National
updated through our comprehensive data collection ap- Salt Reduction Initiatives; JAS and KT: sent the questionnaire;
proach that involved a search of the peer-reviewed and KT and JW: gave substantial input on the paper; NF, LC, AA-
gray literature, contact with country program leaders or J, WJK, JB, SW, and NC: provided additional information
salt champions, and coordination with regional WHO about salt reduction initiatives; and all authors: reviewed
representatives and global experts in salt reduction. We and commented on versions of the manuscript and read and
triangulated multiple sources of data to understand the approved the final manuscript.
implementation of strategies, and the information obtained
from all the sources was documented in a standardized
manner. Through this, it is unlikely that any major national References
salt reduction initiatives have been missed, although we 1. Bennett J, Stevens G, Bonita R, Rehm J, Kruk M, Riley L, Dain K,
cannot exclude that possibility. The questionnaire from the Kengne A, Chalkidou K, Beagley J, et al. NCD countdown 2030:
Worldwide trends in non-communicable disease mortality and progress
2014 review was updated and revised based on the lessons towards sustainable development goal target 3.4. Lancet North Am Ed
learned from the 2014 questionnaire, and was pilot tested 2018;392:1072–88. doi:10.1016/S0140-6736(18)31992-5.
in 4 countries. However, we obtained a lower response rate 2. Global Burden of Disease 2017 Risk Factor Collaborators. Global,
(50%) in the current review, so we were unable to verify regional, and national comparative risk assessment of 84 behavioural,
some inconsistencies or obtain contemporary information environmental and occupational, and metabolic risks or clusters of
risks for 195 countries and territories, 1990–2017: a systematic analysis
about the state of salt reduction initiatives in some countries. for the global burden of disease study 2017. Lancet 2018;392(10159):
In addition, our review did not include subnational salt 1923–94.
reduction initiatives (apart from some interventions in public 3. Elliott P, Stamler J, Nichols R, Dyer AR, Stamler R, Kesteloot H,
institution settings), which also contribute to lower salt Marmot M. Intersalt revisited: further analyses of 24 hour sodium
intake. Risk of bias or quality assessments of the studies were excretion and blood pressure within and across populations. BMJ
1996;312(7041):1249–53.
deemed inapplicable given that multiple sources were used 4. Aburto NJ, Ziolkovska A, Hooper L, Elliott P, Cappuccio FP, Meerpohl
for each data point. JJ. Effect of lower sodium intake on health: Systematic review and meta-
In conclusion, the review showed a further increase in analyses. BMJ 2013;346:f1326–45. doi:10.1136/bmj.f1326%J BMJ.
the number of national salt reduction strategies around the 5. He FJ, Li J, Macgregor GA. Effect of longer term modest salt reduction
world, to 96 countries, since 2014. More countries are now on blood pressure: Cochrane systematic review and meta-analysis of
randomised trials. BMJ 2013;346:f1325–39. doi:10.1136/bmj.f1325.
opting for structural or regulatory implementation strategies, 6. Mozaffarian D, Fahimi S, Singh GM, Micha R, Khatibzadeh S, Engell
such as targets for salt levels in foods, food procurement RE, Lim S, Danaei G, Ezzati M, Powles J. Global sodium consumption
policies or nutrition standards in settings, front-of-pack and death from cardiovascular causes. NEJM 2014;371(7):624–34.
labeling schemes, and salt taxation. The WHO regions 7. Huang L, Trieu K, Yoshimura S, Neal B, Woodward M, Campbell
of the Eastern Mediterranean, Europe, and the Americas NRC, Li Q, Lackland DT, Leung AA, Anderson CAM, et al. Effect of
dose and duration of reduction in dietary sodium on blood pressure
demonstrated the largest increases in national salt reduction levels: systematic review and meta-analysis of randomised trials. BMJ
initiatives. Increased implementation of initiatives was noted 2020;368:m315–28. doi:10.1136/bmj.m315%J BMJ.
in high-income and middle-income countries, but not in 8. World Health Organization. Global action plan for the prevention
low-income countries. However, despite the increase in the and control of NCDS 2013–2020. Geneva (Switzerland): World Health
number of countries adopting salt reduction strategies, none Organization; 2013.
9. Cobiac LJ, Vos T, Veerman JL. Cost-effectiveness of interventions to
have yet met the targeted 30% relative reduction in salt reduce dietary salt intake. Heart 2010;96(23):1920–5.
intake, which was set to be achieved by 2025. Countries 10. Webb M, Fahimi S, Singh GM, Khatibzadeh S, Micha R, Powles J,
need to accelerate their efforts to achieve the targeted Mozaffarian D. Cost effectiveness of a government supported policy
reduction, monitor and evaluate their strategies more reg- strategy to decrease sodium intake: global analysis across 183 nations.
ularly using reliable methods, and share lessons about the BMJ 2017;356:i6699–708. doi:10.1136/bmj.i6699%J BMJ.
11. Trieu K, Neal B, Hawkes C, Dunford E, Campbell N, Rodriguez-
successful ingredients to their strategies to ensure countries Fernandez R, Legetic B, McLaren L, Barberio A, Webster J. Salt
collectively achieve the global salt reduction target by reduction initiatives around the world–a systematic review of progress
2025. towards the global target. PLoS One 2015;10(7):e0130247.
Salt reduction initiatives around the world in 2019 1112. Webster JL, Dunford EK, Hawkes C, Neal BC. Salt reduction initiatives 32. Trieu K, Ieremia M, Santos J, Neal B, Woodward M, Moodie M,
around the world. J Hypertens 2011;29(6):1043–50. Bell C, Snowdon W, Faumuina T, Webster J. Effects of a nationwide
13. McLaren L, Sumar N, Barberio AM, Trieu K, Lorenzetti DL, Tarasuk V, strategy to reduce salt intake in Samoa. J Hypertens 2018;36(1):
Webster J, Campbell NR. Population-level interventions in government 188–98.
jurisdictions for dietary sodium reduction. Cochrane Database Syst Rev 33. World Health Organization Regional Office for Europe. Meeting of
2016;9(9):Cd010166. the WHO action network on salt reduction in the population in the
14. Christoforou A, Trieu K, Land MA, Bolam B, Webster J. State-level European region (ESAN): meeting report 2–10 May 2017, Dublin,
and community-level salt reduction initiatives: a systematic review of Ireland. Copenhagen (Denmark): World Health Organization Regional
global programmes and their impact. J Epidemiol Community Health Office for Europe; 2017.
2016;70(11):1140–50. 34. Lina J. Government initiative to lower sodium intake pays off. The Korea
Downloaded from https://academic.oup.com/advances/advance-article/doi/10.1093/advances/nmab008/6159028 by guest on 22 May 2021
15. World Health Organization. Shake the salt habit: the shake technical Bizwire. 2016 Dec 19.
package for salt reduction. Geneva (Switzerland): World Health 35. World Health Organization Regional Office for Europe. Progress
Organization; 2016. in reducing salt consumption in Turkey [Internet]. World Health
16. World Health Organization. WHO regional offices 2020 [Internet][cited Organization Regional Office for Europe; 2013 [cited June 2020].
June 2020]. Available from: https://www.who.int/about/who-we-are/ Available from: http://www.euro.who.int/en/countries/turkey/news/
regional-offices. news/2013/04/progress-in-reducing-salt-consumption-in-turkey.
17. The World Bank. World Bank country and lending groups: country 36. Public Health England. National diet and nutrition survey: assessment
classification 2019 [Internet][cited June 2020]. Available from: of salt intake from urinary sodium in adults (aged 19 to 64 years) in
https://datahelpdesk.worldbank.org/knowledgebase/articles/906519- England, 2018 to 2019. London (UK): Public Health England; 2020.
world-bank-country-and-lending-groups. 37. U.S. Department of Agriculture, Agricultural Research Service,
18. International Food Policy Research Institute. Global nutrition Nutrient intakes from food and beverages: mean amounts consumed
report 2016: from promise to impact: ending malnutrition by 2030. per individual, by gender and age, what we eat in America, NHANES
Washington (DC): International Food Policy Research Institute; 2016. 2011–2012. Washington (DC): U.S. Department of Agriculture,
19. Nowson C, Lim K, Grimes C, O’Halloran S, Land MA, Webster J, Agricultural Research Service; 2014.
Shaw J, Chalmers J, Smith W, Flood V, et al. Dietary salt intake and 38. U.S. Department of Agriculture, Agricultural Research Service.
discretionary salt use in two general population samples in Australia: Nutrient intakes from food and beverages: mean amounts consumed
2011 and 2014. Nutrients 2015;7(12):10501–12. per individual, by gender and age, what we eat in America, NHANES
20. Barberio AM, Sumar N, Trieu K, Lorenzetti DL, Tarasuk V, Webster 2015–2016. Washington (DC): U.S. Department of Agriculture,
J, Campbell NRC, McLaren L. Population-level interventions in Agricultural Research Service; 2018.
government jurisdictions for dietary sodium reduction: a Cochrane 39. Ministry of Health Malaysia and World Health Organization
review. Int J Epidemiol 2017;46(5):1551–405. Representative Office for Malaysia BD, and Singapore. Reducing
21. HealthCanada. Sodium intake of Canadians in 2017. Ottawa (Canada): salt intake in Malaysia: an interim evaluation of what works. Putrajaya
Health Canada; 2018. (Malaysia): Ministry of Health Malaysia; 2019.
22. Hipgrave DB, Chang S, Li X, Wu Y. Salt and sodium intake in China. 40. Trieu K, Michael V, Mustapha F, Lo Y-R, Webster J. Midterm
JAMA 2016;315(7):703–5. evaluation of Malaysia’s national salt reduction strategy–lessons learned
23. Pillay A, Trieu K, Santos JA, Sukhu A, Schultz J, Wate J, Bell C, Moodie on adapting salt reduction “best buys” to the local context. Curr Dev
M, Snowdon W, Ma G, et al. Assessment of a salt reduction intervention Nutr 2020;4(Suppl 2):288. doi:10.1093/cdn/nzaa043_139%J.
on adult population salt intake in Fiji. Nutrients 2017;9(12):1350–60. 41. Webster J, Pillay A, Suku A, Gohil P, Santos JA, Schultz J, Wate J,
doi:10.3390/nu9121350.1350. Trieu K, Hope S, Snowdon W, et al. Process evaluation and costing of a
24. Laatikainen T, Pietinen P, Valsta L, Sundvall J, Reinivuo H, Tuomilehto multifaceted population-wide intervention to reduce salt consumption
J. Sodium in the Finnish diet: 20-year trends in urinary sodium in Fiji. Nutrients 2018;10(2):155–70. doi:10.3390/nu10020155.155.
excretion among the adult population. Eur J Clin Nutr 2006;60(8): 42. Trieu K, Webster J, Jan S, Hope S, Naseri T, Ieremia M, Bell C, Snowdon
965–70. W, Moodie M. Process evaluation of Samoa’s national salt reduction
25. World Health Organization Regional Office for Europe. Mapping strategy (Masima): What interventions can be successfully replicated
salt reduction initiatives in the WHO European region. Copenhagen in lower-income countries? Implementation Sci 2018;13(1):107–120.
(Denmark): World Health Organization Regional Office for Europe; doi:10.1186/s13012-018-0802-1.
2013. 43. Hyseni L, Elliot-Green A, Lloyd-Williams F, Kypridemos C, O’Flaherty
26. Donfrancesco C, Strazzullo P, Galeone D, Palmieri L, Lo Noce C, M, McGill R, Orton L, Bromley H, Cappuccio FP, Capewell S.
Ippolito R, Russo O, Vanuzzo D, Giampaoli S. Trend of salt consumption Systematic review of dietary salt reduction policies: evidence
in Italy from 2009 to 2012. Circulation 2018;129:AP406. for an effectiveness hierarchy? PLoS One 2017;12(5):e0177535.
27. National Institute of Health and Nutrition. Health Japan 21 (the doi:10.1371/journal.pone.0177535.
second term): National Health and Nutrition Survey Japan [Internet]. 44. Nghiem N, Blakely T, Cobiac LJ, Pearson AL, Wilson N. Health and
National Institute of Health and Nutrition; 2020, [cited June 2020]. economic impacts of eight different dietary salt reduction interventions.
Available from: https://www.nibiohn.go.jp/eiken/kenkounippon21/en/ PLoS One 2015;10(4):e0123915. doi:10.1371/journal.pone.0123915.
eiyouchousa/koumoku_eiyou_chousa.html. 45. Hope SF, Webster J, Trieu K, Pillay A, Ieremia M, Bell C, Snowdon
28. Barzda A, Bartkevičiūtė R, Baltušytė I, Stukas R, Bartkevičiūtė S. W, Neal B, Moodie M. A systematic review of economic evaluations
Suaugusiu˛ ir pagyvenusiu˛ lietuvos gyventoju˛ faktinės mitybos ir of population-based sodium reduction interventions. PLoS One
mitybos i˛pročiu˛ tyrimas. Visuomenės Sveikata 2016;1(72):85–94. 2017;12(3):e0173600. doi:10.1371/journal.pone.0173600.
29. Temme EHM, Hendriksen MAH, Milder IEJ, Toxopeus IB, 46. Al Jawaldeh A, Rafii B, Nasreddine L. Salt intake reduction strategies
Westenbrink S, Brants HAM, van der AD. Salt reductions in some in the eastern Mediterranean region. East Mediterr Health J
foods in the Netherlands: Monitoring of food composition and salt 2018;24(12):1172–80.
intake. Nutrients 2017;9(7):791–807. doi:10.3390/nu9070791.791. 47. Swiss Confederation and the World Health Organization Regional
30. Ministry for Primary Industries. 2016 New Zealand total diet Office for Europe. European salt action network–ESAN: terms of
study. Wellington(New Zealand): Ministry for Primary Industries; reference. Switzerland: Swiss Confederation and the World Health
2018. Organization Regional Office for Europe; 2015.
31. Portuguese Society of Hypertension. Salt forum: expert panel 48. United Nations Decade of Action on Nutrition 2016–2025.
recommendations. Lisbon (Portugal): Portuguese Society of Member states in the region of the Americas establish two
Hypertension, 2015. action networks to contribute to the UN decade of action on
12 Santos et al.You can also read