RAISING THE STAKES IN AFRICA GAMBLING OUTLOOK: 2014 2018 - SOUTH AFRICA NIGERIA KENYA - PWC
←
→
Page content transcription
If your browser does not render page correctly, please read the page content below
Raising the stakes in Africa
Gambling outlook: 2014 – 2018
South Africa • Nigeria • Kenya

                                   3rd Annual Edition

                                   November 2014

                                 www.pwc.co.za/gambling
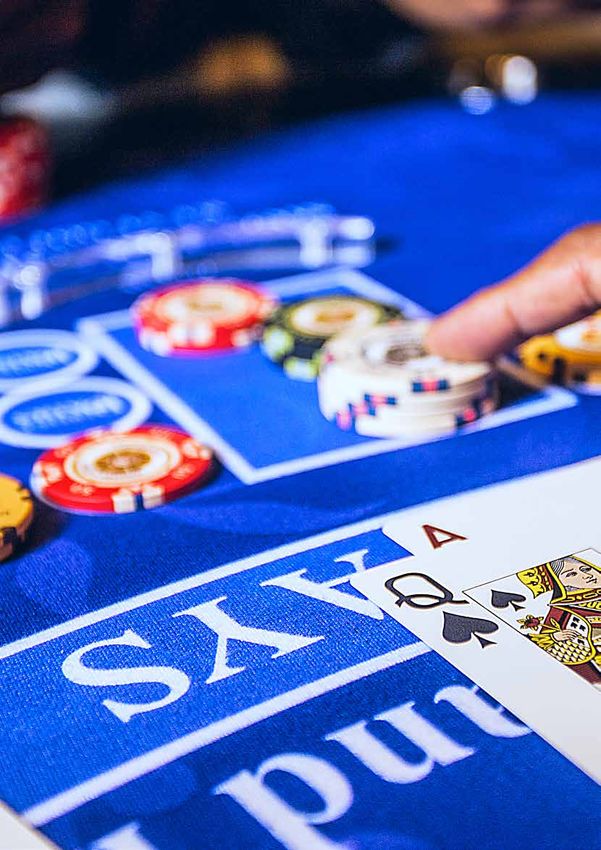
Photo courtesy of Tsogo Sun
Gambling outlook: 2014-2018
South Africa • Nigeria • Kenya

Third annual edition
                                       About PwC’s gambling industry group
PwC’s team of gambling specialists
provide an unbiased overview           Every day, PwC plays a significant supporting role in gambling
of how the gambling industry in        businesses across the world. With our local knowledge of culture, laws
South Africa, Nigeria and Kenya        and business needs, we help clients make the most of changing market
is expected to develop over the        scenarios. Because we understand how developments in the broader
coming years. The publication          gambling environment are affecting our clients, we can work with
focuses on the following major         them as a trusted advisor to provide solutions that help improve their
industry segments in South Africa:     organisation’s effectiveness and long-term success.
casino gambling, limited payout
machines, sports betting, bingo and    More significantly, we focus on the issues and challenges that are of
the National Lottery. It details the   utmost importance to our clients. These include restructuring, talent
key trends observed and challenges     management, compliance, regulatory changes, changing gambler
facing these industry sectors as       requirements and managing capital spend. We are committed to
well as considering their future       understanding the forces that have an impact on these issues and
prospects. For Nigeria and Kenya,      continue to develop and deliver solutions to help our clients achieve
we cover only casino gambling.         their financial, operational and strategic objectives.

Gambling outlook: 2014-2018
provides deep knowledge of the
local gambling market and is a
powerful tool for understanding
critical business issues. To learn
more about the challenges and
opportunities that lie ahead for
the gambling industry in South
Africa, please visit www.pwc.co.za/
gambling

                                                                                                     PwC        1
Gambling outlook: 2014-2018
South Africa • Nigeria • Kenya

Prepared and edited                             Editorial team
by:                                             Nikki Forster, Partner, PwC South
PricewaterhouseCoopers Inc.                     Africa Gambling Industry Leader
2 Eglin Road
                                                Pietro Calicchio, Partner, PwC
Sunninghill, 2157
                                                South Africa
+27 11 797 4000
www.pwc.co.za
                                                Sunet Liebenberg, Senior Manager,
                                                PwC South Africa
PwC helps organisations and
individuals create the value they’re
                                                Yolan Naidoo, Manager, PwC
looking for. We’re a network of
                                                South Africa
firms in 157 countries with more
than 195,000 people who are
                                                Osere Alakhume, Partner, PwC
committed to delivering quality
                                                Nigeria
in assurance, tax and advisory
services. Find out more by visiting             Michael Mugasa, Partner, PwC
us at pwc.com.                                  Kenya
Quantitative research and analysis
was provided by Wilkofsky Gruen                 Editing and design
Associates Inc., a provider of
global research and analysis of                 Catherine Ensor
the gambling industry. See www.
wilkofskygruen.com for more                     Veemal Daya
information.
                                                Many other professionals within
                                                PwC reviewed the text and
                                                contributed local expertise to this
                                                publication and we thank them for
                                                their assistance.

    Pictures courtesy of Sun International and Tsogo Sun

2        Raising the stakes in Africa
Use of Outlook data
The information in this publication is given for general information purposes
only, and is not meant to be taken as legal or professional advice in any way.
You should consult a professional advisor before making any decision or
taking any action. The author, copyright owner and publisher cannot accept
any responsibility for loss to any person acting or not acting as a result of any
material in this publication. The information in this document is given ‘as is’
with no assurance or guarantee of completeness, accuracy or timeliness of the
information, and without warranty of any kind. In no event will PwC be liable
for any losses arising from any decision made or action taken in reliance on
the information.

Designations used by companies to distinguish their products are often
claimed as trademarks. In all instances where PwC knows about a claim, the
product names appear in initial capital letters or all capital letters. However,
readers should contact those companies for more complete information
regarding trademarks and registration.

Permission to cite
No part of this publication may be excerpted, reproduced, stored in a retrieval
system, or distributed or transmitted in any form or by any means including
electronic, mechanical, photocopying, recording, or scanning without the
prior written permission of PwC.

Requests should be submitted in writing to Nikki Forster at nikki.forster@
za.pwc.com outlining the excerpts you wish to use along with a draft copy
of the full report that excerpts will appear in. Provision of this information
is necessary for every citation request to enable PwC to assess the context in
which the excerpts are being presented.

                                                           © 2014. PricewaterhouseCoopers “PwC”, the South
                                                           African firm. All rights reserved. In this document,
                                                           “PwC” refers to PricewaterhouseCoopers
                                                           in South Africa, which is a member firm of
                                                           PricewaterhouseCoopers International Limited
                                                           (PwCIL), each member firm of which is a separate
                                                           legal entity and does not act as an agent of PwCIL.

                                                           “PwC” is the brand under which member firms of
                                                           PricewaterhouseCoopers International Limited
                                                           (PwCIL) operate and provide services. Together,
                                                           these firms form the PwC network. Each firm in
                                                           the network is a separate legal entity and does not
                                                           act as agent of PwCIL or any other member firm.
                                                           PwCIL does not provide any services to clients.
                                                           PwCIL is not responsible or liable for the acts or
                                                           omissions of any of its member firms nor can it
                                                           control the exercise of their professional judgment
                                                           or bind them in any way.

                                                                                                 Photo courtesy of Tsogo Sun

                                                                                                          PwC              3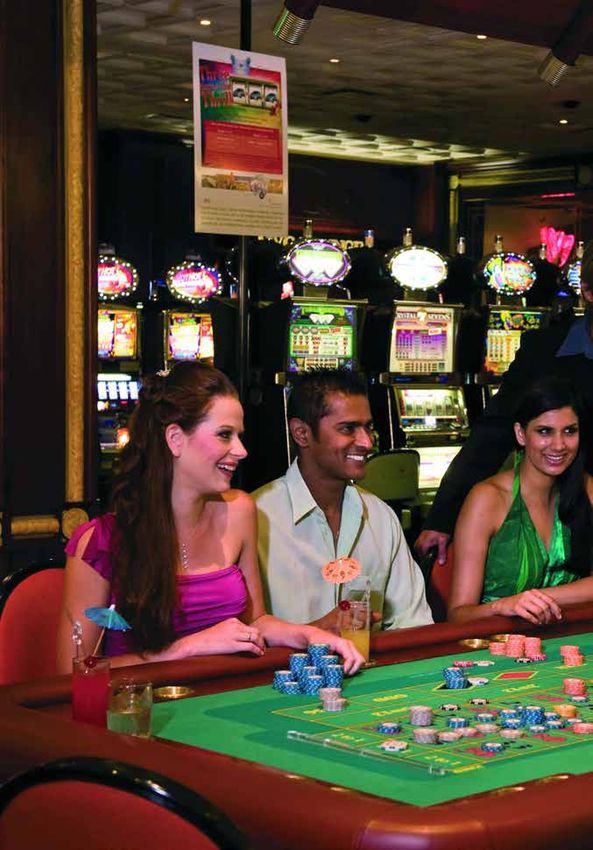
Contents

                                                                     The Gambling market                       08

                                                                               Overview                        09

                                                                     Gambling in South Africa                  12

                                                                               Gross gambling revenues         13

                                                                               Gambling turnover               15

                                                                               Gambling taxes and levies       17

                                                                               Casino gambling                 20

                                                                               Limited payout machines         23

                                                                               Sports betting                  25

                                                                               Bingo                           28

                                                                               National Lottery                30

                                                                               Looking back: 2013              31

                                                                     Casino gambling in Nigeria                32

                                                                               Looking back: 2013              34

                                                                     Casino gambling in Kenya                  35

                                                                               Looking back: 2013              37

                                                                     Conclusion                                38

                                                                     Casinos never sleep, nor should digital   39

                                                                     Glossary of abbreviations                 42

                                                                     PwC Africa                                43

Photo courtesy of Sun International, Monticello Grand Casino, Sala de Juego (slots area)

4          Raising the stakes in Africa
Johannesburg
          20 November 2014

          To our clients and friends in the gambling industry:

          Welcome to the third edition of the Gambling outlook: 2014-2018 (South Africa, Nigeria, Kenya).
          This publication focuses on segments within the gambling industry, with detailed forecasts and
          analysis. For each segment, we give details about the key trends we have noted as well as key
          challenges and future prospects we have identified.

          The gambling industry is often associated with glamour, high rollers, opulent settings and the
          trappings of wealth. As a business, however, the margins are low, a large portion of the costs are
          fixed, regulatory compliance is stringent and profitability depends on volume.

          Of the three countries included in our analysis, South Africa has by far the largest overall gambling
          market as well as the largest land-based casino gambling market. Gross land-based casino
          gambling revenues totalled R16.5 billion (USD1.6 billion) in South Africa in 2013 compared with
          only R428 million (USD40 million) in Nigeria and R195 million (USD18 million) in Kenya.

          We at PwC continue to stay on top of trends and developments that may impact gambling
          companies, now and in the future, and we look forward to sharing our thoughts with you once
          again. We appreciate your feedback and ask that you continue to tell us what we can do to make
          our publications more relevant and useful to you.

          If you would like clarification on any matters covered in this publication, or you believe we can
          be of service to your business in any way, please contact one of our industry specialists listed on
          page 44 of this report.

          Finally, we thank you for your support and wish you an exciting and rewarding year ahead.

          Sincerely,

          Nikki Forster
          Partner
          Gambling Industry Leader
          PwC South Africa

PricewaterhouseCoopers Inc., 2 Eglin Road, Sunninghill 2157, Private Bag X36, Sunninghill 2157, South Africa
T: +27 (11) 797 4000, F: +27 (11) 797 5800, www.pwc.co.za

Africa Senior Partner: S P Kana
Management Committee: H Boegman, T P Blandin de Chalain, B M Deegan, J G Louw, S N Madikane, P J Mothibe, T D Shango, S Subramoney, A R Tilakdari, F Tonelli
The Company’s principal place of business is at 2 Eglin Road, Sunninghill where a list of directors’ names is available for inspection.
Reg. no. 1998/012055/21, VAT reg.no. 4950174682
Gambling outlook: 2014-2018
South Africa • Nigeria • Kenya

                                               Exchange rates used in the report
Research
methodology                                       Currency                    Exchange rate
                                                  Rand: USD                            10.587
Figures for South Africa are                      USD: Naira                         159.665
expressed in rands and figures for                USD: Shilling                        85.436
Nigeria and Kenya are shown in
                                                  Naira: Rand                          14.924
US dollars (USD). Tables showing
                                                  Shilling: Rand                           8.070
comparisons between countries
are in rands. We use a constant
exchange rate for the 2009-2018                South Africa
period.                                        The National Gambling Board of South Africa is our source for historical
                                               data for South Africa. Its fiscal year covers the period from 1 April to 31
                                               March. As the fiscal year overlaps the calendar year, for our purposes
                                               figures represent the year that accounts for a majority of the activity.
                                               Thus, our figures for 2013 correspond to the National Gambling Board of
                                               South Africa’s 2014 financial year, which covers the period from
                                               1 April 2013 to 31 March 2014.

                                               The economic environment that has affected or is anticipated to impact
                                               the market, as used in our forecasts in South Africa is shown below.

Economic and consumer price growth in South Africa (%)
                      2009       2010      2011        2012        2013    2014      2015          2016   2017   2018   2014-18
                                                                                                                         CAGR
 Nominal GDP           6.7      11.0        9.7         7.0        7.8      7.1       7.4          8.2    9.4    9.3       8.3

 Real GDP             -1.3        3.1       3.6         2.5        1.9      1.3       1.5          2.2    3.3    3.2       2.3
 Consumer price        7.1        4.3       5.0         5.6        5.7      6.2       6.3          6.5    6.5    6.4       6.4
 inflation

Sources: Statistics South Africa, PricewaterhouseCoopers LLP, Wilkofsky Gruen Associates

6       Raising the stakes in Africa
Nigeria
                                               With respect to Nigeria, figures are derived and extrapolated from
                                               selected company information. In cases where the fiscal year ends on
                                               30 June 2013 or later, figures are included in 2013 totals. The economic
                                               environment that has affected or is anticipated to impact the market as
                                               used in our forecasts in Nigeria is shown below.

Economic and consumer price growth in Nigeria (%)
                      2009       2010      2011       2012      2013       2014      2015       2016     2017   2018    2014-18
                                                                                                                         CAGR
 Nominal GDP          17.6      19.7       14.9      13.9       11.6        9.0       8.0        9.0     10.5   12.5          9.8

 Real GDP              7.0        8.0       7.2        7.1       7.2        5.5       4.5        5.5      6.5    8.0          6.0
 Consumer price        9.2      12.4       11.7      13.9        7.7        6.5       6.0        6.2      6.5    7.0          6.4
 inflation

Sources: Nigeria National Bureau of Statistics, PricewaterhouseCoopers LLP, Wilkofsky Gruen Associates

                                               Kenya
                                               With respect to Kenya, figures are derived and extrapolated from casino
                                               taxes. In this case, the data are consistent with calendar years. The
                                               economic environment that has affected or is anticipated to impact the
                                               market as used in our forecasts in Kenya is shown below.

Economic and consumer price growth in Kenya (%)
                      2009       2010      2011       2012      2013       2014      2015       2016     2017   2018    2014-18
                                                                                                                         CAGR
 Nominal GDP          12.3        7.7      18.6      11.7       11.6       11.0      10.0       11.0     12.5   13.5         11.6

 Real GDP              2.7        5.8       4.4        4.6       4.7        3.5       3.0        4.0      5.5    6.5          4.5
 Consumer price       10.5        4.1      14.0        9.4       5.7        7.2       6.0        6.2      6.5    6.7          6.5
 inflation

Sources: Kenya National Bureau of Statistics, PricewaterhouseCoopers LLP, Wilkofsky Gruen Associates

                                                                                                                       PwC          7
Casinos
      The Gambling
              never sleep,
                    Market
      nor should digital

    Photo courtesy of Tsogo Sun

8          Raising the stakes in Africa
This report covers gambling in Overview With respect to online gambling, it
South Africa, Nigeria and Kenya. is permitted in Kenya, prohibited in
In South Africa, we include Of the three countries, South Nigeria except for lotteries, and still
casino gambling, limited payout Africa has by far the largest overall illegal in South Africa except for
machines (LPMs), sports betting, gambling market as well as the sports betting.
bingo and the National Lottery. largest land-based casino gambling
In Nigeria and Kenya, we include market. Gross land-based casino Gross casino gambling revenues
only casino gambling. This report gambling revenues totalled continued to grow at healthy rates
provides data on gross gambling R16.5 billion (USD1.6 billion) in in Nigeria (19.6%) and Kenya
revenues (the amount wagered South Africa in 2013, compared (7.7%) in 2013, in both cases rising
minus the amount returned to with only R428 million (USD40 faster than in 2012, reflecting the
players as winnings); turnover (the million) in Nigeria and R195 strength of these economies. In
total amount wagered by players million (USD18 million) in Kenya. South Africa, however, growth
including winnings which are dropped to only 0.6%, the result
There are 37 licensed operating of a weakening economy and
wagered again by the players); and
casinos in South Africa compared an increase in the payout rate to
gambling taxes and levies, which
with 13 in Kenya and only three in 93.4% in 2013 from 93.2% in 2012.
is the amount levied and collected
Nigeria. Beyond the casino count
by provincial licensing authorities
itself, casinos in South Africa We expect slower economic growth
from legal gambling. In the case
generally are larger and have more to lead to slower gross casino
of the National Lottery in South
slot machines and table games than gambling revenues in Nigeria
Africa, contributions are made
casinos in Kenya and Nigeria. and Kenya and continued slow
from lottery tickets to the National
Lottery Distribution Trust Fund. growth in South Africa over the
There are also differences in next two years. We then look for a
the regulatory climates in each pick-up in growth in each country
country. Casinos are well regulated as economic conditions improve.
and long established in South We do not expect the recent Ebola
Africa. In Nigeria, casino regulation outbreak in West Africa to have
is relatively recent and there are a significant impact on casino
many unlicensed casinos that gambling in any of the three
compete with licensed operations. markets.
In Kenya, gambling is encouraged,
but a dispute has emerged between
the Betting Control and Licensing
Board and the Council of Governors
for the counties as to who has
authority to issue licences.
Photo courtesy of Sun International, Lesotho Sun, Casino (slots)
PwC 9South Africa Figure 1: Casino gross gambling revenue in South Africa
South Africa will be the slowest (R millions), 2009-2018
growing of the three countries,
reflecting its slower-growing 20,000
19,950
economy. We project gross casino
18,800
18,000
gambling revenue in South Africa
17,300
16,000
16,000
16,498
16,404
to increase at a 3.9% compound
14,855
14,043
annual rate to R20 billion
13,726
R millions
12,000
(USD1.9 billion) in 2018.
R millions
8,000
4,000
0
2009 2010 2011 2012 2013 2014 2015 2016 2017 2018
Sources: National Gambling Board of South Africa, PricewaterhouseCoopers LLP, Wilkofsky
Gruen Associates
Nigeria Figure 2: Casino gross gambling revenue in Nigeria (R millions),
Nigeria has the strongest economy 2009-2018
of the three and we look for faster
growth compared with South 700
Africa and Kenya. We project
600
gross casino gambling revenues in
620
Nigeria to average 7.7% growth on
555
500
507
a compound annual basis rising to 470
R millions
450
R620 million (USD58 million) in 400
428
2018.
358
300
301
266
243
200
100
0
2009 2010 2011 2012 2013 2014 2015 2016 2017 2018
Sources: PricewaterhouseCoopers LLP, Wilkofsky Gruen Associates
Kenya Figure 3: Casino gross gambling revenue in Kenya (R millions),
The Kenyan economy is not 2009-2018
expected to grow as fast as
Nigeria’s, but is expected to 300
outperform the South African
271
economy. We expect a similar 250
247
pattern for casino gambling with
227
200
213
gross gambling revenue projected
204
R millions
195
to rise to R271 million (USD26
181
171
150
million) in 2018, a 6.8% compound
131
annual increase from 2013.
100
111
50
0
2009 2010 2011 2012 2013 2014 2015 2016 2017 2018
Sources: PricewaterhouseCoopers LLP, Wilkofsky Gruen Associates
10 Raising the stakes in AfricaFor the three countries taken together, casino gross gambling revenues will total an estimated R20.8 billion
(USD2.0 billion) in 2018, a 4.0% compound annual increase from R17.1 billion (USD1.6 billion) in 2013.
Casino gross gambling revenue in South Africa, Nigeria and Kenya (R millions)
2009 2010 2011 2012 2013 2014 2015 2016 2017 2018 2014-18
CAGR
South Africa 13 726 14 043 14 855 16 404 16 498 16 800 17 300 18 000 18 800 19 950
% change 1.6 2.3 5.8 10.4 0.6 1.8 3.0 4.0 4.4 6.1 3.9
Nigeria 243 266 301 358 428 450 470 507 555 620
% change 13.5 9.7 12.9 19.2 19.4 5.0 4.5 8.0 9.5 11.8 7.7
Kenya 111 131 171 181 195 204 213 227 247 271
% change 16.7 17.1 31.7 5.6 7.6 4.9 4.1 6.5 9.3 9.4 6.8
Total 14 080 14 440 15 327 16 943 17 121 17 454 17 983 18 734 19 602 20 841
% change 1.9 2.6 6.1 10.5 1.1 1.9 3.0 4.2 4.6 6.3 4.0
Sources: PricewaterhouseCoopers LLP, Wilkofsky Gruen Associates
Photo courtesy of Tsogo Sun
PwC 11Casinos never sleep,
nor should digital
Gambling in South Africa
Photo courtesy of Tsogo Sun
12 Raising the stakes in AfricaGross gambling revenues
Definition: Amount wagered less winnings paid to players
Gambling growth in South Africa moderated in 2013, reflecting higher
payout rates for casinos, limited payout machines (LPMs) and sports
betting. Gambling turnover rose 7.5% in 2013, but gross gambling revenue
increased only 4.3%. In 2012, by contrast, payout rates declined and gross
gambling revenue rose 13.6%, exceeding the 10.0% increase in turnover.
The slowdown in gross gambling revenue in 2013 was centred on casinos,
the largest category at R16.5 billion in 2013.
Casinos posted a modest 0.6% advance. Some casino operators in
certain locations believe the slowdown in 2013 was due in part to
growing competition from electronic bingo terminals, LPMs and sports
betting shops, which are becoming more prevalent. LPMs located in the
catchment area of casinos are considered to be an issue, as it is possible
to play consolidated games at one time which results in the bet being
increased from the R5 maximum, which in turn increases the potential
payout.
Several years ago a proposal to introduce machines with high payout rates
at racetracks, bingo halls and other non-casino venues was challenged
by the Casino Association of South Africa (CASA). CASA argued that
machines offering high stakes and high payouts would attract high rollers
away from casinos, demonstrating the belief in the casino industry that
other forms of gambling are potential competitors to casinos. LPMs
located outside casino catchment areas, by contrast, are not considered to
be an issue. Bingo gross gambling revenues rose 67.5%, LPMs increased
17.8% and sports betting grew 9.1%.
Bingo, the smallest category at only R732 million, continued to be the
fastest-growing category in 2013, fuelled by the proliferation of sites.
Between April–June 2013 and January–March 2014, revenue nearly
doubled in Gauteng and Mpumalanga as sites were added, while bingo
was introduced in the North West and Eastern Cape in the latter part of
the year.
Sports gambling consists of horse racing and betting on sporting events.
Online wagering is permitted. Currently, horse racing is the dominant
category, comprising 65% of the total in 2013, but that share is down from
88% in 2009. Betting shops are opening in all provinces except the Eastern
Cape and rising broadband penetration is contributing to growth in online
sports betting.
Sports betting rose 18.5% in 2013 compared with 4.6% growth for horse
racing. It is expected that within the next five years, wagering on sporting
events will overtake horse racing. In addition to these underlying trends,
sports betting will have been boosted in 2014 by the FIFA World Cup and
will be enhanced again in 2018. We also expect betting associated with the
Cricket and Rugby World Cup events to contribute to growth in 2015.
PwC 13Casinos on average retained Figure 4: Gambling payout rates by category, 2013 (%)
6.6% of the amount wagered (or
turnover) in 2013. For the gambling
100
categories as a whole, the payout
rate in 2013 averaged 92.8%.
93.4
91.1
91.6
88.4
Gambling is a low-margin business, 80
which means that gambling
operators need high volumes to be 60
profitable. %
40
Consequently, the economy and
competition from other gambling
20
outlets play a large role as even
small declines in turnover can
have a large adverse impact on 0
Sports LPMs Bingo Casinos
profitability. betting
Sources: National Gambling Board of South Africa, PricewaterhouseCoopers LLP, Wilkofsky
Gruen Associates
We project casino gross gambling revenues will rise from National Lottery gross revenues
R16.5 billion in 2013 to R20 billion in 2018, a 3.9% compound annual (ticket sales or turnover less
increase. We expect LPMs gross gambling revenues to average 10.0% payouts to winners) was the only
compounded annually to R2.8 billion in 2018 from R1.7 billion in 2013. category to decline in 2013, falling
by 1.5%. This category has been
Sports betting gross gambling revenues will increase at a projected 12.0% the weakest segment of the market
compound annual rate from 2.8 billion in 2013 to R5 billion in 2018. since 2010 and we expect it will
remain the slowest growing, rising
We project bingo gross gambling revenues to continue to be the fastest- at a 1.1% compound annual rate to
growing category with a projected 19.0% compound annual increase, R2.5 billion in 2018 from
rising to R1.8 billion in 2018. R2.3 billion in 2013.
Gross gambling revenues as a whole will expand from R21.8 billion in
2013 to R29.5 billion in 2018,a 6.2% compound annual increase.
Gross gambling and National Lottery revenues in South Africa (R millions)
2009 2010 2011 2012 2013 2014 2015 2016 2017 2018 2014-18
CAGR
Casino 13 726 14 043 14 855 16 404 16 498 16 800 17 300 18 000 18 800 19 950
gambling
% change 1.6 2.3 5.8 10.4 0.6 1.8 3.0 4.0 4.4 6.1 3.9
Limited 740 899 1 174 1 476 1 739 2 010 2 250 2 475 2 650 2 800
payout
machines
% change 11.6 21.5 30.6 25.7 17.8 15.6 11.9 10.0 7.1 5.7 10.0
Sports 1 605 2 003 2 153 2 597 2 834 3 600 3 900 4 050 4 200 5 000
betting
% change -1.7 24.8 7.5 20.6 9.1 27.0 8.3 3.8 3.7 19.0 12.0
Bingo 197 196 235 437 732 990 1 235 1 420 1 600 1 750
% change 62.8 -0.5 19.9 86.0 67.5 35.2 24.7 15.0 12.7 9.4 19.0
Total 16 268 17 141 18 417 20 914 21 803 23 400 24 685 25 945 27 250 29 500
gambling
% change 2.2 5.4 7.4 13.6 4.3 7.3 5.5 5.1 5.0 8.3 6.2
National 2 162 2 195 2 288 2 355 2 320 2 280 2 300 2 325 2 375 2 450
Lottery*
% change 6.7 1.5 4.2 2.9 -1.5 -1.7 0.9 1.1 2.2 3.2 1.1
*Lotto and PowerBall
Sources: National Gambling Board of South Africa, National Lottery Board of South Africa, PricewaterhouseCoopers LLP,
Wilkofsky Gruen Associates
14 Raising the stakes in AfricaFigure 5: Gross gambling revenues (R millions), 2013 vs 2018
Total 29,500
gambling 21,803
Casino 19,950
gambling 16,498
Sports 5,000
betting 2,834
2,800
LPMS
1,739
1,750
Bingo
732
0 10,000 20,000 30,000 40,000
2018 2013
Sources: National Gambling Board of South Africa, PricewaterhouseCoopers LLP, Wilkofsky
Gruen Associates
Gambling turnover
Definition: Value of money wagered including ‘recycling’, which refers to
amounts that are staked on more than one occasion.
Gambling turnover rose 7.5%, in 2013, down from the 10.0% rise in 2012
and the smallest increase since 2009. Gains in excess of 20% for bingo,
sports betting and LPMs were partially offset by a 4.0% rise for casinos.
We expect growth to continue to moderate over the next five years,
averaging 6.3% compounded annually to R413.7 billion in 2018 from
R304.6 billion in 2013.
Bingo was the fastest-growing category in 2013 with a 58.9% increase,
followed by LPMs at 25.9% and sports betting at 21.3%. We expect these
three categories to continue to average double-digit gains during the
forecast period, but as these markets mature, growth will moderate.
We project bingo turnover to grow at 17.6% compound annual rate,
LPM turnover to average 16.0% compounded annually, while sports
betting, fuelled principally by wagering on sporting events, will grow by a
projected 12.2% on a compound annual basis, benefiting from a pick-up in
betting related to the FIFA World Cup in 2018.
Casinos are by far the largest component of the market with turnover at
R251.2 billion in 2013, 82% of total gambling turnover. The 4.0% increase
in casino turnover in 2013 was down from the 7.6% increase in 2012 and
the smallest gain since 2009.
We expect casino turnover to continue to weaken in the near term,
averaging 3.1% growth during the next two years, and then improving
during the latter part of the forecast period as the economy strengthens
and facilities are upgraded. For the forecast period as a whole, casino
turnover will increase at an estimated 4.2% compound annual rate to
R308 billion in 2018.
PwC 15National Lottery ticket sales, or turnover, fell 1.5% in 2013. We expect a further decline in 2014 followed by a
modest rebound in 2015 and somewhat faster increases thereafter. The National Lottery will remain a slow-
growing category with turnover rising by only 1.1% on a compound annual basis.
Gambling and National Lottery turnover in South Africa (R millions)
2009 2010 2011 2012 2013 2014 2015 2016 2017 2018 2014-18
CAGR
Casino 196 778 209 263 224 563 241 576 251 177 258 500 267 000 277 500 290 000 308 000
gambling
% change 1.0 6.3 7.3 7.6 4.0 2.9 3.3 3.9 4.5 6.2 4.2
Limited 6 932 8 653 11 953 16 070 20 227 25 000 30 000 35 000 39 000 42 500
payout
machines
% change 11.0 24.8 38.1 34.4 25.9 23.6 20.0 16.7 11.4 9.0 16.0
Sports 10 211 12 643 17 699 20 186 24 490 31 000 33 500 35 000 36 100 43 500
betting
% change 7.9 23.8 40.0 14.1 21.3 26.6 8.1 4.5 3.1 20.5 12.2
Bingo 1 905 2 426 3 372 5 504 8 746 11 500 14 000 16 000 17 900 19 700
% change 27.1 27.3 39.0 63.2 58.9 31.5 21.7 14.3 11.9 10.1 17.6
Total 215 826 232 985 257 587 283 336 304 640 326 000 344 500 363 500 383 000 413 700
gambling
% change 1.7 8.0 10.6 10.0 7.5 7.0 5.7 5.5 5.4 8.0 6.3
National 4 323 4 390 4 575 4 710 4 640 4 560 4 600 4 650 4 750 4 900
Lottery*
% change 6.7 1.5 4.2 3.0 -1.5 -1.7 0.9 1.1 2.2 3.2 1.1
*Lotto and PowerBall
Sources: National Gambling Board of South Africa, National Lottery Board of South Africa, PricewaterhouseCoopers LLP, Wilkofsky Gruen
Associates
Figure 6: Gambling turnover by type (R millions), 2013 vs 2018
Total 413,700
gambling 304,640
Casino 308,000
gambling 251,177
Sports 43,500
betting 24,490
42,500
LPMS
20,227
19,700
Bingo
8,746
0 80,000 160,000 240,000 320,000 400,000
2018 2013
Sources: National Gambling Board of South Africa, PricewaterhouseCoopers LLP, Wilkofsky Gruen Associates
16 Raising the stakes in AfricaGambling taxes and levies
Definition: The amount levied and collected by provincial licensing
authorities from legal gambling. Corporate tax and VAT on gambling
revenues are excluded from our analysis.
Gambling taxes and levies totalled R2.2 billion in 2013, up 6.6% from
2012. As is the case with payout rates, tax rates vary by category, ranging
from 12.3% for LPMs to 7.2% for bingo and averaging 10.3% for the
market as a whole. These taxes and levies are paid to the provincial
gambling boards.
Casinos also pay deemed output VAT to the National Treasury on the
gross gambling revenues that they have earned. This is a direct cost to the
casino operators and any increase in the VAT rate would reduce a casino’s
income.
The estimated deemed output VAT collected on gambling revenues from
casinos in 2013 amounted to R1.8 billion, or 11% of gross gambling
revenue. Gambling taxes and levies represented 9.9% of casino gross
gambling revenues. When VAT is included, the share of all taxes for
casinos rises to nearly 21%.
Figure 7: Gambling taxes & levies and casino VAT as a share of
gross gambling revenues, 2013 (%)
25
20
15
12.3
11.6
%
9.9
10
7.2
5
0
LPMs Sports Casinos Bingo
betting
Taxes and levies
Sources: National Gambling Board of South Africa, PricewaterhouseCoopers LLP, Wilkofsky
Gruen Associates
PwC 17Most of the gambling taxes and Gambling taxes and levies by province (R millions)
levies in 2013 were generated in
Gauteng (R848 million), KwaZulu- 2012 2013 % change
Natal (R535 million) and the Gauteng 836 848 1.4
Western Cape (R459 million),
KwaZulu-Natal 494 535 8.3
which together accounted for 82%
Western Cape 402 459 14.2
of the total. Eastern Cape at R122
million was the only other province Eastern Cape 112 122 8.9
above R100 million in 2013. North West 86 96 11.6
The Western Cape, North West Mpumalanga 67 74 10.4
and Mpumalanga each recorded Limpopo 46 48 4.3
double-digit gains in 2013, together Free State 40 40 0.0
accounting for 54% of the total
Northern Cape 16 15 -6.3
increase in taxes and levies.
Total 2,099 2,237 6.6
Sources: National Gambling Board of South Africa, PricewaterhouseCoopers LLP, Wilkofsky
Gruen Associates
The Western Cape and KwaZulu- Taxes/levies as a % of gross gambling revenues
Natal have the highest share of
taxes and levies as a percentage 2012 2013
of gross gambling revenues. This Gauteng 9.2 9.2
reflects their dominance in the KwaZulu-Natal 12.5 12.9
LPM market, which has the highest Western Cape 12.6 13.4
gambling tax rates. Their shares Eastern Cape 7.9 8.0
of gross gambling revenues also
North West 7.8 8.1
rose reflecting faster growth in the
Mpumalanga 7.6 7.7
LPM market compared with casino
gambling. Limpopo 7.9 7.6
Free State 7.8 7.6
Northern Cape 7.6 7.5
Sources: National Gambling Board of South Africa, PricewaterhouseCoopers LLP, Wilkofsky
Gruen Associates
Photo courtesy of Tsogo Sun
18 Raising the stakes in AfricaAn increase in the tax rate for casinos in the Western Cape from September 2013 will have their full impact in
2014, leading to a 3.7% rise in tax and levies for casinos in 2014.
For the forecast period as a whole, overall taxes and levies will expand by 6.6% compounded annually to
R3.1 billion in 2018.
Gambling taxes and levies in South Africa (R millions)
2009 2010 2011 2012 2013 2014 2015 2016 2017 2018 2014-18
CAGR
Casino 1 263 1 318 1 405 1 579 1 640 1 700 1 750 1 820 1 900 2 020
gambling
% change 1.0 4.4 6.6 12.4 3.9 3.7 2.9 4.0 4.4 6.3 4.3
Limited 83 105 140 181 214 250 285 320 350 375
payout
machines
% change 13.7 26.5 33.3 29.3 18.2 16.8 14.0 12.3 9.4 7.1 11.9
Sports 207 223 259 294 330 400 430 455 475 550
betting
% change 3.0 7.7 16.1 13.5 12.2 21.2 7.5 5.8 4.4 15.8 10.8
Bingo 22 23 29 45 53 75 94 110 125 135
% change 46.7 4.5 26.1 55.2 17.8 41.5 25.3 17.0 13.6 8.0 20.6
Total 1 575 1 669 1 833 2 099 2 237 2 425 2 559 2 705 2 850 3 080
gambling
% change 2.3 6.0 9.8 14.5 6.6 8.4 5.5 5.7 5.4 8.1 6.6
Sources: National Gambling Board of South Africa, PricewaterhouseCoopers LLP, Wilkofsky Gruen Associates
Figure 8: Gambling taxes & levies vs gross gambling revenues (R millions), 2013
Total 21,803
gambling 2,237
Casino 16,498
gambling 1,640
Sports 2,834
betting 330
1,739
LPMs
214
732
Bingo
53
0 5,000 10,000 15,000 20,000 25,000
Gross gambling revenues Taxes & levies
Sources: National Gambling Board of South Africa, PricewaterhouseCoopers LLP, Wilkofsky Gruen Associates
PwC 19Casino gambling
Figure 9: Gross gambling revenue shares by type (%), 2013
Bingo
LPMs 3%
8%
Sport Casino
betting gambling
13% 76%
Sources: National Gambling Board of South Africa, PricewaterhouseCoopers LLP, Wilkofsky
Gruen Associates
Casinos are by far the largest component of the gambling market with
gross gambling revenues at R16.5 billion in 2013, 76% of total gross
gambling revenue. That share, however, was down from 78% in 2012.
The National Gambling Act permits 40 licensed casinos in South Africa.
A total of 38 are currently licensed and 37 are in operation. The Tsogo
Sun Group, Sun International and Peermont Global Group are the largest
casino companies in South Africa, together accounting for 35 of the 38
licensed casinos.
Casino gambling is concentrated in Gauteng, KwaZulu-Natal and the
Western Cape provinces. Gauteng has seven casinos and KwaZulu-
Natal and the Western Cape both have five, in each case the maximum
permitted. No other province has more than four casinos.
Casino group licensed casinos by province
Tsogo Sun Sun Peermont London Clubs Northern Leitlho Total
Group International Global International Cape Casino
Consultants
Gauteng 3 2 1 1 7
KwaZulu-Natal 3 1 1 5
Western Cape 3 2 5
Eastern Cape 2 2 4
North West 2 2 4
Free State 1 2 1 4
Mpumalanga 2 1 3
Limpopo 1 2 3
Northern Cape 1 1 1 3
Total 14 13 8 1 1 1 38
Source: Casino Association of South Africa
20 Raising the stakes in AfricaGauteng was the leading province Gross gambling revenues earned by casinos by province
in casino gross gambling revenues R millions)
at R7.0 billion in 2013, down from
R7.2 billion in 2012. KwaZulu-Natal 2012 2013 % change
and the Western Cape were next at Gauteng 7 229 6 988 -3.3
R3.1 billion and KwaZulu-Natal 2 967 3 073 3.6
R2.5 billion, respectively, each up Western Cape 2 393 2 536 6.0
from 2012. These three provinces Eastern Cape 1 108 1 171 5.7
accounted for 76.4% of total casino
North West 1 015 1 042 2.7
gross gambling revenues.
Mpumalanga 709 729 2.8
The Eastern Cape and North West Free State 419 420 0.2
were the only other provinces to Limpopo 373 352 -5.6
generate more than R1 billion in Northern Cape 191 187 -2.1
gross gambling revenues. Declines Total 16 404 16 498 0.6
in Gauteng, Limpopo and the
Northern Cape were barely offset Sources: National Gambling Board of South Africa, PricewaterhouseCoopers LLP, Wilkofsky
by increases in the other provinces. Gruen Associates
While we do not expect an increase in the number of casinos,
casino upgrades and expansions should have a positive impact. Sun
International’s bid to relocate its Morula Sun casino in Mabopane to
Menlyn was approved by the Gauteng Gambling Board in 2014. This
approval, however, has been challenged by another operator and that
appeal is scheduled to be heard by the courts in 2015. Until the legal
challenge is resolved, work on the project cannot begin. At its earliest, the
new casino is not expected to open until 2018.
Morula Sun is in an unfavourable location and its revenues have been
declining. If the project goes forward, Sun International plans to build a
R3-billion entertainment destination, Menlyn Maine, that will include a
hotel, conference centre and concert hall. The casino will be considerably
larger than the existing Morula Sun facility with 2 000 slot machines and
60 gambling tables.
Menlyn is a more affluent area that is easier to access and faces less
competition from non-casino gambling than Mabopane. Menlyn Maine is
projected to generate R2.7 billion in gambling taxes in its first five years of
operation.
Figure 10: Casino gross gambling revenue (R millions), 2009-2018
20,000
19,950
18,800
18,000
17,300
16,000
16,800
16,498
16,404
14,855
14,043
13,726
R millions
12,000
R millions
8,000
4,000
0
2009 2010 2011 2012 2013 2014 2015 2016 2017 2018
Sources: National Gambling Board of South Africa, PricewaterhouseCoopers LLP, Wilkofsky
Gruen Associates
PwC 21In 2014, Tsogo Sun received approval to expand its Suncoast Casino in Durban and will spend R1.8 billion over
three years to double the size of the existing facility, adding 900 gambling machines and 16 gambling tables.
The new casino will have 2 350 gambling machines and 80 gambling tables. Tsogo Sun has commenced work
on the R560 million redesign and expansion of the Silverstar Casino in Krugersdorp and the R630 million
redevelopment of the Gold Reef City Casino and Theme Park south of Johannesburg.
We project gross gambling revenue to remain sluggish with a 1.8% advance in 2014 followed by a 3.0% rise in
2015, reflecting moderate economic growth. We then expect improving economic conditions, casino upgrades
by Tsogo Sun and a possible upgrade by Sun International will lead to somewhat faster increases during 2016-18.
For the forecast period as a whole, growth will average 3.9% compounded annually to R20 billion in 2018.
Taxes and levies will total an estimated R2 billion in 2018, up from R1.6 billion in 2013, growing at a 4.3%
compound annual rate. The deemed output VAT on gross gambling revenue is forecast to be R2.19 billion in
2018. This, together with gambling taxes and levies, is expected to account for 21.13% of gross gambling revenue
in 2018, up from 20.9% in 2013.
Casino gambling in South Africa (R millions)
2009 2010 2011 2012 2013 2014 2015 2016 2017 2018 2014-18
CAGR
Gross 13 726 14 043 14 855 16 404 16 498 16 800 17 300 18 000 18 800 19 950
gambling
revenue
% change 1.6 2.3 5.8 10.4 0.6 1.8 3.0 4.0 4.4 6.1 3.9
Taxes and 1 263 1 318 1 405 1 579 1 640 1 700 1 750 1 820 1 900 2 020
levies
% change 1.0 4.4 6.6 12.4 3.9 3.7 2.9 4.0 4.4 6.3 4.3
Sources: National Gambling Board of South Africa, PricewaterhouseCoopers LLP, Wilkofsky Gruen Associates
Photo courtesy of Tsogo Sun
22 Raising the stakes in AfricaLimited payout machines
Figure 11: Gross gambling revenue shares by type (%), 2013
LPMs
8%
Bingo
3%
Sport Casino
betting gambling
13% 76%
Sources: National Gambling Board of South Africa, PricewaterhouseCoopers LLP, Wilkofsky
Gruen Associates
LPMs, principally located in bars, clubs and restaurants, accounted for
8% of gross gambling revenues in 2013, up from 7% in 2012. LPMs are
monitored by the Central Electronic Monitoring System (CEMS) and are
licensed to route operators who manage and operate LPMs in conjunction
with site operators.
The introduction of new machines and new sites is expanding the market.
On the supply side, the market is consolidating with Grand Parade
Investments having acquired Hot Slots (Bohwa 1 Gaming) and the licence
of Zimie Slots Mpumalanga in 2013 and looking to expand.
In contrast with the casino market where Gauteng dominates, that
province ranked only third in LPM gross gambling revenues at
R287 million in 2013, representing, 16.5% of the total. Western Cape had
the largest LPM market in 2013 at R551 million with KwaZulu-Natal next
at R404 million. Eastern Cape at R190 million, Limpopo at
R145 million, and Mpumalanga at R110 million were the other provinces
above R100 million. LPMs have not yet been introduced in Northern Cape.
Except for Mpumalanga, each province with LPMs recorded double-digit
revenue growth in 2013.
LPM gross gambling revenues by province (R millions)
2012 2013 % change
Western Cape 481 551 14.6
KwaZulu-Natal 339 404 19.2
Gauteng 242 287 18.6
Eastern Cape 161 190 18.0
Limpopo 119 145 21.8
Mpumalanga 101 110 8.9
North West 15 28 86.7
Free State 18 24 33.3
Total 1 476 1 739 17.8
Sources: National Gambling Board of South Africa, PricewaterhouseCoopers LLP, Wilkofsky
Gruen Associates
PwC 23Continued installation of LPMs in new locations will expand the market. However, with bingo expanding
rapidly into new areas, some of which are likely to be in proximity to LPMs, we expect growing competition from
electronic bingo terminals to lead to slower LPM growth during the latter part of the forecast period, as these
outlets compete for the same customers.
Limited payout machines (R millions)
2009 2010 2011 2012 2013 2014 2015 2016 2017 2018 2014-18
CAGR
Gross 740 899 1 174 1 476 1 739 2 010 2 250 2 475 2 650 2 800
gambling
revenue
% change 11.6 21.5 30.6 25.7 17.8 15.6 11.9 10.0 7.1 5.7 10.0
Taxes and 83 105 140 181 214 250 285 320 350 375
levies
% change 13.7 26.5 33.3 29.3 18.2 16.8 14.0 12.3 9.4 7.1 11.9
Sources: National Gambling Board of South Africa, PricewaterhouseCoopers LLP, Wilkofsky Gruen Associates
We expect double-digit growth in gross gambling revenues to continue for the next three years before dropping
to single-digit gains in 2017-18. For the forecast period as a whole, we project LPM gross gambling revenue to
expand at a 10% compound annual rate to R2.8 billion in 2018 from R1.7 billion in 2013.
Taxes and levies will increase from R214 million in 2013 to a projected R375 million in 2018, an 11.9%
compound annual increase.
Figure 12: Limited payout machines gross gambling revenue (R millions), 2009-2018
3,000
2,800
2,500
2,650
2,475
2,250
2,000
2,010
R millions
1,739
1,500
1,476
1,174
1,000
899
740
500
0
2009 2010 2011 2012 2013 2014 2015 2016 2017 2018
Sources: National Gambling Board of South Africa, PricewaterhouseCoopers LLP, Wilkofsky Gruen Associates
24 Raising the stakes in AfricaSports betting
Figure 13: Gross gambling revenue shares by type (%), 2013
Bingo
LPMs 3%
8%
Sport
betting
13% Casino
gambling
76%
Sources: National Gambling Board of South Africa, PricewaterhouseCoopers LLP, Wilkofsky
Gruen Associates
Sports betting, the second largest category comprising 13% of total gross
gambling revenues, up from 12% in 2012, includes bookmaking and pari-
mutuel wagering on horse racing and other sports events. This is the only
category where online wagering is permitted.
Horse racing is the dominant component of the market at R1.8 billion
gross gambling revenues in 2013 compared with R1.0 billion for sports
events. Horse racing is controlled by two companies, Phumelela Gambling
and Leisure and Gold Circle. Phumelela Gambling and Leisure operates
in the Free State, Northern Cape, Eastern Cape and Gauteng, while Gold
Circle controls wagering in KwaZulu-Natal and the Western Cape.
Horse racing is a relatively mature market with growth during the past
three years at less than 5% annually. Sports betting, on the other hand,
has been expanding rapidly, rising by 18.5% in 2013 and more than
quintupling since 2009. The proliferation of sports betting shops and
online wagering is driving this component of the market. We expect sports
betting to overtake horse racing within the next five years.
PwC 25Total sports betting (R millions)
2009 2010 2011 2012 2013 2014 2015 2016 2017 2018 2014-18
CAGR
Gross 1 605 2 003 2 153 2 597 2 834 3 600 3 900 4 050 4 200 5 000
gambling
revenue
% change -1.7 24.8 7.5 20.6 9.1 27.0 8.3 3.8 3.7 19.0 12.0
Taxes and 207 223 259 294 330 400 430 455 475 550
levies
% change 3.0 7.7 16.1 13.5 12.2 21.2 7.5 5.8 4.4 15.8 10.8
Sources: National Gambling Board of South Africa, PricewaterhouseCoopers LLP, Wilkofsky Gruen Associates
Figure 14: Sports betting gross gambling revenue (R millions), 2009-2018
6,000
5,000
4,000 5,000
4,200
4,050
R millions
3,900
3,600
3,000
2,834
2,597
2,000
2,153
2,003
1,605
1,000
0
2009 2010 2011 2012 2013 2014 2015 2016 2017 2018
Sources: National Gambling Board of South Africa, PricewaterhouseCoopers LLP, Wilkofsky Gruen Associates
Gauteng is the leading horse racing province with R646 million in gross gambling revenues in 2013. KwaZulu-
Natal was next at R564 million. Together, the two provinces generated 66.1% of total horse racing gross
gambling revenues. The Western Cape at R192 million and Eastern Cape at R164 million were the only other
provinces with revenues of more than R100 million in 2013.
Total sports betting gross gambling revenues by category (R millions), 2009-2013
2009 2010 2011 2012 2013
Horse 1 411 1 651 1 675 1 750 1 830
racing
% change -6.6 17.0 1.5 4.5 4.6
Sports 194 352 478 847 1 004
betting
% change 57.7 81.4 35.8 77.2 18.5
Total 1 605 2 003 2 153 2 597 2 834
% change -1.7 24.8 7.5 20.6 9.1
Sources: National Gambling Board of South Africa, PricewaterhouseCoopers LLP, Wilkofsky Gruen Associates
On a percentage basis, there were wide swings between provinces, with the North West and Limpopo recording
gains in excess of 60% in 2013 and revenues falling by more than 60% in the Northern Cape. Among the leading
provinces, the Eastern Cape showed the largest gain at 10.8% while the Western Cape had the largest decline at
5.4%.
26 Raising the stakes in AfricaGross gambling revenues for betting on horse racing by province (R millions)
2012 2013 % change
Gauteng 641 646 0.8
KwaZulu-Natal 549 564 2.7
Western Cape 203 192 -5.4
Eastern Cape 148 164 10.8
Free State 62 64 3.2
North West * 55 90 63.6
Limpopo * 42 71 69.0
Mpumalanga 33 33 0.0
Northern Cape 17 6 -64.7
Total 1 750 1 830 4.6
* Betting on Table horse racing
Sources: National Gambling Board of South Africa, PricewaterhouseCoopers LLP, Wilkofsky Gruen Associates
Sports betting is concentrated in Gauteng, which at R596 million in 2013 accounted for 59.4% of total sports
betting gross gambling revenue. The Western Cape at R133 million and KwaZulu-Natal at R117 million were well
behind and the only other provinces with revenues above R100 million.
Gross gambling revenues for sports betting by province, 2013
Gross gambling revenues Share of total (%)
(R millions)
Gauteng 596 59.4
Western Cape 133 13.2
KwaZulu-Natal 117 11.7
Limpopo 60 6.0
Mpumalanga 54 5.4
North West 18 1.8
Free State 21 2.1
Northern Cape 5 0.4
Total 1 004
Sources: National Gambling Board of South Africa, PricewaterhouseCoopers LLP, Wilkofsky Gruen Associates
Betting associated with the FIFA World Cup boosts spending in years when the tournament is held (2014 and
2018), while we expect single-digit increases in 2015-17. The expansion of betting shops will drive underlying
growth while a mature horse racing segment will limit overall increases.
Aided by a boost in FIFA World Cup wagering in 2014 and 2018, we project gross gambling revenues to expand at
a 12.0% compound annual rate to an estimated R5.0 billion in 2018 from R2.8 billion in 2013. Taxes and levies
will rise from R330 million in 2013 to a projected R550 million by 2018, a 10.8% compound annual increase.
PwC 27Bingo
Figure 15: Gross gambling revenue shares by type (%), 2013
Bingo
3%
LPMs
8%
Sport Casino
betting gambling
13% 76%
Sources: National Gambling Board of South Africa, PricewaterhouseCoopers LLP, Wilkofsky
Gruen Associates
Bingo is the smallest category accounting for only 3% of total gross
gambling revenue in 2013, which was, however, an increase from 2%
in 2012. Previously only available in Gauteng, bingo was introduced in
Mpumalanga in 2012, in the third quarter of 2013 in the North West and
the fourth quarter of 2013 in the Eastern Cape.
Gross gambling revenues for bingo by province (R millions)
2012 2013 % change
Gauteng 428 685 60.0
Mpumalanga 9 38 322.2
North West 0 5 —
Eastern Cape 0 4 —
Total 437 732 67.5
Sources: National Gambling Board of South Africa, PricewaterhouseCoopers LLP, Wilkofsky
Gruen Associates
In July 2014, 12 shopping malls in KwaZulu-Natal, including the
Southcoast Mall, Galleria Shopping Mall and Liberty Midlands
Mall, applied for licences to install electronic bingo terminals. These
applications have been challenged by The People’s Forum Against
Electronic Bingo, which argues that access to these terminals will
contribute to gambling addiction.
This view is also supported by some casino operators who believe that
electronic bingo terminals in shopping malls would be a ‘convenience’
form of gambling.
28 Raising the stakes in AfricaWhether or not these specific applications are approved, we expect that electronic bingo terminals will be
introduced in new provinces and will continue to expand in provinces where they are already available. As bingo
becomes more prevalent, it will cut into growth in the catchment area for LPMs and casinos.
We expect bingo to continue to be the fastest-growing category during the next five years with a projected 19.0%
compound annual increase in gross gambling revenues from R732 million in 2013 to R1.8 billion in 2018.
Taxes and levies generated by bingo totalled R53 million in 2013, a figure we expect will rise to R135 million by
2018, a 20.6% compound annual increase.
Bingo (R millions)
2009 2010 2011 2012 2013 2014 2015 2016 2017 2018 2014-18
CAGR
Gross 197 196 235 437 732 990 1 235 1 420 1 600 1,750
gambling
revenue
% change 62.8 -0.5 19.9 86.0 67.5 35.2 24.7 15.0 12.7 9.4 19.0
Taxes and 22 23 29 45 53 75 94 110 125 135
levies
% change 46.7 4.5 26.1 55.2 17.8 41.5 25.3 17.0 13.6 8.0 20.6
Sources: National Gambling Board of South Africa, PricewaterhouseCoopers LLP, Wilkofsky Gruen Associates
Figure 16: Bingo gross gambling revenue (R millions), 2009-2018
2,000
1,800
1,750
1,600
1,600
1,400
1,420
R millions
1,200
1,235
1,000
990
800
732
600
400
437
200
235
197
196
0
2009 2010 2011 2012 2013 2014 2015 2016 2017 2018
Sources: National Gambling Board of South Africa, PricewaterhouseCoopers LLP, Wilkofsky Gruen Associates
PwC 29National Lottery
The National Lottery was established in 2000 and in 2013 generated
R4.6 billion in Lotto and PowerBall ticket sales. Lotto is the more popular
category, but with its high payouts, Powerball has been the faster
growing in recent years. The National Lottery is operated on behalf of the
Government by an appointed licensee for a term of seven years. The next
term begins in mid-2015.
The National Lottery is different from other gambling categories in that
it is operated with the goal of generating funds for charitable, sports, arts
and other worthy causes rather than as an entity focused on maximising
returns for shareholders, employees and other stakeholders. A percentage
of revenue, agreed between the operator and the Government in the
licence terms, is paid to the National Lottery Distribution Trust Fund
(NLDTF).
Ticket sales in 2013 fell 1.5% following a 3.0% increase in 2012, reflecting
a slowdown in the economy. We anticipate an additional drop in 2014
as economic conditions remain sluggish, followed by a modest pickup in
2015.
While we look for improved growth during the latter part of the forecast
period as economic conditions improve, the National Lottery will remain
the slowest growing category. We project gross gambling revenues to
rise from R2.3 billion in 2013 to a projected R2.5 billion in 2018, a 1.1%
compound annual increase.
Contributions are made from revenue to the NLDTF, which allocates
funding to arts, culture, national heritage, charities, child welfare,
religious, medical, sports and recreation entities. Eligible organisations
seeking funding must apply to the NLDTF. As the National Lottery is
operated on behalf of the Government with the specific purpose of
distributing funds to needy causes, a significant portion of gross revenue
(73.0% in 2013) goes to the NLDTF.
Contributions to the NLDTF will increase from R1.6 billion in 2013 to
a projected R1.7 billion in 2018, a 1.2% compound annual increase.
Cumulatively, the NLDTF will receive an estimated R8.8 billion from the
National Lottery during the 2014 to 2018 period.
National Lottery (R millions)
2009 2010 2011 2012 2013 2014 2015 2016 2017 2018 2014-18
CAGR
Turnover 4 323 4 390 4 575 4 710 4 640 4 560 4 600 4 650 4 750 4 900
% change 6.7 1.5 4.2 3.0 –1.5 –1.7 0.9 1.1 2.2 3.2 1.1
Gross 2 162 2 195 2 288 2 355 2 320 2 280 2 300 2 325 2 375 2 450
gambling
revenue
% change 6.7 1.5 4.2 2.9 -1.5 -1.7 0.9 1.1 2.2 3.2 1.1
Contribution 1 537 1 603 1 670 1 600 1 575 1 550 1 560 1 580 1 620 1 670
to NLDTF
% change 3.9 4.3 4.2 -4.2 -1.6 -1.6 0.6 1.3 2.5 3.1 1.2
Sources: National Lotteries Board of South Africa, PricewaterhouseCoopers LLP, Wilkofsky Gruen Associates
30 Raising the stakes in AfricaLooking back: 2013
In our previous Betting on Africa report released in November 2013, we
forecast overall gross gambling revenues for South Africa to grow by 5.8%
in 2013, which turned out to be higher than the actual 4.3% growth,
reflecting a higher payout rate for casinos, LPMs and sports betting and a
weakening economy. Casinos and LPMs fell short of our projections, while
sports betting and bingo exceeded our expectations.
Despite a 4.0% increase in turnover, casino gambling revenue rose only
0.6%, which was lower than the projected 2.4% increase. LPM growth
came in at a healthy 17.8% in 2013, but that was lower than our 30.4%
projection, as fewer LPMs were installed than we expected.
The expansion in sports betting outlets and growth in online sports
wagering led to a 9.1% rise in gross gambling revenue for sports betting,
which is above the 5.1% projected gain.
Bingo recorded a 67.5% gain in 2013, above the 54.5% forecast, reflecting
the introduction of bingo in North West and Eastern Cape.
The shortfall in gross gambling revenues led to slower growth in taxes
and levies. The 6.6% increase in 2013 was well below the 12.0% projected
rise.
Figure 17: Gross gambling revenue by type, 2013 (% growth)
80
67.5
70
54.5
60
50
% 40
30.4
30
17.8
20
9.1
5.8
5.1
4.3
10
2.4
0.6
0
Casino LPMs Sports Bingo Total
gambling betting
Forecast Actual
Sources: National Gambling Board of South Africa, PricewaterhouseCoopers LLP, Wilkofsky
Gruen Associates
PwC 31Casinos
Casino gambling
never sleep,
in Nigeria
nor should digital
Photo courtesy of Tsogo Sun
32 Raising the stakes in AfricaThere are only three licensed The Government is also permitted The casinos in Lagos are patronised
casinos in Nigeria – the Nicon to operate betting pools and horse by tourists and have been adversely
Hilton in Abuja (the first licensed racing. Despite these limitations, affected. The Nicon Hilton Casino
casino), Le Meridien Eko Hotel illegal betting exchanges are in Abuja, by contrast, has not
& Casino in Lagos and the Sun widespread and there are a number experienced a drop in tourism or
International Federal Palace Hotel of unlicensed casinos in operation. patronage. So far Nigeria has been
& Casino, which opened in 2009, successful in containing the Ebola
also in Lagos. The casino market in Nigeria has outbreak, but the Lagos casinos
been driven by a strong energy- could still suffer lingering effects
Le Meridien Eko Hotel & Casino is based economy that has been from a drop in tourism.
relatively small with only 17 table growing rapidly, with real GDP
games, including poker, and no slot rising at rates of 7.0% or more As a result of a slowing economy
machines. It is open from 10am during each of the last five years, and adverse impact on tourism
to 6am. The Nicon Hilton is open including a 7.2% increase in 2013. of the Ebola outbreak, we expect
from 9pm to 3am and has 40 slot growth to drop to 5.0% in 2014 and
machines and nine table games. Nigeria attracts many business to 4.5% in 2015. We expect that the
The Sun International Federal travellers, some of whom visit Ebola scare will have largely played
Palace Hotel & Casino is the only casinos. Casino gross gambling out by year-end 2015, and helped
licensed casino open 24 hours. It revenues have grown at double- by improving economic conditions,
features 195 slot machines and digit rates during the past three we look for faster growth over the
eight table games. years, including a 19.4% increase 2016-18 period. For the forecast
in 2013. period as a whole, gross gambling
Under Chapter 22 of the Criminal revenues will expand at a projected
Code, most forms of gambling are We expect much slower growth 7.7% compound annual rate to
illegal in Nigeria. In addition to the in 2014, in large part because of USD58 million in 2018.
three licensed casinos, exceptions moderating economic growth.
include skill-based card games, At the time of writing, Nigeria Taxes and levies will rise to an
backgammon, and Lotto Nigeria, has had 20 reported cases of estimated USD7.2 million in
the national online lottery. Ebola, including seven deaths, 2018 from USD5 million in 2013,
five in Lagos, and experienced a growing by 7.6% on a compound
temporary drop in occupancy rates annual basis.
at luxury hotels in Lagos.
Casino gambling in Nigeria (USD millions)
2009 2010 2011 2012 2013 2014 2015 2016 2017 2018 2014-18
CAGR
Gross 22.7 24.9 28.1 33.5 40.0 42.0 43.9 47.4 51.9 58.0
gambling
revenue
% change 13.5 9.7 12.9 19.2 19.4 5.0 4.5 8.0 9.5 11.8 7.7
Taxes and 2.8 3.1 3.5 4.2 5.0 5.3 5.5 5.9 6.5 7.2
levies
% change 12.0 10.7 12.9 20.0 19.0 6.0 3.8 7.3 10.2 10.8 7.6
Sources: PricewaterhouseCoopers LLP, Wilkofsky Gruen Associates
PwC 33Figure 18: Gross gambling revenue vs taxes & levies (USD millions),
2009-2018
70
60 58.0
51.9
50 47.4
43.9
40.0 42.0
40
33.5
30 28.1
24.9
22.7
20
10 5.9 6.5 7.2
3.5 4.2 5.0 5.3 5.5
2.8 3.1
0
2009 2010 2011 2012 2013 2014 2015 2016 2017 2018
Gross gambling revenues Taxes & levies
Sources: PricewaterhouseCoopers LLP, Wilkofsky Gruen Associates
Looking back: 2013
The casino market in Nigeria outperformed our expectations as the
19.4% increase in gross gambling revenues was well in excess of the 9.7%
projected increase. Growth was largely fuelled by expansion at the Federal
Palace, which increased its hours and added slot machines, as well as by
the strong economy. Taxes and levies also grew faster than we anticipated,
rising by 19.0% compared to the 0% increase expected last year.
Figure 19: Gross gambling revenue and taxes & levies,
2013 (% growth)
25
19.4
20
15
%
9.7
10
5
0
Gross gambling revenue
Forecast Actual
Sources: PricewaterhouseCoopers LLP, Wilkofsky Gruen Associates
34 Raising the stakes in AfricaYou can also read