Western Sydney Regional Waste Avoidance and Resource Recovery Strategy 2014-2017
←
→
Page content transcription
If your browser does not render page correctly, please read the page content below
Western Sydney Regional
          Waste Avoidance and
    Resource Recovery Strategy
                   2014-2017

1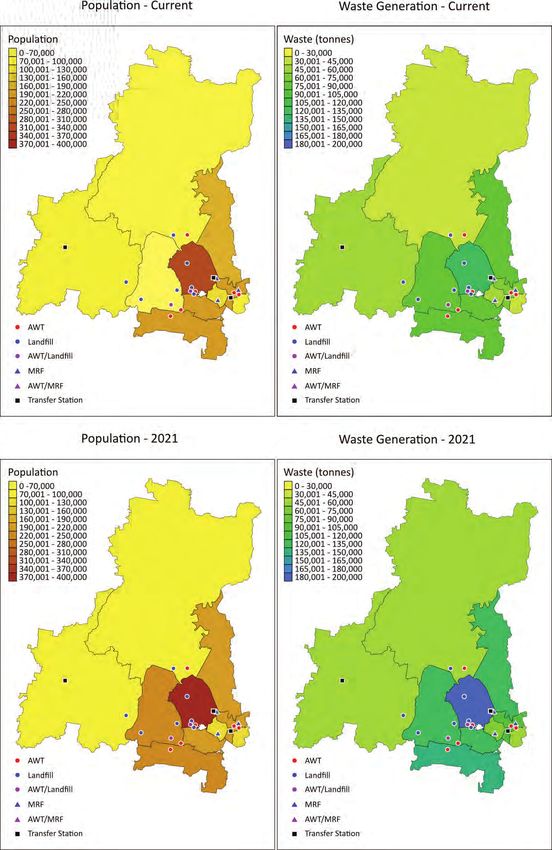
This strategy has been supported by the NSW Environment Protection Authority with funding from the waste levy.

This report has been prepared by MRA Consulting Group for WSROC in accordance with the terms and conditions of
appointment. MRA Consulting Group (ABN: 13 143 273 812) cannot accept any responsibility for any use of or reliance
on the contents of this report by any third party.

Suite 413 Henry Lawson Building, 19 Roseby Street, Drummoyne NSW 2047, Australia
Tel: +61 408 663942
www.mraconsulting.com.au

This report was reformatted by A.P. SHEERE CONSULTING
www.apsheereconsulting.com.au
Western Sydney Regional Waste Avoidance and Resource Recovery Strategy 2014-2017

Executive summary

The NSW Environment Protection Authority through its       •    Partner with the State to establish a litter baseline
Waste Less, Recycle More initiative has funded Regional         by 2015 and work towards reducing the incidence
Organisations of Councils to develop regional waste             of litter by 2017.
strategies to outline future directions for resource       •    Partner with the State to establish an illegal dumping
recovery practices across the region. Ten councils have         baseline by 2015 and work towards reducing the
come together to develop this strategy, which explores          incidence of illegal dumping by 10% by 2017.
options for addressing waste management challenges         •    Work towards enhancing regional cooperation and
into the future and seeks to maximise funding                   governance.
opportunities for the region under this initiative.
                                                           The Strategy details regional actions to contribute to
A total of 699,887 tonnes of domestic waste was            the achievement of the targets. Each action has been
collected from Western Sydney households in                analysed to identify priority actions. WSROC will work
2011/2012 through the kerbside bin services, kerbside      with participating councils to develop these regional
bulky waste collections and council drop off facilities.   actions towards achievement of these targets and to
Just over half of this waste was diverted from landfill    build future capacity for increased resource recovery
and recovered with the region achieving an overall         for a growing population in the region.
domestic waste landfill diversion rate of 53%, which is
higher than the NSW rate of 47%. Diversion rates in the
region have improved in recent years, increasing from
44% of waste recovered in 2007/2008.

To ensure that the region is contributing towards
achieving State-wide waste objectives, it has developed
regional targets under six themes that are in line with
the NSW Waste Avoidance and Resource Recovery
Strategy’s objectives:
                                                                “A planned and collaborative
•
•
    Avoid and reduce waste generation;
    Increase recycling;
                                                                           approach to waste
•   Divert more waste from landfill;                              management, which is cost
•   Manage problem wastes better;
•   Reduce litter and illegal dumping; and                        effective, supportive of our
•   Improve regional governance.
                                                               community and economy and
The regional targets identified in the development of
this Strategy are to:                                                      improves resource
• Work towards reducing regional waste generation
     from current generation of 7.8kg/capita/week to
                                                                         recovery in line with
     7.5kg/capita/week by 2021.
• Gradually improve the regional resource recovery
                                                                 State Government targets. ”
     rate to 58% by 2017 and 70% by 2021 (currently                Western Sydney Regional Waste Strategy Vision
     53%).
• Work towards achieving the Waste Avoidance and
     Resource Recovery (WARR) target for diversion of
     waste from landfill by 2021.
• Build, upgrade or facilitate 10 community recycling
     centres or innovative solutions for household
     problem wastes by 2021.
Western Sydney Regional Waste Avoidance and Resource Recovery Strategy 2014-2017

CONTENTS   1 Introduction
           1.1 The region
                                                                                          6
                                                                                          6
           1.2 Introduction to the Strategy							                                        7
           2 Where are we today?								 8
           2.1 Population and demographic information					                                8
           2.2 Waste and resource recovery collection systems 				                        9
           2.3 Waste and resource recovery tonnage data					                             11
           2.3.1 Waste trends and projections 						                                     13
           2.3.2 Waste composition							                                                14
           2.3.3 Kerbside waste systems performance analysis 				                        15
           2.4 Waste and resource recovery collection, processing and disposal contracts 16
           2.5 Current and planned waste and recycling infrastructure within the region  18
           2.5.1 Current waste infrastructure						                                      18
           2.5.2 Infrastructure Gap Analysis						                                       19
           2.6 Review of programs, initiatives and community expectations			             22
           2.6.1 Community programs and initiatives					                                 22
           2.6.2 Stakeholder engagement							                                           22
           2.7 Service compliance								                                                23
           3 Where do we want to get to?							                                          24
           3.1 Vision									                                                           24
           3.2 Strategy themes and targets							                                        24
           4 How will we get there?							                                               26
           4.1 Identifying regional actions							                                       26
           4.1.1 Avoid and reduce waste generation					                                  26
           4.1.2 Increase recycling								                                              26
           4.1.3 Divert more waste from landfill						                                   27
           4.1.4 Manage problem wastes better						                                      27
           4.1.5 Reduce litter and illegal dumping 					                                 27
           4.1.6 Improve regional governance						                                       27
           4.2 Options appraisal								                                                 28
           4.3 Identifying actions for councils						                                    30
           5 How will the Strategy be implemented?					                                  32
           Glossary									                                                             36
           Appendix A Waste Generation Forecasts						                                   38
           Appendix B Waste management contracts					                                    39
           Appendix C Regional waste facilities list						                               42
           Appendix D Community stakeholder engagement				                               44
           Appendix E Multi-criteria analysis assumptions					                           45
Western Sydney Regional Waste Avoidance and Resource Recovery Strategy 2014-2017

List of tables
Table 1: Demographic profile of the region								                                                            9
Table 2: Council household bin collection services							                                                    10
Table 3: Council household clean-up and chipping services						                                              10
Table 4: Resource recovery services offered by councils (2011/2012)					                                     11
Table 5: Total domestic waste generation, recovery and disposal (2011/2012)				                              11
Table 6: Kerbside bin service generation yields (kg/capita/week) (2011/2012)				                             12
Table 7: Gap analysis											                                                                             21
Table 8: Regional strategy targets									                                                                  24
Table 9: Ranked strategy implementation actions							                                                       28
Table 10: Suggested strategy actions for councils						                       		                             30
Table 11: Strategy Action Implementation Plan								                                                        33

List of figures
Figure 1: Snapshot: The Western Sydney region								                                                         6
Figure 2: Future population projections for Western Sydney region					                                        8
Figure 3: Total domestic waste generation from the region 2007-2012					                                     12
Figure 4: Total recovery across all domestic waste streams 2011-12					                                      13
Figure 5: Regional waste forecasts 2012-2021								                                                         13
Figure 6: Composition by weight of the domestic kerbside residual waste bin – Regional average (2011)        14
Figure 7: Composition by weight of the domestic kerbside recycling bin - Regional average (2011)             15
Figure 8: Domestic waste diversion rates 2011/2012							                                                    16
Figure 9: Current council contract timeframes								                                                        17
Figure 10: Waste facilities in the Western Sydney region							                                              18
Figure 11: Waste facilities in the Western Sydney region (detail)						                                      19
Figure 12: Gap analysis – current and future population and waste generation				                             20
Figure 13: Vision, principles and actions									                                                           32

Acronyms
Abbreviation         Definition                            Abbreviation        Definition
ABS                  Australian Bureau of Statistics       MRF                 Materials Recovery Facility
AWT                  Alternative Waste Treatment           MSW                 Municipal solid waste
C&D                  Construction and Demolition (waste)   MUDs                Multi-unit dwellings
C&I                  Commercial and Industrial (waste)     pa                  per annum
CALD                 Cultural and linguistically diverse   RID                 Regional Illegal Dumping
CRC                  Community Recycling Centre            RRA                 Regional regulated area
DCP                  Development control plan              ROC                 Regional Organisation of Councils
EfW                  Energy from Waste                     SMA                 Sydney metropolitan area
EPS                  Expanded polystyrene                  SME                 Small to medium enterprises
ERA                  Extended regulated area               SAWT                SITA Advanced Waste Treatment
FOGO                 Food organics and garden organics     SUDs                Single unit dwellings
GO                   Garden organics                       tpa                 Tonnes per annum
hhld                 Household                             WARR                Waste and Resource Recovery
HHW                  Household hazardous waste             wk                  Week
LGA                  Local Government Area                 WLRM                Waste Less Recycle More
MGB                  Mobile garbage bins                   WSROC               Western Sydney Regional Organisation of
                                                                               Councils
1 Introduction

1.1 The region
The Western Sydney region as defined by the NSW
EPA consists of the LGAs of Auburn, Blacktown, Blue
Mountains, Fairfield, Hawkesbury, The Hills, Holroyd,
Liverpool, Parramatta and Penrith. The Western Sydney   Figure 1: Snapshot: The Western Sydney region
region for this strategy is in line with the
Draft Metropolitan Strategy for Sydney
2031 and includes most of the councils in
the WSROC region. The Hills Shire is not
a member of WSROC and Bankstown City
Council is participating in the Southern
Sydney regional waste strategy.

These 10 participating councils represent
a significant geographical portion of the
Sydney metropolitan region, covering
over 5000 square kilometres and
containing a mix of regional centres and
large cities (see Figure 1). It stretches
from the heavily urbanised, multicultural
areas of Auburn and Parramatta in
the east, to the greenfields growth
centres around The Hills, Blacktown
and Liverpool, the semi-rural areas of
Hawkesbury and the World Heritage
listed areas of the Blue Mountains.

The region’s population contains a diverse
cultural and ethnic mix and makes up
one third of the total Sydney population.
The economy is worth approximately
$95 billion annually – making it the third
largest regional economy in Australia
behind the Sydney and Melbourne
CBDs. It also includes areas of great
socio-economic disadvantage in pockets
around Fairfield, Blacktown and parts
of the Blue Mountains, and areas of
affluence such as The Hills.

The Western Sydney region sits at
the forefront of Sydney’s future challenges and
opportunities. A Regional Waste Strategy needs to
ensure the region’s future direction maximises waste
avoidance and resource recovery outcomes for the
significant and growing population of the region.

   6
Western Sydney Regional Waste Avoidance and Resource Recovery Strategy 2014-2017

1.2 Introduction to the Strategy                             This regional focus will provide an opportunity to work
                                                             with other Regional Organisations of Councils (ROCs)
The ten participating councils have come together to         to progress the common actions and address shared
develop a future strategic direction for improving waste     challenges identified through the regional strategies.
management and resource recovery practices across            There may also be opportunities for councils to
the region.                                                  participate in regional partnerships with those councils
                                                             adjoining the Western Sydney region.
Under NSW 2021: A Plan to make NSW No. 1, the State
Government has identified waste management as a              This strategic and cooperative approach to the way
priority area. The NSW 2021 Western Sydney and Blue          waste is managed across the region will support
Mountains Regional Action Plan identifies that this          individual councils in improving resource recovery,
regional waste strategy will improve waste and recycling     diverting waste away from landfill and to address the
by increasing recycling, combatting illegal dumping and      increased costs associated with waste management.
tackling littering, leading to joint activities and better
information and cooperation between councils.                Implementation of this Strategy can assist individual
                                                             councils to:
This Western Sydney Regional Waste Avoidance
and Resource Recovery Strategy (the Strategy)                •   Improve recycling and resource recovery rates;
demonstrates the region’s commitment to adopting             •   Reduce contamination of recyclables;
a strategic approach to waste management. Having             •   Divert more waste from landfill;
been developed in accordance with the Environment            •   Achieve cost savings; and
Protection Authority’s (EPA) 2014 guidelines, this           •   Deliver educational campaigns to improve waste
Strategy is also consistent with the State Government’s          management behaviour.
NSW Waste Avoidance and Resource Recovery Strategy
2013-21 (WARR Strategy). This Regional Strategy fits         This Strategy explores options for addressing waste
within the wider policy context set by the State and         management challenges into the future and for
Federal governments and seeks to maximise funding            introducing effective and sustainable waste and
opportunities under the Waste Less, Recycle More             resource recovery practices across the region.
Initiative.

                                                                                                                7
2 Where are we today?

2.1 Population and demographic                                The Draft Metropolitan Strategy for Sydney forecasts
                                                              that 70% of Sydney’s population growth to 2031 will be
information                                                   in Western Sydney, with nearly 1 million people settling
                                                              in the region over the next 16 years (Figure 2). The
The region has a population of just over 1,600,000            North West Growth Centre alone, stretching through
spread across an area of 5,000km2. Approximately              The Hills, Blacktown and Hawkesbury, aims to develop
20% of the region’s population lives in the Blacktown         70,000 new dwellings in the region. The South West
LGA. Together the six councils of The Hills, Blacktown,       Growth Centre develops a number of new and existing
Fairfield, Liverpool, Parramatta and Penrith represent        suburbs within the Liverpool LGA. It is anticipated
80% of the region’s total population. The least densely       that additional growth in housing will come from the
populated local government area (LGA) is Hawkesbury,          development of multi-unit dwellings (MUDs), which
which has the largest area (2,776 km2) and the smallest       need to be accounted for when considering waste
population (64,000).                                          infrastructure and services.

Figure 2: Future population projections for Western Sydney region

                                                                                               Penrith

                                                                                               Parramatta
    Population
                                                                                               Liverpool
       2500000
                                                                                               Holroyd

       2000000                                                                                 Hawkesbury

                                                                                               Fairfield
       1500000
                                                                                               Blue Mountains
       1000000
                                                                                               Blacktown

        500000                                                                                The Hills

                                                                                               Auburn
            0
                 2011-12      2015-16      2020-21        2025-26    2030-31

 Source: Department of Planning (2009) New South Wales Statistical Local Area Population Projections, 2006-2036.

   8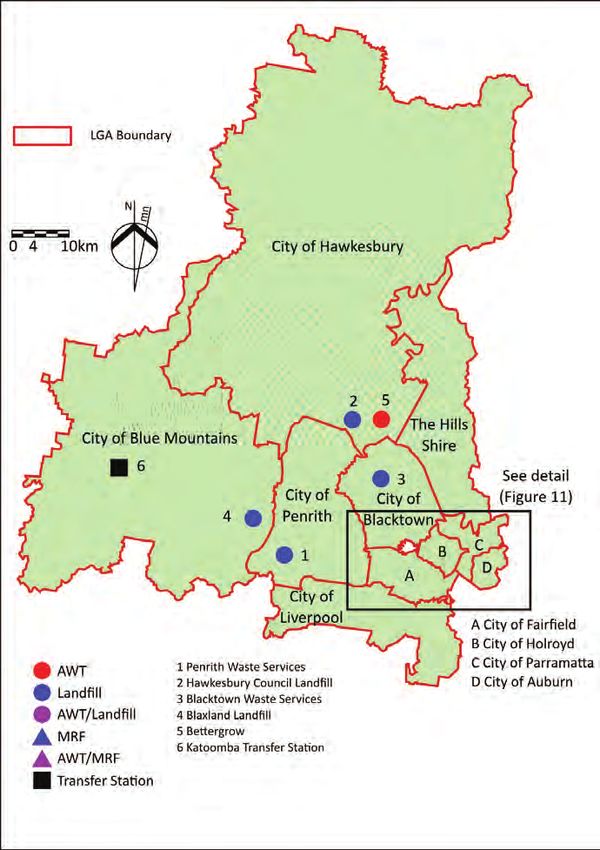
Western Sydney Regional Waste Avoidance and Resource Recovery Strategy 2014-2017

Table 1: Demographic profile of the region
                            Number of                                                                              Average persons           Socio- Economic
 Council                                         Population b            % SUDs                 % MUDs
                           households a                                                                               per hhld                index (rank) c
 Auburn                        25,118                78,286                64%                     36%                      3.1                    17
 The Hills                     59,710               176,986                86%                     14%                      3.0                   148
 Blacktown                     102,292              312,479                85%                     15%                      3.1                    77
 Blue Mountains                32,419                78,391                92%                     8%                       2.4                   128
 Fairfield                     61,204               196,622                84%                     16%                      3.2                    3
 Hawkesbury                    22,210                64,234                90%                     10%                      2.9                   121
 Holroyd                       33,816               103,869                61%                     39%                      3.1                    74
 Liverpool                     55,068               188,083                79%                     21%                      3.4                    51
 Parramatta                    60,418               174,554                56%                     44%                      2.9                    96
 Penrith                       65,259               184,681                85%                     15%                      2.8                   110
 Source/ Notes:
 a) NSW Local Government Data Report 2011- 2012
 b) ABS data 30 June 2010
 c) All NSW areas are ordered from the lowest to highest score, then the area with the lowest score is given a rank of 1, highest rank is 153.

Most of the councils are located within the Sydney                                     Of the region’s 517,514 households, 99% (512,597)
metropolitan area (SMA) for payment of the Section                                     receive a kerbside residual waste collection service
88 Waste and Environment Levy, with the exception                                      while 500,910 (97% of all households) also receive
of Hawkesbury City Council (extended regulated area                                    a kerbside recycling collection service. The 4,917
(ERA) and The Blue Mountains City Council (regional                                    households that do not receive any waste service are
regulated area (RRA). The ERA and SMA currently pay the                                mainly rural properties, who must deliver their waste
same rate for the Section 88 levy. The rate of payment                                 and recycling to an appropriate facility.
of the levy in these regions needs to be considered
when planning waste management programs.

Overall, 79% of residents live in single-unit dwellings
(SUDs), with 21% living in MUDs. However, the
proportion of those living in MUDs is expected to
increase as population density increases in the future
(Table 1). The region has a significant proportion of
newly arrived immigrants and a large proportion of
culturally and linguistically diverse (CALD) residents.

The population is highly multicultural with residents
speaking over 50 different languages. Over 35%
of residents were born overseas and up to 20% of
residents reported difficulty speaking English in some
LGA’s such as Auburn and Fairfield. This trend is likely
to continue as over 30% of new migrants to NSW settle
in Western Sydney.

2.2 Waste and resource recovery
collection systems
All councils provide kerbside residual waste and
recycling collection services in their urban areas. Five of
the ten councils provide a fortnightly garden organics
service (GO), while Penrith provides a weekly food and
garden organics (FOGO) collection. Table 2 summarises
the waste collection services provided by the councils.

                                                                                                                                                         9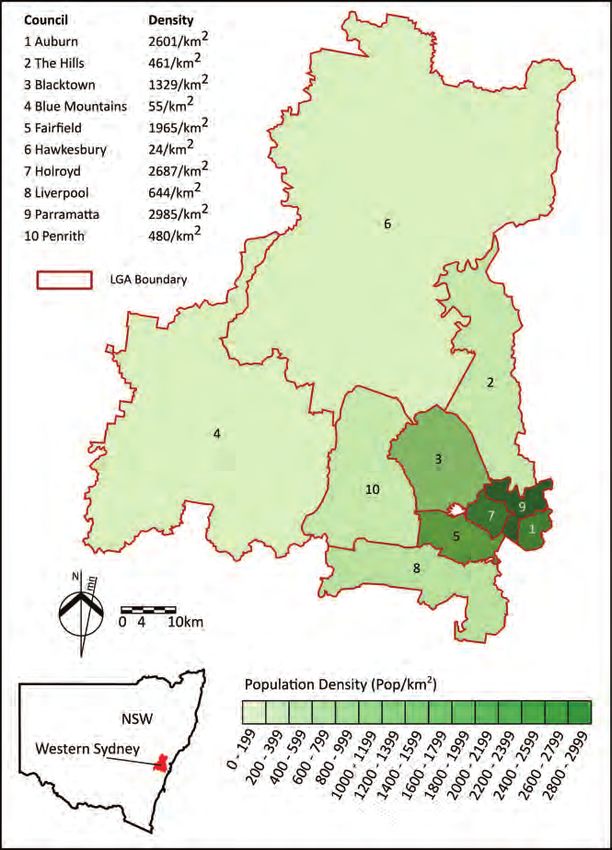
Table 2: Council household bin collection services
Residual Waste Co-mingled recycling Organics
Disposal/
Council Bin size Frequency Bin size Frequency Bin size Frequency
processing
Auburn 120L weekly landfilled 240L fortnightly 240L Fortnightly GO
The Hills 140L weekly landfilled 240L fortnightly 240L Fortnightly GO
UR3R waste
Blacktown 240L weekly 240L fortnightly no service
processing
Blue Mountains 240L weekly landfilled 140L weekly no service
UR3R waste
Fairfield 240L weekly 240L fortnightly no service
processing
Hawkesbury 240L weekly landfilled 240L fortnightly 240L Fortnightlyb GO
UR3R waste
Holroyd 240L weekly 240L fortnightly no service
processing
SAWT waste
Liverpool 140L weekly 240L fortnightly 240L Fortnightly GO
processing
Parramatta 140L weekly landfilleda 240L fortnightly 240L Fortnightly GO
Penrith 140L fortnightly landfilled c
240L fortnightly 240L Weekly FOGO
a) 12% of residual waste to UR3R in 2013/14
b) Introduced in 2013, does not yet show up in statistics
c) Organics depleted
Various processes are used for residual waste treatment All councils provide residents with a kerbside clean up
at the UR3R or SAWT alternative waste treatment service, for the disposal of bulky household waste. Some
(AWT) facilities to separate organic and some recyclable councils provide green waste chipping and/or mulching
materials from the residual waste stream, thereby services to residents, either in place of, or additional to,
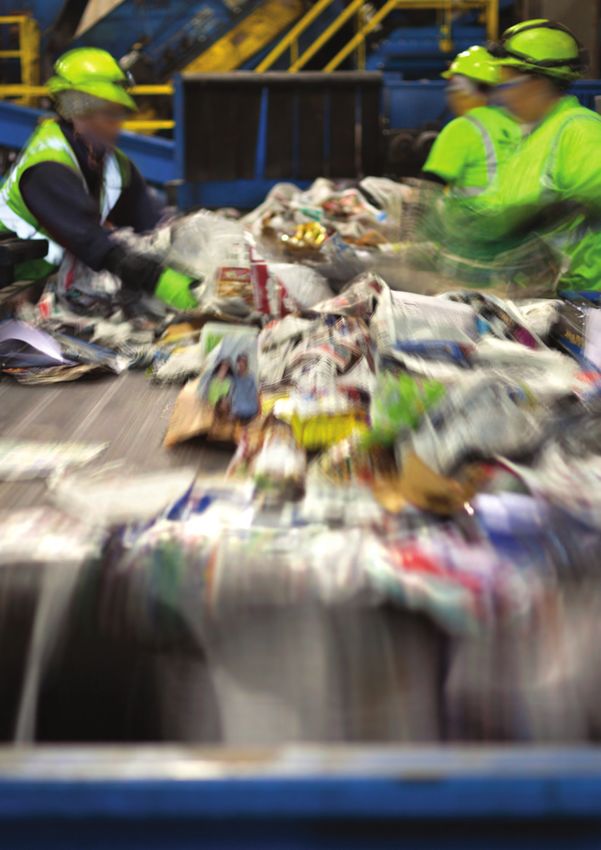
reducing the volume of waste sent to landfill. Kerbside kerbside organics services. Table 3 details these various
recyclables are collected and transported to a Material services offered by councils. The provision of safe and
Recovery Facility (MRF) to be sorted into separated effective services to MUDs as urban density increases in
material types and sent for reprocessing into new the future is a challenge to some councils, particularly
products. Organic waste is composted at composting for bulky waste collection services.
facilities to be reused in various applications. Some
councils provide kerbside chipping or drop off green
waste services in place of organics bin services.
Table 3: Council household clean-up and chipping services
Kerbside clean-up service Chipping service
Frequency
Council On-call Scheduled Frequency Kerbside service Drop-off
per annum
Auburn 4 3
The Hills 2 3 2/mth 3
Blacktown 12 3
Blue Mountains 2 ab
3 2/yrab 3
Fairfield 2 3 Weekly 3
Hawkesbury 1b 3
Holroyd 2b 3 2/mthc 3
Liverpool 2 3
Parramatta 4 3
Penrith 4 3
Notes: a) Residents are entitled to two on call services of their choice per year
b) Additional services can be provided to residents for a fee.
c) Service is open every Sunday during daylight saving time, and open twice/month during non daylight saving time.
10Western Sydney Regional Waste Avoidance and Resource Recovery Strategy 2014-2017
The councils provide opportunities for households to recycle various materials through their kerbside clean up services
and local drop off sites. Table 4 details the resource recovery services offered by each council in addition to kerbside
bin services.
Table 4: Resource recovery services offered by councils (2011/2012)
DrumMUSTER
White goods
Green waste
Paper/card-
Mattresses
Motor oil
Batteries
E-waste
Plastics
bottles
Metals
board
Tyres
Glass
Paint
C&D
Gas
Council
Auburn 3 3 3 3 3 3 3 3 3 3 3 3
The Hills 3 3 3 3 3 3 3 3 3 3 3 3 3
Blacktown 3 3 3 3 3 3 3
Blue Mountains 3 3 3 3 3 3 3 3 3 3 3 3 3 3
Fairfield 3 3 3 3 3 3 3 3 3 3 3 3 3
Hawkesbury 3 3 3 3 3 3 3 3 3 3 3 3 3 3
Holroyd 3 3 3 3 3 3 3 3
Liverpool 3 3 3 3 3 3 3 3 3 3 3 3
Parramatta 3 3 3 3 3 3 3 3 3 3 3 3
Penrith 3 3 3 3 3 3 3 3 3 3 3 3
Note: In some council areas, recovery collection points are not available at every site, and collection of some materials is limited to different parts of a council
area
2.3 Waste and resource recovery tonnage data
A total of 699,887 tonnes of domestic waste was collected from Western Sydney households in 2011/2012 through
the kerbside bin services, kerbside bulky waste collections and council drop off facilities. Just over half of this waste
was diverted from landfill and recovered with the region achieving an overall domestic waste landfill diversion rate of
53%, which is higher than the NSW rate of 47%. Diversion rates in the region have improved during the last five years,
increasing from only 44% of waste recovered in 2007/2008.
Table 5: Total domestic waste generation, recovery and disposal (2011/2012)
Total domestic
Council Total recovered (t) Total disposed (t) Recovery rate (%)
generation (t)
Auburn 10,417 23,237 33,655 31.0%
The Hills 38,772 46,311 85,083 45.6%
Blacktown 79,710 51,744 131,454 60.6%
Blue Mountains 20,278 28,667 48,945 41.4%
Fairfield 50,569 36,481 87,050 58.1%
Hawkesbury 8,663 24,154 32,817 26.4%
Holroyd 26,964 20,436 47,400 56.9%
Liverpool 53,949 24,238 78,187 69.0%
Parramatta 27,368 40,649 68,017 40.2%
Penrith 54,447 32,832 87,280 62.4%
Western Sydney 371,138 328,750 699,887 53%
NSW 1,656,880 1,865,963 3,522,843 47%
Source: NSW Local Government Waste and Resource Recovery Data Report 2011-2012 as reported by councils.
Regional waste data shows that residents generate on average 7.8 kg per person per week of material collected from
kerbside waste bins. This is slightly higher than the NSW average of 7.6 kg week (Table 6).
11Table 6: Kerbside bin service generation yields (kg/capita/week) 2011/2012
Generated (kg/capita/week)
Council Dry recycling Organics Residual Total
Auburn 0.9 0.8 5.0 6.8
The Hills 1.9 2.4 4.3 8.5
Blacktown 1.6 - 6.1 7.7
Blue Mountains 2.1 - 5.8 7.9
Fairfield 1.2 - 6.4 7.6
Hawkesbury 1.9 - 6.4 8.3
Holroyd 1.5 - 6.2 7.7
Liverpool 1.7 1.8 4.2 7.7
Parramatta 1.5 1.6 3.7 6.8
Penrith 2.1 3.5 3.0 8.7
Western Sydney 1.6 1.1 5.0 7.8*
NSW 1.9 1.4 4.3 7.6
*This figure has been rounded from the actual which is 7.76kg.
Total generation of waste in the region has increased in the past five years. This is detailed in Figure 3, which shows
the tonnage of waste composted, recycled and sent to landfill from domestic waste services between 2007-2012. The
introduction of new collection services in two LGAs in 2009 contributed to the decrease in waste sent to landfill in
2009/10, and an increase in organic waste processed at this time. Waste generation levels decreased during the years
2008/09 and 2009/10, and increased again from 2009/10 to 2011/12, resulting in an overall increase in the quantity of
waste across the three waste streams. Population growth also contributed to this increase. There has been a marginal
increase in waste recycled from 2007/08 to 2011/12 due to improved recycling practices.
Figure 3: Total domestic waste generation from the region 2007-2012
Waste generation
(tonnes/yr)
800000
Dry Recycling
700000 Organics
600000 Residual Waste
500000
400000
300000
200000
100000
0
2007–08 2008–09 2009–10 2010–11 2011–12
12Western Sydney Regional Waste Avoidance and Resource Recovery Strategy 2014-2017
Recovery rates vary among the different waste streams collected by councils as shown in Figure 4. Most waste collected
in the recycling and organics streams is recovered, and a substantial quantity of residual waste recovered through
AWT processing systems. Some waste is also recovered from kerbside clean up services. Drop off facilities offered by
some councils provide the community with further opportunities to recycle waste at specific locations in the region.
Drop off centres, particularly those in the Blue Mountains and Hawkesbury, collect significant quantities of waste and
recyclable material from residents in these council areas.
Figure 4: Total recovery across all domestic waste streams 2011-12
Tonnes/yr
500000
400000
Disposed
300000
Recovered
200000
100000
0
Residual Recycling Organics Clean up Drop off
2.3.1 Waste trends and projections
Waste generation per capita in Western Sydney has grown on average over the past four years (2010 – 2014). In
addition, total waste generation has been proven to have a positive correlation to population levels. As all ten councils
are expected to experience a significant increase in population in the future, councils are likely to see a corresponding
increase in waste generation, in addition to the per capita generation increases assuming the current rate continues.
Figure 5 presents four possible waste generation scenarios modelled on expected population or household growth and
increases in per capita or per household waste generation.
Figure 5: Regional waste forecasts 2012-2021
Tonnes/Yr
1200000 5 year historic data
1140000 Forecast Scenario 1:
Household led forecast
based on 2011/2012 t/hhld
1080000
Forecast Scenario 2:
Household forecast with
1020000
0.25%/yr growth/hhd from
2012-2013
960000
Forecast Scenario 3:
Population forecast with
900000
0.5%/yr reduction/capita
from 2012-13
840000
Forecast Scenario 4:
780000 2007-2012 trends persist,
waste generation with a
steady annual increase
720000
660000
600000
2007-08 08-09 09-10 10-11 11-12 12-13 13-14 14-15 15-16 16-17 17-18 18-19 19-20 2020-21
13• The projections of Scenario 1 and 2, which are based requirements are adequate to accommodate future
on the forecasted increase in household numbers, growth. Specific modelling for waste generation through
show higher increases in future waste generation to 2021 can be found in Appendix A.
rates. It is noted that these two scenarios indicate
a steep increase in waste generation during 2012- 2.3.2 Waste composition
13. This is due to the transition from using reported All councils carry out kerbside bin audits and their
household numbers (up to 2011-12) to Department waste management systems differ significantly as seen
of Planning forecasted household numbers from in Table 2. Therefore examining the region’s waste
2013 onwards. NSW Department of Planning composition as a whole needs to take into account the
forecasts for households are significantly higher different services provided to the community. Figure 6
than the reported current number of households. presents the average regional residual waste kerbside
Scenario 2 presents a higher level of waste due to bin composition.
the incorporation of a higher household generation
rate. The graph demonstrates a number of potentially
• Scenario 3 is modelled on expected waste recoverable resources contained within this waste
reduction per capita from waste education stream. It needs to be recognised that councils with
programs encouraging behaviour change and waste a 2-bin AWT system require residents to leave food
avoidance, yet rises due to greater population and garden waste in the residual bin for further
growth. processing. As a result, the collaborative audit data
• In Scenario 4, the total waste generation is demonstrates some portion of food and garden waste
projected using the most realistic waste generation could be recovered. The region also loses considerable
rate, which follows the historical trend (2007- quantities of recyclables to landfill through inefficient
2012). The projection shows the region’s total source separation. Up to 33% of the residual waste
waste generation is expected to continue growing bin was made up of potentially comingled recyclable
marginally to 800,000 tonnes per annum in 2020- material (rigid plastics, paper and cardboard and glass).
2021. Paper and cardboard accounted for over half of the
dry recyclable material lost to landfill by councils not
This makes it clear councils will need to consider processing residual waste through an AWT facility. Glass
population and per capita growth when planning future bottles and jars (3.36%) and plastic containers numbers
waste services. The region will need to further model 1-5 (9.55%) represented the majority of the remaining
this growth to ensure service capacity and infrastructure potential recyclables.
Figure 6: Composition by weight of the domestic kerbside residual waste bin – Regional average (2011)
Building waste 2.35%
Non-ferrous 0.56% Hazardous 0.82%
Ferrous 2.47% Earth based 4.24%
E-waste 1.32%
Miscellaneous 1.52%
Plastics 9.55%
Glass
3.36%
Paper and paper products
Garden and other organics
20.32%
20.15%
Food organics 33.34%
14Western Sydney Regional Waste Avoidance and Resource Recovery Strategy 2014-2017
The contamination levels of the comingled recycling bin show the region has a slightly higher rate of contamination
(9.30%) than the SMA region (7.94%). Some councils have very low contamination rates while higher rates are found
in other areas and require further attention. Organic wastes, earth based materials and E-waste are some of the most
common contaminants found in the kerbside recycling bin. Paper and paper products are by far the most common
material recycled in Western Sydney (Figure 7).
Figure 7: Composition by weight of the domestic kerbside recycling bin - Regional average (2011)
Building waste 0.15% Hazardous 0.25%
Earth based 0.48%
Ferrous 2.66%
E-waste 0.43%
Non-ferrous 0.83%
Miscellaneous 0.57%
Plastics 8.66%
Glass 26.17%
Paper and paper products 55.8%
Organics 4.00%
2.3.3 Kerbside waste was identified. The main factor influencing diversion
systems performance analysis rate is AWT processing for either 2 or 3 bin collection
The different councils’ domestic waste services result systems.
in variable levels of recovery effectiveness due to the
different collection systems in place. Figure 8 shows It is noted that the EPA’s preferred resource recovery
the variation of diversion rates in Western Sydney. practice for local councils is to use 120L residual waste
The council with the highest resource recovery rate is bins alongside a 240L yellow-top recycling collection bin1,
Liverpool with 69%, who provides a 3 bin service with which aims to encourage and reinforce recycling and
residual waste processed at SAWT. Penrith has a 3 bin waste avoidance behaviour. A range of issues, including
FOGO service resulting in 62% diversion. Blacktown, factors such as potential for bin contamination, are
Fairfield and Holroyd councils are also performing considered by councils when selecting bins for service.
above the State average with 61%, 58% and 57%
1 OEH (2011) Domestic Kerbside Waste and Recycling in NSW, Report on
diversion rates respectively as a result of their 2 bin AWT the results of waste audits of household kerbside collection systems 2007-
collection systems. Those councils not utilising an AWT 2008
system or a 3-bin FOGO system are performing below
the State average regardless of whether they have a 2
or 3-bin garden organics system in place.
Five of the councils offer 120L or 140L mobile garbage
bins (MGB) for the residual stream and a 240L MGB
for recycling. Remaining councils provide a 240L
residual waste MGB and a 240L recycling MGB with the
exception of Blue Mountains, which provides a 140L
recycling bin collected weekly. No correlation between
smaller residual waste bins and resource recovery rate
15Figure 8: Domestic waste diversion rates 2011/2012
%
80 2 bin
2 bin AWT
69%
70 3 bin GO
62%
61% 3 bin FOGO
60 58% 57%
53%
50 46% 47%
41% 40%
40
31%
30 26%
20
10
0
Auburn The Hills Blacktown Blue Fairfield Hawkesbury Holroyd Liverpool Parramatta Penrith Region NSW
Mountains
2.4 Waste and resource recovery collection, processing and disposal
contracts
Western Sydney councils use a combination of council staff and external contractors to carry out the collection of
various waste streams from the household. In-house collection services are most commonly used to collect residual
waste and kerbside clean up waste streams, with some councils also using in-house services to collect recycling streams.
External contractors are used for the disposal of all waste streams, with the exception of Blue Mountains (residual and
clean up) and Hawkesbury (residual) who own their own landfills.
There is currently a joint tender opportunity being explored by some participating councils. Fairfield, Parramatta,
Liverpool and Bankstown are currently reviewing tenders for the receipt and processing of household clean up material,
to maximize resource recovery opportunities in this waste stream. There is also a joint tender managed by WSROC that
provides for mattress recycling across nine councils in the region. Figure 9 shows the expiry of waste disposal contracts
of the councils through to 2025. There may be scope to investigate joint tender opportunities for some waste streams
in the future. Appendix B lists all the municipal waste collection, disposal and processing contracts of the Western
Sydney councils.
16Auburn
Blacktown
Blue Mtn
Fairfield
Hawkesbury
Holroyd
Figure 9: Current council contract timeframes
Liverpool
Parramatta
Penrith
The Hills
2013 2014 2015 2016 2017 2018 2019 2020 2021 2022 2023 2024 2025
Organics processing Clean-up disposal/ processing
Recycling processing Gate price organics processing
Own landfill Gate price clean-up disposal/ processing
Garbage disposal / processing
Note: a) Blue Mountains Blaxland Landfill has approval for extensions equivalent to capacity until approx. 2029-30
17
b) Penrith Council has a separate residual waste processing contract for 2 bin services, which will expire in 2021
Western Sydney Regional Waste Avoidance and Resource Recovery Strategy 2014-20172.5 Current and planned waste Most recyclable material is sent for processing to the
VISY Smithfield MRF, with other recyclables processed
and recycling infrastructure at Polytrade Rydalmere MRF and SITA Chullora MRF.
Source separated food and garden organics (Penrith)
within the region is composted at the SAWT facility. Garden organics
are sent for processing to SITA Eastern Creek Resource
2.5.1 Current waste infrastructure Recovery Park (The Hills, Hawkesbury and Parramatta),
There are a number of waste management facilities Badgerys Creek ANL (Liverpool) or Greenacre Resource
within Western Sydney, including landfills, AWT Recovery (Auburn). Further details on waste facilities
facilities, MRFs and organics processing facilities. utilised by councils is included in Appendix C.
Commercial operators manage the majority of these
facilities. Council owned landfills are in operation in
the Blue Mountains (Blaxland) and Hawkesbury (South
Windsor). Collectively, the ten councils send their Figure 10: Waste facilities in the Western Sydney region
domestic waste to 15 various waste
and recycling facilities for
processing or disposal. Most of
these facilities are located within
the region. Figure 10 and Figure
11 illustrate the location of various
waste and recycling facilities within
the region. Appendix C details a full
list of waste and recycling facilities
which may be accessed in Greater
Western Sydney and its immediate
surrounds.
Most landfills in the region are
large sites with disposal capacity in
excess of 20,000 tonnes per annum.
Resource recovery practices at
landfills and transfer stations vary
across the region.
Two AWT facilities are used by
councils to process residual waste.
UR3R and SAWT facilities process
residual waste from Blacktown,
Fairfield and Holroyd (UR3R), and
Liverpool (SAWT). Parramatta’s
current disposal contract with SITA
includes the provision of a new
AWT at Lucas Heights. Delivery
of the facility has been delayed
and as a result, an interim offer of
landfilling at Eastern Creek with
a percentage processed through
UR3R is in place. Penrith also sends
a proportion of residual waste to
the SAWT facility for processing.
Remaining councils send residual
waste to landfill. Hawkesbury and
Blue Mountains dispose of residual
waste at their council-owned landfills. Residual waste
from Parramatta and Penrith is sent to Eastern Creek
landfill. Residual waste from The Hills and Auburn is
sent to Clyde transfer station for disposal at Woodlawn
landfill (Goulburn).
18Western Sydney Regional Waste Avoidance and Resource Recovery Strategy 2014-2017
Figure 11: Waste facilities in the Western Sydney region (detail)
2.5.2 Infrastructure Gap Analysis
The gap analysis attempts to assess the effectiveness
of future waste and resource recovery facilities in light
of population growth and increased waste generation,
in relation to the location of facilities throughout the
region and their capacity to increase diversion from
landfill.
The tonnages for the prospective increase in waste
generation were chosen from forecast scenario 2, Figure
5 (ie. 0.25% growth in waste generation per household
from 2013) as this scenario gives the highest possible
figure for future waste generation. This strategy is driven
by the need to divert domestic waste from landfill so
options for waste management will be structured on
the processing and disposal of domestic waste. To deal
with the prospective increases in tonnage within the
Western Sydney region an appraisal of the potential
available AWT/MRF processing capacity to come on line
in the next 3-5 years has been undertaken.
Figure 12 shows projected population and waste
generation levels relative to existing waste and recycling
infrastructure. Specific council projections though
to 2021 can be seen in Figure 2 for population and
Appendix A for waste generation.
19Figure 12: Gap analysis – current and future population and waste generation 20
Western Sydney Regional Waste Avoidance and Resource Recovery Strategy 2014-2017

Of the available facilities within the region, SITA’s Eastern                   is to be operating if approved within the next 3-5
Creek Landfill and their Chullora MRF are likely to close                       years.
between now and 2021, and the current Hawkesbury                         •      Dial A Dump Industries will also be offering to
City Waste Management Facility (landfill) will run out                          receive several hundred thousand tonnes per
of space in 2019. To offset the impact of this reduction                        annum (no definitive figure given) through their
in recycling capacity, SITA is contracting the processing                       Next Generation energy from waste plant within
of their recyclables from the Chullora MRF to the                               the next 3-5 years subject to approval.
recycler Polytrade. The residual waste volumes from                      •      Polytrade is proposing an increase in their
Eastern Creek could be managed through the market                               productivity at Rydalmere and Enfield to permit an
place which has potential capacity to accommodate                               additional 100,000 tonnes per annum of capacity
current disposal tonnages through a number of projects                          for receipt and processing of comingled recyclables,
including:                                                                      subject to contracts being secured.
                                                                         •      Consideration should also be given to the potential
•   Veolia are bringing on line an additional 240,000                           processing facility in the Hawkesbury region and
    tonnes per annum of processing of residual waste                            the proposed Lucas Heights AWT by SITA to divert
    between 2016 and 2018 through their Woodlawn                                waste from landfill.
    Mechanical Biological Treatment plant (once
    constructed).                                                        A key challenge for councils in the region is the
•   SITA currently has a development application                         availability of facilities within reasonable distance to
    lodged for receipt of an additional 100,000 tonnes                   their LGA. There are several other smaller projects
    per annum of processing of residual waste at their                   which will increase capacity further. The reporting of
    SAWT facility. This may come online within 2-5                       these smaller projects at present will have little impact
    years providing contracts are secured (and after                     on the strategy as a whole. The figures nominated
    modification to SAWT to increase production                          above are sourced solely from the principal service
    capacity).                                                           providers and subject to change. Circumstances such as
•   Visy is currently scoping an energy from waste (EfW)                 development applications being rejected or limitations
    project to process residual waste. The capacity                      to project funding may render the projects non-viable.
    sought will be several hundred thousand tonnes                       Specific tonnages relating to available capacity can only
    per annum (no definitive figure given) and their aim                 be confirmed on commitment from the contractor.

The results of the gap analysis modelling can be seen in Table 7 below. The assumptions that apply to this gap analysis
modelling are:
• Waste generation projection is based on household forecast with 0.25%/yr growth/hhld generation from 2012-
    2013 onwards (Scenario 2, Figure 5);
• All dry recyclables are recovered in the comingled recycling stream by 2021; and
• All Sydney metropolitan councils have access to AWT capacity and capacity is proportioned accordingly.

As a result of the modelling it can be seen that by 2021, a total of 1,040,000 tonnes of domestic waste will be collected
from households in the region. Of this waste approximately 65% will be residual waste. More organic and residual
waste processing facilities with additional capacity of 300,000 tonnes per annum will be required to achieve the NSW
WARR diversion rate by 2021.

Table 7: Gap analysis
Processing capacity for                                            Organics/residual waste
                               Recyclable MRF*
the region (tonnage as                                              processing capacity*
of 2011)                            400,000                                  200,000                             Approx. 600,000

Projected waste
generation                       Dry recycling                Organic                  Residual                         Total
(tonnage as of 2021)
Western Sydney                      200,943                   168,982                   668,609                       1,038,535
                                                      Target 2021=70% diversion rate
                                                                                   Gap for AWT processing of organic and residual waste
 Tonnage of residual waste and organic matter targeted for recovery by 2021**
                                                                                                        approx.
                               526,031 tonnes                                                        300,000 tonnes
*Calculation is based on current processing capacity in SMA from the GHD report and waste generation rate (2011-12) provided by EPA.
**Assume all dry recycling will be recovered within existing infrastructures.

                                                                                                                                       21
2.6 Review of programs, identified potential synergies and common challenges.
Challenges include needs for infrastructure within
initiatives and community reasonable distance, communicating effectively with
CALD communities, high contamination rates of
expectations recycling bins in MUDs and leakage of recyclables into
the residual waste stream. The possibility for shared
2.6.1 Community programs and initiatives learnings around these issues has been identified as an
Councils are engaging their communities with a number important Strategy goal. Common synergies identified
of waste education programs and services that increase include small infrastructure sharing arrangements,
and improve waste and recycling practices in the greater efficiency from regional processing facilities
community. Common programs offered in the region and improved planning advocacy for future waste
include: infrastructure needs.
• Contamination management programs, seeking to
improve the community’s understanding of what A workshop was held with all participating councils,
can be placed into recycling and organics bins; WSROC staff, representatives from the EPA and MRA
• School education programs, informing students Consulting Group to detail the strategy direction. The
about the environmental impacts of waste and the workshop canvassed the findings from individual council
benefits of recycling; meetings, the existing regional baseline was presented
• Food waste avoidance programs, seeking to reduce and the regional vision, themes, targets and regional
the volume of avoidable food waste disposed at the actions contained within this Strategy were agreed.
household level; Individual councils will investigate implementing the
• Managing food and garden organics at home council-level options relevant to their LGA once the
through composting and worm farming; and Regional Strategy has been adopted.
• Electronic waste collection services, reducing
electronic waste disposed of in kerbside services. A group of councils in the region’s north-west have
been working together to facilitate the development
of waste processing infrastructure in the area. There
Many councils have noted that contextually based/ is the potential for municipal and/or organic waste
targeted education programs and initiatives are processing to be developed on land made available in
generally more successful than high-level mass produced the Hawkesbury region in the near future.
education materials in bringing about behaviour change
at the household level. There may be greater scope for Current discussion about the provision of a processing
successful programs to be replicated across the region. facility has developed from concern over the lack of
accessible infrastructure in this region. This area has the
The councils of Fairfield, Holroyd, Liverpool, Penrith, challenge of significant transport distance to existing
Parramatta and The Hills are members of the Western facilities elsewhere, as well as proposed landfill closures
Sydney Regional Illegal Dumping (RID) Squad, which placing added pressure on existing and proposed
has been successful in alleviating pressure on internal processing capacity in the Sydney basin.
council resources when dealing with illegal dumping
incidents. Several councils have indicated that they Councils within reasonable transport distance of the
would like to review the performance of the RID Squad Hawkesbury facility are working together to develop
and possibly augment its structure and function. technical documents to scope the viability of a future
facility. It is anticipated that this may assist to provide
2.6.2 Stakeholder engagement cost effective resource recovery solutions and increase
Stakeholder engagement is an important process diversion of waste from landfill in the region.
in planning for regional waste management and
infrastructure into the future. Western Sydney councils,
waste industry organisations and community groups
(see Appendix D) were engaged during the formulation
of this strategy to provide input on the current and
future state of the region. “Stakeholder engagement
is an important process
Local councils in planning for regional
Participating councils were engaged during strategy
development to ensure that this strategy represented waste management and
the vision and needs of participating councils. Waste infrastructure into the
management staff at each council participated in this
process which has formed a vision for the Strategy and
future.”
22Western Sydney Regional Waste Avoidance and Resource Recovery Strategy 2014-2017
Waste and recycling industry
Stakeholders have been interviewed during the course
2.7 Service compliance
of the Strategy formation to seek their opinions and A check of all facilities where waste is processed or
plans in relation to the WLRM Initiative. The primary disposed has been undertaken to ensure all facilities
stakeholders targeted for discussion were waste and receiving waste are licensed or are in the process of being
recycling transporters, processors, landfill operators and licensed by the EPA. When considering the direction of
other ROCs. Discussion centred on infrastructure needs, the region and councils for resource recovery, councils
diversion of material from landfill and education. Details not already doing so may wish to assess their current
of discussions held and data gathered from stakeholders contracts against performance frameworks.
are considered in the strategy and its implementation,
and have assisted greatly, particularly in areas such as
calculating future infrastructure requirements.
The most common challenge expressed by service
providers in relation to infrastructure was the need
for long term contracts to progress construction or
expansion of facilities. This group also nominated the
importance of further waste and resource recovery
education programs and other engagement activities
with the community to increase understanding
of resource recovery. Stakeholders expressed a
commitment to the WLRM initiative providing the
targets set are not unrealistic. Engagement with
industry stakeholders will continue throughout the life
of strategy.
Community sector
Local stakeholders were contacted to provide an
opportunity to give feedback and help shape the
Strategy. These included community groups, local
chambers of commerce, other non-government
organisations and local environmental and conservation
groups. Feedback from the community included
expanding waste education campaigns and encouraging
the community to recycle correctly, extending resource
recovery services and lack of knowledge about proper
disposal of household problem wastes. Options for
addressing the issues raised by community stakeholders
are addressed in Chapter 4.
Consultation on specific actions and programs will
be undertaken to ensure the outcomes of strategy
projects also meet community expectations. Ongoing
consultation within communities will play an important
role to understand the challenges in the region, providing
effective and meaningful programs and delivering
regional outcomes. Public consultation should also be
conducted by individual councils before any specific
changes to their waste and resource recovery services
are considered.
233 Where do we want to get
to?
3.1 Vision •
•
Avoid and reduce waste generation;
Increase recycling;
A planned and collaborative approach to waste • Divert more waste from landfill;
management, which is cost effective, supportive of • Manage problem wastes better;
our community and economy and improves resource • Reduce litter and illegal dumping; and
recovery in line with State Government targets. • Improve regional governance.
The key outcomes that councils are aiming to achieve
3.2 Strategy themes and targets through development of this long term Strategy are to:
• Make a significant contribution towards the
By working together to create a regional waste achievement of the NSW’s 2021 WARR targets;
strategy, councils are committed to improving regional • Improve and increase current services for household
cooperation and identifying opportunities to improve recycling and organics diversion;
the economic viability of recycling and resource • Provide community education on best practice
recovery practices in the region. waste avoidance and resource recovery;
• Provide a sustainable and healthy environment
To ensure that the region is contributing towards through reducing the incidences of litter, illegal
achieving State-wide waste objectives, it has chosen to dumping; and
develop regional targets under six themes that are in • Gain access to WLRM grant funding opportunities.
line with the NSW WARR Strategy’s objectives.
Table 8: Regional strategy targets
Themes (NSW targets) Regional target
Work towards reducing regional waste
generation from current generation
Avoid and reduce waste generation
of 7.8kg/capita/week to 7.5kg/capita/
week by 2021.
Increase recycling Gradually improve the regional
(to 70% MSW, 70% C&I and 80% C&D by resource recovery rate to 58% by 2017
2021) and 70% by 2021 (currently 53%).
Divert more waste from landfill Work towards achieving the WARR
(to 75% by 2021 for all streams) target by 2021.
Build, upgrade or facilitate 10
Manage problem wastes better community recycling centres/
(Build 86 CRCs – 1 per 50,000 households) innovative solutions for household
problem wastes by 2021.
Partner with the State to establish a
baseline by 2015 and work towards
reducing the incidence of litter by 2017.
Reduce litter and illegal dumping
Partner with the State to establish a
(Reduce litter by 40%)
baseline by 2015 and work towards
reducing the incidence of illegal
dumping by 10% by 2017.
Work towards enhancing regional
Improve regional governance
cooperation and governance.
24Western Sydney Regional Waste Avoidance and Resource Recovery Strategy 2014-2017
“Councils are committed to
improving regional cooperation and
identifying opportunities to improve
the economic viability of recycling
and resource recovery practices in
the region.”
254 How will we get there?
4.1 Identifying regional actions 4.1.2 Increase recycling
Actions:
1. Conduct an infrastructure needs assessment;
The actions identified for implementation at a regional
2. Conduct strategic land use planning;
scale are centred around the ‘themes’ of avoiding 3. Advocate to the State Government for strategic
and reducing waste generation, increasing recycling, waste asset planning;
diverting more waste from landfill, managing problem 4. Facilitate Energy from Waste projects; and
wastes better, reducing litter and illegal dumping 5. Conduct AWT, GO, FOGO options evaluation.
and enhancing regional cooperation. The Strategy
focuses on regional actions that will pave the way for WSROC has an essential role to play in terms of
council-level actions to be implemented gradually identifying and laying the groundwork to address
and where appropriate. These actions listed below infrastructure needs and resource recovery program
will be undertaken by WSROC staff on a regional level priorities. Identifying the appropriate infrastructure
on behalf of participating councils. Funding has been is a top priority for the region. This is both due to the
provided through the Better Waste and Recycling Fund prospective closure of landfill facilities as well as a desire
to conduct some regional actions. Further funding will amongst member councils to encourage, develop and
be sought from grants such as the Waste Less, Recycle utilise AWT and EfW infrastructure.
More grants program, where funding is required to
develop and deliver actions. To build upon the gap analysis undertaken in this
Strategy, WSROC will develop a comprehensive
4.1.1 Avoid and reduce waste generation infrastructure needs analysis in order to determine
Actions: where infrastructure is required, the catchment area
1. Make use of NSW EPA waste education publications required for the supply of adequate feedstock and the
and develop education programs; councils likely to support/participate in the development
2. Facilitate a regional education program; and of each facility. This analysis will then be supported
3. Identify CALD communities in each LGA and explore
with an options evaluation of various technologies,
options for central publication of waste education
materials in these languages. which would detail the likely cost of infrastructure
options and commercial opportunities for the potential
Promoting waste avoidance and minimisation is establishment of facilities.
notoriously difficult for councils and ROCs. Generation
of waste is inherent to an economic system premised A key aspect of securing the required waste processing
on growth and consumerism. However, education is infrastructure will be strategic land use planning,
a core tool that can be used by councils and ROCs to whereby a coordinated approach to land use and
promote waste avoidance and minimisation. WSROC associated planning permits is developed among
will strive to develop and offer waste education material councils. This will also require action by the State to
to provide a clear and consistent message across the facilitate appropriate planning approvals adjustments
region, especially where gaps have been identified. and to develop a favourable context for the
establishment of waste infrastructure.
There may also be an opportunity for councils to reduce
costs associated with publishing education materials,
for example, through WSROC identifying commonalities
between respective councils such as the incorrect use
“Generation of waste is
of plastic bags in recycling bins. WSROC may identify inherent to an economic
common CALD communities which may reduce the system premised on growth
need for various councils to be individually producing
similar bilingual education materials.
and consumerism.”
26Western Sydney Regional Waste Avoidance and Resource Recovery Strategy 2014-2017
4.1.3 Divert more waste from landfill 4.1.5 Reduce litter and illegal dumping
Actions: Actions:
1. Assessment of audits of contamination of the 1. Seek funding to augment the RID Squad; and
recycling bin; 2. Establish a regional baseline for litter and illegal
2. Assessment of audits of leakage of recyclables into dumping.
residual waste bin;
3. Investigate bin capacity issues for households Illegal dumping is an issue that most councils within
that have high leakage rate, to provide additional the region find challenging. The region is particularly
recycling capacity; and vulnerable to large scale illegal dumping in rural areas,
4. Facilitate business options for councils’ domestic
with much of the waste originating from more urban
waste streams.
areas of Sydney. Illegally dumped waste can often
include hazardous wastes such as asbestos.
Understanding the composition of both the recycling
and residual waste streams is key to increasing landfill
Some councils are members of the Western Sydney RID
diversion. WSROC will try to achieve economies of scale
Squad however this does not address all illegal dumping
for its members by exploring the possibility of a joint
incidents within the LGAs. Some councils require
tender for a consultancy to undertake audits in several
additional compliance resources to assist with illegal
councils.
dumping incidents not investigated by the RID Squad.
An audit report on recyclables leakage to the residual
The Strategy aims to support RID Squad and council
waste stream based on available audits from individual
compliance teams by seeking additional funds and
councils will demonstrate across the region where there
resources, and investigating opportunities to assist
is a need to supply additional recycling capacity, on an
councils to reduce illegal dumping. As a first step,
opt-in basis for households that fill up their recycling
WSROC will seek funding on behalf of Member Councils
bins. WSROC will work with councils who are looking
to augment the RID Squad and enhance council
for options to provide additional recycling capacity.
managed programs. WSROC will also support councils
participating in the Regional Household Asbestos
To further increase waste diversion from landfill, WSROC
Disposal trials to educate residents on asbestos disposal
will assume a role in identifying potential markets that
and reduce illegal dumping of the material.
are sought for common waste products from two or
more councils. This involves WSROC further exploring
Developing an understanding of littering motives and
the common challenges shared by participants and
methods will aid in establishing a baseline for litter and
identifying ways in which councils can work together.
illegal dumping. Programs to address littering, which
may include NSW EPA litter campaigns, will ensure
4.1.4 Manage problem wastes better that the issue attracts attention throughout the region
Actions: and that councils will benefit from joint resources.
1. Scope sites for establishment of CRCs;
Establishing a baseline for these streams is also key to
2. Engage with (public and private) site holders to
establish CRCs network; achieving reductions in litter and illegal dumping.
3. Promote the creation and development of
innovative solutions; and 4.1.6 Improve regional governance
4. Provide assistance with CRC/innovative solution Actions:
grant applications and coordination between 1. Maintain a regional waste managers network;
councils. 2. Report annually on the progress of the action plan;
3. Review contracts to identify opportunities for joint
WSROC and the councils will strive to establish 10 contracts and collaboration;
CRCs/innovative solutions by 2021, under the EPA’s 4. Aggregate audit reports into regional data report;
WLRM Initiative. Funding has been awarded for the and
development of CRCs to Liverpool and Blue Mountains, 5. Establish a library of best practice waste systems.
and for an innovative solution to Holroyd (partnering
with Auburn and Parramatta). However, the region has
not yet identified enough sites to accommodate CRCs “The region is particularly
or enough applicants/innovative solutions to meet the vulnerable to large scale illegal
target. On behalf of its members, WSROC will assume
a role in assessing and identifying eligible sites as well
dumping in the rural areas, with
as engaging with the relevant site owner. To develop much of the waste originating
innovative solutions applicable to the region, WSROC from more urban areas of
will engage with councils and explore partnerships with
the waste industry and other stakeholders. Sydney.”
27You can also read