Commensal Rodents in 19th Century Australasia: Diversity, Invasion Routes and the China Connection - Research ...
←
→
Page content transcription
If your browser does not render page correctly, please read the page content below
Commensal Rodents in 19th Century Australasia: Diversity, Invasion Routes and the China Connection Andrew James Veale ( andrew.j.veale@gmail.com ) Manaaki Whenua: Landcare Research New Zealand https://orcid.org/0000-0002-9405-272X Carolyn King University of Waikato School of Science Wayne Johnson Place Management NSW Lara Shepherd Museum of New Zealand Te Papa Tongarewa Research Article Keywords: Commensal rodents, diversity, invasion, DNA Posted Date: May 11th, 2021 DOI: https://doi.org/10.21203/rs.3.rs-339763/v1 License: This work is licensed under a Creative Commons Attribution 4.0 International License. Read Full License
Commensal rodents in 19th century
Australasia: diversity, invasion routes and
the China connection
Veale, Andrew J.1; King, Carolyn M.2; Johnson, Wayne.3; Shepherd, Lara.4

   1) Manaaki Whenua Landcare Research, 231 Morrin Rd, St Johns, Auckland 1072.
      andrew.j.veale@gmail.com. Corresponding author.
   2) University of Waikato, School of Science, Hamilton 3240. cmking@waikato.ac.nz
   3) Place Management NSW, PO Box N408, Grosvenor Place NSW 1220.
      wayne.johnson@property.nsw.gov.au
   4) Museum of New Zealand Te Papa Tongarewa, PO Box 55, Cable Street, Wellington
      601, New Zealand. Lara.Shepherd@tepapa.govt.nz

Orcid IDs:

Andrew Veale: 0000-0002-9405-272X
Carolyn King: 0000-0001-6048-8931
Lara Shepherd: 0000-0002-7136-0017

Abstract
The present genetic diversity of commensal rodent populations is often used to inform the
invasion histories of these species, and as a proxy for historical events relating to the movement
of people and goods. These studies assume that modern genetic diversity generally reflects
early colonising events. We investigate this idea by sequencing the mitochondrial DNA of
rodent bones found in a 19th-century archaeological site in The Rocks area of Sydney,
Australia, the location of the first historical European port. We identified 19th-century bones
from two species, Rattus norvegicus and Mus musculus domesticus. We found six genetic
haplotypes in the 39 Norway rats, showing either multiple early introductions or a diverse
initial founding population. One of them was identical with Norhap01 common in the North
Island of New Zealand, but none was like the haplotype Norhap02 found throughout the South
Island. We found three haplotypes in seven house mice, all belonging to the dominant
subspecies established in Australia, M.m. domesticus. There was no evidence for M. m.
castaneus or M. m. musculus having established there. We had few modern R. norvegicus and
M. musculus DNA sequences from Sydney, but those we had did tentatively support the
hypotheses that (1) modern samples can represent at least a preliminary estimate of historical
diversities and origins, and (2) Asian haplotypes of both Norway rats and of house mice reached
the South Island of New Zealand early in colonial times direct from China rather than through
Port Jackson.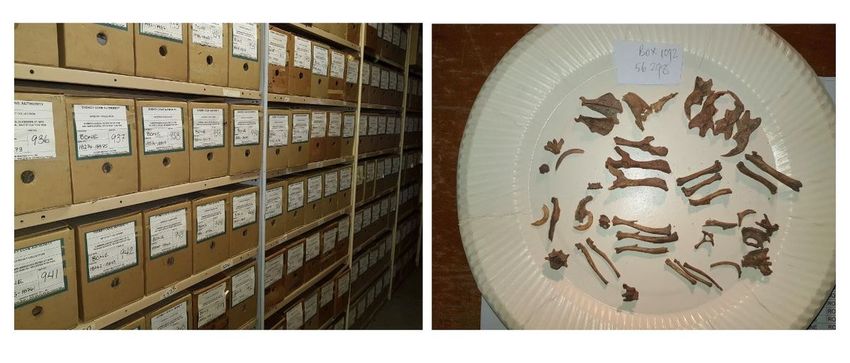
Declarations
Funding
Funding for the genetics analysis was provided by Waikato University’s Strategic Investment
Fund, courtesy Prof Bruce Clarkson.

Conflicts of interest
None

Availability of data and material
All sequences will be uploaded to Genbank upon acceptance

Code availability
Not Applicable

Authors' contributions
A. J. Veale helped conceive the study, performed lab work, performed the analyses, created the
figures and wrote the first draft of the paper.
C. M. King conceived the study, obtained funding, and helped write and edit the paper.
W. Johnson curated and interpreted the archaeological samples and helped edit the paper.
L. Shepherd performed the ancient DNA lab work, helped assemble the sequences, and helped
edit the paper.
All authors read and approved the final manuscript.

Ethics approval
Thanks to the State Library of NSW for permission to reproduce the photo in Figure 4.

Consent to participate
All authors read and approved the final manuscript and consent to their participation.

Consent for publication
All authors consent to the publication of the article in Biological Invasions when accepted.
Introduction
Commensal rats and mice, particularly the brown rat (Rattus norvegicus), the ship (black) rat
(Rattus rattus) and the house mouse (Mus musculus), are the most widespread and destructive
invasive vertebrates around the world (Genovesi et al. 2012; Howald et al. 2007; Pimentel et
al. 2000). Because commensal rodents have a close relationship with humans, having travelled
around the world with us, their distributions can often tell us more about our own history than
can the sparse documentary records available (Brouat et al. 2014; Gabriel et al. 2015; Gabriel
et al. 2011; Jones et al. 2013; Jones et al. 2011; Jones et al. 2012; Li et al. 2020). Also, the
history of rodent invasions can reveal answers to broad questions relating to their ecology and
evolution, and to how invasive populations are founded and maintained.

Two particular questions relevant to invasion biology in general are potentially answerable by
examining invasive rodent populations: 1) are islands typically invaded once followed by
population expansion, or are invasive populations established through multiple introductions?;
and 2) can the genetic variation of contemporary populations accurately describe the founding
and ongoing population history of the invaders?.

Invasive rodent species are often capable of explosive population growth. Single invasions can
populate entire islands, or even whole continents, if given time or assistance via human traffic.
Once established, the priority advantages of these founding populations may enable them to
exclude subsequent invaders entirely, or swamp any genetic admixture from other source
populations or lineages (Combs et al. 2017; Fraser et al. 2015; Puckett et al. 2016).
Alternatively, new waves of rodents could establish or even overtake earlier founders, either
because the new immigrants carry genetic variations more suited to the location, or because of
stochastic events in the original population allowing novel immigrants space to establish.

Generally, older invasions are poorly documented, so the only information available about their
origins have been incomplete or are known only from apocryphal historical narratives. Now,
many rodent invasion histories can be interpreted through population genetic analysis of their
contemporary descendants (Jones et al. 2013; Searle 2008; Searle et al. 2009a; Searle et al.
2009b). The key question, however, remains: how well does contemporary genetic diversity
reflect the historical diversity and trends of the original invaders?

Australia, and particularly Port Jackson, the first wharf area of Sydney, presents an ideal
location to investigate these questions. Port Jackson was the point of arrival for many of the
European-introduced invading rodent species now present, and their remains can be recovered
from well preserved stratified archaeological deposits. They joined the indigenous fauna of
Australia, which includes both marsupial ‘rodent-like’ small mammals, and a diverse range (64
species) of indigenous placental true rodents (Geffen et al. 2011). These native rodents include
seven species of the genus Rattus, such as the bush rat R. fuscipes, a species that was probably
common in the Sydney area prior to forest clearance and European settlement (Banks et al.
2012). There are also four species of introduced murid rodents in Australia: brown rats, ship
(black) rats, pacific rats (Rattus exulans) and house mice.

Brown rats were the dominant rat in stores and warehouses in Europe up until the 1850s, and
are thought to be the species most commonly spread around the world on ships at that time
(Atkinson 1973); therefore they probably arrived early in Australia. Rat damage to stores and
equipment was a serious issue from the earliest days of settlement at Sydney Cove.
Sydney newspapers were reporting problems with rats as vermin from as early as 1803 (Anon.
1803, 1804), but there are very few formal records of which rat species was responsible. The
first record that can be attributed specifically to R. norvegicus in Australia was by Clutterbuck
(1850) who noted the presence of the ‘brown rat’ in Melbourne in the late 1840s, but R.
norvegicus was certainly present in both Australia and New Zealand long before then. Brown
rats are now common commensal pests in the urban and suburban areas of metropolitan cities
in both countries, particularly around heavily modified areas and the coast (Menkhorst 1995;
Robinson et al. 2000; Russell, Innes 2021; Seebeck, Menkhorst 2000).

Ship rats became the major ship-borne species of rodent only after the 1830s-1850s (Atkinson
1973). They could have reached Australia as early as the 1600s (Archer 1984), but did not
establish resident populations until decades after permanent European settlement began in the
late 1780s (Banks, Hughes 2012; Long 2003). The earliest definite R. rattus specimens from
Australia are dated to the 1840s, but most specimens are from the 1870s or later (Banks, Hughes
2012). By 1900, ship rats were very abundant across the city of Sydney (Banks et al. 2012;
Curson, McCracken 1989).

House mice probably arrived in Australia with early European explorers and settlers during the
late 18th century (Gabriel et al. 2011; Long 2003; Searle et al. 2009a; Watts, Aslin 1981). The
earliest archaeological specimens of house mice in Australia were found in the Hyde Park
Barracks Destitute Asylum in Sydney, dating from the period 1848–1886 (Davies, Garvey
2013). All mice so far sequenced from Australia have belonged to the subspecies M. m.
domesticus (Gabriel et al. 2011; Veale et al. 2018). The majority represent Clade E, including
almost all mice from the Sydney area. Clades B, F, and D are present elsewhere in Australia,
and clade F mice dominate the arid interior (Gabriel et al. 2011).

Clade E of M. m. domesticus is strongly represented in New Zealand, as would be expected if
most mice reached the southern Pacific area from Britain (King 2016). New Zealand mice also
carry traces of the two other subspecies M. m. musculus, and M. m. castaneus both resident in
east Asia (King et al. 2016; Veale et al. 2018). Most commercial shipping to New Zealand
came via Sydney, but M. m. musculus and M. m. castaneus have so far never been detected
there. How then did these non-European subspecies of mice get to New Zealand?

During earliest colonial times, the Chinese port of Canton was the centre of an international fur
market and an important regional hub for European and American shipping. Either they made
their way independently to New Zealand direct from Canton, probably with returning sealers,
or they were present in Port Jackson at some point in the past (and could be still present but
undetected). Documenting the genetic makeup of historical samples of rodents from the ports
of Sydney could help us distinguish between these possibilities, and better understand the
timing and invasion history of mice and rats in the southern Pacific (King 2016).

The earliest private Sydney wharves were built in Campbell’s Cove on the west coast of Port
Jackson, and the first settlement began there, in the area known as The Rocks, in the late
eighteenth century (Kelly 1997). The infant city of Sydney grew rapidly, and over the next
hundred years developed into a rambling, tight-packed mass of houses, wharves and sheds.
Standards of construction and sanitation were minimal or absent. The wealthy merchant class
were insulated from the noise and stink in their grand mansions, while their working-class
waterside workers lived in overcrowded squalor.
Such conditions were ideal for rats, many of which carried the common rat flea (Xenopsylla
cheopis). Rats were easily imported into Sydney with merchandise from around the world
(Hainsworth 1972). Eventually, some of those rats also carried fleas infested with the pathogen
that causes bubonic plague (Yersinia pestis). In 1900, an outbreak of bubonic plague stimulated
‘alarm bordering on panic’, and not only in Sydney. The potential for rapid international spread
of this greatly-feared disease is illustrated by the 21 cases of plague and nine deaths that were
reported in New Zealand between 1900 and 1911, mostly from the Auckland district (McLean
1955).

The New South Wales Government took the chance to redevelop the waterfront, by ‘resuming’
control of The Rocks area (i.e., by forced purchase, and in some cases, eviction of all residents)
and demolishing whole streets of buildings. In other buildings left standing, the floors were
torn up and loads of sterile soil laid over the rubbish that had accumulated between and under
the floor boards. Back yards were usually covered in bitumen. So archaeological deposits
dating from before the plague were sealed, and the rebuilding began from on top of the ruins
(Kelly 1997).

Between May 1994 and October 1996 the then Sydney Cove Authority undertook extensive
excavations among the foundations of old buildings in Cumberland and Gloucester Streets.
Over 750,000 artefacts were recovered from the remains of 46 separate buildings, analysed and
catalogued in great detail. Each item or group of small items from the same deposit was placed
in a separate, labelled zip-lock bag, and stored in meticulously documented detail in boxes kept
in a storage facility in Darling Harbour (Figure 1A). They now form a major part of The Rock’s
historic artefact collection.

The phylogeny of the rats and mice that have reached NZ during historic times is known, at
least to a first approximation, from recently published analyses. But there are no current hard
data to confirm the present assumption (from shipping data and historical observations) that
ship rats did not reach the southwest Pacific until the mid 19th century. Likewise, the
conclusion from current DNA data that the eastern haplotype of the house mouse Mus musculus
castaneus could have reached New Zealand direct from China rather than passing through
Sydney (King et al. 2016; King 2016), has not been tested by further sampling from Sydney.
If true, both these propositions have implications for understanding both invasion history of
commensal rodents in the south Pacific, and the early commercial history of pre-colonial New
Zealand.

In short, the biological evidence challenges the usual assumption that all commensal rodents
that reached NZ between 1788 and 1900 came from, or passed through, Sydney. Therefore, it
would be of great interest for NZ historians and pest managers to identify the species
represented in Sydney’s 19th-century dockland.

Our aims

In this study we aimed to better understand the invasion history and trends in the genetic
diversity and origins of commensal rodents in the port area of Sydney since European
settlement began. Specifically, we expected to 1) determine the earliest record of each rodent
species appearing in the archaeological record, 2) search for traces of M. m. castaneus or M.
m. musculus in Sydney, and 3) understand the temporal dynamics of the genetic diversity of
the rodent species present. For example, are new haplotypes appearing, or is the genetic
makeup of an invasive population reasonably static after it is founded?
Material and Methods

Archaeological sampling

All items recovered from the 1994-1996 excavation at The Rocks were listed in a massive
database, under 5-digit specimen numbers and general categories including “Bone”. The
rodent component (100,000 items recovered) was usually identified simply as
“Rodent”, and roughly dated from archaeological information. In the Archaeological report of
the site (Kelly et al. 1996) deposits were classified into one or more of the following 11 stages:

Phase 1: Pre-1788 - Pre-European Occupation
Includes all deposits in existence before European Settlement. This includes bedrock and sub-
soil deposits. Pre-contact cultural material associated with the Aboriginal occupation of the site
is included in this phase.

Phase 2: 1788 - c.1810 - Early European Occupation
European occupation or use of the site prior to the formalisation of the various properties during
the Macquarie Period. The phase includes contact, clearance as well as irregular occupation by
Europeans. The initial Byrne family occupancy falls within this period and extends into the
following periods.

Phase 3: c.1810 - c.1833 - Formal land Division
Formal alienation of land and Cribb occupancy of the southern half of the site. Sub-division of
the Gloucester Street frontage with the development of residences and dwellings.

Phase 4: c.1833-c.1851 - Early Sub-division and Occupation
Sub-division of part of southern half of site along Cumberland Street, extension of Byrne
House, further development along Gloucester Street.

Phase 5: c.1851 - c.1860 - Further Sub-division and Occupation
This phase was instituted in order to break the post-1850 period (29 years) into two smaller
units. During this phase sub-divisions were registered on the southern half of the site under
Massey and in the Byrne property in the north resulting in the construction of the Cribbs Lane-
Carahers Lane Terraces.

Phase 6: c.1880 - c.1900 - Intensive Occupation and decline
The final phase of the sites’ development functioned as a residential community until the
outbreak of the Plague, characterised by close settlement and possible break-down of service
infrastructure.

Phase 7: c.1900 - c.1916 - "Plague" Clearances
Visitation of the Plague. Gradual removal of dwellings, levelling of the site and the introduction
of fill and bitumen covering in some areas.

Phase 8: c 1916 - c 1924 - Engineering Works
Use of site as both Engineering works, railway workshop and training facility.

Phase 9: c.1924 - c.1950 - Post-Engineering Works Occupancy
Use of site as motor garage and other undetermined uses.
Phase 10: c.1950 - c 1972 - Bus Depot
Removal of structures and installation of concrete slab over site for use as a bus parking depot.

Phase 11: c.1972 - c.1994 - Sydney Cove Authority
Control of the site by the Sydney Cove Redevelopment Authority, later the Sydney Cove
Authority. Little change to the physical structure of the site apart from dumping along eastern
margin.

Because it was impossible to date each of the deposits precisely, most samples were assigned
to a broad range crossing several of these phases, unless they were collected from a specific
place such as a well that was sealed at a known date. In general, these rodent bones consisted
of disarticulated elements within deposits, with no apparent evidence of nests that may have
been burrowed down from later deposits.

Rodent bones from the same level and date were stored together in separate bags in the same
boxes after recovery from the archaeological site. Box and bag numbers were linked to the
database. Provisional identifications were written by the excavators on the database printout,
subject to DNA verification. We used forceps to remove a few bones from each bag, making
a representative set of 120 samples of rat bones and 15 of mouse bones, concentrating on the
earlier phases of occupation. These specimens were imported into New Zealand in new,
separate sealed plastic bags, under a permit from the University of Waikato, where they were
held in a biosecure facility. From there they were sent on to the ancient DNA laboratory at
Museum of New Zealand Te Papa Tongarewa.

DNA extraction and amplification

All DNA extractions and PCR set-ups were performed in an ancient DNA laboratory at the
Museum of New Zealand Te Papa Tongarewa, which is physically isolated from the locations
where modern DNA and PCR products are handled. Potential contamination was monitored by
the use of negative extraction and PCR controls.

DNA was extracted from a single whole bone from each specimen. Bones were ground to a
fine powder in a mortar and pestle before extraction using the method described in Wood et al.
(2016), except that DNA was eluted in a final volume of 50 µl of Buffer AE. Mortar and
pestles were cleaned with bleach and UV-irradiated between samples.

Rat-specific and mouse-specific primers (Table 1) were designed using Primer 3 (Rozen,
Skaletsky 2000) to amplify short overlapping fragments (≤ 140 bp) of the mitochondrial D-
loop. We designed the rat primers to sit within mitochondrial regions conserved between
Rattus rattus and Rattus norvegicus. We expected to find that the majority of amplified D-loop
variation in Sydney samples of both of these species to be similar to those recorded in a recent
study of the mitochondrial genetic diversity of both species across New Zealand, because the
diversities present in the two neighbouring countries are likely to be similar (Russell et al.
2019). Similarly, we designed the mouse primers to sit within regions of the mitochondrial D-
loop conserved between the three subspecies of Mus musculus (M. m. musculus, M. m.
domesticus, and M. m. castaneus), amplifying the majority of D-loop variation recorded in
recent studies of mice from New Zealand and Australia (King et al. 2016; Veale et al. 2018).
Each DNA extract was initially amplified with rat-specific primers, as most of the bones were
expected to represent rats, from their size and morphology. All extracts that failed to amplify
were then amplified with the mouse-specific primers.

PCR amplifications were performed in 12 µl volumes containing 1´ MyTaq mix (Bioline,
Australia), 0.3 M of BSA and 0.5 µM of each primer. For all PCR amplifications the
thermocycling conditions involved an initial denaturation of 98°C for 1 minute then 45 cycles
of 98°C for 20 s, 50°C for 20 s and 72°C for 30 s, followed by a final extension of 72°C for 5
min.

PCR products were purified by digestion with 0.5 U shrimp alkaline phosphatase (rSAP; New
England Biolabs, Massachusetts, USA) and 2.5 U exonuclease I (Exo I; New England Biolabs,
Massachusetts, USA at 37°C for 15 min, followed by inactivation of the enzymes by 15 min at
80°C. DNA sequencing was performed in both directions by capillary separation at Macrogen
(Seoul, South Korea) and the resulting sequences were edited in Sequencer 5.4.6 (Gene Codes
Corporation).

Along with the historical samples, we obtained three modern R. norvegicus specimens
collected from near the University of Sydney two kilometres from the city centre. From their
tail samples, DNA was extracted in the Ecogene lab at Manaaki Whenua Landcare Research
in Auckland using the DNeasy Tissue Kit (Qiagen). The whole 585 bp amplicon of the D-
Loop was amplified with the primers EGL4L and RJ3R (Robins et al. 2007). The reaction
volume was 20 µL comprising: 10mM Tris HCl pH 8.3; 50mM KCl, 2.5mM MgCl2, primers
at 0.5µM each, dNTPs at 0.15mM each; 0.5U of Taq polymerase, 1 µL of DNA template. The
PCR (polymerase chain reaction) regime was an initial denaturation step of 94°C for 2min; 35
cycles of 94°C for 30 s, 60°C for 30 s and 72°C for 1min with a final extension step of 72°C
for 5min. PCR products were visualized and quantified, using a low mass ladder for
comparison, on ethidium bromide stained 1% agarose gels. PCR products were purified with
ExoSAP-IT (Affymetrix, Inc.). Sequencing was carried out at the Ecogene lab in Auckland
using the BigDye Terminator version 3 sequencing kit, the GeneAmp PCR System 9700 and a
capillary ABI3730 DNA analyzer, all from Applied Biosystems.

Genetic Analyses

All sequences were imported into Geneious (Kearse et al. 2012), where we trimmed off the
primer sequences, then aligned all modern and historical sequences for each species, along with
the New Zealand mouse haplotypes from King et al. (2016) and the rat haplotypes from Russell
et al. (2019). We then created haplotype networks for each species using the R packages ape
(Paradis et al. 2004; Paradis, Schliep 2019) and pegas (Paradis 2010). We also created plots
showing the distribution of these haplotypes over time using the R package ggplot2 (Wickham
2016).

Results
Of the 120 samples that were subsampled from the excavated material, 39 rat samples (all R.
norvegicus) amplified and 7 mouse samples (all M. m. domesticus) amplified (all of these
amplified across all primer sets). We found no traces of ship rats or any of the native rats.
Of the R. norvegicus material, 31 out of the 39 samples yielding DNA sequences were
excavated from layers laid down before 1900, most from deposits dated between 1851 and
1900. Fifteen samples were from deposits potentially laid down before 1851, of which only
one could be clearly dated to before 1880 and two could be as old as 1788. We found a total
of seven R. norvegicus D-loop haplotypes, labelled here with numbers 5, 7-12, of which four
were separated by only one base pair.

In the haplotype network (Figure 2) we have included the six R. norvegicus haplotypes labelled
1-6 identified in New Zealand by (Russell et al. 2019). Haplotypes 1, 2 and 6, recorded only in
New Zealand, are uncoloured, so as to facilitate later discussions of connections between the
two countries. No other wild R. norvegicus D-loop sequences have previously been obtained
from Australia. Among the three modern samples, we recorded three different haplotypes, two
of which were also recorded in the historical samples (haplotypes 9 & 5) and one novel
haplotype (3) that differed from haplotype 5 by only one base pair.

Comparing the archaeological layer from which each sample was excavated with the genetic
haplotypes found there shows that most of the samples can be dated to the period 1850 – 1900,
with only a few from earlier or later layers (Figure 3). The absence of precise dates for most
of the samples made it hard to extrapolate trends in the times when each haplotype first arrived
and was last recorded, and the paucity of modern samples prevents any firm documentation of
which haplotypes still remain present. What is evident from these results, however, is that at
least six D-loop haplotypes for R. norvegicus were present in the Rocks area in the latter half
of the 19th Century.

Among the historical M. m. domesticus samples, three haplotypes were present, all representing
clade E. In the haplotype network in Figure 2 the single base-pair difference between
haplotypes A and B is not shown, as this variable site was located in a region of D-loop that
was not amplified by (Gabriel et al. 2011). We therefore trimmed this region of the figure, as
we do not know which of these two sequences is closer to the original ones. Similarly, the
single base pair difference between Australia.01 and Australia.04 of (Gabriel et al. 2011) was
not amplified in our dataset, therefore these two haplotypes are merged into one, both matching
our haplotypes A and B. We found no traces of M. m. musculus or M. m. castaneus in this
sample.

Discussion
Rat species in Sydney

There have been no systematic studies of the distribution and densities of rat species across
Sydney, except some limited to specific focal sites in the peripheral suburbs (e.g. (Cox, Cox
2001; Rose, Banks 2007; Smith et al. 2016). Anecdotally, R. norvegicus is currently the most
common rat in the Sydney city centre, while R. rattus is more likely to be present in the suburbs
and bushland (Peter Banks pers. comm.).

The domination of R. norvegicus at the archaeological site is unsurprising. Robinson et al.
(2000) describe the current distribution of R. norvegicus in Australia as being “restricted to the
vicinity of human habitation in coastal cities… particularly in port areas, …..warehouses,
wharves, rubbish dumps and degraded creeks.” The Rocks area was certainly ideal R.
norvegicus habitat throughout the period sampled.
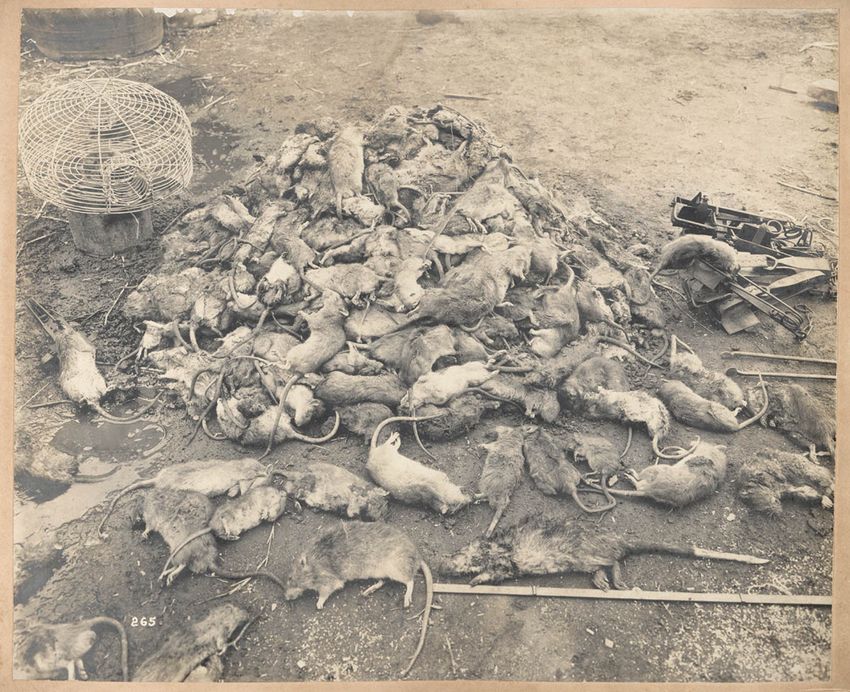
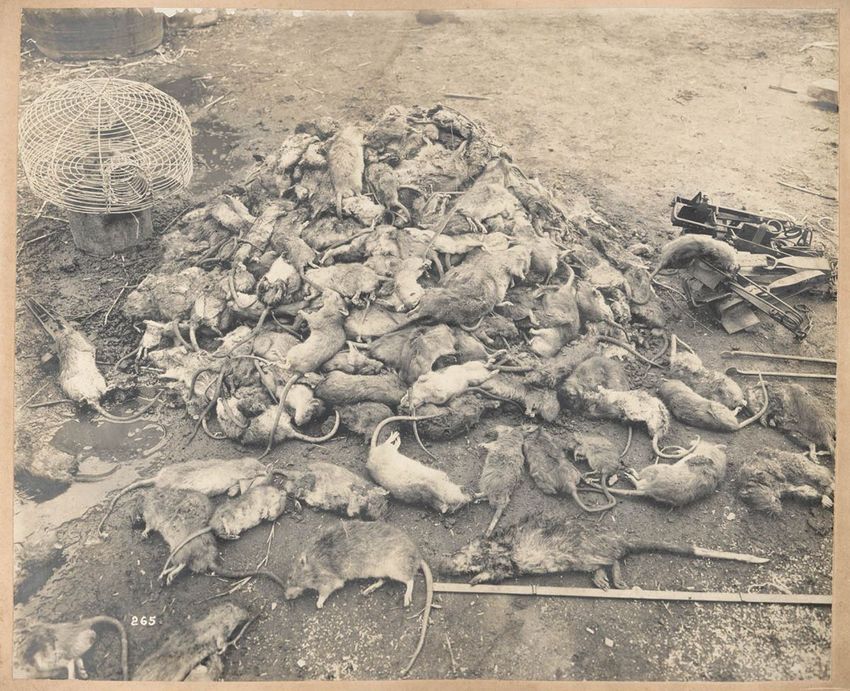
In a photograph taken of a pile of dead rats collected from within the quarantine area during
the plague outbreak in 1900, most appear to be R. norvegicus, along with some R. rattus, the
native bush rat R. fuscipes and at least one rakali (Hydromys chrysogaster), a native Australian
water rat with a white tail tip, seen in the lower right of the picture (Figure 4).

Figure 4 is very useful, but must not be interpreted at face value. There was a bounty on rats at
the time, and some of the species present in the picture (particularly R. fuscipes) are unlikely
to have lived in the central industrialised district of Sydney. Bounty operations commonly
encourage trappers to bring in animals from elsewhere in order to collect the bounty. The only
rat bones that we genetically identified were from R. norvegicus: there was no evidence of R.
rattus, or R. fuscipes in the deposits from the Sydney Cove archaeological site.

While our primers were designed for R. rattus and R. norvegicus, as our study focused on these
modern invaders, most primer pairs should also have amplified DNA from R. fuscipes and H.
chrysogaster. The available sequences for these species do not contain the whole sequence
length amplified in our study, but where sequences are available there are several primer pairs
for which there are no variable sites in the primer binding sites in these species. It remains
possible that some small bones that did not amplify were from these species, and that
undocumented variation at primer sites meant that they did not amplify, however the most
likely explanation for not detecting them at the site is because they were not present in the
sample.

The apparent absence of Rattus rattus

It is perhaps surprising that we did not find any bones of R. rattus dating to the mid 19th century
There are several possible explanations for their absence. First, R. norvegicus is currently the
primary rat present in urban wharf settings in Sydney, and it probably also dominated these
areas historically. Second, the significantly different behavior and ecology of the two European
rat species creates a bias in the chances of their preservation within archaeological sites. Rattus
norvegicus is largely fossorial, nesting on the ground and burrowing in compost and under
buildings, making it more likely to be preserved in archaeological deposits and in the
foundations of demolished buildings. Rattus rattus is much more arboreal, climbing into rooves
and trees, and these habitats and nesting locations will be less likely to preserve bones within
the archeological record.

Finally, we still do not know the true arrival time and spread of R. rattus in Australia. There
are reports of their presence in various places in Australia earlier (Banks, Hughes 2012; Long
2003), but their distribution and local population densities were not known. The historical
record indicates that ship rats could have been present in Sydney over much of the period over
which our samples originated (Banks et al. 2012; Curson, McCracken 1989). After 1900, their
numbers could have increased, because they would have benefitted from the removal of so
many R. norvegicus, but that does not explain their absence earlier. All of these hypotheses
are non-exclusive, and depend on reliable species identifications by contemporary observers,
so it will be hard to tease them apart without further data. Meanwhile, the rat haplotypes present
in 19th century Sydney provide a context to studies of the invasion of R. norvegicus in New
Zealand as well as Australia.

Rat invasions in New Zealand: North Island
The most common haplotype recorded in the Sydney historical samples (and still recorded
there today), is haplotype 9, the same as Norhap01 described from New Zealand by Russell et
al. (2019). It is also the most common R. norvegicus haplotype found in modern samples from
England (Haniza et al. 2015).

On the North Island of New Zealand, Norhap01 is the most common haplotype on the mainland
and on various offshore islands including Campbell, Raoul, and Chatham that were served from
19th-century bases in Sydney. This observation is entirely as expected given the origins and
destinations of most 19th century trading goods, and the amount of shipping that passed
between the port of Sydney and the North Island’s main port in the Bay of Islands between
1820 and 1840 (Cumpston 1977; Richards, Chisholm 1992). Of the hundreds of ships from
Britain engaged in trans-Tasman trade at that time, a high proportion were likely to have carried
haplotype Norhap01/9, confirming a direct connection between Britain, Sydney and northern
New Zealand. The first definite observations of Norway rats (presumably Norhap01) in the
North Island were recorded in 1772, and they had established widespread populations there by
the 1870s.

Rat invasions in New Zealand: South Island

By contrast, a different R. norvegicus haplotype (Norhap02 of Russell et al. (2019) is resident
in New Zealand’s South Island, but has not been found in the North Island. Where could they
have come from? Neither historical or modern samples have so far found any evidence of
Norhap02 in Sydney, and elsewhere, this haplotype has been recorded only in China (Liu et al.
2012).

The difference in distributions of rat haplotypes on the two main islands of New Zealand is
evidence that the two haplotypes of R. norvegicus arrived by different routes. How did that
happen? Russell et al. (2019) hypothesized that Norhap02 arrived in the South Island via an
independent invasion originating directly from China, bypassing Sydney. We found no traces
of Norhap02 in Sydney, which is consistent with Russell’s argument that these rats reached
New Zealand via illegal, and therefore unrecorded, shipping connected with the fur trade well
before 1820, as did house mice (King 2016).

Norhap03 of Russell et al. (2019), an unusual outlier not closely related to any other sample,
was found in one modern sample in the southern port town of Bluff on the South Island. It also
appeared as haplotype 5 among our Sydney specimens, suggesting a possible New Zealand
origin for this individual or, of course, vice versa. We should note there is a discrepancy in the
paper by Russell et al. (2019). The haplotypes Norhap03 and Norhap05 are swapped in the
text description compared with the genbank entries. In our discussion we have gone with the
text of the paper, rather than the genbank numbers.

House mice in Sydney

The small number of M. musculus samples that could be amplified from the Sydney collection
contained only three mitochondrial haplotypes from clade E. All three are currently common
and widespread in Australia, matching Australia.01 and Australia.04 of (Gabriel et al. 2011),
domNZ.1 in New Zealand (Searle et al. 2009a), and BritIsl.5 in Britain (Searle et al. 2009b),
which is probably where they all originated.
We found no evidence of M. m. castaneus or M. m. musculus ancestry in Sydney. Ancestry
from these two mouse subspecies has also yet to be detected in modern samples of mice from
Australia (Gabriel et al. 2011), but both have been detected in New Zealand (King et al. 2016;
King 2016; Searle et al. 2009a; Veale et al. 2018). Mice belonging to, or hybridised with, these
two subspecies could either have come to New Zealand directly from China, or they could have
arrived in Sydney at some point but failed to establish resident populations.

In previous papers we (Veale et al. 2018) speculated that some answers to these questions could
be found by analysing the genetics of mice from the historical Sydney port region. Our results
in this paper, though few, are consistent with previous suggestions that mice representing the
two eastern subspecies travelled to New Zealand independently rather than via a Sydney
established population. On the other hand, considering how many haplotypes appeared in this
small sample form Sydney, and the many more known from larger samples collected from
throughout New Zealand, it is perhaps rather early to conclude that no Asian mice ever reached
Sydney. It remains possible that Asian mice, like Norhap02 rats, were present on ships that
docked in Port Jackson harbour, but could not invade in the face of the incumbent advantage
of the already resident conspecific populations thriving there (Fraser et al. 2015). If they did
arrive, any such an event would be hard to detect now, and we have found no trace of them yet.

Summary

Norway rats and house mice both originated in Asia, and spread from there to reach western
Europe by the mid 1700s. They arrived in time to accompany the explorers, traders and
emigrants of the 18th century European diaspora to reach almost every corner of the world
inhabited by people. Both were carried by European and American ships among cargo,
livestock and immigrants to Australia, and thence to New Zealand.

Historical DNA samples show that R. norvegicus dominated The Rocks area of Sydney in the
19th Century, represented at that time by at least six mitochondrial haplotypes. The most
common haplotype we identified from Sydney (here numbered 9) is also found in England and
on New Zealand’s North Island, where it is called Norhap01. A second haplotype (Norhap02)
of R. norvegicus, found only on New Zealand’s South Island and in China, was not found in
Sydney. The uncertainties of the dating of the samples prevent detection of any trends in their
genetic diversity, or of whether there was any turnover of rat haplotypes during this period.

The genetic diversity and mitochondrial ancestry of living R. norvegicus in Australia has been
insufficiently studied, probably because this species is primarily confined to urban
environments, so has had minimal ecological impacts and significance to conservation in less
modified environments. Future studies both in Sydney and across Australia, similar to that of
Puckett et al. (2016) both on its mitochondria, and its nuclear genome, are needed to collect
larger samples in which to search for rarer haplotypes. These could help us understand the local
population histories and evolution of R. norvegicus haplotypes since colonization. Our small
sample of 19th century house mice from Sydney identified only the western subspecies Mus
musculus domesticus as having established there.

Both Norway rats and house mice carry in their genomes evidence of unknown, illegal shipping
movements in the southwestern Pacific during the 18th and 19th centuries, which are invisible
to documentary records. Fragmentary evidence supports our previous hypothesis that fur
sealers ignored regulations prohibiting direct trading of sealskins in Canton, at least while the
return justified the risk. The possibility of illegal return cargoes by sealers carrying provisions
infested with Chinese rodents is an attractive explanation of how two eastern subspecies of
mice (M. m. castaneus and M. m. musculus), along with Norhap02 of R. norvegicus, could have
got to the South and Stewart Islands without passing through Sydney. The absence of these
three taxa in Sydney, and their presence around locations of early and intense sealing activities
in New Zealand, confirm a hitherto unknown short but important clandestine connection with
China over about 20 years after 1800. This independent evidence of a direct, and illegal, China
connection casts new light on our understanding of commerce in early colonial New Zealand.

Acknowledgements
Permission to access the historic collections and their accompanying database, and support
during the collection of samples, was granted by the Place Management NSW (formerly
Sydney Cove Authority). Funding for the genetics analysis was provided by Waikato
University’s Strategic Investment Fund, courtesy Prof Bruce Clarkson. Thanks to the State
Library of NSW for permission to reproduce the photo in Figure 4. The general description of
those pictured in Figure 4 was kindly provided by Dr Peter Banks, a rodent specialist at the
University of Sydney.

References
Anon. (1803) The Sydney Gazette and New South Wales Advisor. Sydney, Saturday 2 April
      1803, p3.
Anon. (1804) The Sydney Gazette and New South Wales Advisor, Sunday 2 December 1804
      edn.,
Archer M (1984) Effects of humans on the Australian vertebrate fauna. In: Archer M and
      Clayton G (eds) Vertebrate Zoogeography and Evolution in Australasia’. Hesperian
      Press, Perth, pp. 151-161
Atkinson UAE (1973) Spread of the ship rat (Rattus r. rattus L.) III New Zealand. Journal of
      the Royal Society of New Zealand 3:457-472
Banks P, Cleary G, Dickman C (2012) Sydney's bubonic plague outbreak 1900-1910: a disaster
      for foreshore wildlife? Australian Zoologist 35:1033-1039
Banks P, Hughes N (2012) A review of the evidence for potential impacts of black rats (Rattus
      rattus) on wildlife and humans in Australia. Wildlife Research 39:78
Brouat C, Tollenaere C, Estoup A, et al. (2014) Invasion genetics of a human commensal
      rodent: The black rat Rattus rattus in Madagascar. Molecular Ecology 23
Clutterbuck JB (1850) Port Phillip in 1849. John W. Parker, London
Combs M, Puckett E, Richardson J, et al. (2017) Spatial population genomics of the brown rat
      (Rattus norvegicus) in New York City. Molecular Ecology 27
Cox M, Cox C (2001) Use of habitat by the black rat (Rattus rattus) at North Head, New South
      Wales: An observational and experimental study. Austral Ecology 25:375-385
Cumpston JS (1977) Shipping arrivals and departures Sydney, 1788-1825. Roebuck Society
      Publication 22, Canberra,
Curson P, McCracken K (1989) Plague in Sydney: Anatomy of an Epidemic. New South Wales
      University Press, Kensington
Davies P, Garvey J (2013) Early Zooarchaeological Evidence for Mus musculus in Australia.
      International Journal of Osteoarchaeology 23:106-111
Fraser CI, Banks SC, Waters JM (2015) Priority effects can lead to underestimation of dispersal
      and invasion potential. Biological Invasions 17:1-8
Gabriel SI, Mathias ML, Searle JB (2015) Of mice and the 'Age of Discovery': the complex
history of colonization of the Azorean archipelago by the house mouse (Mus musculus)
as revealed by mitochondrial DNA variation. Journal of Evolutionary Biology 28:130-
145
Gabriel SI, Stevens MI, Mathias MD, et al. (2011) Of Mice and 'Convicts': Origin of the
Australian House Mouse, Mus musculus. Plos One 6
Geffen E, Rowe KC, Yom-Tov Y (2011) Reproductive Rates in Australian Rodents Are
Related to Phylogeny. PLOS ONE 6:e19199
Genovesi P, Carnevali L, Alonzi A, et al. (2012) Alien mammals in Europe: Updated numbers
and trends, and assessment of the effects on biodiversity. Integrative zoology 7:247-53
Hainsworth DR (1972) The Sydney traders: Simeon Lord and his contemporaries. Cassell
Australia, Melbourne
Haniza MZ, Adams S, Jones EP, et al. (2015) Large-scale structure of brown rat (Rattus
norvegicus) populations in England: effects on rodenticide resistance. PeerJ 3
Howald G, Donlan CJ, Galvan JP, et al. (2007) Invasive rodent eradication on islands. Conserv.
Biol. 21:1258-1268
Jones EP, Eager HM, Gabriel SI, et al. (2013) Genetic tracking of mice and other bioproxies
to infer human history. Trends in Genetics 29:298-308
Jones EP, Jóhannesdóttir F, Richards MB, et al. (2011) The expansion of the house mouse into
northern-western Europe. Journal of Zoology 283:257-268
Jones EP, Skirnisson K, McGovern TH, et al. (2012) Fellow travellers: a concordance of
colonization patterns between mice and men in the North Atlantic region. Bmc
Evolutionary Biology 12
Kearse M, Moir R, Wilson A, et al. (2012) Geneious Basic: An integrated and extendable
desktop software platform for the organization and analysis of sequence data.
Bioinformatics 28:1647-1649
Kelly M (1997) Anchored in a small cove: A history and archaeology of the Rocks, Sydney.
Sydney Cove Authority, Sydney
Kelly M, Mackay R, Karskens G (1996) Cumberland/Gloucester Streets Site: Archaeological
Investigation 1994. Sydney Cove Authority, Sydney,
King C, Alexander A, Chubb T, et al. (2016) What can the geographic distribution of mtDNA
haplotypes tell us about the invasion of New Zealand by house mice Mus musculus?
Biological Invasions 18:1551-1565
King CM (2016) How genetics, history and geography limit potential explanations of invasions
by house mice Mus musculus in New Zealand. Biological Invasions 18:1533-1550
Li Y, Fujiwara K, Osada N, et al. (2020) House mouse Mus musculus dispersal in East Eurasia
inferred from 98 newly determined complete mitochondrial genome sequences. Heredity
Liu J, Liu DY, Chen W, et al. (2012) Genetic analysis of hantaviruses and their rodent hosts in
central-south China. Virus Research 163:439-447
Long JL (2003) Introduced Mammals of the World: Their History, Distribution and Influence.
CSIRO Publishing, Melbourne
McLean FS (1955) The history of plague in New Zealand. The New Zealand Medical Journal
54:131 - 143
Menkhorst PW (1995) Brown rat, Rattus norvegicus. In: Menkhorst PW (ed) Mammals of
Victoria. Distribution, Ecology and Conservation. Oxford University Press, Melbourne,
pp. 223-230
Paradis E (2010) pegas: an R package for population genetics with an integrated-modular
approach. Bioinformatics 26:419-420
Paradis E, Claude J, Strimmer K (2004) APE: Analyses of Phylogenetics and Evolution in R
language. Bioinformatics 20:289-290Paradis E, Schliep K (2019) ape 5.0: an environment for modern phylogenetics and
evolutionary analyses in R. Bioinformatics 35:526-528
Pimentel D, Lach L, Zuniga R, et al. (2000) Environmental and Economic Costs of
Nonindigenous Species in the United States. Bioscience 50:53-65
Puckett EE, Park J, Combs M, et al. (2016) Global population divergence and admixture of the
brown rat (Rattus norvegicus). Proceedings of the Royal Society B-Biological Sciences
283
Richards R, Chisholm J (1992) Bay of Islands shipping arrivals and departures 1803 - 1840.
Paremata Press, Wellington,
Robins JH, Hingston M, Matisoo-Smith E, et al. (2007) Identifying Rattus species using
mitochondrial DNA. Molecular Ecology Notes 7:717-729
Robinson A, Kemper C, Medlin G, et al. (2000) The Rodents of South Australia. Wildlife
Research 27:379-404
Rose T, Banks P (2007) Impacts of black rats Rattus rattus across an urban/bushland interface
at Sydney's North Head. pp. 66-75
Rozen S, Skaletsky H (2000) Primer3 on the WWW for general users and for biologist
programmers. Methods Mol Biol 132:365-86
Russell JC, Innes JG (2021) Family Muridae: Norway Rats. In: M. KC and Forsyth DM (eds)
The Handbook of New Zealand Mammals 3rd edn. CSIRO Publishing, Melbourne, pp.
166-176
Russell JC, Robins JH, Fewster RM (2019) Phylogeography of Invasive Rats in New Zealand.
Frontiers in Ecology and Evolution 7
Searle JB (2008) The genetics of mammalian invasions: a review. Wildlife Research 35:185-
192
Searle JB, Jamieson PM, Gunduz I, et al. (2009a) The diverse origins of New Zealand house
mice. Proceedings of the Royal Society B-Biological Sciences 276:209-217
Searle JB, Jones CS, Gündüz İ, et al. (2009b) Of mice and (Viking?) men: phylogeography of
British and Irish house mice. Proceedings of the Royal Society B: Biological Sciences
276:201-207
Seebeck J, Menkhorst P (2000) Status and conservation of the rodents of Victoria. Wildlife
Research 27:357-369
Smith H, Dickman C, Banks P (2016) Nest Predation by Commensal Rodents in Urban
Bushland Remnants. PloS one 11:e0156180
Veale AJ, Russell JC, King CM (2018) The genomic ancestry, landscape genetics and invasion
history of introduced mice in New Zealand. Royal Society Open Science 5
Watts CHS, Aslin HJ (1981) The Rodents of Australia. Angus & Robertson, Sydney
Wickham H (2016) ggplot2: Elegant Graphics for Data Analysis. Springer-Verlag, New York
Wood J, Herrera M, Scofield R, et al. (2016) Origin and timing of New Zealand's earliest
domestic chickens: Polynesian commensals or European introductions? Royal Society
Open Science 3:160258Tables
Table 1 Novel PCR primers designed for amplification of historical DNA from the mitochondrial D-loop for either Rattus sp.
or Mus musculus.
Forward primer Reverse Primer Product
length
Rat_dloop_1F Rat_dloop_1R 128 bp
RCRTGCTTATATGCTTGGGG CCACCATCAACACCCAAAGC
Rat_dloop_2F Rat_dloop_2R 140 bp
TGYATGTCTRATAACACAGATATGTCT CCCAAGCATATAAGCAYGYAATATAT
Rat_dloop_3F Rat_dloop_3R 116 bp
GGGCGGGTTGTTGATTTCAC TCTGTGTTATYAGACATRCACCAT
Rat_dloop_4F Rat_dloop_4R 109 bp
TGGCCCTGAAGTAAGAACCAG GAAATCAACAACCCGCCCAC
Rat_dloop_5F Rat_dloop_5R 140 bp
KGAAGGCATCCGAAAATTAAAAA ACTTCAGGGCCATCAATTG
Mus_dloop_1F Mus_dloop_1R 115 bp
CCACCACCAGCACCCAAA TGCTTGGGGAAAATAGTTTAATGT
Mus_dloop_2F Mus_dloop_2R 139 bp
AGCATATAAGCWAGTACATTWAATCA GGTGTATGTCAGATAACACAGA
Mus_dloop_3F Mus_dloop_3R 128 bp
TCTGACATACACCATACAGTCA GGAGCGAGAAGAGGGGCAT
Mus_dloop_4F Mus_dloop_4R 109 bp
GGGTCTAATCAGCCCATGACC TGTGCTGTCCTTTCATGCCT
Mus_dloop_5F Mus_dloop_5R 128 bp
CGGTGAAGAATCATTAGTCCGC TTGGCAYTAAGAGGAGGGGG
Mus_dloop_6F Mus_dloop_6R 139 bp
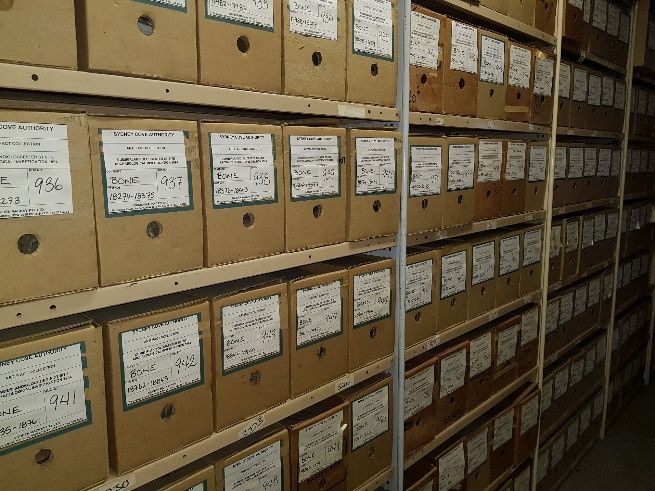
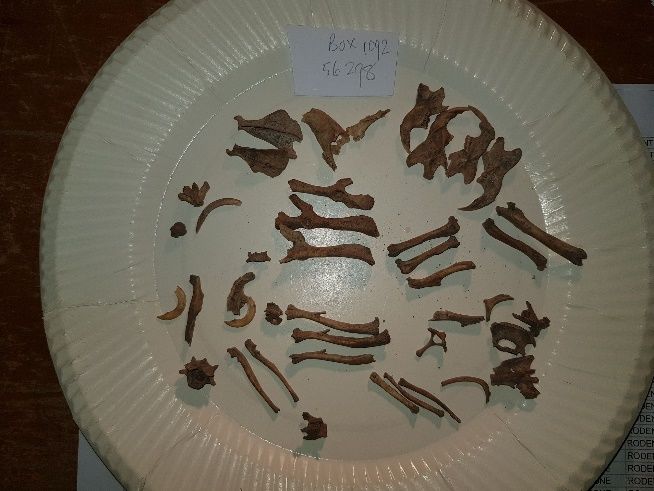
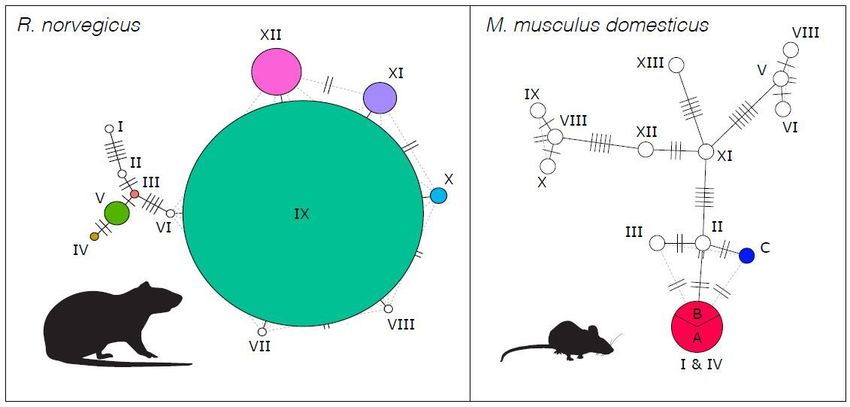
TTCTAGTAGTTCCCAAAATATGACT TGCTTTGTTATTAAGCTACATTAACTFigures Figure 1. A, left. Storage facility for the bones archive. B, right. Identifying rat bones from Box 1092, Bag 56298. Photos by C M King Figure 2. Left: Haplotype network of R. norvegicus D-loop haplotypes. Right:haplotypes of M. m. domesticus.. For the R. norvegicus network, haplotypes not recorded in our study but found by Russell et al 2019 in New Zealand are uncoloured. For the M. m. domesticus network, haplotypes not recorded in our study but found by Gabriel et al. 2011 in Australia are uncoloured. Haplotype numbers for the M. m. domesticus network match the haplotypes listed in Gabriel et al. 2011. Haplotypes A & B are separated by 1 bp but this variable site was not included in Gabriel et al., 2011 therefore is not displayed here. Circle sizes proportional to numbers of specimens, to maximum 25 for haplotype 9 of R. norvegicus.
Haplotypes
3
4
5
9
10
11
12
1800 1850 1900 1950 2000
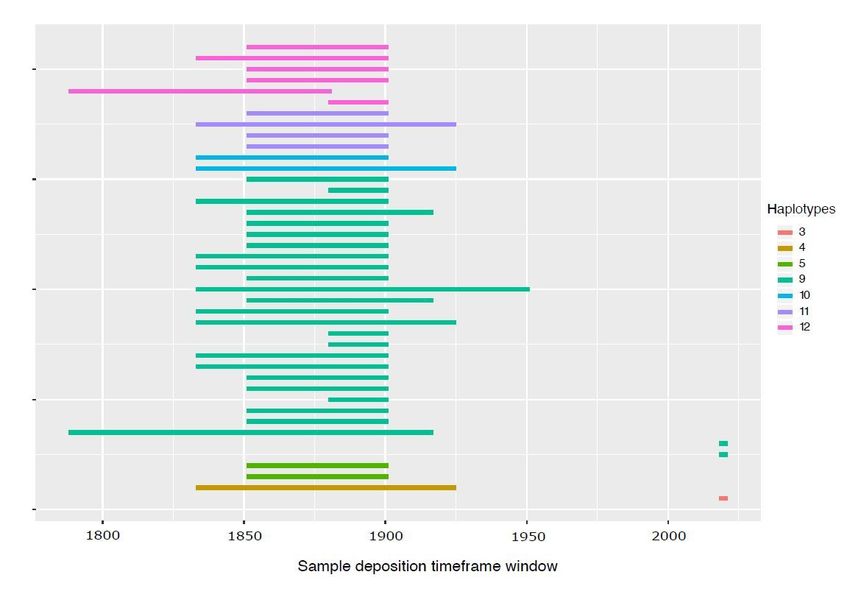
Figure 3 The time windows for each of the R. norvegicus samples from which historical DNA was sequenced, and their
haplotype numbers. Modern samples at far right.Figure 4 A heap of about 600 rats, from “Views taken during Cleansing Operations, Quarantine Area, Sydney, 1900, Vol V / under the supervision of Mr George McCredie, FIA NSW, Mitchell Library, State Library of NSW Call No PXE94/265
Figures Figure 1 A, left. Storage facility for the bones archive. B, right. Identifying rat bones from Box 1092, Bag 56298. Photos by C M King Figure 2 Left: Haplotype network of R. norvegicus D-loop haplotypes. Right:haplotypes of M. m. domesticus.. For the R. norvegicus network, haplotypes not recorded in our study but found by Russell et al 2019 in New
Zealand are uncoloured. For the M. m. domesticus network, haplotypes not recorded in our study but found by Gabriel et al. 2011 in Australia are uncoloured. Haplotype numbers for the M. m. domesticus network match the haplotypes listed in Gabriel et al. 2011. Haplotypes A & B are separated by 1 bp but this variable site was not included in Gabriel et al., 2011 therefore is not displayed here. Circle sizes proportional to numbers of specimens, to maximum 25 for haplotype 9 of R. norvegicus. Figure 3 The time windows for each of the R. norvegicus samples from which historical DNA was sequenced, and their haplotype numbers. Modern samples at far right. Sample
Figure 4 A heap of about 600 rats, from “Views taken during Cleansing Operations, Quarantine Area, Sydney, 1900, Vol V /
under the supervision of Mr George McCredie, FIA NSW, Mitchell Library, State Library of NSW Call No PXE94/265
You can also read