Visitor Demand Mapping Queenstown-Lakes 2020-24 - Destination Queenstown | Published 14 May
←
→
Page content transcription
If your browser does not render page correctly, please read the page content below

Visitor Demand Mapping | 1

                             Visitor Demand Mapping
                              Queenstown-Lakes 2020-24
                              Destination Queenstown | Published 14 May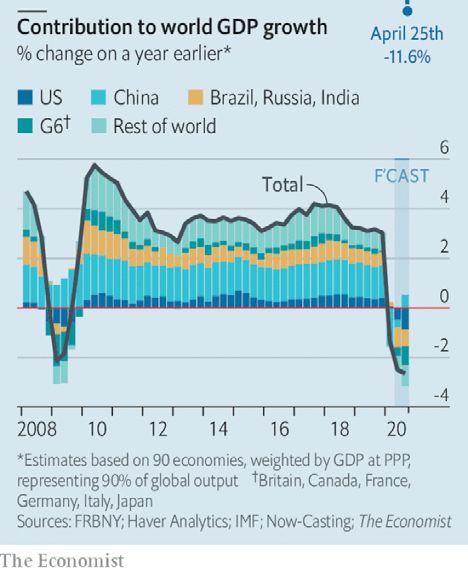
Visitor Demand Mapping | 2

                             Contents
                             1.   Executive Summary                                                 3

                             2.   Overview                                                          4

                             3.   Methodology                                                       5

                             4. New Landscape                                                       6
                                    • Global Economy
                                    • New Zealand Economy
                                    • Queenstown-Lakes Economy

                                    • Global Aviation

                                    • New Zealand Aviation

                                    • Australia Aviation

                                    • Queenstown Aviation

                                    • Epidemiology

                                    • New Realities

                             5.   Markets                                                           10
                                    • Local and Regional
                                    • Domestic
                                    • Australia

                                    • China

                                    • United States

                             6.   Historic Data                                                     13
                                    • International Visitor Arrivals
                                    • Commercial Accommodation Monitor
                                    • Monthly Regional Tourism Estimates

                                    • Queenstown Airport Passenger Movements

                                    • Queenstown-Lakes District Tourism Economy

                             7.   Scenarios                                                         18
                                    • Assumptions
                                    • Horizons
                                    • Demand Scenarios for Queenstown across all markets

                                    • Optimistic Scenario for Queenstown

                                    • Conservative Scenario for Queenstown

                                    • Demand Scenarios for Wanaka across all markets

                                    • Optimistic Scenario for Wanaka

                                    • Conservative Scenario for Wanaka

                                    • Demand Scenarios for Queenstown-Lakes District across all markets

                             8.   Next Steps                                                        25

                             9.   Exhibits                                                          26

                             10. Sources and References                                             40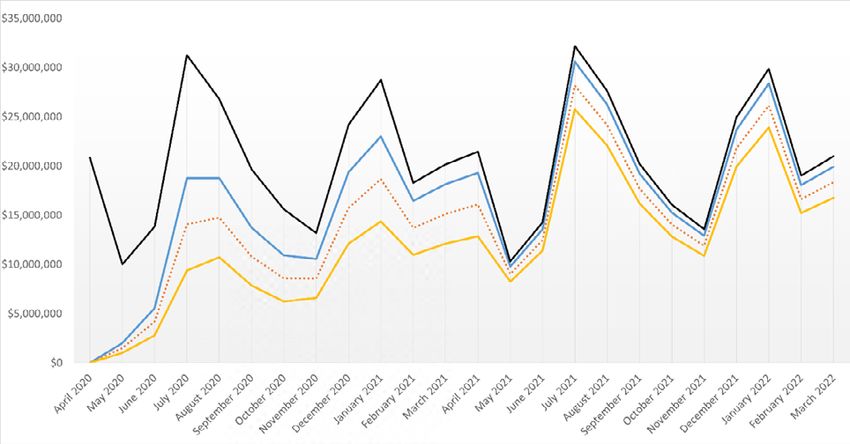
Visitor Demand Mapping | 3

                             1. Executive
                                 Summary

                             The rapid global spread of the COVID-19 pandemic at the beginning of 2020
                             resulted in international border closure in New Zealand. This exceptional
                             circumstance has resulted in a massive and severe impact on the visitor economy
                             for New Zealand, and our district, with visitor numbers falling to zero.

                             The objective of this paper is to map multiple scenarios on how visitor demand may re-start, set and scale for
                             Queenstown Lakes District over the next four years, as a resource for our member businesses. It aims to identify
                             timelines for best and worst case scenarios regarding the return of demand for tourism products within the
                             Queenstown Lakes District.

                             It is important to recognise that this is a ‘live’ document. DQ will update the information in this model in real time,
                             as external factors change, and publish the updated components for members accordingly.

                             The analysis indicates approximately 25% of the usual demand will come back to Queenstown-Lakes district over
                             our ski season in an optimistic scenario, increasing to 30% and 35% of the usual demand over spring and summer
                             respectively. The conservative scenario anticipates demand to be at 10% of normal levels over the ski season,
                             increasing to approximately 15% until summer. The factors influencing and informing the scenarios are covered in
                             more detail in the scenarios section of the paper.

                             The final scenario graph depicting the outlook for the total demand for Queenstown-Lakes is broken down into
                             separate data sets and graphs for both Queenstown and Wanaka. Within that, the data sets for both places, are
                             broken down into the three main source markets; domestic, Australia and long haul international markets. The
                             international markets are further broken down to the top seven long haul international markets for New Zealand.

                             This provides a granular view to track developments and factors that influence arrivals from each of these specific
                             source markets. This will enable adjustments to be made at a granular level, tracking the overall effect on the final
                             demand picture. These graphs showing the breakdowns are included in the exhibit section of this paper. Further
                             information is available for members by contacting DQ.

                             This broad view of how markets will return, and how demand will ramp up, provides DQ with a framework to plot
                             our strategies and activities into a logical plan to re-build demand and to optimise return on our investment in
                             each market. Eventually international markets will return to pre Covid-19 levels (from anywhere between 3 to 5
                             years)This model supports DQ to be able to correctly time the strategic approach, ideally fast tracking growth and
                             attaining a larger market share than before.

                             DQ will use this framework to inform our business planning for FY20-21 and beyond. The document will guide
                             our planning and provides a framework that can evolved to ensure our decision making is timely and consistent
                             and will produce optimum results. The framework will also provide direction for the organisation’s timing and type
                             of activity.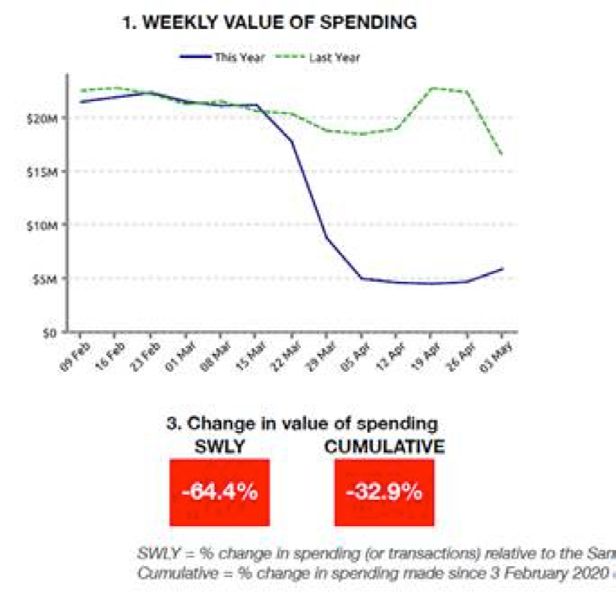
Visitor Demand Mapping | 4

                             2. Overview

                             In March 2020, Covid-19 was the cause of most deaths per week globally within
                             all pulmonary diseases (exhibit 1). The rapid global spread of the COVID-19
                             pandemic across countries at the beginning of 2020 resulted in exceptional
                             decisions by governments across the world.

                             These decisions include the unprecedented closure of organised outbound travel from China in the last week of
                             January, international border closure and repatriation and the eventual introduction of the lockdown four-week
                             lockdown and severe border control in New Zealand in the last week of March 2020.

                             These exceptional decisions have resulted in a massive and severe impact on the visitor economy for New
                             Zealand and our district. There has been a dramatic fall in visitor numbers for the months of February, March and
                             April 2020. Air seat capacity across the world and into New Zealand has also fallen significantly. As New Zealand
                             and the world navigates through the decisions pertaining to protecting lives and livelihoods, this drop in demand
                             is expected to remain for a very long time.

                             The objective of this paper is to map the various scenarios on how we expect visitor demand to start, set and scale
                             for Queenstown Lakes District over the next four years. There is broad consensus for visitor demand to start with
                             community and regional movement, followed by national and then trans-Tasman travel. It is likely a select group
                             of international markets that have managed to keep the pandemic contained, will receive more lenient border
                             control measures further into the future. This select set will drive the next wave of demand.

                             We expect this new regime of targeted border control measures to continue until a vaccine arrives or until there
                             is availability of ground breaking diagnostic testing. It might take several years before New Zealand borders are
                             open for all countries at a level seen before March 2020. This paper will aim to identify timelines for best and
                             worst case scenarios on how we see demand coming back for tourism products within the Queenstown Lakes
                             District.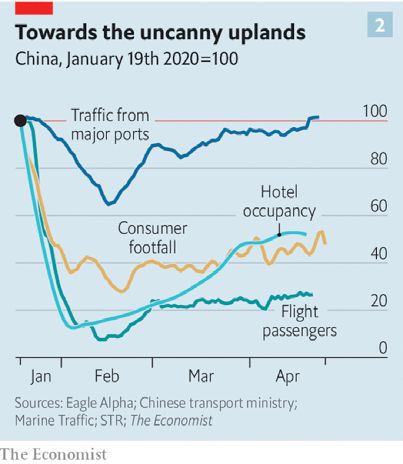
Visitor Demand Mapping | 5

                             3. Methodology

                             This report illustrates three scenarios – optimistic (best), conservative (worst)
                             and mid (average), that could occur for the restart and scaling of tourism visitor
                             numbers and spend in the Queenstown Lakes District region.

                             Due to the rapidly evolving and unpredictable changes faced globally, the methodology that has been used to
                             create these scenarios is a combination of research or data based assumptions and historic data analysis.

                             To arrive at the scenarios we have reviewed past trends using historic data over the last twenty years. The
                             measures studied are at RTO, district and national level data including Commercial Accommodation Monitor
                             (CAM), Monthly Regional Tourism Estimates (MRTEs), Qrious (phone data), International Visitor Arrivals (IVA) and
                             MBIE Tourism forecasts pre Covd-19 (2019-25).

                             For source markets, we have analyzed forecasts for GDP growth in their respective economies, expected growth
                             in consumer confidence, forecasts for outbound market growth and expected increase in air seat capacity from
                             these markets into New Zealand and Queenstown airport. The relationship between the national stock market
                             index and holiday arrivals into New Zealand from those source markets have also been included in this review
                             (exhibit 2).

                             The fundamental methodology process used to create these forecasts were:
                                   •	Gather historic data relating to visitor arrivals and spend in the Queenstown Lakes District region (MRTE,
                                      CAM, IVA, Qrious) and project what the future would have looked like in a pre-COVID-19 environment,
                                      based on MBIE’s 2019-25 forecasts.

                                   •	Draw research based assumptions around when, “horizons” would be able to access Queenstown Lakes
                                      District region in best, worst and mid-case scenarios. Horizons refer to a point of time in the future when
                                      market or set of markets are able to access Queenstown Lakes District region freely again. The timelines
                                      are derived from expected changes on New Zealand government’s alert levels and expected phased
                                      opening of international borders.

                                   •	Analysis on management of the Covid-19 pandemic within the top ten international markets for New
                                      Zealand. And a deep dive covering historic growth trends and forecasts on GDP growth, stock market
                                      movements, outbound market growth for the top three international markets – Australia, China and
                                      United States to build a scenario on how fast their arrivals into New Zealand would ramp up.

                                   • Combine the three elements to create the three demand scenarios.

                             This is a cognitive model on how we expect demand to return for tourism products in the Queenstown Lakes
                             district. We acknowledge the fundamental mantra of building models, which is that all models are wrong.
                             However, most of our models are mostly good, most of the time. The only effective way to analyze this model is to
                             test it. We welcome your feedback on parameters that are not covered or need review within this model.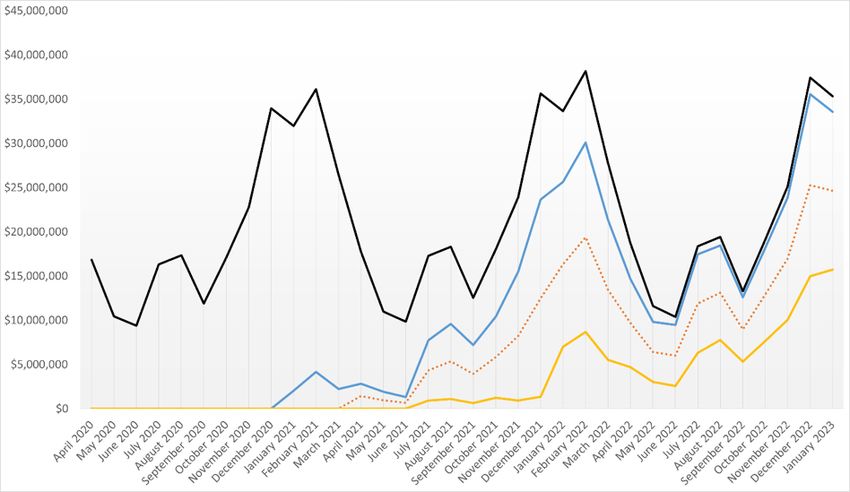
Visitor Demand Mapping | 6

                             4. New
                                 Landscape

                             Global Economy
                             The cover story of the 30 April 2020 edition of The Economist looks at what to expect from life after lockdowns:
                             what they are calling a “90% economy”1 (exhibit 3). While people get out of homes and back to work, and
                             production and retail get busier, large chunks of everyday activity is missing In China Metro rides and domestic
                             flights are down by a third and spending on restaurants has fallen by 40% (exhibit 4).

                             People are weighed down by financial hardships, businesses are short of money, bankruptcies are rising and
                             unemployment is at record highs. There is uncertainty and an underlying fear of a second wave, and life will
                             be hard until a vaccine or treatment is found. For the smaller “90% economy”, strangeness will be more than a
                             matter of size. It is too early to try and understand how long it will take for consumer confidence, annual leave and
                             disposable income to come back, all critical drivers for leisure travel.

                             Unlike the 2008 Global Financial Crisis (GFC), the Covid-19 shock to the financial system is purely exogenous
                             meaning it is completely external to the financial systems2. Like the sharp bell curve we see in escalations and
                             de-escalation of Covid-19 cases in each country, there is general belief that financial health and growth will have a
                             similar inverse sharp curve of decline followed by growth.

                             The question is how deep and how long the economic shock the COVID-19 pandemic will look like (exhibit 5).
                             International Monetary Fund (IMF) update on World Economic Outlook in mid-April indicates Global GDP growth
                             of -3% in 2020 and +5.8% in 2021, confident of a V shaped recovery3 (exhibit 6). Unlike the great depression
                             or the global financial crisis, the current downturn wasn’t caused by something fundamentally wrong with the
                             financial system or the overall economy, which leaves hope for a quick recovery.

                              IMF expects that the pandemic will fade in the second half of 2020, containment effects gradually unwind and
                              effective policy measure taken to limit the economic harm and the pent up demand will result in a V-shaped
                              recovery for the world economy (exhibit 7). While GDP growth in United States and China are expected to fall to
                             -5.9% and +1.2% respectively in 2020, it will bounce back to +4.7% and +9.2% respectively in 20214 (exhibit 8 & 9).

                             As economic growth drives consumer confidence, propels outbound markets and growth in aviation links, which
                             boosts arrivals in New Zealand and Queenstown lakes district; a strong recovery in GDP for key source markets
                             like Australia, China and United States in 2021 should deliver healthy growth in visitor arrivals into New Zealand
                             and Queenstown lakes district in 2022.

                              New Zealand Economy
                             Last year New Zealand’s economy crossed a historic milestone when GDP reached $300 billion5. However, the
                             Government’s aggressive approach enforcing a lockdown to save lives after Covid-19 reached New Zealand has
                             pushed the country into a deep recession. The Government’s support measures add up to $22 billion or 7% of
                             annual GDP. Unemployment is expected to rise to 9.5% in June, the highest level in 27 years. House prices are
                             expected to drop by 7% by end of the year. The scale of the policy response to the crisis will result in a debt to
                             GDP ratio of 50%, the highest level since 1993 that will put more pressure on future generations6.

                             The Reserve Bank forecasts an 19% reduction in total GDP at alert level three, an 8.8% reduction at alert level
                             two and a 3.8% reduction under alert level one. At level two and one, the majority of this reduction is due to the
                             limited capacity of the tourism industry7.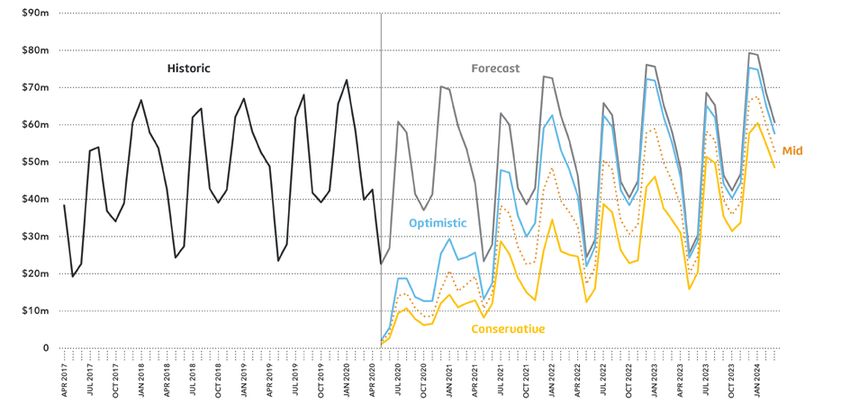
Visitor Demand Mapping | 7

                             Under each alert level there are strict rules relating to movement, social distancing and gathering numbers, which
                             have a direct impact the capacity tourism can operate at. Domestic Tourism activity which contributes 6% of total
                             GDP will be reduced under levels one and two and this will affect spend on transport, food, accommodation,
                             retail sales and other tourism products.

                             New Zealand’s tourism industry directly and indirectly employs about 400,000 people or just over 14% of
                             the workforce. According to Tourism New Zealand, the Tourism sector directly employed 8.4 per cent of New
                             Zealand’s entire workforce as of March 2019 and, with its associated industries, was responsible for about 10% of
                             GDP8. The total tourism spending in New Zealand was $41 billion9. For the year-ending March 2019, international
                             tourism contributed 3.8% to the total New Zealand GDP10.

                             To respond to the dramatic drop in demand, some Tourism businesses have gone into hibernation, some into
                             deep freeze and some will not survive winter. The downturn will hit tourism businesses disproportionately based
                             on their exposure to international markets and their ability to stay relevant to the New Zealand domestic visitors.

                             In the new environment, industries involved with healthcare and producing necessities e.g. food retailers, will
                             benefit most as New Zealand climbs back from recession. Agriculture and the rural economy will become more
                             important. The fall in the New Zealand dollar will also help boost food exports. Tourism, hospitality, housing and
                             construction industries will be the hardest hit11.

                             Most economists are forecasting a more rapid economic recovery than after the GFC, expecting to get to pre-
                             recession levels in two years against three years post GFC. Westpac predicts GDP in 2020 to decline by -6.3%
                             and then to see growth in 2021 and 2022 by +4.7% and +5.2% respectively. The expectation is that the long-
                             term fiscal stimulus from the Government will fire up the economy and that Interest rates will remain low for the
                             foreseeable future12.

                             Queenstown-Lakes Economy
                             Queenstown-Lakes district economy was $3.06 billion in 2019. The district had 41,700 residents and 30,008
                             jobs across 8,706 business units. The economic profile page on the QLDC website attributes 55.6% of the
                             district economy to tourism and an additional 17.5% to accommodation and food services in 2019. In 2000, the
                             contribution of tourism in Queenstown’s total GDP was 24%13 .

                             Tourism GDP growth for Queenstown is linked very strongly to the growth for New Zealand. For 2019, the Tourism
                             GDP growth for Queenstown was +10.3% compared to +6.6% for New Zealand. The last time tourism GDP was in
                             decline was in 2009 post the GFC when Queenstown Tourism GDP fell by -1.3% and New Zealand by -4.2%14.

                             It is likely the Queenstown-Lakes district economy could shrink by 40% due to the lockdown and unemployment
                             would reach between 25% and 30% in the short term15. The mid-term impact on jobs and the economy will be
                             clear only once further information on Government support packages for tourism beyond the wage subsidy that
                             extends until June 2020 is available.

                             Not surprisingly transactions and spend are significantly down in the Queenstown Lakes District (exhibit 10). For
                             the week ending March 3rd, 2020, the value of spending was down -64.4% compared to the same week last year
                             with the majority of this being driven by a -92.9% drop in international spending16.

                             Since international markets are offline, and with access to only domestic markets, the market size will shrink
                             to about 30% for at least the next six months, and we need to wait and see how much of this market can be
                             converted into actual visitors to Queenstown-Lakes. The dramatic drop in demand will re-shape the supply of
                             accommodation, activities, retail and hospitality in town. What supply is available at the end of June is crucial to
                             how the district can maintain its core proposition and on how we can retain and grow market share within other
                             domestic destinations.

                             The announcement from the ski fields about opening multiple ski areas or parts of them to cater to local, regional
                             and domestic markets does give most businesses in town a core proposition to go to market with. This alone will
                             stimulate a wave of new demand for July, August, September quarter resulting in a much needed cash flow boost
                             to our businesses and movement in the visitor economy.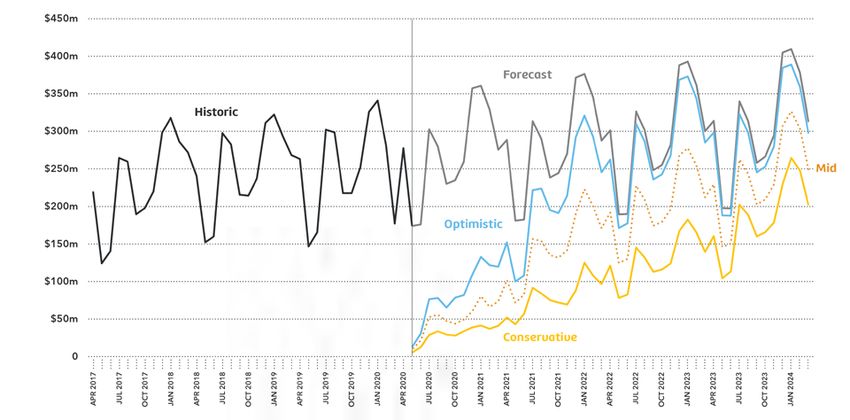
Visitor Demand Mapping | 8

                             Global Aviation
                             The airline industry is facing a crisis the likes of which it has never seen in its 100 years of existence (exhibit
                             12). The global commercial aviation industry has said it will lose US$314 billion in ticket sales in 2020. Social-
                             distancing norms when air travel resumes could further curtail revenue, overall annual passenger revenue loss is
                             about 55% compared to pre Covid-19 forecasts. Global flight traffic was down 80% in early April 2020, when all
                             flights were grounded except for repatriation and cargo17.

                             Aviation links have snapped globally. When international borders open, the resumption of flights across the
                             world will be driven initially by large population base, visiting-friends-and-relatives, business and student traffic,
                             followed by leisure. The demand for international leisure travel will lag behind other travel segments, which put
                             New Zealand aviation links on a relatively lower priority. The improvement in aviation links may not be linear as
                             different countries deal with travel restrictions changing frequently based on how COVID-19 cases re-emerge.
                             Some airlines will close down and some will consolidate to find synergies. Most carriers will have lifelines from
                             their governments, for instance Germany is increasing their stake in Lufthansa by 25.1% as part of the proposed
                             10 billion Euro bailout package. In the last week of April, Boeing warned that global air travel would not match the
                             level of 2019 for two or three years. The poor forward outlook for aviation was highlighted when Warren Buffet’s
                             Berkshire Hathaway announced sale of all of their U. S. airline stocks for United, American, Delta and Southwest in
                             their AGM in the first week of May18.

                             With social distancing norms to follow, potentially until a vaccine is developed, airlines will have lower load
                             factors, which means higher airfares. There might be new travel protocols to follow around health checks and
                             testing at the departure airport, which will further increase costs for airlines19. On a positive note, crude oil prices
                             are the lowest since 1990s. With fuel prices being crucial part for airline operating costs, low crude oil prices will
                             help with profitability.

                             New Zealand Aviation
                             Auckland Airport has reported that before the Covid-19 pandemic, 29 airlines were operating at the airport but
                             that had dropped to 11 (mostly cargo and repatriation flights), with the number of daily flights falling from 500 to
                             80 between March and April 202020.

                             Air New Zealand intend to operate predominantly as a domestic carrier for the near future. Their domestic
                             network might see change as the current network alignment is to feed Auckland as the long haul international
                             hub. The network recalibrated purely based on where domestic demand resides and where popular domestic
                             destinations are might look different.

                             It is confirmed that Queenstown will receive domestic flights from Auckland and Christchurch in alert level two,
                             however they would only be running at around 20% their pre-COVID capacity and they would not be able to offer
                             their cheapest lead in fares21.

                             When long haul markets come online, we might also see a correction to the phenomenal growth in demand and
                             flight capacity into Auckland Airport over the last several years post the Christchurch earthquakes.

                             It is difficult for the airports and airlines to issue forward outlooks due to the uncertainty around the decision-
                             making framework the government will use to manage borders with different countries.

                             Australia Aviation
                             There is popular support on both sides of the Tasman across private and public sector, for a trans-Tasman bubble.
                             At the next stage, as the skies and borders open in Australia and New Zealand with the rest of the world, global
                             aviation links and seat capacity into Australia will come back much faster than New Zealand. This is due to several
                             factors where Australia is generally better placed with resources than New Zealand, with government intervention,
                             airport incentives and financial support and a since Australia has a much bigger market.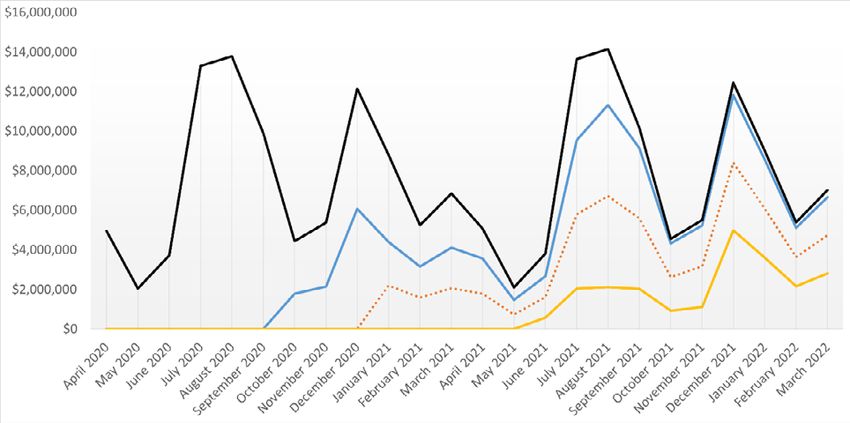
Visitor Demand Mapping | 9

                             Global aviation links into Australia are crucial for New Zealand. 54% of all international travel to and from New
                             Zealand had an Australian connection last year, and travel involving friends and family accounted for half of trans-
                             Tasman trips22. In the medium term Australia as a transit point will become more important for New Zealand to
                             connect to the long haul world.

                             Queenstown Aviation
                             Air New Zealand will be the primary driver for domestic capacity increase into Queenstown as it is a well-priced
                             and well-understood domestic product. Qantas might drive the capacity increase across the Tasman into
                             Queenstown when the borders open. Queenstown’s trans-Tasman link is extremely important, as the long-haul
                             capacity into Australia will grow faster than into New Zealand. This will be not only due to the larger Australian
                             market size, but also because Australian airports, airlines, government and NTO have deeper pockets and more
                             resources to influence international airline route decisions.

                             Epidemiology
                             The biomedical community and science is currently working overtime at lightning speed to produce a vaccine
                             that will allow the world to get back to its full capacity. While this paper was written, there were 95 treatments
                             and 52 vaccines in development for Covid-19 in over 200 clinical trials in the United States, China and European
                             Union23. Bill Gates was picking the top seven vaccine candidates and building manufacturing capacity for all them.
                             Even though the foundation will end up selecting, at most, two of them, they are going to fund factories for all
                             seven to save time24.

                             The White House put together a task force called ‘Operation Warp Speed’ to try and make 300 million doses
                             ready by end of this year. Johnson & Johnson, which has been working on its vaccine for months, has said it
                             plans to produce 1 billion doses by the end of 2021. In mid-April, the first human trials in Europe of a coronavirus
                             vaccine begun in Oxford25. Emirates became the first Airline in the world to use blood tests to screen passengers
                             before they board their flight. During the tests, blood is drawn from a finger prick and the results are processed in
                             just 10 minutes26.

                             The allocation of resources to science to beat Covid-19 is phenomenal and extremely encouraging. In addition to
                             government allocations, at the end of April, Forbes counted 77 billionaires who had donated to different causes
                             to do with coronavirus relief. The biggest donation came from Twitter and Square CEO Jack Dorsey, a $1 billion
                             US dollars, one quarter of his fortune27 (exhibit 13).

                             New Realities
                             There is a remote possibility that New Zealand might move back and forth through the Alert levels if new cases
                             and clusters break out and the pandemic does not seem to be under control. Apart from the discussions about
                             the possibility of a trans-Tasman bubble, the New Zealand Government seems to have a long-term timeframe
                             on re-opening borders for long haul markets. It can be assumed that international borders will not be open until
                             we are completely out of the alert level system and a vaccine is developed or until sharper testing methods are
                             developed at airports. Once long haul international market borders open, changes in Immigration New Zealand
                             policies will also affect the ease of applying for and obtaining a New Zealand visa.

                             There might be a Nationalist minority segment that pushes for more protected borders, regressive policies and
                             show dislike for visitors of certain nationalities. While the recession will highlight the major role tourism plays
                             within New Zealand’s economy, there will still be social licence issues that need to be addressed. The job losses
                             within tourism businesses will also result in loss of crucial IP, knowhow and key relationships in domestic and
                             international markets. Since most markets will not be in growth mode, the need for New Zealand and tourism
                             businesses to maintain and grow market share will become even harder.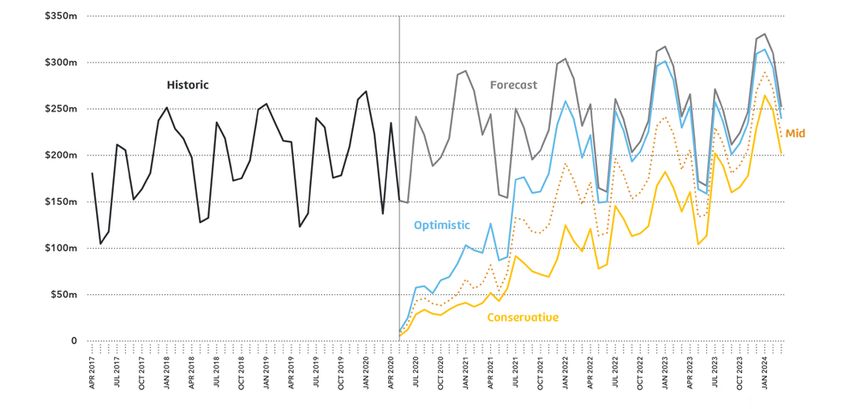
Visitor Demand Mapping | 10

                              5. Markets

                              Local and Regional
                              This market is the local Queenstown-Lakes community that contribute to the local tourism economy and the
                              population in the wider drive zone extending from Central Otago to the wider Otago/ Southland Regions. Spend
                              from this market is minimal during the period of lockdown in alert level four and three. There was a slight increase
                              in movement at level three as takeaways and some retail was allowed within click and collect rules. At alert level
                              two, this market within the drive zone is expected to mobilise first to drive demand into Queenstown-Lakes,
                              before the wider domestic market is stimulated.

                              Domestic
                              The domestic market in New Zealand is about 29.5 million overnight trips adding up to 83.5 million visitor nights,
                              with an average of 2.84 nights per overnight trip and a total spend of $23.7 billion, including day trips28. For year-
                              ending June 2019, 30% of the total visitor mix to Queenstown was domestic. The New Zealand outbound market,
                              is estimated to be 3.2 million trips with 58.8 million visitor nights with a total spend of $6.5 billion. 78% of this was
                              leisure visitors, with Australia accounting for 60% of all departures. With international destinations not an option
                              for Kiwis for the foreseeable future, there is an opportunity for Queenstown to increase market share within the
                              domestic market.

                              While it will be relatively easy to get patriotic Kiwis to explore their own backyard, it will be more difficult to
                              convince them to participate in the tourism economy by increasing their domestic holiday spend. To enable
                              consumption of more tourism products while on holiday in the Queenstown region, our products will need to
                              re-align the experience they offer to suit the pockets of the domestic market. Shorter trips and value add offerings
                              that could potentially increase perceived value for the domestic consumer but keeps profitability at the same
                              level would be the ideal outcome.

                              New Zealand is one of the few countries that have managed the pandemic very well (exhibit 11). In the event
                              of a relapse of Covid-19 cases sending us back and forth between the Alert levels again, it will have a long-
                              term impact in people’s ability to move within the country. New Zealand’s deep economic recession will dilute
                              disposable income and consumer confidence, which might shrink the domestic holiday market. The lower seat
                              capacity from the North Island into Queenstown over winter and spring 2020 might also increase domestic
                              airfares.

                              At the same time, closed international borders might fuel the New Zealand domestic holiday market. Availability
                              of healthy supply will deliver a quality Queenstown experience for Kiwis offering a value never seen before in
                              the domestic market. An Opinion Compare research in late April, named Queenstown the destination most New
                              Zealanders would like to visit once travel restrictions due to Covid-19 are lifted. Queenstown got 47% of the votes,
                              followed by Milford Sound at 41%29.

                              Successfully converting demand from the domestic market for winter 2020 is absolutely crucial for survival of
                              most Queenstown-lakes district businesses. About 55% to 65% of Queenstown-lakes district ski visitors are
                              domestic30. This gives us the opportunity to get core visitation into town to help our businesses with much needed
                              cash flow and a welcome shot in the arm to survive winter.
Visitor Demand Mapping | 11
Australia
The Australian economy has seen close to thirty years of continuous growth until 2020. Australia was one of the
few western economies that continued to grow through the GFC due to its strong ties to China. The Australian
dollar is considered to be a barometer of how things are going in China. The slowdown in China’s economy in
2018 and 2019 also slowed down the Australian economy as well. The bushfires and Covid-19 impact in late 2019
and early 2020 will push Australia into a recession for the first time in almost thirty years.
Australia’s outbound market was about 11.9 million in 2019. In line with the slowdown in GDP the outbound
market growth has slowed down from 5.8% and 5.3% in 2016 and 2017 to 4.4% and 1.9% in 2018 and 2019.
New Zealand’s share of the Australian outbound market is consistent at about 13% each year. Australian arrivals
into Queenstown airport however have seen strong growth in the last three years, 9.8%, 7.9% and 13% for 2017,
2018 and 2019 respectively. Australia is the largest international market for New Zealand and for Queenstown.
Australian arrivals into Queenstown peak in winter with the ski proposition. The arrivals at this time of the year
tend to be relatively long staying and high spending.
Australia has been successful in keeping the pandemic under control within its shores (exhibit 11). The approach
has been different from New Zealand, however still very successful. This has led to discussions at the highest
levels of Government about the possibility of a trans-Tasman bubble. Getting the borders open to Australia will
have a significant impact on the New Zealand economy and for the tourism sector.
China
China is the second largest economy in the world, with +6.1% GDP growth in 2019. The lockdown in the first
quarter of 2020 resulted in the economy shrinking by -10.9% for the quarter. The Economist forecasts the second
quarter to grow at +9.2%. Despite the severe impact of Covid-19, IMF forecasts GDP growth of +1.2% in 2020 and
+9.2% in 2021, indicating a V-shaped recovery (exhibit 7).
Considered the ‘factory of the world’, China is fast restoring supply chains across the globe. The initial economic
and other movement indicators are extremely positive for the first post Covid-19 economy in the world. Traffic
from major ports has already crossed the levels in mid-Jan before the lockdown. Hotel occupancy has climbed
back from 15% in February to 50% in April; and flight passenger numbers are up from 8% in February to 25% in
April (exhibit 4). Demand for domestic travel is bouncing back.
The outbound market in China had a phenomenal +11% growth between 2018 and 2019. In 2019, there were
166 million outbound travellers from China. Arrivals into New Zealand dropped by -9.2% from 448,189 in 2018 to
407,141 in 2019.
United States
The largest economy in the world had GDP growth of +2.3% in 2019 (exhibit 9). Currently the United States has
the highest number of Covid-19 cases in the world, about five times more than Spain, which has the second
highest. It seems likely it will take several more weeks for the cases in the United States to peak (exhibit 11).
Despite this severe health impact and the dramatic drop in weekly GDP growth (exhibit 8), IMF expects the
economy to bounce back from -5.9% decline in 2020 +4.7% growth in 2021 (exhibit 7).
While aviation, travel, retail and hospitality sectors are fighting for survival, the world’s most prominent tech
companies have been remarkably unaffected by the crisis. For the first three months of 2020, Google, Apple,
Facebook, Amazon and Microsoft posted positive revenue growth. Apart from Apple, that was affected by a drop
in sales in China during the lockdown, the others have double-digit growth quarter-on-quarter between 2019 and
2020, with Amazon being most impressive with a +26% growth, followed by Facebook at +18% and Microsoft at
+15%31 (exhibit 14).Visitor Demand Mapping | 12
The outbound market in United States had +5.5% growth, expanding from 87.7 million in 2017 to 92.5 million
in 2018. New Zealand’s share is tiny but consistent at 0.38% for 2017 and 2018. This year was set to see an
unprecedented growth in air seat capacity between the United States and New Zealand. There were new routes
announced from Los Angeles to Christchurch, Dallas to Auckland and New York to Auckland. While Air New
Zealand has announced a postponement of the New York route, American Airlines are still committed to operate
the new routes to connect Los Angeles directly to the South Island and to connect Dallas to Auckland in October,
subject to the borders opening.
The Cruise industry in the United States is reporting strong demand and forward sales for 202132. In the first week
of May, Carnival announced US$ 28-a-night fares for re-start of Cruises from 1 August departing ports in Texas
and Florida33. Considering the severe impact of the pandemic in the United States, it is likely that New Zealand’s
border will stay closed for visitors from the United States for a long time. The market is extremely promising,
however we may not see visitors arriving in from the United States until mid-2021.Visitor Demand Mapping | 13
6. Historic
Data
The following information aims to provide a frame of reference for understanding the huge growth and
importance of the tourism industry in the Queenstown Lakes District region since 2000. Please note that unless
specified the following graphs data represent Moving Annual Totals (MAT), which enables better interpretation of
the overall trend.
International Visitor Arrivals
International Visitors Arrivals (IVA) is based on the IVA card that all entrants fill in when entering the country34.
These people are considered international visitors because they live abroad and intend to stay fewer than 12
months in New Zealand. This data can be broken down into travel purpose, length of stay and country of origin.
International Visitor Arrivals, Jan 2001 to Feb 2020
Total Arrivals have grown from 1.7 million in 2000 to 3.8 million in 2019. Holiday/ Vacation specific arrivals have
also grown in a similar trend from 916,000 in 2000 to 1.95 million in 2019. Majority of this growth has come from
our key visitor markets of China USA and Australia as demonstrated in the exhibit 15 but other emerging markets
such as India and other Asian origins also provided growth. The graph below illustrates total international arrivals
(seasonally adjusted) and highlights some important spikes in visitor arrivals that aren’t seasonally driven.Visitor Demand Mapping | 14
International Visitor Arrivals, Jan 2001 – Feb 2020 Seasonally Adjusted
Commercial Accommodation Monitor Visitor Nights
The Commercial Accommodation Monitor (CAM) , which was compiled through NZ Statistics requiring all
“commercial” short-term accommodation providers (approx 3,000 providers) to report their guest nights, guest
origins and occupancy on a monthly basis35. The CAM did not include private short-term accommodation
providers (like Airbnb) which should be taken into account when looking at the data from 2015 onwards. As data
shows a relative slowing down of visitor nights in commercial accommodation due to the substitution to non-
commercial. Hence does not represent the actual number of visitor nights occurring in the district. The CAM data
collection ceased in September 2019.
CAM Visitor Nights, Queenstown
Queenstown has seen significant growth in accommodation nights averaging a 3% growth rate for both domestic
and international markets. For the international market, visitor nights in 2000 were 1.2 million and have risen to 2.6
million nights in 2018. The domestic market also experienced growth from 600,000 nights in 2000 to 1.1 million
nights in 2018.Visitor Demand Mapping | 15
CAM Visitor Nights, Wanaka
Wanaka has also experienced growth in accommodation nights averaging a 3% growth rate for International
and a 2% growth rate for domestic markets. For the international market, visitor nights in 2000 totalled 190,000;
which has risen to 600,000 in 2018. The domestic market also experienced growth from 220,000 nights in 2000 to
367,000 nights in 2018.Visitor Demand Mapping | 16
Monthly Regional Tourism Estimates
The Monthly Regional Tourism Estimates (MRTE) provide monthly estimates of tourism spending for domestic
and international markets36. These are derived from card spending and calibrated to the Tourism Satellite account
(TSA) and the International Visitor Survey (IVS). Electronic card transactions are gathered from Paymark and BNZ
by Marketview; representing around 80% of the electronic payment market.
MRTE, Queenstown
Total estimated tourism spend in Queenstown has grown from $668 million in 2000 to $2.4 billion in 2019. The
estimated international market spend has grown from $444 million in 2000 to $1.6 billion in 2019. There was a
strong period of growth between 2014-2016, with the average growth rate being 16% year on year. This growth
was mostly driven by the Australian and Asia markets. Domestic spend also has increased from $244 million to
$858 million in 2019, with an average growth rate of 8% per year
MRTE, Wanaka
Total estimated tourism spend has grown from $219 million in 2000 to $597 million in 2019. The estimated
international market spend has grown from $123 million in 2000 to $361 million in 2019. Domestic spend also has
increased from $96 million to $236 million in 2019, with an average growth rate of 7% per year.Visitor Demand Mapping | 17
Queenstown Airport Passenger Movements
Queenstown International Passenger Movements record how many movements are made through the airport
of passengers departing or arriving. An arrival and a departure are counted as two separate movements. The
data starts from January 2006 and is split into international and domestic origin (the origin of the aircraft not the
passenger themselves)37.
Queenstown Airport Passenger Movements
The Domestic market makes up the majority of movements due to the share number and frequency of domestic
planes arriving. Domestic movements were 569,900 in 2005 and increased to 1.6 million in 2019. International has
seen growth as Queenstown airport gained more international routes, growing from 39,500 movements in 2005
to 716,900 movements in 2019.
Queenstown-Lakes District Tourism GDP
Tourism is the Queenstown District Lake’s economic backbone. In 2019 it contributed $1.7 billion to the economy
which was 55% of the total GDP for the region. The area has seen huge growth in tourism GDP since 2000 when it
was $224 million representing 24% of the total GDP for the region38.
Queenstown-Lakes District Tourism GDPVisitor Demand Mapping | 18
7. Scenarios
Assumptions
To build the scenarios, we have made several assumptions regarding potential timelines of when the Alert levels
will scale down and when borders with international markets will open. These timelines trigger the base level for
the demand curve to pick up for Queenstown-Lakes district. The timelines are our best estimate based on the
information at hand now.
As we get more information, we will update the model based on the updates, ensuring this remains a ‘live’
document. The timelines included in the models for markets coming online to Queenstown-lakes district and New
Zealand are as follows:
The dates for the community, regional and domestic markets returning is based on the Covid-19 Alert levels
New Zealand government is following. The above dates for borders opening for specific international markets
are derived from a well-regarded SIR (susceptible-infected-recovered) model developed by the Data-Driven
Innovation Lab at the Singapore University of Technology and Design39.
The same methodology has informed the New Zealand government’s simulation of the pandemic and the
decisions around the alert levels. Based on the bell curve for new cases and the actions taken by the government,
the model predicts what date a country will get to 97%, 99% and 100% Covid-19 end dates. Based on the dates
of when a country gets to 100% Covid-19 end date, the above border opening dates are estimated after several
buffer months.
There have been further high-level assumptions made in relation to the capacity that market will resume traveling
and spending at. As explained in the preceding sections there are several macro-economic factors to consider
that will significantly influence visitor spend such as the depth and length of economic recession, the supply and
price of aviation capacity and the speed that fast diagnosis or a vaccine is delivered.Visitor Demand Mapping | 19
Horizons
With the markets coming online in a phased manner, we envisage demand coming back into Queenstown-Lakes
also in phased waves.
Looking ahead from May 2020, the first wave will comprise regional and domestic demand, as and when New
Zealand reaches the alert level 2, which we have referred to as Horizon 1.
Following that, based on the preliminary Government discussions between Australia and New Zealand, we are
expecting the trans-Tasman bubble will be introduced. This will open up the Australian market for Queenstown-
Lakes, which we consider to be our Horizon 2.
Horizon 3 is the next set of international long haul markets that will open up, most likely over a period of several
months, based on how safe the government considers specific countries to be.
DEMAND DEMAND
HORIZON 3 HORIZON 3
Long Haul International Canada, United States,
China, South Korea, Japan, Singapore, United Kingdom, India
Germany, Canada, United States,
United Kingdom, India
HORIZON 2 HORIZON 2
Trans-Tasman Bubble Germany, Singapore
Australia
HORIZON 1 HORIZON 1
Domestic Market China, Japan, Korea
Drive Zone, North Island
TIME TIME
The picture on the left depicts the horizons as domestic (Horizon 1), Australia (Horizon 2) and Long haul
international markets (Horizon 3). The picture on the right further splits the international long haul markets into
three horizons, each with a set of countries that may come online at approximately the same time.
The following simulation of demand pick up in the Queenstown-Lakes region has been built based on the above
timelines and assumptions. As DQ gets more information, we will be able to replace the assumptions with factual
information and update the model, in real time, to reflect the forward outlook for demand.Visitor Demand Mapping | 20
Demand Scenario for Queenstown across all Markets
The following chart illustrates expected total demand for Queenstown from all the markets identified above, i.e.
regional, domestic, Australia and long haul international markets. The ‘X’ axis represents the total monthly spend
in New Zealand dollars and the ‘Y’ axis represents the monthly data points from April 2017 to March 2024.
Demand data points have been broken down to monthly levels to indicate the fluctuation in monthly demand,
due to acute visitor seasonality in the region. The timeframe shows 36 months (three years) of historic data and 48
months (four years) of forward outlook.
The top black line represents the monthly spend data, which is built in two parts. The first historic part is the actual
spend data from Monthly Regional Tourism Estimates (MRTEs) from April 2017 until March 2020; and second part
is the forecast spend projected in a non Covid-19 setting. This forecast is drawn using the historic MRTE data
trend as the base and considering the MBIE Tourism visitor arrival forecasts for 2019 to 2024. This is the expected
spend Queenstown would have seen with nominal growth, if all the markets were still online in a state with no
alert level restrictions or international border closures. The vertical line shows our current point in time. This line
separates the historic actual data from the forecast data in a non Covid-19 state.
Queenstown all Markets
The chart then portrays an optimistic view (best-case scenario) of how fast the markets return. The assumptions on
dates for this are indicated in the earlier section. The optimistic view also incorporates a confident forward outlook
of economic indicators in these specific markets, which will drive interest and visitation to New Zealand, and to
Queenstown.
To balance this the conservative view (worst-case scenario) has an extremely cautious assessment of the time it
will take for international borders to open. And within that a moderate position on the economic condition of the
source markets, and a slower return of visitor demand.
The mid dotted line is an average of the optimistic and conservative view.
For further break down of the total expected demand scenarios into markets, i.e. domestic, Australia and long
haul international markets, please refer to the exhibits section 17 for Queenstown and 18 for Wanaka. For the
percentage comparison of usual non Covid-19 demand versus the demand plotted in the predicted scenarios,
please refer to the exhibit section (exhibits 17 and 18).Visitor Demand Mapping | 21
Optimistic Scenario for Queenstown
For this scenario, we have considered that domestic travel within New Zealand will be permitted from June 2020
onwards. Despite there being a recession, the domestic market (particularly from Auckland into Queenstown) is
likely to have healthy demand as the choice of the international destinations are not available for leisure travellers.
It is expected that flight connectivity will ramp up to about four or five flights a day between Auckland and
Queenstown. Sharper pricing for accommodation and experiences in Queenstown due to increased available
capacity, will drive demand. The domestic market coming back online in June will ramp up demand for
Queenstown’s ski driven winter proposition.
This scenario assumes the border with Australia will open by October 2020. If a trans-Tasman bubble is formed, it
would mean Australia is not open to other countries apart from New Zealand and the Pacific nations. This limited
choice of international destinations would also drive demand for New Zealand and the district. Aviation links
are projected to come back into place progressively, first with direct non-stop flights between Queenstown and
Sydney; and then other points coming online over the next two quarters. The Australian market coming online in
October will increase demand for the district’s summer.
Queenstown – Optimistic Scenario, All markets
For long haul international markets it is anticipated that the first set of borders to open will be with China, Japan
and South Korea around the first quarter of 2021. These countries have been successful in flattening their curve
and keeping new case levels very low (exhibit 19). The next set of countries is likely to be Germany and Singapore
opening up in the second quarter of 2021. Followed by United States, Canada, United Kingdom, India and other
countries opening up in the third quarter of 2021. The resumption of the border opening in China will ramp up
demand over Chinese New Year in February 2021. The traditional western markets will drive demand for summer
2021.
This scenario expects a V-shaped recovery of the global economy, with GDP growth in 2021 that will drive growth
in outbound travel and drive growth to arrivals into New Zealand in the later part of 2021 and into 2022 (exhibit
16).Visitor Demand Mapping | 22
Aviation links to all major long haul cities from Auckland and Christchurch is expected to return gradually. It is also
assumed that oil prices and the New Zealand dollar will be reasonably stable.
This scenario expects the pandemic case levels to constantly reduce and stay low until a vaccine is found and that
there are no further out breaks in New Zealand or in international markets. Rapid improvements in diagnostics and
testing is also factored in to keep demand steady.
Conservative Scenario for Queenstown
In the conservative (worst-case) scenario, we would expect a potential increase in Covid-19 cases in New Zealand
over the next few weeks, resulting in an escalation of alert levels and further periods of extended lock down.
Within those parameters, we have considered that domestic travel in New Zealand will stabilize only by December
2020.
This scenario expects a deep recession in New Zealand to continue for a long time and considerably soften the
demand from the domestic market. Long-term fiscal stimulus from the Government will not fire up the economy.
That flight capacity from the north island into Queenstown will be very slow to come back. This scenario also
anticipates that even if there is a high volume of visitors into Queenstown, expenditure will still be considerably
less than previous years, due to reduced pricing in accommodation and activities.
Queenstown - Conservative Scenario, All markets
In this scenario, the border with Australia will open by June 2021. That the Australian economy will remain in
slowdown for a longer period, resulting in poor growth for outbound travel. Trans-Tasman flight capacity will also
be very slow to return to 2019 levels.
The main assumption in this scenario is that international borders will only open when a vaccine is found, released
and available in mass scale. This is expected to take until the second half of 2021, which means that long haul
international markets and borders will open in a phased manner between the third quarter of 2021 and the first
quarter of 2022.
While the borders open much later, the economic recovery for global markets will be U-shaped resulting in a very
long wait for demand to ramp up in Queenstown.Visitor Demand Mapping | 23
Demand Scenario for Wanaka across All Markets
Wanaka – All markets
The demand scenarios for Wanaka have been developed in consultation with Lake Wanaka Tourism. The top black
line represents the monthly spend data for Wanaka region, which has been built in two parts. The first historic part
is the actual spend data from Monthly Regional Tourism Estimates (MRTEs) from April 2017 until March 2020
Optimistic Scenario for Wanaka
Wanaka – Optimistic Scenario, All markets
There is significant commonality in the external factors that influence visitor arrivals into Queenstown and Wanaka,
consequently the demand growth rates are very similar. The only area where the trends might differ slightly from
each other is within the domestic market.Visitor Demand Mapping | 24
Conservative Scenario for Wanaka
Wanaka – Conservative Scenario, All markets
As with the prior scenario, there is huge commonality in the external factors influencing arrivals into the
Queenstown Lakes district, and growth of demand for Wanaka is aligned to the Queenstown region. The factors
taken into consideration to develop the Wanaka demand curve, are detailed in the commentary within the
Queenstown scenarios.
Demand Scenario for Queenstown-Lakes District across All Markets
Queenstown-Lakes District – All markets
This chart is the total picture of visitor demand for the Queenstown Lakes district. This includes both the data
points for Queenstown and Wanaka as well as domestic, Australia and all long haul international markets data.Visitor Demand Mapping | 25
8. Next
Steps
In this new paradigm, it is important to acknowledge that, we are trying to predict the unpredictable. Currently
even experts are finding it difficult to make predictions with any certainty. This document is an attempt to capture,
summarize and analyse potential scenarios and outcomes, based on information that is both known and unknown.
Whilst we have certainty of specific events actually happening, e.g. borders will eventually open, we do not have
any visibility of when this will occur.
With so much uncertainty, it is very challenging to get clarity on how future demand will shape up. The
assumptions provide some direction to map the way forward. The scenarios give us an outline of the range
of possibilities regarding how demand will ramp up. As we receive more information, we will update the
assumptions with facts and track how the demand curve in the scenario changes. We welcome your feedback and
input to the model, to work toward continuous improvement.
The final scenario graph depicting the outlook for the total demand for Queenstown-Lakes is broken down into
separate data sets and graphs for both Queenstown and Wanaka. Within that, the data sets for both places, are
broken down into the three main source markets; domestic, Australia and long haul international markets (exhibit
17 & 18).
The international markets are further broken down to the top seven long haul international markets for New
Zealand. This gives us a granular view to track developments and factors that influence arrivals from each of these
specific source markets. This will enable adjustments to be made at a granular level, tracking the overall effect
on the final demand picture. These breakdown graphs are included in the exhibit section of this paper. Further
information is available for members by contacting DQ.
It is important to recognise that this is a ‘live’ document. DQ will update the information in this model in real
time, as external factors change, and publish the updated version for members accordingly. For instance, as
soon as the Government reaches a decision on the border reopening with Australia, DQ will update the timelines
for the Australian market, which will revise the demand impact in the scenario. Consequently, that will cut the
assumptions for Australia across timing and growth rate of demand to just the latter.
This broad view of how markets will come online, and how demand will ramp up, provides DQ with a framework
to plot our strategies and activities into a logical plan to re-build demand and to optimise return on our
investment in each market.
This also informs and shapes DQ’s strategy going forward. It also highlights key information to inform any changes
our tourism businesses may need to make to survive through winter. A good example of this is the urgent work
required around product development to cater to the re-shaped domestic market.
Eventually international markets will return to pre Covid-19 levels (from anywhere between 3 to 5 years), and this
model supports DQ to be able to correctly time the strategic approach, ideally fast tracking growth and attaining
a larger market share than before.
DQ will use this framework to inform our business planning for FY20-21 and beyond. The document will guide
our planning and provides a framework that can evolved to ensure our decision making is timely and consistent
and will produce optimum results. The framework will also provide direction for the organisation’s timing and type
of activity.
All efforts have been directed towards planning for the various scenarios the future holds for the Queenstown-
Lakes visitor economy. The markets opening and demand coming back is a process, over time, not an event. We
need to be realistic about the time that may take while also undertaking appropriate activity to expedite this
process. And, meanwhile keep calm, plan for all scenarios and wash our hands.
For further information, please contact:
Kiran Nambiar, Business Development Director, Destination Queenstown
kirann@queenstownNz.nzVisitor Demand Mapping | 26
9. Exhibits
Exhibit 1.
(The Economist: Covid-19 has become one of the biggest killers of 2020. Published on May 1st, 2020)(Link)
Exhibit 2.
Historic Economy Information: (GDP Data: Trading Economics: Countries GDP per Year data. (Link), International
Visitor Arrivals: Statistics New Zealand: Stats NZ Infoshare: International Travel and Migrations – ITM – Data pulled
15th April 2020, MRTE : Ministry of Business, Innovation and Employment: Monthly Regional Tourism Estimates
(MRTEs) – data pulled 7th May 2020 (Link))
New Zealand GDP and Domestic MRTE Spend (Queenstown) (Yearly)Visitor Demand Mapping | 27
GDP and Domestic MRTE Spend (Wanaka) (Yearly)
Australia- GDP and Arrivals
China - GDP and ArrivalsVisitor Demand Mapping | 28
USA - GDP and Arrivals
International Stock Markets and Arrivals (Australia, US, China) (Trading Economics: International Stock Markets.
(Link))
Australian Stock Market and International Visitor Arrivals to New Zealand – MAT ASX average
(monthly average close)Visitor Demand Mapping | 29
USA Stock Market and International Visitor Arrivals to New Zealand – MAT Down Jones Industry Average
(monthly average close)
Chinese Stock Market and International Visitor Arrivals to New Zealand – MAT. SSE (monthly average
close)Visitor Demand Mapping | 30
Exhibit 3.
(The Economist: the 90% economy: Life after lockdowns. Published April 30th, 2020 (Link))
The 90% economy that lockdowns will leave behind – The Economist, 30 April 2020
Exhibit 4.
(The Economist: the 90% economy: Life after lockdowns. Published April 30th, 2020 (Link))
Exhibit 5.
World Economic Forum: “Act fast and do what ever it takes” to fight the COVID-19 crisis, say leading economists.
Published 23rd March 2020. (Link)You can also read