COMMERCIAL BANKING & NATWEST MARKETS - INVESTOR SPOTLIGHT 20TH MAY 2021
←
→
Page content transcription
If your browser does not render page correctly, please read the page content below

Commercial Banking &
NatWest Markets
Investor Spotlight
20th May 2021

Paul Thwaite
Commercial Banking CEO

                         2
Agenda

Commercial Banking &   Topic                     Presenter
NatWest Markets
Investor Spotlight     Introduction              Paul Thwaite

                       Commercial Banking        Paul Thwaite

                       NatWest Markets           Robert Begbie

                       Technology & Innovation   Simon McNamara

                       Transformation            Jen Tippin

                       Q&A

                                                                  3
Strategic priorities will drive
            sustainable returns

           Our Purpose led
           strategy will drive
           sustainable returns for
           shareholders

           Strategic priorities
           delivered through:

           Sustainable growth with
           an intelligent approach to
           risk

           Simplification and cost
           efficiency

           Portfolio discipline and
           effective deployment of
           capital
1.   Comprises customer loans in our UK and RBS International retail
     and commercial businesses
2.   Operating expenses excluding litigation and conduct costs,
     strategic costs, operating lease depreciation and the impact of the   4
     phased withdrawal from the Republic of Ireland
Commercial Banking &
NatWest Markets Spotlight

Commercial Banking          NatWest Group financial profile, FY 2020
(CB) and NatWest            £m unless stated                   Retail              Private           Commercial     RBS                            NatWest           Ulster Bank
                                                                                                                                                                                              Central              Total
Markets (NWM) together      otherwise                         Banking              Banking             Banking International                       Markets               RoI
                                                                                                                                                                                             items &
                                                                                                                                                                                              other 1
                                                                                                                                                                                                                  NatWest
                                                                                                                                                                                                                   Group
accounted for:
                            Income                              4,181                  763                3,958                  497                 1,123                 510                 (236)               10,796
▪   47% of NatWest
    Group’s FY 2020         Operating
                                                               (2,540)                (455)              (2,430)                (291)               (1,310)               (486)                (393)               (7,905)
                            expenses
    income (CB 37%;
    NWM 10%)                Operating profit
                                                                1,641                  308                1,528                  206                 (187)                  24                 (629)                2,891
                            before impairment

▪   49% of Other
                            Operating profit                      849                  208                 (399)                  99                 (227)                (226)                (655)                (351)
    expenses (CB 33%;
    NWM 15%)
                            FY 2020 RoE (%) 2                   10.2%                10.3%                (4.5%)                 6.1%               (3.8%)              (11.7%)                  nm                 (2.4%)

▪   46% of Operating        Memo:
    profit before           FY 2019 RoE (%) 2
                                                                 9.6%                15.4%                 8.4%                 25.7%               (3.2%)                2.3%                   nm                  9.4%

    impairment (CB 53%;
    NWM n.m.)

▪   60% of RWAs (CB         1. Central items & other includes unallocated transactions, including volatile items under IFRS. 2. NatWest Group’s CET1 target is 13% - 14% but for the purposes of computing segmental return

    44%; NWM 16%)           on equity (ROE), to better reflect the differential drivers of capital usage, segmental operating profit or loss adjusted for preference share dividends and tax, is divided by average notional
                            tangible equity allocated at different rates of 14.5% (Retail Banking - 15% prior to Q1 2020), 12.5% (Private Banking - 13% prior to Q1 2020), 11.5% (Commercial Banking - 12% prior to Q1
                            2020), 16% (RBS International), 15% (NatWest Markets) and 15.5% (Ulster Bank RoI - 15% prior to Q1 2020), of the period average of segmental risk-weighted assets equivalents (RWAe)               5
                            incorporating the effect of capital deductions. NatWest Group return on equity is calculated using profit for the period attributable to ordinary shareholders.
Overview

        Relationship bank for a                                                                                            Commercial Banking
        digital world, supporting                                    Segments1      Business Banking
                                                                                                                         SME & Mid
                                                                                                                         Corporates
                                                                                                                                                 Large Corporates &
                                                                                                                                                     Institutions2
                                                                                                                                                                                    Specialised
                                                                                                                                                                                    Businesses3
        all customers at every
                                                                     Turnover              £2m to £500m                           various
        stage of their lifecycle
                                                                     Customers            c.940k                           c.50k                          c.2k                           c.10k
        Serving c.1million customers
                                                                    Key products
        across the UK                                                               Current    Cards &       Lending &
                                                                                                                          Currencies
                                                                                                                                       Capital        Fixed      Transaction   Working     Asset & Trade
                                                                                   Accounts   Payments       Financing                 Markets       Income        Banking     Capital        Finance

        Leveraging capabilities across
        NatWest Group to offer                                                                                                     Commercial Bank

        comprehensive and integrated                                                                                               NatWest Markets
        propositions
                                                                      Service                                                                    Coverage of Corporates,        Specialist sales teams
        Accounting for 53% of                                                        Direct Relationship          Dedicated regional and
                                                                                                                                                    Sponsors, Financial        providing Asset Finance,
                                                                      offering     Managers (RMs) or self-        sectoral RMs providing
        NatWest Group’s FY20                                                          service channels             insights and services
                                                                                                                                                 Institutions, Sovereigns,
                                                                                                                                                 including Specialist COE
                                                                                                                                                                               Working Capital (trade)
                                                                                                                                                                                 and Mentor services
        Operating Profit before
        impairments and 44% of RWAs
                                                                      Brands
                                                                        &
                                                                     Ventures

                                                                                           Collaborating with NWG franchises to offer a comprehensive and integrated range of propositions

Notes: 1. Also includes other segments (not shown) comprising of
c.1k customers in Real Estate, Commercial – EU Divestment and
Other. 2. Large Corporates & Institutions (LC&I) includes Western                                                                                                                                     6
Europe. 3. Includes Lombard Business.
Commercial Banking
            positioning
                                                                                           Business Positioning (FY’20 financials)
          Largest supporter of
          businesses, serving                                             Segments             Business
                                                                                                                SME and Mid            Large
                                                                                                                                   Corporates &      Specialised
                                                                                                               Corporates inc.                                       Other Segments
          around 1 in 4 UK                                                                     Banking
                                                                                                                 Real Estate        Institutions      Business

          businesses                                                                        ▪ Supporting       ▪ #1 and #2        ▪ Top 3 in UK    ▪ 17% share of    ▪ Comprises
                                                                           Market             c.20% of small     lender to SMEs     Corporate IG     Asset Finance     Commercial -
          Starting from position of                                       Positioning         businesses         in 9 out of 11     Debt Capital     funding4          EU Divestment
          strength, with opportunity to                                                       across the UK2     regions of the     Markets                            and Other
                                                                                                                 UK                 issuance3
          target growth across lending
          and fee based products
          We will support and meet more                                   Income £bn              0.7                1.7                0.7              0.6               0.3

          of our customers’ needs,                                         Third party
          through regional and sectoral                                  customer asset          3.6%               2.9%                2.1%            3.0%              3.1%
                                                                             rate %5
          expertise
                                                                         Lending6 £bn            13.5                53.9               21.4            14.8               7.4
          Underpinned by one of the
          leading Net Promoter Scores1
          and resilient market position                                  Deposits6 £bn           33.0                73.9               45.4             0.1              15.2
Notes: 1. MarketVue Business Banking from Savanta, Q1 2021 data, based
on 494 businesses with a turnover of £2m+ in England and Wales. 2.
MarketVue Business Banking from Savanta, Q1 2021 data, NatWest Group
market share of 19.5% of businesses with a turnover less than £2m in       RWAs £bn               5.0                36.7               17.6             5.5              10.3
Great Britain, based on 8,991 businesses. 3. Based on Dealogic, UK
Corporates EUR, GBP, USD currencies investment grade issuance Q1
2021 4. Market share based off 2020 data of new business volumes. 5.
Third party customer asset rate is the average over Full Year 2020. 6.   Indicative RoE7         14%                 9%                 7%               8%                5%
Lending and deposits are customer balances as at end 2020. Lending is
gross loans. 7. Indicative RoE % reflects a normalised cost of risk of
c35bps, mid-point of NatWest Group guidance of 30-40bps through the
cycle. Return on equity is based on segmental operating profit or loss
                                                                                                                                                                                       7
adjusted for preference share dividends and tax, divided by allocated
average notional tangible equity, assuming 28% tax rate.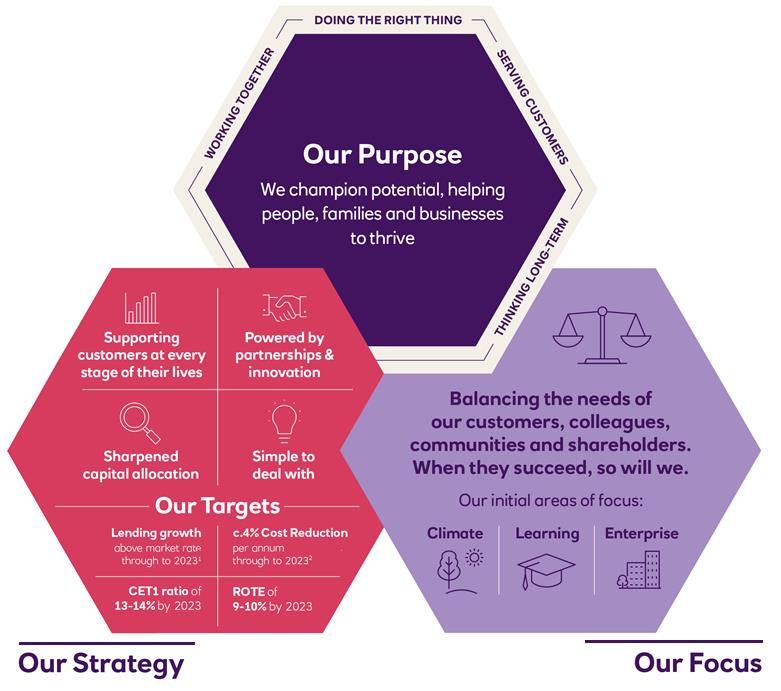
Focus by segment

         Taking a customer                                             Strategic priorities by segment                                                                    Large
                                                                                                                                    Business            SME &
         focused approach to our                                                                                                    Banking            Mid Corp
                                                                                                                                                                       Corporates
                                                                                                                                                                      & Institutions
         business strategy                                             Supporting Customers
                                                                       -1   Economic recovery and removing barriers to
         Continuing investment in our                                       entrepreneurship
         customers to accelerate build                                 -2   Brexit support and transition to low carbon economy1
         of digital capabilities to better
         meet customer needs                                           Targeted Growth powered by Partnerships & Innovation
                                                                       -3   Fee income, including Payments
         Driving quality growth in
                                                                       -4   Targeted lending growth with Large Corporates
         selected areas, aligned to our
                                                                       -5   Integration with NatWest Markets products   (e.g. FX,
         purpose and expertise                                              DCM, Rates)

         Simplifying, digitising and                                   Simple to deal with
         automating end to end                                         -6   Build of digital capabilities
                                                                       -7   Lending and digital sales & service transformation
         Underpinned by active capital
         management
                                                                       Sharpened capital allocation
                                                                       -8   Active capital management and risk mitigation

                                                                                                                                       Segments in focus          Value opportunity
                                                                                                                                                            Low                       High

Notes: 1. Climate activity to drive long term returns through active                                                                                                                    8
capital management & risk mitigation
Supporting customers

                                                                           Government scheme lending approved                          New government schemes launched
         Championing support for                                           (as at Q1’21; £bn)
         businesses across the                                                9.1

         UK                                                                                                    c.29%                      Pay As You                         c.158k
                                                                                                          of drawn lending to high
                                                                                                          oversight wholesale risk
                                                                                                                                         Grow (BBLS)2                    accounts invited5
         Delivered 19%1 of COVID-19                                                                               sectors4
         Scheme Lending & successfully                                                4.0
         launched Recovery Loan                                                                               c.8.9k
         Scheme                                                                               1.3         active payment holidays,
                                                                                                                                             Recovery
                                                                                                                                               Loan
                                                                                                                                                                             c.4.6k
                                                                                                        representing £2.5bn (~2%) of
                                                                                                                                             Scheme6                    applications received
                                                                                                              the lending book
         32k applications2 processed via
                                                                             BBLS    CBILS   CLBILS
         Pay As You Grow; ~70%2
         asking for an extension
                                                                           Championing SME economic recovery                                 Supporting transition to net zero
         Continuing economic recovery
         support and removing barriers                                     Key public initiatives                                        Case Study
         to Enterprise                                                                                                                     Service providers                           Client

         #1 finance provider to the UK                                              £6bn              Funding to help SMEs scale
                                                                                                       (£4bn outside of London)
         renewables sector over the
                                                                                                      SMEs reached by 2022 via
         last 10 years3                                                         10,000                 Enterprise programmes
                                                                                                                                                   Services                           Project
                                                                                                                                         ▪   Lead Arranger of £5.5bn
                                                                                                                                             financing
Notes: 1. Of approved schemes, according to Data per HM Treasury                                           % of award winning            ▪   Executed FX of £2.5bn as part
                                                                                                                                                                              Biggest offshore windfarm in
available on 21st March 2021. 2. BBLS – Bounce Back Loan Scheme.
Data as of 12 May 2021. 3. Information Deals (Acuris). Based on the                 75%               accelerator places to granted
                                                                                                       to High Growth businesses
                                                                                                                                             of risk management support                the world7

aggregated totals for the United Kingdom for the 10 year period
03/12/2010-03/12/2020. 4. Total NatWest Group figure. Sectors in focus
for management: Airlines, Transport, Retail, Leisure and Oil & Gas – per
page 18 of NWG Q1 Results 2021. 5. Customer accounts with payments
commencing in 60 days or under 6. Data as of 6 May 2021. 7. Upon                                                                                                                                             9
completion in 2026.
Targeted Growth powered by
           Partnerships and Innovation

        Supporting customer                                        Multiple sources of fee income with                        Specialist growth in Large Corporates &
        needs through purpose                                      strong growth prospects                                    Institutions
        led partnerships and                                       ▪ FY20 impacted by COVID-19 with lending                                ▪ Building on history of existing
        innovations                                                  and trade finance remaining resilient                                   strengths & expertise in targeted
                                                                                                                                             areas
        Net fees and commissions                                   ▪ Addressing gaps and targeting growth
                                                                     through investments in Payments,                                      ▪ Key player in ESG, aligned to
        contributed c.30% to
                                                                     Transaction Banking and Cards                                           growth in private capital and M&A
        Commercial Banking income in                                                                                                         activity
        2020
                                                                                                                                           ▪ Collaborating across NatWest
        Delivering targeted growth in                                  Net fees and Commissions, FY18-20 (£m)                                Group
        Large Corporates & Institutions                                             +2%
        that aligns to our purpose                                     1,283
                                                                                             1,312                            Proven track record of growth in target areas
                                                                                                                  1,110
                                                                                                                              Example: Infrastructure and Project Finance
                                                                        556                   659
                                                                                                                   507
                                                                                                                                                     +47%
                                                                        537                   510                  505                                          156

                                                                      175                  154                  129
                                                                            77                    93                 83
                                                                      -62                  -104                 -114
                                                                       2018                  2019                 2020                      106

                                                                              Payment services
                                                                                                                              Revenue £m
                                                                              Lending (credit facilities) and trade finance
                                                                              Credit and debit card fees
                                                                              Fees and commissions payable                                 2016                2020
Notes: 1. Includes brokerage, investment management, trustee and              Other1                                                                                         10
fiduciary services, underwriting fees and other.
Simple to deal with
Improving customer Digital Engagement Transforming operations and
Transformation
engagement and driving
High
(Q1 2021) services for core capabilities
efficiencies • CRM integrations allowing RM’s
82%
Digitally active
Customer broader visibility and data
Commercial
Relationship insights on all Commercial
Reducing costs in line with customers1
Management customers
group targets
towards
Continue to build digital
channels, deploying expertise c460k Mobile app
users
Enhancing customer experience
to customers in a more with additional digital capabilities to
Digitisation
personalised way be introduced
Impact
Increase in Cora
Re-engineer, digitise and 3x interactions from
~80k in Q1’20 to
• Financial and personalised data
Progressing
~240K in Q1’21
insights
automate processes & key Mobile App
• Further integration with FreeAgent
journeys, using technology &
Digital sales
data
68% excluding
government Automating self service for
Transform Service & schemes2
everyday journeys
Automation
Operations; simplify lending
journeys and reduce time to • Advancing Cora capabilities for
Bots deployed for
supporting customers
114
Low
decision processing c.300k
Customer
BBLS/CBILS • Improving operations via
applications journeys
Intelligent Document processing
Notes: 1. % of active customers that have logged in the past 3 11
months. 2. Based on average yearly data.Sharpened capital allocation
Range of strategies deployed to drive capital efficiency (RWA and Lending, £bn)
Proactive capital
8% lending increase vs. 4% RWA reduction RWA Gross Lending
management and risk RWA
Intensity2 76% 68%
mitigation aligned to our • Risk • Active Capital • Business growth • Active Capital
priorities degradation
• Business growth
Management • Regulatory updates Management
• Regulatory updates3
103 111
More disciplined and efficient 78 75
capital allocation supported by
enhanced distribution activities
2018 2020 Medium
Reflecting pricing strategy on term outlook
evolving economic outlook, risk
and climate transition risk Active management Dynamic pricing Climate commitments
~£15bn1 of sustainable funding ▪ Close monitoring of COVID- ▪ Existing models reflect both ▪ Estimated emissions for 4
19 impacted sectors with counterparty risk and sector high carbon emitting
and financing across
appropriate ECL coverage cyclicality sectors4
Commercial Banking and
NatWest Markets in 2020 and ▪ Active review of new ▪ Ongoing review of pricing ▪ Developing Paris alignment
business, including renewals strategy to reflect evolving pathways for key sectors
Q1 2021 (~75% of NatWest
▪ Portfolio sales & synthetic risk and economic ▪ Developed methodology to
Group’s £20bn target) assumptions
trades: £0.8bn RWA benefit assess credibility of
in 2020 and £0.6bn in Q1 ▪ Incorporating climate as part transition plans of Oil & Gas
Notes: 1. £10.2bn in NatWest Markets and £4.7bn in Commercial 2021 of our capital allocation majors and coal customers5
Banking. 2. RWA intensity = RWAs / Total loans to customers
(amortised cost. 3. Including Methodology and model updates, and process
transfers. 4. ~45% of gross lending and investment balances at
Dec’2019. 5 Customers engaged in coal (thermal and lignite) related 12
mining, trading, power generation and supply activities.Commercial Banking financial
outlook
We remain focused on Our path to sustainable RoE is underpinned by core value levers
delivering long term Medium ▪ Targeting growth: Lending, digital
sustainable performance P&L (£m) FY’19 FY’20 Q1’21 term outlook
capabilities, expansion of payment
vs. FY’20
and fee propositions
Leveraging our competitive Net interest income 2,842 2,740 643
positioning and innovation to Non-interest income 1,476 1,218 298
▪ Continued investments: Innovation
grow income
Total income 4,318 3,958 941 including Ventures and product
Strong cost discipline development critical to creating
Other expenses1 (2,236) (2,261) (548)
sustainable long term returns
Proactive capital approach Operating expenses (2,600) (2,430) (583)
Operating profit before ▪ Delivering cost efficiencies:
Working with NatWest Markets impairments
1,718 1,528 358
Simplification, digitisation &
on our purpose-led and Impairment releases/
(391) (1,927) 117
(losses) automation, leveraging Group
integrated proposition capabilities & data
Operating profit 1,327 (399) 475
RoE (%) 8.4% (4.5)% 14.9%
▪ Managing capital discipline and
continuing to manage our risk
Balance Sheet (£bn) FY’19 FY’20 Q1’21 exposure
Net loans to customers
101.2 108.2 106.6
- amortised cost
▪ Working with NatWest Markets to
Customer deposits 135.0 167.7 169.4 improve capital allocation and deliver
RWAs 72.5 75.1 71.6 joint customer propositions
Notes: 1. Other expenses comprises Operating expenses excluding 13
Litigation and conduct costs and Strategic costs.Robert Begbie
NatWest Markets CEO
14Purpose
NatWest Markets will be NatWest Markets overview
the partner of choice to
UK and Europe: Our Home Markets
meet the financial • Solving needs of our customers by providing access to FX, risk
markets needs of Group management and capital markets expertise
• Liquidity, market making and execution across GBP and EUR products
customers
UK
Well integrated and United Europe1
strategically important Markets States Japan
platform of the Group
Asia: Trading and
Provide expertise and financial US: Trading, Sales and Sales distribution
markets access to deliver core Origination hub Singapore • Connecting our
• Providing access to US customers with
capabilities across the Group investor capital in
capital markets and
USD products Asia
Focused on our customers in
areas where we add the most
value and have a strong track
record
Providing important financial markets access for the real economy
Connecting our customers with investor capital to support their objectives
Providing liquidity, pricing and risk management services for customers
1. European presence in Netherlands, France, Germany,
Italy, Stockholm and Dublin
Key Financial Centres 15Transformation progress
Foundations in place for New Customer-led model in place Operating expenses reduction, £m
a sustainable business
-8%
Significant progress in 2020 Capital Customer 1,418
against our transformation Markets Sales
Trading
Strategic,
1,310
240
objectives: Litigation -12% 272
Currencies & Conduct
▪ New customer-led model Fixed Income Direct &
1,178
Indirect 1,038
▪ Simplified product offering
Capital Management Unit
▪ ~£140m reduction in 2019 2020
operating expenses
excluding strategic, litigation RWA reduction ahead of plan, £bn One-bank operating model
and conduct costs
▪ £11bn RWA reduction and
£0.5bn dividend to NatWest
Group
38
-11
~2.5k Employees
32 Transferred to NatWest Holdings in
27 2020 to deliver one-bank operating
▪ Improved credit ratings1; model, leveraging group services
and technology to drive efficiencies
▪ Moody’s: 2 notches to A3
▪ Fitch: 1 notch to A+
1. Long term senior unsecured ratings 2019 2020 2020
guidance
16NatWest Group C&I customers
Corporate & Institutional customer segments
Focusing on NatWest
Financial
Group C&I customers Corporates Sponsors
Institutions
SSA
Number of
NatWest Markets plays an customers1 ~8,500 ~300 ~3,000 ~100
important role in delivering Customer • Mid and Large • Private Equity • UK centric and • UK and European
critical financial markets services profile Corporates (incl. firms and Fund Global Financial DMO
to Group customers as part of a MNCs) customers with a Institutions with • Supranational
purpose-led and integrated • Corporations strong UK and strong UK nexus and Agencies
domiciled in the Europe presence • Banks, Non-
proposition with Commercial
UK, Europe or or investment Banks, Insurers,
Banking with strong UK objectives Pension Funds
linkages and Asset
We are increasing our focus and Managers
resources to customers who play
a critical role in the Real
Economy
NWG
proposition Transaction Corporate Lending & Capital
We have clear capital allocation Banking Coverage Structured
Finance
Currencies Markets Fixed Income
objectives across our customer
segments in line with our purpose Customer
Coverage
Commercial
Commercial
Target to deliver sustainable
NatWest Markets
returns across C&I customers
1. Number of customers reflects those enabled to transact
with NWM.
2. Return on equity is based on segmental operating profit 8%2 illustrative RoE over the medium term for NatWest Group’s C&I customers
or loss adjusted for a normalised cost of risk, preference
share dividends and tax, divided by allocated average Commercial NatWest Markets 17
notional tangible equity, assuming 28% tax rate.Proposition
Providing capital markets Currencies Capital Markets Fixed Income
and risk management • Cash Bonds, Repo and
• FX Spot and FX Forwards, • Helping customers access in
What we do
expertise to customers Options and Cross Currency global debt capital and
Interest Rate Derivatives in
Rates
Swaps as well as FX prime private markets
brokerage services and • Provide liquidity and credit
• Market leading structuring
Digital led Currencies business digital solution for Investment Grade and
and distribution expertise
that’s highly connected across High Yield for issuers
NatWest Group • Best bank1 for UK SMEs • Most impressive FIG house in
• #1 in Gilts estimated by
Market awards
• UK Corporates FX Service GBP3
Growing Capital Markets notional share8
Quality Leader2 for the last 7 • Best agent of international
business leading with innovative • Inflation derivatives house of
years US Private Placements4
solutions in collaboration with the year6
• Best bank1 for Post trade • #1 lead manager for
Commercial Banking Services and FX Prime sustainability labelled debt for
• Most accurate UK economy
forecaster7
Brokerage UK Corporates5
Focused Fixed Income business
providing liquidity, risk FX Digital Primary
Income mix (Q1’21)
management and market & Electronic FX Capital
Markets
making
Private Credit
Financing Rates
1. FX Markets Best Banks Awards 2020
2. Greenwich Associates Global FX Study, UK Corporates,
2019, awarded April 2020 FX
3. GlobalCapital Bond Awards 2020 FX Prime Derivatives
4. GlobalCapital Private Debt Awards 2020, awarded in
Feb 2021
5. Dealogic FY 2020 51% 32% 17%
6. Risk Awards 2021
7. Consensus Economics May 2019
8. Greenwich Associates European Fixed Income Rates Q1’21 income mix excluding asset disposals/strategic risk reduction, own credit adjustments, Capital Management Unit and revenue share pay- 18
2020 awaySupporting customers
NatWest Markets customer growth priorities
Targeting organic
growth in areas where
Grow ESG expertise and capability by building on our Capital Markets
we can add the most experience
value for our customers
We are focused on developing Grow our Sponsors & Funds Financing activity in Capital Markets
the Capital Markets and alongside RBS International
Currencies business
Collaborating as One Bank, we
Support the refinancing needs of customers following the pandemic in
will maintain leading positions
collaboration with Commercial through capital markets access
in our chosen markets and
grow in our areas of focus
Generate sustainable and Investing in Digital FX and greater integration of FX into payments
attractive returns through the across NatWest Group e.g. Bankline
cycle with efficient capital
usage
Increasing FX penetration with mid and large Corporates and develop
our strategic FX solutions capability
19Supporting customers
Investing in our ESG capability to support customers and our purpose
We are building on
strong ESG expertise to • Established ESG centre of expertise to innovate and develop solutions for customers
support customers and • Executed our first corporate ESG-linked FX derivative transaction in March 2021
our climate agenda
• #11 for GSS Bonds for UK Corporates and European Corporate Hybrids in 2020
Growing Green, Social and • Awarded2 lead manager of the year in Green Bonds for SSAs and lead manager of
Sustainable (GSS) bond activity the year in Sustainability Bonds for local authority / municipality issuers in 2021
Deepening relationship with Global GSS issuance volume and ranking
institutional investors on their
Volumes Global GSS issuance
ESG strategies ($bn)
600 525
Acceleration of climate related
funding and financing with 400
£7.2bn raised in 2020 and 293
£3.0bn in Q1 2021 (~50% of 200 144
197
NatWest Group’s £20bn target) 241
0
2017 2018 2019 2020 Q1 2021
NatWest Markets Rank
1. GSS issuance volumes, market share and market Global #48 #22 #23 #15 #11
positions based on Dealogic
2. Environmental Finance‘s Bond Awards 2021
3. ESG denotes Environmental, Social and Governance Europe #30 #28 #17 #12 #5
20Simple to deal with
Theme Examples
Simplifying to improve
efficiency and customer Business • Reshaping of front office and organisational design
experience Simplification
• Rightsizing of US and APAC footprint and operating model
We are transforming how we • Developing electronic coverage model for sales
operate to simplify the business • Agreement with BNP Paribas for the execution and clearing of listed
for colleagues and customers derivatives
We are investing over the next
One-bank
3 years to deliver our • Consolidated certain customer coverage teams into Commercial
model
transformation goals and one-
bank priorities • Simplify customer journeys through common processes and data
• Leveraging NatWest Holdings centres of excellence for shared
Multi year transformation
services and functional support to drive synergies
mobilised to deliver a
sustainable and efficient
markets platform for the Technology • Streamline and simplify technology and infrastructure estate
Group, operating on a lower transformation
operating expense base • Reduction in # of applications
• Migration of applications to Cloud hosting and exit data centres
• Transform post trade services and processes
1. Next 3 years denotes 2021-2023
21Sharpened capital allocation
Risk Weighted Assets (£bn)
Sharper capital
Operational Risk Market Risk
discipline and allocation Counterparty Risk Credit Risk
38
of capital 3
Capital Management Unit 12 27 27
3 3
actively manages capital Corridor of c20
9 8
allocation and optimisation 13
across the businesses 9 10
10 6 6
Target of c£20bn RWAs in the
medium term, with the FY’19 FY’20 Q1’21 Medium Term target
intention to achieve the
majority of this reduction by 2020 RWA reduction of £11bn Remaining RWA reduction
the end of 2021
• Capital optimisation and risk reduction • Reduction in Derivatives portfolio
Once the restructuring is actions
• Further reduction in Market Risk and
complete we aim to operate
• Product exits and rationalisations Credit Risk
within a corridor of around
c£20bn • Derivative portfolio unwind and novation • £4m of Asset Disposal costs in Q1 2021
of collateralised packages and single
• We expect NatWest Markets disposal
Returning capital to the Group uncollateralised names
losses to total £0.2bn of losses in 2021
through dividends over the • Full exit of remaining SABB shares held
medium term
• £83m of Asset Disposal costs in 2020
22Financial outlook
Medium
We aim to deliver P&L (£m) FY’19 FY’20 Q1’21
term
outlook vs
improving returns FY’20
Fixed Income 1,2
496 518 39 ▪ Income £0.8-1.0bn over
the medium term
Currencies 432 583 118
Focused on serving our 2
Capital Markets 362 384 74
customers where we add most ▪ ROE low to mid-single
3,4
value Capital Management Unit 340 (62) 8 digit over the medium
Revenue share (208) (193) (48) term
Investing to deliver a simpler Income ex. Asset disposals and OCA 1,422 1,230 191
▪ RWAs within corridor of
and efficient Markets platform Asset Disposals - (83) (4)
c.£20bn in the medium-
for the Group and reduce Own Credit Adjustment (OCA) (80) (24) 2 term with the intention to
operating expenses Total income 1,342 1,123 189 achieve the majority of
this reduction by the end
Other expenses (1,178) (1,038) (240)
Returning capital to the Group, of 2021
Operating expenses (1,418) (1,310) (275)
£500m paid in Feb’21
Impairment releases/ (losses) 51 (40) 6
Operating profit (25) (227) (80)
RoE (%) (3.2)% (3.8)% (6.3)%
1. Fixed income comprises Rates and Credit trading
2. Credit trading and Capital Markets were previously
reported as Financing
3. Capital Management Unit set up in Q3’20 to manage the Balance Sheet (£bn)
capital usage and optimisation across NatWest Markets.
The income shown relates to legacy assets. Funded Assets 116.5 105.9 105.7
4. FY’19 includes positive impact from the disposal of
Alawwal through the merger with SABB in H1’19 RWAs 37.9 26.9 26.5
Note: This presentation contains forward-looking statements,
please see Forward-Looking Statements on slide 41.
Average RWAs 43.7 34.7 26.8
23Simon McNamara
Chief Administrative Officer,
Services
24Foundations
c£100m
Commercial NWM Progress
Resilient whilst investing 8 5
in core capabilities
Investment p.a in keeping our
Technology current.
CAO Services provides 2019 2020 Progress 2021+
Technology, Data, Property
& Supplier services as well 152 8 -46%
as Financial Crime, Fraud &
Shared Operations to the
Franchises
6373 588 -8%
1,092
Apps hosted in Cloud.
2014 2020 Progress 2021+
>40% of application estate in last 4
Investing to maintain years.
stability & resilience, as well 5,500 2,261 -55% Scalable, on-demand
Supplierscomputing
as improve detection and services allowing us to be more
management of Cyber agile and cost efficient.
attacks keeping customers 2014 2020 Progress 2021+
safe Turned legacy technology
A simpler technology estate,
21K 5.4K -74% estate which was
disconnected, into a
moving to Cloud – enabling connected, current and
Tech Run costs to reduce by 2014 Q1 2021 Progress 2021+ more agile platform to serve
4
25% customers, powered by cloud, APIs
and the use of automation tooling.
1.
2.
FY’20 – incidents can impact across multiple franchises as such
this will not total to the Group Critical 1 incidents of 8 for FY’20
Distributed Denial of Services (DDoS) attacks managed.
2,500 1,074 -74%
3. Malware alerts managed - Malware is any software
intentionally designed to cause damage to a computer, server,
25
client, or computer network
4. Reduction since 2014.Simple to deal with Modernising the NatWest Markets colleague platform experience whilst reducing
Technology costs associated with running duplicative, end of life 2 platforms
NatWest Markets NatWest Markets Now Future State
Transformation is driving
cost reductions through Overview Disparate systems Joined-up One Bank Digital
Experience
re-use of common
capabilities Operating System Windows 72 Windows 10,
and tools Office 20102 Office 365, Microsoft Teams,
Revised operating model brings Workplace, Leankit, Symphony
Chief Digital Information Office
Communication Skype, Lync (Group Chat), Teams,
& Operations into Services,
Symphony, Symphony,
alongside centres of excellence
Zoom (NatWest Markets) Zoom (One Bank)
Leveraging core capabilities to Technology Kit Legacy Desktop Chromebooks,
reduce costs Improved remote access
Moonshot
55 applications planned for
decommission in 2021 Support Dedicated duplicative end- Standard One Bank support,
user support through AI ‘Ask Archie’,
Simplifying & optimising NatWest Markets Trade floor support for front office
applications, reducing costs to Telephony Avaya Desktop Zoom
run
Supporting c.4% cost reduction per annum across the Group through to 2023 1
1. Other expenses, excluding OLD and Ulster Bank RoI direct
costs
2. EOL = End of life. Includes those that are unsupported by third 26
parties e.g. BloombergSimple to deal with
114 Bots quickly deployed to support the processing of~300k BBLS/CBILS2
applications, equivalent to ~1,000 FTE3 at peak volume
We continue to maintain
resilience whilst
innovating, adapting and
focusing on driving Held 0.5m conversations with Business Banking customers in 2020, an
returns through increase of 150% over 2019. Over 40% required no human intervention
digitisation
Cora, our digital assistant that
originated in Retail is deployed Intelligent Document Processing capability implemented in the Customer
and supporting Business Due Diligence journey – estimated reduction in effort of c.80%, where
Banking customers manual extraction of data is taking place
Capabilities developed clearing
COVID-19 backlogs repurposed
to support Lending Journey Code built to support customers requesting Capital Repayment Holidays due
to Covid-19 is now used in our Lending Journey.
Bounce Back Loan Scheme Customer Service improvements now written in a single code base enabling
scaled quickly with use of Bots quick roll-out across other digital channels
1
1. Other expenses, excluding OLD and Ulster Bank RoI direct Supporting c.4% cost reduction per annum across the Group through to 2023
costs
2. Bounce Back Loans Scheme / Coronavirus Business
Interruption Loan Scheme 27
3. Based on peak volumes and processing in the same timescalePartnerships & innovation Our focus has pivoted to creating the Bank of APIs as we deliver new customer
propositions on bank and non-bank channels.
We see Open Banking
and the use of APIs1 >£1bn Built a pipeline of
as a business enabler payments commercial
processed via opportunities for
rather than regulatory the Open companies to
compliance Banking APIs to consume our
date 24 NatWest APIs
Key to creating and exploiting Group’s customer
propositions
new markets and streams of
reusing Open
income will be our API > 1.5m Banking APIs
services which act as the c.230 Third
customers have
Parties
chain link connecting our utilised Open
connected to
bank to channel providers Banking since go APIs enabled
Open Banking
live across our brands
>700 API End
Points delivered
since 2018
First UK bank to
125m+ API calls offer
processed each personalised loan
month (and quotes on social
growing) media
1. Application Programming Interface is a software intermediary
that allows two applications to talk to each other
28Partnerships & innovation
Our Innovation • Integration of Tyl with Mettle, Payit and FreeAgent creates a merchant
Integration of ecosystem for the One Bank SME proposition
ecosystem combined Tyl • Offers merchants and consumers choice of eCommerce and payment
with APIs enables us to methods, linked with data-led insights and personalised loyalty schemes
deliver the services our
customers want and • Through APIs we are connecting our FX capabilities with existing digital
channels, such as Bankline, to unlock fee income opportunities through
need. Foreign
enhanced customer journeys
Exchange
One Bank SME & Payments
proposition.
ments API offered through Bankline Direct allows
Supporting our large • Financial institutions plug secure API technology directly into their existing
Financial Institutional infrastructure and provide their customers with 24/7 secure access to
Indirects
customers by sharing our faster payment services. Significant cost saving versus developing their
payment API
own capability and deepens relationship with NatWest
Faster Payments capability
enabling them to improve
their service and lower costs
• Personally Identifiable Information data sharing with third-parties through
Using APIs to grow existing & Data APIs to facilitate new customer onboarding.
create new fee income. Sharing • Signed a commercial agreement with a leading global e-commerce
platform allowing our customers to rapidly onboard as merchants
Driving Fee Income growth in Commercial Banking & NatWest Markets
29Supporting customers through
every stage of their lives
Using data to deliver Proof of concept of data ‘learning tools’ that combine
Example 1
highly personalised Leveraging consumer debit card payments and account data to provide new
insights for commercial insights for our commercial customers to grow their
insights that help businesses businesses (e.g. local spending trends)
customers to thrive and
stay safe, a differentiator
in attracting & retaining
Targeted and personalised communications through
Example 2
customers Personalised customer
the pandemic, helping customers with their cashflow,
support through
management of government schemes and migration
BBILs / CBILs
to digital services
Identify behavioural patterns,
providing insights to
Commercial Banking customers
Tailored customer support and Analytics supporting One A single view of customer returns driving sharpened
Example 3
personalised digital messaging Bank capital allocation, capital allocation, granular insights into drivers of
insights and new value/cost and generating insights into new
Analytics platforms to facilitate propositions propositions
smarter decisions on capital use
Supporting lending growth above market rate through to 2023
in our Retail and Commercial businesses1
1. Net lending to customers across the UK and RBSI retail and
commercial businesses, excluding UK Government lending
schemes
30Jen Tippin
Chief Transformation
Officer, Transformation
31One Bank Transformation
Programme
We are driving the
execution of our
Building sustainable returns
strategic priorities with through….
a new approach. Comprehensive
Formation of
Chief
One Bank
delivery
transformation effort (growth, Transformation
roadmap
We are working in simplification and capital) Office
collaboration with NatWest
Markets and Commercial Effective, multi year investment
Banking to deliver prioritisation of £3bn portfolio
incremental value beyond Front to back What is Rigorous
re- execution
what the franchises can Transforming end to end engineering
different? discipline
deliver alone customer journeys
Driving growth and efficiency savings
of c4% net per year1 New
Multi-year capabilities;
approach and driving
Building new capabilities and re-use
maximising for re-use
1. Total expenses excluding litigation and conduct costs,
strategic costs, operating lease depreciation and the impact 32
of the phased withdrawal from the Republic of Ireland.One Bank Transformation
Workstreams
The delivery of the 9-
10% ROTE target by Objectives
2023 is supported by a Drive growth in priority segments and deepen existing customer
Customer Lifecycle relationships by building lifecycle management capabilities and
One Bank culture
Transformation Digitise and personalise customer experiences across touchpoints and
Digitisation & Distribution
programme comprising simplify our local banking model
PARTNERSHIPS & VENTURES
seven workstreams Customer Journeys & Simplify priority Customer Journeys end-to-end and drive re-use
One Bank Capabilities of One Bank capabilities across franchises
SIMPLIFICATION
We will share how these
GROWTH
CAPITAL
Organisation, Skills & Deliver a simple One Bank organisational model (including entities,
workstreams are directly Culture brands, locations and functional support) and the mindset/culture, skills
and colleague experience to underpin the transformation
supporting Commercial and
Build and maintain a common modular technology platform with high
NatWest Markets by bringing Technology & Data levels of straight through processing & a bank-wide customer DNA
to life examples from: capability for smart customer relationship management.
- Customer Journeys & One Partnerships & Ventures Outline and execute a One-Bank strategy for innovations, ventures and
collaborations that supports the delivery of the Bank's overall strategy
Bank Capabilities
Build and run a bank-wide capital management unit and embed
- Portfolio Discipline Portfolio Discipline
continuous improvement in capital productivity across the bank
33Customer Journey & One Bank
Capabilities:
Simple to deal with
Transforming operations and services Spotlight on
Transformation
for core capabilities Microsoft Dynamics 365
Simplifying, digitising • Direct Relationship Manager service Progress (April 2021)
and automating the Customer provided to 16k additional customers
customer journey for Relationship
Management
• Re-integration of EU divestment
940k Customers
supported
c.940k business banking
customers 6.5k Colleagues
supported
Enhancing customer experience with
Driving increased customer additional digital capabilities to be
Digitisation
satisfaction and experience introduced • CRM system allowing us to
whilst reducing cost • For online and in the app
serve more customers at a
lower cost with a better
Supports our goal of £300m Enhanced • Customer prompts and insights user experience
Features
gross savings through • Integration with other
Customer Journey re- technology platforms
engineering by 2023 • Moving towards a single
Automating self service for everyday
view of customer
NPS1 has improved from -5 to journeys
Automation
-1, targeting further • Digitisation of 17 key service journeys • Business Banking accessible
to promote self-serve to customers through more
improvement by 2023 channels of choice eg video
Customer
journeys • Creating a consistent experience and
safe / stable operating environment • Full integration of Cloud 9
telephony and D365
expected by June,
1. Improvement over 12 months. Source: MarketVue Business
Banking from Savanta, Q1 2021 data, based on 961
These initiatives as well as digitisation of 17 key delivering enhanced
businesses with a turnover of less than £2m. Data weighted
service journeys promote self serve and drive cost productivity and efficiency
by region and turnover to be representative of businesses in
England and Wales.
benefits of c.£19m 34Portfolio Discipline / One Bank
Capabilities
Leveraging NatWest Markets capability is Case study:
Following key strategic helping to embed a Capital Management Unit One Bank Capability in Foreign
decisions, work is across the bank: Exchange
underway to build and • Commercial and NatWest
run a bank-wide Markets are collaborating on a
number of opportunities to
capital management Optimise pricing
unlock opportunities to better
unit approaches/hurdles
service and anticipate the
foreign exchange and
This is being run through international payments needs
the Portfolio Discipline Improve of customers.
workstream and involves RWA Increase • Through better use of data to
leveraging proven capability accuracy capital identify opportunities and
built within NatWest and velocity significant work undertaken to
Markets and reusing it modelling improve onboarding, the
across the Group. benefits of increased referrals
and revenue are already being
Another example of re-
Enhance seen
using capability can be seen
performance • This initiative has the ability to
through NatWest Market’s management
Foreign Exchange support growth and is enabled
capability supporting through the re-use of NatWest
Commercial customers. Markets capabilities
35Simple to Deal With
Case Study:
Simplifying our
Capability Impact
business to deliver a • In 2020 and 2021 NatWest Markets
concluded a refunctionalisation
step change in programme to realign support
functions to NatWest Holdings.
customer experience, Real time cost process
Single, live view of all cost
controls and costs initiatives and outcomes
• c2,500 FTE moved to NatWest
Single source of the truth on Holdings, generating an associated
We will deliver c.4% net Bank wide cost performance, cost reduction of c.£30m per annum
reduction in costs per annum Transparency of reporting outcome delivery, risks and for the Group.
opportunities
through to 20231.
• Through building transparency and
Identify strategic opportunities insight across the cost portfolio, we
in the franchises to drive have identified and are accelerating
Intelligent Insights
efficiency and productivity the downstream benefits of
refunctionalisation for NatWest Group:
• Functional transformation –zero
Execution capability for pan- based design, automation of
Partners in Cost Execution bank initiatives data
• Optimising organisation design
• With active outcome tracking from
Underpinning the delivery of our 4% net cost idea to value, the estimated annual
reduction target with key capabilities benefit of these initiatives for the
NatWest Group is £100m+ per annum.
1. Other expenses, excluding OLD and Ulster Bank RoI direct costs
36A Relationship Bank for a
digital world
Our Purpose led
strategy will drive
sustainable returns for
shareholders
Strategic priorities delivered
through:
Sustainable growth with an
intelligent approach to risk
Simplification and cost
efficiency
Portfolio discipline and
effective deployment of capital
1. Comprises customer loans in our UK and RBS International
retail and commercial businesses.
Executing this programme drives our delivery of the Group 9-10% RoTE target for 2023
2. Total expenses excluding litigation and conduct costs,
strategic costs, operating lease depreciation and the impact 37
of the phased withdrawal from the Republic of Ireland.Q&A
38Biographies
Paul Thwaite, CEO Commercial Banking Peter Norton, CFO Commercial Banking
Paul Thwaite was appointed CEO, Commercial Banking in Peter was appointed CFO of Commercial Banking in February 2020. Before
November 2019 and is responsible for the business supporting joining the Group in October 2018 as Head of Group Strategy, Peter spent
customers ranging from SME’s through to multi-nationals. Paul has four years at UK Financial Investments managing HMG’s shareholdings in
previously held senior business and functional roles across NatWest Group, Lloyds and UK Asset Resolution, serving as a Non-
Wholesale, Corporate, International and Retail Banking and prior to Executive Director of Northern Rock Asset Management and Bradford &
being CEO, was most recently responsible for the bank’s SME Bingley. Prior to working for UKFI, Peter was an investment banker at
franchise and commercial product businesses. Lehman, Nomura and UBS.
Robert Begbie, CEO NatWest Markets David King, CFO NatWest Markets
Robert was appointed CEO of NatWest Markets in June 2020. He David joined NatWest Markets as Chief Financial Officer in 2020. David is
has been with the Group for 40 years and has extensive experience collectively responsible for the long-term success of NatWest Markets and
in treasury and capital markets across fixed income, derivatives, the delivery of sustainable shareholder value. David was CEO at MUFG
asset management and cash markets and has led teams in the UK, Securities, where he was previously CFO. He has held senior finance roles
Europe, Asia and the US. After spending 20 years in the Markets at Lloyds, HBOS and Halifax, and worked in the RBS Financial Markets
business, Robert joined Treasury in 2009 and was appointed as Finance team between 1995 and 2001.
Group Treasurer in 2017.
Simon McNamara, Chief Administrative Officer
Jen Tippin, Chief Transformation Officer
Simon joined NatWest Group in Sept 2013 and leads our Services
Jen was appointed as Chief Transformation Officer in August 2020. She is
business, the engine room supporting all of our customer facing
responsible for executing the strategy to create the very best customer
brands. He has held a number of critical technology and operations
experience as well as managing the Group’s investment portfolio,
roles for major global financial organisations and established a
efficiency and the build of one bank capabilities. Prior to joining the Group,
successful start-up in Silicon Valley. He is also Chairman of
Jen spent 15 years at Lloyds Banking Group in a variety of different roles.
Pollinate, an organisation transforming commerce for SME’s.
39Cautionary and Forward-looking statements The guidance, targets, expectations and trends discussed in this presentation represent NatWest Group (and where applicable N WM Group) management’s, current expectations and are subject to change, including as a result of the factors described in the “Risk Factors” on pages 345-362 of the NatWest Group plc 2020 Annual Report and Accounts, as well as the Risk Factors on pages 156-172 of the NWM 2020 Annual Report and Accounts, respectively. Cautionary statement regarding forward-looking statements Certain sections in this document contain ‘forward-looking statements’ as that term is defined in the United States Private Securities Litigation Reform Act of 1995, such as statements that include the words ‘expect’, ‘estimate’, ‘project’, ‘anticipate’, ‘commit’, ‘believe’, ‘should’, ‘intend’, ‘will’, ‘plan’, ‘could’, ‘probability’, ‘risk’, ‘Value-at-Risk (VaR)’, ‘target’, ‘goal’, ‘objective’, ‘may’, ‘endeavour’, ‘outlook’, ‘optimistic’, ‘prospects’ and similar expressions or variations on these expressions. In particular, this document includes forward-looking statements relating, but not limited to: the Covid-19 pandemic and its impact on NatWest Group; future profitability and performance, including financial performance targets (such as RoTE and ROE) and discretionary capital distribution targets; ESG and climate related targets, including in relation to sustainable financing and financed emissions; planned cost savings; implementation of NatWest Group’s Purpose-led strategy, including in relation to the refocusing of its NWM franchise and the digitalisation of its operations and services; the timing and outcome of litigation and government and regulatory investigations; the implementation of the Alternative Remedies Package; balance sheet reduction, including the reduction of RWAs; capital, liquidity and leverage ratios and requirements, including CET1 Ratio, RWAs, Pillar 2 and other regulatory buffer requirements and MREL; funding plans and credit risk profile; capitalisation; portfolios; net interest margin; customer loan and income growth and market share; impairments and write-downs, including with respect to goodwill; restructuring and remediation costs and charges; NatWest Group’s exposure to political risk, economic risk, climate, environmental and sustainability risk, operational risk, conduct risk, cyber and IT risk and credit rating risk and to various types of market risk, including interest rate risk, foreign exchange rate risk and commodity and equity price risk; customer experience, including our Net Promotor Score (NPS); employee engagement and gender balance in leadership positions. Limitations inherent to forward-looking statements These statements are based on current plans, expectations, estimates, targets and projections, and are subject to significant inherent risks, uncertainties and other factors, both external and relating to NatWest Group’s strategy or operations, which may result in NatWest Group being unable to achieve the current plans, expectations, estimates, targets, projections and other anticipated outcomes expressed or implied by such forward-looking statements. In addition, certain of these disclosures are dependent on choices relying on key model characteristics and assumptions and are subject to various limitations, including assumptions and estimates made by management. By their nature, certain of these disclosures are only estimates and, as a result, actual future results, gains or losses could differ materially from those that have been estimated. Accordingly, undue reliance should not be placed on these statements. The forward-looking statements contained in this document speak only as of the date we make them and we expressly disclaim any obligation or undertaking to update or revise any forward-looking statements contained herein, whether to reflect any change in our expectations with regard thereto, any change in events, conditions or circumstances on which any such statement is based, or otherwise, except to the extent legally required. Important factors that could affect the actual outcome of the forward-looking statements We caution you that a large number of important factors could adversely affect our results or our ability to implement our strategy, cause us to fail to meet our targets, predictions, expectations and other anticipated outcomes or affect the accuracy of forward-looking statements described in this document. These factors include, but are not limited to, those set forth in the risk factors and the other uncertainties described in NatWest Group plc’s Annual Report on Form 20-F and its other filings with the US Securities and Exchange Commission. The principal risks and uncertainties that could adversely NatWest Group’s future results, its financial condition and prospects and cause them to be materially different from what is forecast or expected, include, but are not limited to: risks relating to the COVID-19 pandemic (including in respect of: the effects on the global economy and financial markets, and NatWest Group’s customers; increased counterparty risk; NatWest Group’s ability to meet its targets and strategic objectives; increased operational and control risks; increased funding risk; future impairments and write-downs); economic and political risk (including in respect of: uncertainty regarding the effects of Brexit; increased political and economic risks and uncertainty in the UK and global markets; changes in interest rates and foreign currency exchange rates; and HM Treasury’s ownership of NatWest Group plc); strategic risk (including in respect of the implementation of NatWest Group’s Purpose-led Strategy, including the re-focusing of the NWM franchise and NatWest Group’s ability to achieve its targets); financial resilience risk (including in respect of: NatWest Group’s ability to meet targets and to resume discretionary capital distributions; the competitive environment; counterparty risk; prudential regulatory requirements for capital and MREL; funding risk; changes in the credit ratings; the adequacy of NatWest Group’s resolution plans; the requirements of regulatory stress tests; model risk; sensitivity to accounting policies, judgments, assumptions and estimates; changes in applicable accounting standards; the value or effectiveness of credit protection; and the application of UK statutory stabilisation or resolution powers); climate and sustainability risk (including in respect of: risks relating to climate change and the transitioning to a low carbon economy; the implementation of NatWest Group’s climate change strategy and climate change resilient systems, controls and procedures; increased model risk; the failure to adapt to emerging climate, environmental and sustainability risks and opportunities; changes in ESG ratings; increasing levels of climate, environmental and sustainability related regulation and oversight; and climate, environmental and sustainability related litigation, enforcement proceedings and investigations); operational and IT resilience risk (including in respect of: operational risks (including reliance on third party suppliers); cyberattacks; the accuracy and effective use of data; complex IT systems (including those that enable remote working); attracting, retaining and developing senior management and skilled personnel; NatWest Group’s risk management framework; and reputational risk); and legal, regulatory and conduct risk (including in respect of: the impact of substantial regulation and oversight; compliance with regulatory requirements; the outcome of legal, regulatory and governmental actions and investigations; the replacement of LIBOR, EURIBOR and other IBOR rates; heightened regulatory and governmental scrutiny (including by competition authorities); implementation of the Alternative Remedies Package; and changes in tax legislation or failure to generate future taxable profits). The information, statements and opinions contained in this document do not constitute a public offer under any applicable legislation or an offer to sell or a solicitation of an offer to buy any securities or financial instruments or any advice or recommendation with respect to such securities or other financial instruments. 40
You can also read