HSBC Kapitalmärkte Kompakt Performance trotz(t) Unsicherheit - HSBC Global Asset ...

Page created by Shawn Jenkins
 
CONTINUE READING
HSBC Kapitalmärkte Kompakt Performance trotz(t) Unsicherheit - HSBC Global Asset ...
HSBC Kapitalmärkte Kompakt
Performance trotz(t) Unsicherheit
17. Januar 2020

                                                   Dieses Dokument inkl. aller enthaltenen
                                    Informationen ist nicht für Kleinanleger (Privatkunden)
                                                i. S. d. Artikels 4 Abs. 1 (11) der Richtlinie
                                       2014/65/EU bestimmt und darf weder ganz noch in
                                                   Teilen an diese weitergegeben werden.
HSBC Kapitalmärkte Kompakt Performance trotz(t) Unsicherheit - HSBC Global Asset ...
Performance trotz(t) Unsicherheit

                                                                                                                          Dr. Axel Cron
                                                                                                                          Chief Investment Officer

Dieses Webinar liefert einen Überblick über das wirtschaftliche Umfeld und dient ausschließlich Marketingzwecken. Die Angaben stellen in keiner Weise eine
Finanzanalyse, Anlageberatung bzw. eine Kauf- oder Verkaufsempfehlung dar. Die Angaben wurden nicht in Einklang mit den Rechtsvorschriften zur
Förderung der Unabhängigkeit von Finanzanalysen erstellt und unterliegen auch keinem Verbot des Handels im Anschluss an die Verbreitung von
Finanzanalysen.
HSBC Kapitalmärkte Kompakt Performance trotz(t) Unsicherheit - HSBC Global Asset ...
Das Zeitalter der Unsicherheit
Signifikanter Anstieg der Verunsicherung

 Index level
                                                                       Global Economic Policy Uncertainty Index (3m avg)
350

300

                                                                                                                           US presidential
                                                                                                                           election
250                                                                                                     Sovereign debt crisis
                                                                                                        in Europe and US
                                                                                                        fiscal cliff
                               9/11                                                 Lehman brothers
200                            terrorist                         Iraq war           and global                      Brexit referendum
                               attack                            and                markets turmoil
                                                                 outbreak
               Asia                                              of SARS
150            crisis
                                                                        Financial
                                                                        credit
                                                                        crunch
100

                                                                                                                                             US-China Trade
  50                                                                                                                                         tensions

    -
        1997            1999               2001          2003       2005            2007       2009     2011          2013          2015      2017        2019

Source: Bloomberg, HSBC Global Asset Management, November 2019

                                                                                           3
HSBC Kapitalmärkte Kompakt Performance trotz(t) Unsicherheit - HSBC Global Asset ...
2019 – Ein Ausnahmejahr
Performance 2019 und seit 2010

  USD Total Returns
40%

30%                 Since 2010 (annualised)        2019

20%

10%

  0%

-10%

-20%

                           Government Bonds                              Corporate Bonds                       EM Debt                            Equity                                Other Asset Classes

-30%
          US Cash      US Treasuries   Global Bonds Global ILBs (H) Global IG Credit   Global HY    USD EM Debt Local EM Debt   US Equities   Global Equities   EM Equities   WTI Oil        Gold        US Dollar
                                           (H)                            (H)          Credit (H)

Source: Bloomberg, HSBC Global Asset Management, 30 December 2019. Any performance information shown refers to the past and should not be seen as an indication of future returns.

                                                                                                           4
HSBC Kapitalmärkte Kompakt Performance trotz(t) Unsicherheit - HSBC Global Asset ...
Performance trotz(t) Unsicherheit
Mögliche Erklärungsversuche (I)

Source: Bloomberg, Macrobond, HSBC Global Asset Management, 31 October 2019. Any views expressed were held at the time of preparation and are subject to change without notice. Any forecast, projection or target where provided is
indicative only and is not guaranteed in any way.

                                                                                                                    5
HSBC Kapitalmärkte Kompakt Performance trotz(t) Unsicherheit - HSBC Global Asset ...
Performance trotz(t) Unsicherheit
Mögliche Erklärungsversuche (II)

 Quarterly
 change                                         Global HY spread                                      DM equities earnings yield                                        EM equities earnings yield

 2,0%

 1,5%

 1,0%

 0,5%

 0,0%

-0,5%
                                2018 Q1                                                2018 Q2                                                2018 Q3                                                2018 Q4

Source: Bloomberg, Macrobond, HSBC Global Asset Management, 31 October 2019. Any views expressed were held at the time of preparation and are subject to change without notice. Any forecast, projection or target where provided is
indicative only and is not guaranteed in any way.

                                                                                                                    6
HSBC Kapitalmärkte Kompakt Performance trotz(t) Unsicherheit - HSBC Global Asset ...
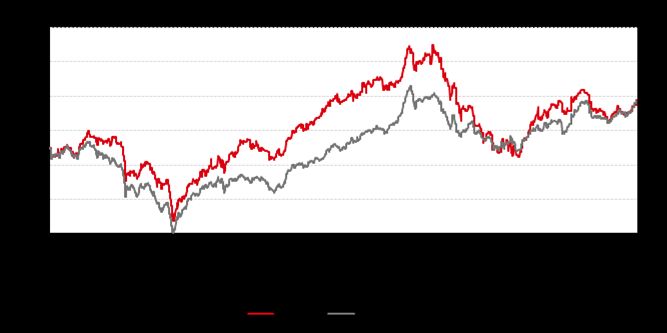
Performance trotz(t) Unsicherheit
Mögliche Erklärungsversuche (III)

Source: HSBC Global Asset Management, November 2019   7
Performance trotz(t) Unsicherheit
Mögliche Erklärungsversuche (IV)

                                                          Near 40-year low

Source: HSBC Global Asset Management, November 2019   8
2020 – Perspektiven

                      9
Was “diskontiert” der Markt?
Pessimismus im Hinblick auf Wachstum und Inflation

   Index                                                                                                         Index
                                         Market-implied
                                        AMG             Growth
                                            Market-implied Growth                                                                 Market-implied
                                                                                                                                 AMG             Inflation
                                                                                                                                     Market-implied   Inflation

 106                                                                                                            100

                  Phantom               Goldilocks                  Back to        Age of
 104                                                                               uncertainty -                 99
                   recession                                         reality
                                                                                   Recession
                                                                                   worries
 102                                                                                                             98

 100                                                                                                             97

   98                                                                                                            96

   96                                                                                                            95

   94                                                                                                            94

   92                                                                                                            93

   90                                                                                                            92
     2015              2016               2017               2018               2019                               2015   2016    2017           2018             2019

 *These indicators are the market performance of an equal volatility long-short portfolio of (1) growth asset
 classes against defensive asset classes (implied growth index), and (2) inflation-hedged asset classes
 against inflation-vulnerable asset classes (implied inflation index)
                                                                                                           10
Source: HSBC Global Asset Management, November 2019.
Rezessionsgefahr?
           … obwohl…
Excess return (relative to duration matched US Treasuries),

                                                      10                    CCC Excess Return        B Excess Return            BB Excess Return

                                                              8

                                                              6

                                                              4                                                                                    What’s going on?

                                                              2

                                                              0

                                                              -2
ppts

                                                              -4
                                                               Jan 19   Mrz 19              Mai 19         Jul 19      Sep 19                 Nov 19

            Source: HSBC Global Asset Management, November 2019                                       11
Globales Wachstum – Langsam, aber sicher
Rezession ebenso unwahrscheinlich wie starker Aufschwung

Nowcast (%)

 12,00

 10,00

   8,00

   6,00

   4,00

   2,00

   0,00

  -2,00
              Global            US        Euro Area         Japan            UK          Canada          EM (ex.        Asia ex         China           India         Turkey         Latin           Brazil        Mexico
                                                                                                         China)         Japan                                                       America

                                                                                           Dezember 2017              November 2019

Source: HSBC Global Asset Management, December 2019.
Any views expressed were held at the time of preparation and are subject to change without notice. While any forecast, projection or target where provided is indicative only and not guaranteed in any way. HSBC Global Asset Management
accepts no liability for any failure to meet such forecast, projection or target.                                      12
Die Legende von der Rezession
Die Natur der Zyklen hat sich verändert

                                                                                                          Growth
     Australia 1992-today                                                          107

      Australia 1962-1982                                                   83

            UK 1956-1974                                               71                                   Old cycle   New cycle

                                                                                              Expansion
        France 1975-1993                                               70

            US 1991-2008                                           67

                 .
            UK 1992-2008
                .                                                 64
                 .

                                                                                              Recession

           US 2010-today                                41

                            0        20        40        60         80       100       120
                       Expansion = no. of consecutive quarters of positive yoy real GDP
                                                   growth
Quelle: Bloomberg, HSBC Global Asset Management, Dezember 2019.

                                                                                             13
Globale Inflation
Unter Ziel

 1,0    pp deviation in y/y inflation from target

                                                      2% target                    2.5% target

 0,5

 0,0

-0,5

-1,0

-1,5

                                         Latest core inflation
-2,0
                                                                                                             3% to 4.5% target

-2,5
             US              Can              UK            EZ    Kor   Jpn         Aus          Tha   Mex          ZAF          Bra   Chn

Source: HSBC Global Asset Management, November 2019                           14
Geldpolitik (II)
„Repo-Calypse Now“

                                              28,00                                          120,00
                                                                                                                                 3

                                              26,00
                                                                                             100,00
 Central Banks - Balance Sheets as % of GDP

                                                                                                                                2,5
                                              24,00

                                              22,00                                          80,00

                                                                                                           US Excess Reserves
                                                                                                                                 2

                                              20,00
                                                                                             60,00
                                              18,00                                                                             1,5

                                              16,00                                          40,00
                                                                                                                                 1
                                              14,00
                                                                                             20,00
                                              12,00                                                                             0,5

                                              10,00                                          0,00

                                                                                                                                 0

                                                      Federal Reserve Balance Sheet

                                                      European Central Bank Balance (rhs)

                                                      Bank of Japan Balance Sheet as (rhs)                                            Required Reserves (trn USD)
Quelle: Bloomberg, HSBC Global Asset Management, Dezember 2019.
                                                                                                                                      Reserves including Vault Cash (trn USD)

                                                                                                      15
Globale Fiskalpolitik
Zunehmend unterstützend

Source: HSBC Global Asset Management, November 2019.

Any views expressed were held at the time of preparation and are subject to change without notice. While any forecast, projection or target where provided is indicative only and not guaranteed in any way. HSBC Global
                                                                                                              16
Asset Management accepts no liability for any failure to meet such forecast, projection or target.
Unternehmen – Gewinne
Einstelliges Wachstum in Sicht

  %                                                                              World ex US consensus EPS growth forecast
 30
                                                                                 US consensus EPS growth forecast

 25

 20

                                                                                                                                                              2018
 15                                                                                                                            2017

 10

                                                                                                                                                                                        2020
   5                                                                         2014

                       2012                            2013
   0
                                                                                                                                                                                               2019
                                                                                                     2015
  -5                                                                                                                           2016

-10
    2012                    2013                     2014                    2015                    2016                   2017                    2018                    2019

Source: HSBC Global Asset Management, November 2019.
This chart tracks the live calendar year earnings growth expectations and shows the growth rate between the latest calendar year-end EPS estimate and the previous year-end trailing EPS.
Note: for 2020 growth rates we proxy year-end 2019 trailing earnings growth with the latest 2019 expectations

                                                                                                                   17
Unternehmen – Gewinne
Talsohle durchschritten?

                                                   Trailing earnings growth (qoq, local terms) vs 3m ago
Source: HSBC Global Asset Management, Nov. 2019.

                                                                          18
Langfristige Rendite- / Risikoprofile

                     10%
                                Aktien
                     9%
                                Anleihen (Industrieländer)
                                Anleihen (Emerging Markets)                                 Frontier Equity (8,2%)                                                                        Private Equity (8,4%)
                                Anleihen (Unternehmen)                                                                                              EM Equity (8,1%)
                     8%
                                Alternative Anlageklassen                                                                                             Asia ex Japan Equity (7,6%)
                     7%
                                                    Local EMD (6,6%)                                             Japan Equity (6,4%)

                     6%                                                         US Equity (5,6%)
                                                                                                                               Eurozone Equity (5,9%)
                                          Asia Local Bonds (5,3%)
                     5%                                                                        DM Equity (5,7%)
 Erwartete Rendite

                                                                                  Commodities (4,4%)

                     4%                                         Asia HY (4,3%)
                                                                                          Hedge Funds (3,5%)
                     3%
                                                          US HY (2,1%)
                     2%                                                      EMD Hard Currency (1,7%)
                                      Lev Loans (1,4%)
                                                                EUR HY (1,6%)
                     1%           EUR IG (0,6%) Asia IG (1,4%)
                                                 US IG (0,6%)
                     0% US 2y Treasuries (0,4%)
                          US 10y Treasuries (-0,3%)       Japanese JGBs (-0,6%)
                     -1%
                                      German Bunds (-1,1%)
                     -2%

                     -3%
                           0%                5%                        10%                         15%                             20%                            25%                           30%
                                                                                                 Erwartete Volatilität
 Prognosen und Zielvorgaben sind rein indikativ und in keiner Weise garantiert. Quelle: HSBC Global Asset Management. In EUR. ASIA HY, ASIA IG, EMD Hard Currency, Japanese JGBs, US HY, US IG, 2y US Treasuries, 10y
 US Treasuries und Lev Loans in EUR hedged. Alle anderen Assetklassen unhedged. Stand Januar 2020.

                                                                                                          19
Zusammenfassung

                                              Valuation signals                            Business cycle signals                                               Macro regime                                         Market signals
                                                                                                         Leading
                                                                         Nowcast               Nowcast                       Inflation                                                                       Time Series     Market narratives &
                                             vs 3m ago    vs 12m ago                 vs 3m             nowcast (3m                               Monetary bias                       Fiscal bias
                                                                         (3m avg)             momentum                         model                                                                          Momentum           sentiment
                                                                                                          ahead)
             Global Bonds                       p              q                                                                                                                                                pp
             Global Credit IG                   p              q                                                                                                                                                pp           "Top of mind" themes:
  World

             Global Credit HY
                                                                           2.3                                                                                                                              pp
                                                                                                                                                                                                                            Trade truce, Fed policy
                                                                                                                                                                                                                                and macro data
             Global Equities                                                                                                                                                                                    pp
             US 10y Treasuries                  p              q                                                                                                                                                pp         Sentiment has improves
                                                                                                                                         Muted inflation pressures and
             US IG Credit                       p              q                                                                2.0        downside risks to growth         2018/19 fiscal boost fading.        pp                since August
                                                                                                               
  US

                                                                           2.6                                                                                                                                             "Fed on hold" and "repo"
             US HY Credit                                                                                                      rising     make "insurance" rate cuts        No meaningful plans for 2020
                                                                                                                                                                                                                pp            narratives dominate
                                                                                                                                                      likely
             US Equity                                                                                                                                                                                          pp           news, but less central

             Germany 10y Gov't Bond             p                                                                                             The ECB delivered a                                               pp
                                                                                                                                         substantial easing package. It                                                     Increased focus on ECB
  Eurozone

             Eurozone IG Corporate Bonds        p                                                                               1.2       also now expects to maintain                                          pp         policy actions. "Italy" is a
                                                                           0.0                                             stable    rates at current or lower levels
                                                                                                                                                                                    Modest easing
                                                                                                                                                                                                                pp         highly negative narrative,
             EUR HY
                                                                                                                                             until core inflation trend                                                          but not central
             Eurozone Equities                                                                                                                       improves                                                   pp
             UK 10y Gov't Bond                  p                                                                                           BoE has acknowledged                                                pp         Sentiment is being pulled
                                                                                                                                          increased downside risks to
                                                p                                                                                                                                                           pp
  UK

             UK IG Corporate Bonds                                         -0.9                                                 2.0                                                  Bias to ease                               down by Brexit
                                                                                                                                               growth. Policy path
                                                                                                                                                                                                                                 uncertainties
             UK Equities                                                                                                       stable          dependent on Brexit                                              pp
                                                               q                                                                                                                                                pp
  Japan

             Japan 10y Gov't Bond                                                                                               0.7                                         VAT hike to be offset by other
                                                                           -0.4                                          declining
                                                                                                                                               Unchanged/easing
                                                                                                                                                                                      measures
                                                                                                                                                                                                                pp
             Japan Equity
                                                                                                                                                                                                                pp
Emerging

             Local EM Debt
 Markets

                                                                                                                                                                                                                             EM sentiment has
                                                                                                                                          Lower US rates allows EM          Loosening across a range of
             USD EM Sovereign Bond                                         1.7                                                              policy easing                       economies                   pp         improved following news
                                                                                                                                                                                                                               of a "trade truce"
             EM Equity                                                                                                                                                                                          p
             Asia Local Bonds                   p                                                                                                                                                               pp
                                                p              q                                                                          Lower US rates and bias to                                            pp
  Asia

             Asia IG                                                                                                                                                        Loosening across a range of
                                                p
                                                                           4.8                                                        ease in China allows looser
                                                                                                                                                                                    economies
                                                                                                                                                                                                                pp
             Asia HY                                                                                                                               EM policy
             Asia ex Japan Equity                                                                                                                                                                               p
              As of December 2019. Source: HSBC Global Asset Management. Note: Nowcast vs 3m arrows signal when there is a change in the 3m average Nowcast number that is greater than 0.15% versus 3m ago;
              Nowcast momentum is looking at momentum over a 6, 9 and 12m period and giving an overall positive or negative score;

                                                                                                                          20
Frontier Markets

                   Martin Bechtloff
                   Sales Manager
                   Wholesale Business / Insurance & IFA/IAM
Frontier Märkte
schnelle Wachstumsraten und niedrige Einkommen

BIP pro Kopf                                                                                                                   BIP-Wachstum pro Kopf
(USD, Tsd.)                                                                                                                    (2002-2017, annualisiert)
                                                                                                                                               0%             5%     10%              15%
                                                                                                                                      China
35                                                                                                                                 Vietnam
                                                                                                                               Kazakhstan
                                                                                                                                  Romania
                                                                                                                                 Argentina
30                                                                                                                                   Russia
                                                                                                                                 Indonesia
                                                                                                                                 Sri Lanka
                                                                                                                                       India
25                                                                                                                             Bangladesh
                                                                                                                                     Kenya
                                                                                                                                      Brazil
                                                                                                                                       Chile
20                                                                                                                                     Peru
                                                                                                                                     Jordan
                                                                                                                                  Thailand
                                                                                                                                Philippines
                                                                                                                                     Turkey
15                                                                                                                                  Nigeria
                                                                                                                                      Egypt
                                                                                                                                  Pakistan
                                                                                                                                 Colombia
10                                                                                                                                   Serbia
                                                                                                                                    Poland
                                                                                                                               South Africa
                                                                                                                                  Mauritius
5                                                                                                                                 Malaysia
                                                                                                                                  Morocco
                                                                                                                                  Lebanon
                                                                                                                                      Oman
0                                                                                                                                   Croatia
                                                                                                                                  Hungary
        Slowenien

             Oman

            Ungarn

        Rumänien

          Brasilien
         Jordanien
             Kuwait

     Griechenland
               VAE

            Litauen

               Chile

         Südafrika
           Serbien

          Marokko

           Ägypten
        Kolumbien
         Sri Lanka
          Thailand

               Peru
           Bahrain

      Tschechien

          Mauritius
             Korea

          Tunesien
            Mexiko

          Malaysia

         Russland
           Vietnam

              China

       Indonesien
              Katar

           Kroatien

           Libanon
            Estland

      Argentinien

              Polen

            Nigeria
       Philippinen
              Kenia
             Türkei

      Kasachstan

     Bangladesch
                                                                                                                                      Qatar
                                                                                                                                   Bahrain
                                                                                                                                     Kuwait
                                                                                                                                    Tunisia
                                                                                                                                    Mexico
                                                                                                                                       UAE

                              Schwellenmärkte 2000                                    Frontier Märkte 2017                                     Frontier markets    Emerging markets

Quelle: HSBC Global Asset Management, International Monetary Fund, World Economic Outlook Database Schätzungen, Oktober 2017
Nur zu illustrativen Zwecken geeignet.

                                                                                                             22
Umfassendes Anlageuniversum
Global diversifiziertes Engagement in rund 30 Frontier Markets¹

                                                                                                           Litauen             Estland
                                                                                                          Kroatien
                                                                                                        Slowenien

                                                                                                                                                           Kasachstan

                                                                                                                                  Rumänien
                                                                                     Serbien
                                                                                                                                    Libanon
                                                                                   Tunesien
                                                                                                                                           Kuwait           Pakistan
                                                                                    Marokko
                                                                                                                                                                                                Vietnam
                                                                                    Ägypten
                                                                                  Jordanien
                                                                                                                                                    Oman
                                                                                    Senegal                                                                                                     Philippinen
                                                                             Guinea Bissau
                                            Kolumbien                                          Mali                                             VAE
                                                                                      Elfenbeinküste                                            Qatar
                                                                                         Burkina Faso                                           Bahrain
                                                                                                  Togo                                          Kenia                  Bangladesch
                                                  Peru
                                                                                                      Benin                                                        Sri Lanka
     Sub-Saharan Africa (11)                                                                                                                        Mauritius
                                                                                                       Nigeria
     Latin America (3)
                                                                                                              Niger
     Asia-Pacific (5)                                                         Argentinien

     Europe (7)

     MENA (10)

     Potential ‘off-benchmark’ (numerous)

1.   Unser hauseigener Referenzindex beinhaltet 36 Länder, wie in dieser Grafik abgebildet. Als aktive Strategie können jedoch Abweichungen in Bezug auf die gehaltenen Länder bestehen sowie nicht in der Benchmark enthaltene Frontier-
     Märkte im Portfolio vertreten sein. Sie werden in der Abbildung nicht gezeigt (darunter Kambodscha, Georgien).
Quelle: HSBC Global Asset Management, Dezember 2019. Nur zu illustrativen Zwecken.
                                                                                                                      23
Vorteile der Diversifikation

  Volatilität der Assetklassen                                                                                                                                                           Renditen der Assetklassen
  (Monatliche Basis, 10 Jahre bis Oktober 2019)                                                                                                                                          (Annualisiert, 10 Jahre bis Oktober 2019)

          Schwellenmärkte                                                                                                                                                 17,09%         Schwellenmärkte                3,78%

                  Frontier Märkte                                                                                                     12,30%                                              Frontier Märkte                   4,00%

                                                 0%        2%            4%            6%           8%            10%        12%              14%       16%               18%                               0%   2%    4%           6%   8%   10%

  Volatilität                                                                                                                                                                            Korrelation
  (1 Jahr, wöchentliche Renditen)                                                                                                                                                        (6 Jahre, wöchentliche Renditen)

   50%

   40%

   30%

   20%

   10%

    0%
         Jan 08

                               Mai 09

                                        Jan 10

                                                           Mai 11

                                                                    Jan 12

                                                                                       Mai 13

                                                                                                Jan 14

                                                                                                                   Mai 15

                                                                                                                            Jan 16

                                                                                                                                               Mai 17

                                                                                                                                                        Jan 18

                                                                                                                                                                           Mai 19
                    Sep 08

                                                  Sep 10

                                                                              Sep 12

                                                                                                         Sep 14

                                                                                                                                     Sep 16

                                                                                                                                                                 Sep 18

                             Frontier Märkte                                    Schwellenmärkte                                       Entwickelte Märkte

Die hier gezeigten Informationen beziehen sich auf Performance in der Vergangenheit und sollten nicht als Indikator für zukünfitge Renditen angesehen warden.
Quelle: HSBC Global Asset Management, Bloomberg zu Oktober 2019. Monatliche Daten von Oktober 2009 bis Oktober 2019. Frontier Märkte: MSCI Frontier Markets Daily TR Net USD; Schwellenmärkte: MSCI Emerging Markets Daily TR
Net USD. Die gezeigten Daten dienen nur der Veranschaulichung und nicht der Indikation zukünftiger Performance.

                                                                                                                                                                                    24
HSBC GIF Frontier Markets
Fondsüberblick

 Fondsdetails
 Fondsmanager                             Ramzi Sidaní                                                                     Benchmark                MSCI Select Frontier & Emerging
                                          Lead/Co-Portfoliomanager                                                                                  Markets Capped Net
                                           10 Jahre Branchenerfahrung
                                                                                                                           Morningstar-Kategorie    Aktien Global Frontier Markt
                                           Seit 2016 bei HSBC
                                                                                                                           -Titelanzahl            50-70 Aktien
 Auflegungsdatum                          Februar 2008
                                                                                                                           Aktiengewichtung         maximal 10% pro Aktie
 Basiswährung                             USD                                                                              Ländergewichtung         maximal 15% pro Land
 Geschäftsjahres-ende                     31. März                                                                         Off-Benchmark- Positionen keine Einschränkungen
 Fondsvolumen                             277 Mio. USD                                                                     Kasse                    0-5%

  Investmentgründe

  Bietet Zugang zu aufstrebenden Frontier- Markets-Märkten
  Outperformance der Benchmark
  Niedrige Korrelation der Frontier Markets im Vergleich zu anderen Märkten nutzen
  HSBCs Reputation und langjährige Erfahrung in aufstrebenden Märkten
  Bei Morningstar über 1 Monat, YTD und über 1 Jahr im ersten Quartil. Im zweiten Quartil über 3 und 5 Jahre1

Quelle: HSBC Global Asset Management. Stand: 31.12.2019. 1Bezieht sich auf die I-Anteilklasse, Quelle: Morningstar.
Zielvorgaben sind rein indikativ und in keiner Weise garantiert.
                                                                                                                      25
HSBC GIF Frontier Markets
Performance und Kosten

Nettowertentwicklung der IC-Anteilklasse in USD (%)
                                                                                                                                                                          Risiko- und Ertragsprofil1
                                                                                                                                                                          Geringeres Risiko                                  Höheres Risiko
                                                                                                                                                                          Typischerweise geringere                     Typischerweise höhere
                                                                                                                                                                          Rendite                                                    Rendite

                                                                                                                                                                          1         2         3         4         5         6         7

                                                                                                                                                                          Anteil-       ISIN                  Ausgabe-          Laufende
                                                                                                                                                                          klasse                              aufschlag         Kosten

                                                                                                                                                                          AC            LU0666199749          Max. 5,00%        2,25% p. a.

                                                                                                                                                                          ACEUR         LU0708055370          Max. 5,00%        2,25% p. a.

                                                                                                                                                                          AD            LU0666200265          Max. 5,00%        2,25% p. a.

                                                                                                                                                                          ADEUR         LU0717916968          Max. 5,00%        2,25% p. a.

                                                                                                                                                                          IC            LU0666200349          Max. 5,00%        1,65% p. a.

                                                                                                                                                                          ICEUR         LU0708055537          Max. 5,00%        1,65% p. a.

                                                                                                                                                                          ID            LU0666200695          Max. 5,00%        1,65% p. a.

                                                                                                                                                                          IDEUR         LU0717918238          Max. 5,00%        1,65% p. a.

                                                                                                                                                                          XC            LU0666200935          Max. 5,00%        1,30% p. a.

                                                                                                                                                                          XD            LU0666201156          Max. 5,00%        1,30% p. a.

                                                                                                                                                                          Eine Aufstellung der Risiken finden Sie im
Quelle: HSBC Global Asset Management. Nettoperformance in USD per 31.12.2019.                                                                                             Kapitel Weiterführende Informationen.

Die Wertentwicklung in der Vergangenheit ist kein verlässlicher Indikator für die zukünftige Wertentwicklung. Die dargestellte Wertentwicklung basiert auf Netto-
Inventarwerten, weitere Gebühren (soweit diese anfallen) sind in der Darstellung nicht berücksichtigt und wirken sich negativ auf die Wertentwicklung der Anlage aus. 1SRRI (Synthetischer Risiko- und Ertragsindikator) Dieser Indikator beruht
auf historischen Daten; eine Vorhersage künftiger Entwicklungen ist damit nicht möglich. Die Einstufung des Fonds kann sich künftig ändern und stellt keine Garantie dar. Auch ein Fonds, der in Kategorie 1 eingestuft wird, stellt keine völlig
risikolose Anlage dar.
                                                                                                                        26
HSBC GIF Frontier Markets
Länder- und Sektorenallokation – Dezember 2019

Ländergewichtungen (%)                                                                                                   Sektorengewichtungen (%)

                 Kuwait                                                                                     14,4
                                                                                                                                  Finanzsektor                                                     52,2
                  Egypt                                                                             12,6
    United Arab Emirates                                                                10,2                                    Industriesektor                        10,6
             Philippines                                                                10,1
                Bahrain                                                      7,5                                             Basiskonsumgüter                          9,9
                  Kenya                                                6,2
                Vietnam                                              5,8                                                 Zyklische Konsumgüter                    8,5

            Kazakhstan                                         5,1
                                                                                                                                    Immobilien                    8,2
               Romania                                       4,6
              Colombia                                 3,8
                                                                                                                                Kommunikation               3,9
                  Qatar                            3,5
                Georgia                           3,4
                                                                                                                                    Werkstoffe          2,6
                   Peru                          3,0
               Mauritius                   2,1                                                                               Gesundheitssektor         1,8
                 Nigeria                 1,9
               Morocco                   1,8                                                                                     Energiesektor        0,5
                  [Cash]             1,4
            Bangladesh          1,0                                                                                                         IT        0,4

              Argentina         0,9
                                                                                                                                     Versorger        0,0
               Slovenia        0,6

                           0         2             4               6         8     10          12      14          16                             0               10          20   30   40    50          60
Quelle: HSBC Global Asset Management, MSCI zum 31. Dezember 2019.
Als Referenzindex dient der MSCI Select Frontier & Emerging Markets Capped Index. Diese Benchmark dient lediglich der Orientierung und ist in keener Weise garantiert. HSBC Global Asset Management (UK) übernimmt
keine Verantwortung für den Fall, dass die Benchmark nicht outperformt wird.
.

                                                                                                                        27
Zusammenfassung

         Umfassendes                        Wandel   Verbraucher   Rohstoffreichtum   Korrelationen   Barrenditen   Überzeugende
      Anlageuniversum                                                                                                Bewertungen

         1                              2            3               4                5               6             7

Quelle: HSBC Global Asset Management.
Nur zu illustrativen Zwecken.

                                                                         28
Treffen Sie unseren Fondsmanager persönlich
auf dem Mannheimer Fondskongress 2020

“Frontier Markets – ein Markt für sich?”
Wann:    Mittwoch, 29.01.2020
         um 14.15 UHR
Wo:      Saal 8

                                              Ramzi Sidani
                                              Fondsmanager
                                              HSBC GIF Frontier Markets
Präsentation
E-Mail an fonds@hsbc.de
www.assetmanagement.hsbc.de/de

Unser nächstes
Kapitalmarkt-Webinar:

14. Februar 2020

                                 30
Anhang
HSBC GIF Frontier Markets
Fondsüberblick

                             Anlageziel                                                              Anlagestrategie          Fondsdetails
  Erzielung einer Outperformance                                              Ausnutzung der Ineffizienzen der Frontier     Fondsmanager       Ramzi Sidaní
   gegenüber dem MSCI Select Frontier &                                         Markets durch Konstruktion eines                                 Lead/Co-
   Emerging Markets Capped Index                                                diversifizierten Portfolios von attraktiven                      Portfoliomanager
  Exposure zu Ländern, die durch globale                                       Investmentideen                                                   10 Jahre
   Emerging-Markets-Equity-Strategien                                          Fundamentales Research als Basis für                               Branchenerfahrung
   nicht abgedeckt werden                                                       die Investitionsentscheidung                                      Seit 2016 bei HSBC
                                                                               Erzielung langfristiger Erträge durch         Auflegungsdatum    Februar 2008
                                                                                Aktien mit guten Cash Flows
                                                                                                                              Basiswährung       USD
                                                                                                                              Geschäftsjahres-   31. März
                                                                                                                              ende
                                                                                                                              Fondsvolumen       277 Mio. USD
                        Investmentteam                                                              Investmentgründe
                                                                                                                              Benchmark          MSCI Select Frontier &
  Team aus zwei erfahrenen Frontier-                                          Bietet Zugang zu aufstrebenden Frontier-                         Emerging Markets
   Markets-Portfoliomanagern mit                                                Markets-Märkten                                                  Capped Net
   durchschnittlich 14 Jahren                                                  Outperformance der Benchmark
   Branchenerfahrung                                                                                                          Morningstar-       Aktien Global Frontier
                                                                               Niedrige Korrelation der Frontier Markets
  Unterstützt durch das Emerging-                                                                                            Kategorie          Markt
                                                                                im Vergleich zu anderen Märkten nutzen
   Markets-Team der HSBC                                                       HSBCs Reputation und langjährige              Titelanzahl        50-70 Aktien
                                                                                Erfahrung in aufstrebenden Märkten
                                                                               Bei Morningstar über 1 Monat, YTD und         Aktiengewichtung   maximal 10% pro Aktie
                                                                                über 1 Jahr im ersten Quartil. Im zweiten     Ländergewichtung   maximal 15% pro Land
                                                                                Quartil über 3 und 5 Jahre1
                                                                                                                              Off-Benchmark-     keine Einschränkungen
                                                                                                                              Positionen
Quelle: HSBC Global Asset Management. Stand: 31.12.2019. 1Bezieht sich auf die I-Anteilklasse, Quelle: Morningstar.           Kasse              0-5%
Zielvorgaben sind rein indikativ und in keiner Weise garantiert.
                                                                                                                      32
Risiken

Diese Fonds sind nicht für jeden Anleger geeignet. Es ist möglich, dass der Anleger bei Investment in diese Fonds einen
Verlust, auch bis zur Höhe seines gesamten Investments, erleidet.
Für den Fonds/die Strategie werden Anlagen in Schwellenländern getätigt. Diese sind risikoreich, weil sie eine volatile Wertentwicklung
aufweisen und über eine geringe Liquidität verfügen können. Bei Investitionen in Schwellenländer können zudem politische,
Glattstellungs-, Liquiditäts-, Devisen- und Verwahrungsrisiken sowie Risiken in Bezug auf die Rechnungslegungsstandards bestehen.
Aufgrund der Konzentration auf wenige Märkte/Wertpapiere hat der Fonds/die Strategie einen geringeren Diversifikationsgrad und damit
ein höheres Risiko. Der Anteilwert von Aktienfonds/Aktienstrategien kann relativ stark schwanken, auch Kursverluste sind möglich. Der
Fonds/die Strategie tätigt auch Anlagen in kleine Unternehmen. Diese können weniger liquide sein als Anlagen in große Unternehmen
und eine erhöhte Volatilität aufweisen. Daher weisen solche Anlagen ein höheres Risiko auf. Der Fonds/die Strategie kann unter anderem
zu Zwecken der Ertragssteigerung in derivative Finanzinstrumente investieren. Derivate können zu einer wesentlich höheren
Schwankung des Anteilpreises führen als der unmittelbare Erwerb der Basiswerte. Der Fonds/die Strategie investiert auch in Instrumente,
die in anderen Währungen denominiert sind. Hieraus folgt ein Wechselkursrisiko. Ist die Heimatwährung des Anlegers nicht USD, kann
für ihn hieraus ein zusätzliches Wechselkursrisiko resultieren.
Die ausführlichen Risiken können dem Verkaufsprospekt und den wesentlichen Anlegerinformationen (KIID) entnommen
werden.

                                                                   33
Reduced institutional voids can give rise to productivity gains

                                                High
  Low productivity in frontier markets may                                                                                  High institutional voids in frontier
  be due to underdeveloped:                                                                                                 markets can exist in:
      Policy and institutional structure                         Developed                                                    Capital markets
                                                                   Markets
      Economic infrastructure                                                                                                 Labour markets
      Social infrastructure                                                                                                   Product markets
      Economic institutions                                                                                                   Regulation
                                                                                                                               Contract enforcement

                                             PRODUCTIVITY
  Improvements in these factors may drive                                          Emerging                                 Reduced institutional voids may result in
  productivity growth, resulting in:                                               Markets                                  productivity growth through:
      Increased profits and dividends to                                                     Small reductions in              Development of effective institutional
                                                                                               institutional voids
       shareholders                                                                              can lead to                    mechanisms
                                                                                                    productivity gains
      Better wages and conditions to the                                                             = return
                                                                                                                               Improved regulation
       workforce                                                                                         opportunity
                                                                                                                               Reduced bureaucracy
                                                                                                          for equity
      Lower prices to consumers                                                                            investors          Improvements in communication and
      Increased tax payments to                                                                                                infrastructure
       governments                                                                                         Frontier
                                                                                                           Markets
                                                Low

                                                            Low               INSTITUTIONAL VOIDS                    High

Source: HSBC Global Asset Management.
For illustrative purposes only.

                                                                                  34
HSBC GIF Frontier Markets
Country positioning – December 2019
Supplemental information
Country Weightings (%)                                                                                                           Top & Bottom 5 Country Active Weights1 (%)

                  Kuwait                                                                                        14,4
                                                                                                                                 16
                   Egypt                                                                               12,6
 United Arab Emirates                                                                      10,2
                                                                                                                                 12     11,2
             Philippines                                                                   10,1
                 Bahrain                                                        7,5
                   Kenya                                                  6,2                                                      8
                 Vietnam                                                5,8
            Kazakhstan                                            5,1                                                                               4,0         3,7        3,6           3,4
                                                                                                                                   4
                Romania                                         4,6
              Colombia                                    3,8
                    Qatar                             3,5                                                                          0
                 Georgia                             3,4
                                                                                                                                                                                                   -1,4       -1,6
                    Peru                            3,0
                                                                                                                                  (4)
                Mauritius                     2,1                                                                                                                                                                        -4,3
                  Nigeria                   1,9                                                                                                                                                                                     -6,0
               Morocco                      1,8                                                                                   (8)                                                                                                          -7,3
                   [Cash]               1,4
            Bangladesh              1,0                                                                                          (12)

                                                                                                                                                                 UAE

                                                                                                                                                                                                                                     Qatar
                                                                                                                                                     Kuwait

                                                                                                                                                                                                    Croatia

                                                                                                                                                                                                                          Vietnam
                                                                                                                                                                                         Georgia

                                                                                                                                                                                                               Nigeria

                                                                                                                                                                                                                                                Morocco
                                                                                                                                          Egypt

                                                                                                                                                                            Kazakhstan
              Argentina             0,9
                Slovenia          0,6

                            0           2             4               6         8     10          12      14           16
Source: HSBC Global Asset Management, MSCI as at 31 December 2019.
Reference index is the MSCI Select Frontier & Emerging Markets Capped Index. This reference index is indicative only and is not guaranteed in any way. HSBC Global Asset Management (UK) Limited accepts no liability for
any failure to outperform this reference index.
Information is given for illustrative purposes. Data is supplemental to the GIPS© compliance performance details at the end of this presentation. Characteristics and weightings are for illustrative purposes only, as at the date indicated, and
subject to change without prior notice.

                                                                                                                            35
HSBC GIF Frontier Markets
Sector positioning – December 2019
Supplemental information
Sector Weightings (%)                                                                                                Active Sector Weight1 (%)

                   Financials                                                                    52,2
                                                                                                                     10
                                                                                                                             8,18
                   Industrials                        10,6

                                                                                                                       5                               4,28
           Consumer Staples                           9,9                                                                                                                  3,46           3,15

     Consumer Discretionary                      8,5
                                                                                                                       0
                                                                                                                                                                                                        -0,18
                                                                                                                                                                                                                                  -0,94
                  Real Estate                    8,2                                                                                                                                                                                             -1,86          -2,15        -2,55
                                                                                                                      (5)                                                                                                                                                                 -4,25
    Communication Services                 3,9

                                                                                                                     (10)                                                                                                                                                                           -8,54
                     Materials         2,6

                                                                                                                                                                                                                                                  Real Estate

                                                                                                                                                                                                                                                                              Materials
                                                                                                                              Consumer Discretionary

                                                                                                                                                        Consumer Staples

                                                                                                                                                                                                                                                                                                     Communication Services
                                                                                                                                                                                                         Information Technology
                                                                                                                                                                            Industrials

                                                                                                                                                                                           Financials

                                                                                                                                                                                                                                   Health Care

                                                                                                                                                                                                                                                                                           Energy
                                                                                                                                                                                                                                                                 Utilities
                 Health Care          1,8

                       Energy        0,5

      Information Technology         0,4

                                 0               10          20    30          40          50           60
Source: HSBC Global Asset Management, MSCI as at 31 December 2019.
Reference index is the MSCI Select Frontier & Emerging Markets Capped Index. This reference index is indicative only and is not guaranteed in any way. HSBC Global Asset Management (UK) Limited accepts no liability for
any failure to outperform this reference index. Data is supplemental to the GIPS© compliance performance details at the end of this presentation. Characteristics and weightings are for illustrative purposes only, as at the date
indicated, and subject to change without prior notice.

                                                                                                                36
Comprehensive universe
Sensibly diversified by region and country

 HSBC has devised a customised and proprietary ‘capped’ reference index in tandem with MSCI that reflects our sensibly diversified
     approach to investing in frontier markets globally
  Publicly available                                                                                                                                                    Exclusive to HSBC

                MSCI Frontier Markets                                                         MSCI Frontier Emerging Markets                                                        MSCI Select Frontier & Emerging Markets
                                                                                                                                                                                    Capped¹
                Introduced: 30 November 2007                                                  Introduced: 30 September 2008                                                         Introduced: 30 May 2014
                Back history: from 31 May 2002                                                Back history: from 29 November 2002                                                   Back history: from 27 February 2009
                Number of Countries: 28                                                       Number of Countries: 34                                                               Number of Countries: 36
                Number of Stocks: 95                                                          Number of Stocks: 144                                                                 Number of Stocks: 164

                                                                                                                Africa = 15%
                                  Africa = 23%                                                                                                                                                        Africa = 21%
                                                                                                                Europe = 6%

                                 Europe = 11%                                                                                                                                                         Europe = 8%

                                                                                                                 Asia = 34%
                                   Asia = 19%                                                                                                                                                          Asia = 23%

                                                                                                             Middle East = 23%
                                                                                                                                                                                                   Middle East = 34%
                               Middle East = 47%

                                                                                                           Latin America = 22%
                                                                                                                                                                                                  Latin America = 14%

                Index is heavily concentrated to the Middle                                   Index is heavily concentrated to Asia (34%)                                           Our custom index ensures a broad,
                East, particularly Kuwait (38%)                                               and Latin America (22%)
                                                                                                                                                                                    well-diversified universe.

Source: MSCI, pro-forma weights as of 31 December 2019.
Notes: Africa: Egypt, Ivory Coast, Kenya, Mauritius, Morocco, Nigeria, Senegal, Tunisia; Europe: Bulgaria, Croatia, Estonia, Kazakhstan, Lithuania, Romania, Serbia, Slovenia, Ukraine; Asia: Bangladesh, Pakistan, Philippines, Sri Lanka,
Vietnam; Middle East: Bahrain, Jordan, Kuwait, Lebanon, Oman, Qatar, UAE; Latin America: Argentina, Colombia, Peru.
1.    This index supersedes the previous index (MSCI Frontier Emerging Markets Capped index) which was introduced on 31 May 2009 and with a back history from 29 November 2002.
There is an initial cap of 10% for any country. This gets reset back to 10% every time it breaches 12%. There is also an initial cap of 30% for the combined weight of the 8 crossover countries*. This gets reset back to 40% if it breaches 45%.
The MSCI Select Frontier & Emerging Markets Capped index is maintained and calculated by MSCI. For illustrative purposes only.

                                                                                                                        37
HSBC GIF Frontier Markets
Stock positioning – December 2019 – Supplemental information

Top 10 Portfolio Holdings
8
             7,54

7

6

                                     5,02
5

                                                              3,93                    3,84
4                                                                                                             3,81                    3,78                    3,76

                                                                                                                                                                                      3,20                     3,20

3                                                                                                                                                                                                                                      2,77

2

1

0
    AHLI UNITED BANK NATIONAL BANK                      SAFARICOM                  AGILITY              HUMANSOFT                  BANCO              HALYK SAVINGS                BANCA                  DP WORLD              COMMERCIAL
                       OF KUWAIT                                                                         HOLDING                 DAVIVIENDA               BANK                  TRANSILVANIA                                       BANK

Source: HSBC Global Asset Management, MSCI as at 31 December 2019. For illustrative purposes only and does not constitute any investment recommendation in the above mentioned companies.
Data is supplemental to the GIPS© compliance performance details at the end of this presentation. Characteristics and weightings are for illustrative purposes only, as at the date indicated, and subject to change without prior notice.

                                                                                                                         38
Frontier markets outlook
Regional market outlook

Middle East and North Africa
    The GCC (Gulf Cooperation Council) economies continue undergoing structural change to reduce their reliance on oil and diversify their revenue sources. Indeed, a number of countries
     have already started implementing VAT. Subsidies are slowly being removed and there is a focus on job creation. Fiscal consolidation is leading governments to focus on projects
     strategic to economic growth. The magnitude of future GDP growth will depend on how fast economies are adjusting to this new reality. Most GCC countries still boast high financial
     reserves and we expect the non-energy sector to continue showing positive growth rates.

    The fund continues to have exposure to select countries in the GCC region, mainly due to attractive valuations and sustainable returns but with the added benefit of the markets' US
     dollar pegs and high yields. We currently do not see any risk to the dollar peg in the countries we are invested in and in an environment of global currency concerns, we feel that this link
     to the US currency offers higher earnings visibility.

    The UAE is one of the top five countries in our portfolio in relative weight. Dubai continues to invest in its infrastructure and key projects and the economy’s direct reliance on oil is much
     lower than that of neighbouring countries. Even though the real estate sector is experiencing a slowdown, we find valuations to be very attractive and not reflecting the robustness of the
     companies we are invested in.

    In Qatar, the fund remains underweight on valuation considerations. Even though our underweight position hurt us in 2018, passive flows and not earnings growth were the main reason
     behind the rerating that took place. We find valuations to be in disconnect with the impact the blockade is bringing on to the economy. We currently do not have any exposure to the off-
     index market of Saudi Arabia. The Kingdom will become in 2019 part of the MSCI EM Benchmark. Until then flows will be in the driving scene and fundamentals will become secondary.

    We increased our exposure to Kuwait in 2018 by adding to the companies that we already own and deem to be very attractive. Kuwait has very high financial reserves and the lowest
     fiscal budget breakeven oil price in the GCC at less than USD 60/barrel. We are very encouraged by the increased liquidity in the stock market that we saw in 2018 and we believe the
     government will continue to implement its infrastructure plans. Kuwait is a market that could potentially be upgraded to EM, however, our allocation do not factor this into account. We
     have exited Oman as the fiscal picture is deteriorating. In 2019, we have initiated a position in Bahrain that has operation in GCC and Egypt.

    In North Africa, Egypt is our largest overweight position in the portfolio. We find the currency to be attractively valued and believe that government had taken the difficult but positive
     steps on fiscal reforms. This includes removing subsidies, modifying VAT, and making the investment climate more investor friendly. We believe this is very positive for long-term growth
     in the country. We see valuations to be attractive and our investments in the country represent a very diversified set of sectors. We see inflation reducing in 2019 and the country should
     start reaping the benefits of lower interest rates and higher local gas production.

    In Morocco, we continue to be underweight due to unattractive valuations. However, market liquidity has improved over the past few quarters, presenting us with possible new
     investment opportunities, once valuations move to a more compelling level.

    We continue to have no exposure to Tunisia, Jordan and Lebanon due to high valuations or low liquidity and political worries.

Any forecast, projection or target when provided is indicative only and is not guaranteed in any way.
The views expressed above were held at the time of preparation and are subject to change without notice.

                                                                                                           39
Frontier markets outlook
Regional market outlook

Asia
    We currently do not hold any companies in Pakistan. We have reduced our exposure to Pakistan in the run-up to the MSCI reclassification in May 2017 as its valuation reached our
     level of fair value. Pakistan has approached the IMF in Q3 2018 and we await to see green shoots in the economy before investing. We would also like to see reforms being enacted to
     reduce circular debt levels, subsidies and enhance the tax base. We continue to believe that there are many well-run companies with excellent disclosure and a reasonable valuation
     however, the macro challenges weigh on our investment decision. The China Pakistan Economic Corridor (CPEC), an investment program of USD46 billion, will transform the country’s
     infrastructure and alleviate the power shortage.

    The Philippines economy continues to perform well and inflation after peaking in 2018 has been declining in 2019 opening the door for a possible rate cut. Lower oil prices should act as
     a boon to inflation and will alleviate the mounting pressure on the Peso. The country continues to benefit from strong remittances and BPO earnings. We expect infrastructure spending
     to continue growing in 2019 and expect the private sector to play a more important role in funding these projects. The fund’s largest relative weight is to a supermarket chain that should
     continue to benefit from positive consumption trends, and also to the largest port operator in the country. We have been increasing our investments in the Philippines and believe the
     economy in 2020 should be stronger.

    The fund has exposure to select holdings in Vietnam. Access remains restricted by foreign ownership limits (FOL) and low levels of liquidity. We struggle to find attractively valued
     companies that have FOL availability. We expect FOL is to continue to rise and new investment opportunities to arise as more Vietnamese companies IPO. We are constructive on
     Vietnam from a top-down standpoint as more manufacturing jobs move from China to Vietnam.

    We increased our exposure to Bangladesh in 2017 after identifying a couple of fundamentally strong companies that were trading at attractive levels. The country continues to witness
     one of the highest GDP growth rates in Asia. In 2018, as our holdings approached their fair value, we started taking profits. We are more cautious on the currency given it is
     approaching pricey levels. We continue to stick to our disciplined investment process and are actively looking at new opportunities in the country.

Any forecast, projection or target when provided is indicative only and is not guaranteed in any way.
The views expressed above were held at the time of preparation and are subject to change without notice.

                                                                                                           40
Frontier markets outlook
Regional market outlook

Latin America
    After two years of anaemic economic growth in Colombia, we are seeing corporate profitability improving in 2019 with a continuation in 2020. Corporates have adjusted well to the peso
     depreciation triggered by the fall in the oil price in the period 2015-2016 and growth is picking-up in 2019-2020, driven by investments in infrastructure and improved confidence.

    We are underweight Peru relative to the reference index. The macro story remains supportive, however we would like to see lower political uncertainty before considering increasing our
     exposure. Rising metals output (particularly copper) is providing a boost to economic activity.

    We are underweight Argentina due to very low visibility on the new administration’s economic plan. Unfortunately we see 2020 to be another tough year for the country with GDP
     shrinking for the 3rd consecutive year. Our current holdings in Argentina either derive very little revenue from the domestic country or are developing the oil resources of the country and
     thus will be eventually an exporter. We would like to see inflation on a downward trend, interest rates normalizing and the currency stabilizing for a prolonged period before we turn
     positive on the country.

Eastern Europe
    The fund’s exposure to Eastern Europe remains relatively high. We are neutral on Romania. We fear that the government will penalize the corporate sector in order to fund its higher
     fiscal deficit. Even though the economy delivered strong GDP growth 2018, we see 2019 & 2020 delivering a slower growth with higher taxes as the main talking point.

    Kazakhstan has seen currency stability after a series of devaluations. We have exposure to Halyk Bank, the country’s largest bank, which has maintained its strong capital position and
     profitability. The bank has acquired one of its largest rivals and improved its leading position in the markets. We also own a copper mine operator.

Any forecast, projection or target when provided is indicative only and is not guaranteed in any way.
The views expressed above were held at the time of preparation and are subject to change without notice.

                                                                                                           41
Frontier markets outlook
Regional market outlook

Sub-Saharan Africa (SSA)
    In Nigeria, the economy has moved out of recession, driven by much better availability of foreign currency and higher oil production. However, a lack of government reforms and a
     struggling consumer are holding back a stronger recovery. We are watching the recovery to see any signs of pick-up in investment before increasing our allocation to the market. The
     outcome of the presidential elections in Q1 2019 was in line with our expectations and thus we don’t expect sweeping reforms from the current administration.

    We have increased our allocation to Kenya in 2019 after seeing green shoots in the economy and some positive changes on the interest rate cap. Indeed, we have increased our
     banking exposure after valuations reached very compelling levels.

Any forecast, projection or target when provided is indicative only and is not guaranteed in any way.
The views expressed above were held at the time of preparation and are subject to change without notice.

                                                                                                           42
Wichtige Informationen
Beispielhafter Ex-ante-Kostenausweis nach MiFID II auf Basis einer fiktiven Transaktion
Rentenfonds und Mischfonds, institutionelle Anteilklasse

  Produkttyp:               Gesamtaufstellung der Dienstleistungskosten:       Summe der Kosten, berechnet für die unterstellte Dauer der            Kumulative Auswirkung der Dienstleistungs-
  Rentenfonds und                                                              Dienstleistung:                                                       und Produktkosten auf die Rendite:
  Mischfonds,
  institutionelle           0 % des Anlagebetrages.
  Anteilklasse              Dies entspricht EUR 0,00.                                                                                                Ohne Einstiegs- und laufende Kosten wäre
                                                                                                                  In %                  In EUR       die Rendite in den jeweiligen Jahren um
  Anlagebetrag:
                                                                                                                                                     2.450,00 EUR bis 15.050,00 EUR höher.
  1.000.000 EUR             Zuwendungen an HSBC Global Asset                    Dienstleistungskosten            0,000                      0,00
                            Management (Deutschland) GmbH:
  Kauf
  Haltedauer:                                                                   Kosten von Dritten               0,000                      0,00
                            0 % des Anlagebetrages.
  1 Jahre
                            Dies entspricht EUR 0,00.
                                                                                Produktkosten             0,245 – 1,505    2.450,00 – 15.050,00

                            Produktkosten wiederkehrend:                        Gesamtkosten              0,245 – 1,505    2.450,00 – 15.050,00

                            0,245 – 1,505 % p. a. des Anlagebetrages.
                            Dies entspricht jährlich 2.450,00 – 15.050,00
                            EUR.

Für die Ermittlung der Dienstleistungskosten wird unterstellt, dass der Wert des Anlagebetrags über die gesamte Haltedauer unverändert bleibt.
Die genannten Produktkosten für die institutionelle Anteilklasse eines Rentenfonds und Mischfonds entsprechen einer Bandbreite. Die tatsächlichen Kosten hängen vom jeweiligen Fonds ab und können höher
oder niedriger als die hier gezeigten Kosten ausfallen.
Die angegebenen Beträge beruhen teilweise auf einer Schätzung. In jedem Fall können sich die Angaben nach Erstellung der Beispielkostenausweise ändern.
Die angegebenen Werte können Rundungsdifferenzen enthalten.
Der Anlagebetrag entspricht bei Wertpapieren dem Kurswert, bei Optionen der Optionsprämie, bei Futures dem Nominal.
Zusätzlich entstehen Ihnen regelmäßig weitere Dienstleistungskosten, z.B. für die Annahme, Weiterleitung und Durchführung einer Wertpapierorder und für die Verwahrung der Wertpapiere. Diese weiteren
Kosten werden Ihnen durch das diese Dienstleistungen erbringende Wertpapierdienstleistungsunternehmen in Rechnung gestellt und nicht im oben gezeigten Beispiel berücksichtigt. Sie senken die Rendite
zusätzlich.

Quelle: HSBC Global Asset Management. Stand: 23.11.2017

                                                                                                     44
Übersicht der Fonds für institutionelle Kunden (1)

                                                 Anteils-                                       Manage-    davon                                Outper-    Depot-
                                                            Ausschüttend        Thesaurierend                         KVG-   Admin-
                             Name                klassen-                                        ment-   Production-                           formance-    bank-
                                                                ISIN                ISIN               1             Gebühr8 gebühr³
                                                 Währung                                        gebühr      Fee²                                gebühr4    gebühr

Aktien Europa
HSBC GIF - Euroland Equity I                       EUR      LU0165075127        LU0165074823    0,750%       0,3750%         -     0,25%           -         -
HSBC GIF - Euroland Equity Smaller Companies I     EUR      LU0165074401        LU0165074070    0,750%       0,3750%         -     0,25%           -         -
HSBC GIF - Euroland Growth I                       EUR            -             LU0362711326    0,750%       0,3750%         -     0,25%           -         -
HSBC GIF - European Equity I                       EUR      LU0149719980        LU0164907411    0,750%       0,3750%         -     0,25%           -         -
HSBC GIF - UK Equity I                             GBP      LU0156333956              -         0,750%       0,3750%         -     0,25%           -         -
                                                                                                         7
HSBC German Equity                                 EUR            -             DE0008489808    1,250%          -          0,05%     -             -       0,07%7
HSBC Sector Rotation                               EUR            -             DE0009756825    1,250%7         -          0,05%     -             -       0,07%7
Aktien Global
HSBC GIF - Economic Scale Global Equity I          USD            -             LU0164942087    0,300%       0,1500%         -     0,25%           -         -
HSBC GIF - Global Equity Climate Change I          USD            -             LU0323240613    0,750%       0,3750%         -     0,25%           -         -
HSBC GIF - Global Equity Volatility Focused I      USD            -             LU1103712250    0,750%       0,3750%         -     0,25%           -         -
HSBC GIF - Global Real Estate Equity I             USD      LU1163227736              -         0,750%       0,3750%         -     0,25%           -         -
Aktien Emerging Markets
HSBC GIF - Brazil Equity I                         USD      LU0196698236        LU0196697857    0,875%       0,4375%         -     0,30%           -         -
HSBC GIF - BRIC Equity I                           USD      LU0449510295        LU0449509958    0,750%       0,3750%         -     0,25%           -         -
HSBC GIF - BRIC Equity I                           EUR            -             LU0551368318    0,750%       0,3750%         -     0,25%           -         -
                             6
HSBC GIF - BRIC Equity L1                          USD            -             LU0342152195    0,500%       0,2500%         -     0,25%           -         -
HSBC GIF - BRIC Markets Equity I                   USD            -             LU0254983488    0,750%       0,3750%         -     0,25%           -         -
HSBC GIF - Economic Scale GEM Equity I             USD      LU0819121145        LU0819121061    0,300%       0,1500%         -     0,30%           -         -
HSBC GIF - Frontier Markets I                      USD      LU0666200695        LU0666200349    1,250%       0,6250%         -     0,40%           -         -
HSBC GIF - Frontier Markets I                      EUR      LU0717918238        LU0708055537    1,250%       0,6250%         -     0,40%           -         -
                                 6                                                                                                         7
HSBC GIF - Frontier Markets X                      USD      LU0666201156        LU0666200935    1,000%       0,500%    -           0,30%           -         -
HSBC GIF - GEM Equity Volatility Focused I         USD            -             LU1236621055    0,750%       0,375%    -           0,30%           -         -
HSBC GIF - Global Emerging Markets Equity I        USD            -             LU0164872797    0,750%       0,375%    -           0,30%           -         -
HSBC GIF - Mexico Equity I                         USD            -             LU0926764712    0,875%       0,438%    -           0,30%           -         -
HSBC GIF - Russia Equity I                         USD            -             LU0329931413    0,875%       0,438%    -           0,30%           -         -
HSBC GIF - Turkey Equity I                         EUR            -             LU0213961922    0,875%       0,438%    -           0,30%           -         -

                                                                           45
Übersicht der Fonds für institutionelle Kunden (2)

                                                              Anteils-                                       Manage-    davon                             Outper-    Depot-
                                                                         Ausschüttend        Thesaurierend                         KVG-   Admin-
                             Name                             klassen-                                        ment-   Production-                        formance-    bank-
                                                                             ISIN                ISIN               1             Gebühr8 gebühr³
                                                              Währung                                        gebühr      Fee²                             gebühr4    gebühr

Aktien Asien
HSBC GIF - Asia ex Japan Equity I                               USD      LU0149712548        LU0165193169    0,750%       0,375%    -           0,25%        -         -
HSBC GIF - Asia ex Japan Equity X6                              USD            -             LU0404495664    0,700%       0,350%    -           0,20%        -         -
HSBC GIF - Asia ex Japan Equity Smaller Companies I             USD      LU0149726845        LU0164939885    0,750%       0,375%    -           0,25%        -         -
HSBC GIF - Asia ex Japan Equity Smaller Companies X6            USD      LU0404496555        LU0404496472    0,700%       0,350%          -     0,20%7
HSBC GIF - Asia Pacific ex Japan Equity High Dividend I         USD            -             LU0197774135    0,750%       0,375%          -     0,25%        -         -
HSBC GIF - Asia Pacific ex Japan Equity High Dividend I         EUR            -             LU0622165578    0,750%       0,375%          -     0,25%        -         -
                                                          6
HSBC GIF - Asia Pacific ex Japan Equity High Dividend X         EUR            -             LU0404495821    0,700%       0,350%          -     0,20%        -         -
HSBC GIF - China A-Shares Equity X                              USD      LU2047620070        LU2038982745    0,700%       0,350%          -     0,20%7       -         -
HSBC GIF - Chinese Equity I                                     USD      LU0149719717        LU0164867441    0,750%       0,375%          -     0,30%        -         -
HSBC GIF - Chinese Equity X6                                    USD      LU1796207071        LU0404497447    0,700%       0,350%          -     0,20%7       -         -
HSBC GIF - China Consumer Opportunities I                       USD            -             LU0792368614    0,750%       0,375%          -     0,30%        -         -
HSBC GIF - Economic Scale Japan Equity I                        JPY            -             LU0164882242    0,300%       0,150%          -     0,25%        -         -
HSBC GIF - China Consumer Opportunities I                       EUR            -             LU0708055297    0,750%       0,375%          -     0,30%        -         -
HSBC GIF - Hong Kong Equity I                                   USD            -             LU0164880626    0,750%       0,375%          -     0,25%        -         -
HSBC GIF - Indian Equity I                                      USD      LU0149722851        LU0164881350    0,750%       0,375%          -     0,30%        -         -
HSBC GIF - Indian Equity I                                      EUR            -             LU0551366700    0,750%       0,375%          -     0,30%        -         -
HSBC GIF - Indian Equity X6                                     USD      LU0404507260             -          0,700%       0,350%          -     0,20%7       -         -
HSBC GIF - Thai Equity I                                        USD            -             LU0210638432    0,750%       0,375%          -     0,25%        -         -
Aktien USA
HSBC GIF - Economic Scale US Equity I                           USD      LU0149725441        LU0164902883    0,300%       0,1500%         -     0,25%        -         -
Strukturierte Fonds
HSBC Aktienstrukturen Europa                                    EUR            -             LU0154656895    1,25%7          -          0,25%     -          -       0,15%7
HSBC Discountstrukturen I                                       EUR            -             DE000A0NA4K9    0,750%7         -          0,05%     -          -       0,09%7
                                                                                                                      7
HSBC Rendite Substanz I                                         EUR            -             DE000A0NA4J1    0,600%          -          0,05%     -          -       0,09%7
HSBC GIF Euro Convertible Bond I                                EUR      LU1460729848             -          0,600%       0,3000%         -     0,20%        -         -

                                                                                        46
Übersicht der Fonds für institutionelle Kunden (3)

                                               Anteils-                                       Manage-    davon                        Outper-    Depot-
                                                          Ausschüttend        Thesaurierend                         KVG-   Admin-
                        Name                   klassen-                                        ment-   Production-                   formance-    bank-
                                                              ISIN                ISIN               1             Gebühr8 gebühr³
                                               Währung                                        gebühr      Fee²                        gebühr4    gebühr
Renten Staatsanleihen Europa
HSBC Euro Gvt Bond Fund H                        EUR            -             FR0000971293    0,42%7    0,3100%7      -        -         -          -
HSBC GIF - Euro Bond I                           EUR      LU0165129825        LU0165130088    0,375%    0,1875%       -     0,15%        -          -
Renten Staatsanleihen Global
HSBC GIF - Global Bond I                         USD      LU0149731258        LU0165191460    0,375%    0,1875%       -     0,15%        -           -
HSBC GIF - Global Bond Total Return I            USD            -             LU1560770387    0,450%    0,2750%       -     0,20%        -           -
HSBC GIF - Global Inflation Linked Bond I        USD            -             LU0518436737    0,350%    0,1750%       -     0,20%        -           -
HSBC GIF - Global Inflation Linked Bond I H      EUR            -             LU0522826592    0,350%    0,1750%       -     0,20%        -       0,025%5
HSBC GIF - US Dollar Bond I                      USD      LU0149734195        LU0165076109    0,375%    0,1875%       -     0,15%        -           -
Renten Unternehmensanleihen
HSBC Euro Credit Non-Financial Bond I            EUR      DE000A0Q7S32              -         0,700%7       -       0,05%      -         -        0,07%7
HSBC Euro Credit Subordinated Bond I             EUR      DE000A0H0RA1              -         0,700%7       -       0,05%      -         -        0,07%7
HSBC GIF - Euro Credit Bond I                    EUR      LU0165125914        LU0165125831    0,425%    0,2125%        -    0,20%        -           -
HSBC GIF - Euro Credit Bond X6                   EUR      LU0374601176        LU0374601093    0,350%    0,1750%        -    0,15%7       -           -
HSBC GIF - Euro Credit Bond Total Return I       EUR      LU0988493788        LU0988493606    0,450%    0,2250%        -    0,20%        -           -
HSBC GIF - Euro Credit Bond Total Return X6      EUR            -             LU0988494596    0,400%    0,2000%        -    0,15%7       -           -
HSBC GIF - Global High Income Bond I             USD      LU0524292009        LU0524292264    0,625%    0,3125%        -    0,20%        -           -
HSBC GIF - Global High Income Bond I H           EUR            -             LU0807188452    0,625%    0,3125%        -    0,20%                0,025%5
Renten Emerging Markets Debt
GEM Debt Hard Currency Investment Grade X H6     EUR      DE000A117YQ8              -         0,490%7       -       0,07%      -          -       0,05%7
HSBC GIF - Asia Bond I H                         EUR      LU1436996257              -         0,550%    0,2750%        -    0,25%         -          -
HSBC GIF - Asia Bond I                           USD            -             LU1436995523    0,550%    0,2750%        -    0,25%         -          -
HSBC GIF - Asia Bond X                           USD            -             LU1437003137    0,500%    0,2500%        -    0,20%7        -          -
HSBC GIF - Asia Bond X H6                        EUR      LU1770381645              -         0,500%    0,2500%        -    0,20%7        -          -
HSBC GIF - Asian Currencies Bond I               USD      LU0210635842        LU0210635685    0,625%    0,3125%        -    0,25%         -          -
HSBC GIF - Asian Currencies Bond I               EUR      LU0643830515              -         0,625%    0,3125%        -    0,25%         -          -
HSBC GIF - Brazil Bond I                         USD            -             LU0254980898    0,500%    0,2500%        -    0,25%         -          -
HSBC GIF - GEM Debt Total Return L1 H6           EUR      LU0432931250        LU0570051812    0,500%    0,2500%        -    0,25%       20%      0,025%5
HSBC GIF - GEM Debt Total Return L16             USD      LU0310511695        LU0310511422    0,500%    0,2500%        -    0,25%       20%          -
HSBC GIF - GEM Debt Total Return L16             EUR            -             LU0551372344    0,500%    0,2500%        -    0,25%       20%          -
HSBC GIF - GEM Debt Total Return X H6            EUR      LU1455023900              -         0,750%    0,3750%        -    0,25%7        -      0,025%5

                                                                         47
Übersicht der Fonds für institutionelle Kunden (4)

                                                              Anteils-                                  Manage-  davon                            Outper-    Depot-
                                                                         Ausschüttend   Thesaurierend                       KVG-   Admin-
                           Name                               klassen-                                   ment- Production-                       formance-    bank-
                                                                             ISIN           ISIN               1           Gebühr8 gebühr³
                                                              Währung                                   gebühr    Fee²                            gebühr4    gebühr
HSBC GIF - GEM Inflation Linked Bond I                          USD            -        LU0630379070    0,500%   0,2500%       -     0,25%           -          -
HSBC GIF - GEM Inflation Linked Bond I                          EUR            -        LU0630380169    0,500%   0,2500%       -     0,25%           -          -
HSBC GIF - Global Emerging Markets Bond I                       USD      LU0149732736   LU0164944026    0,500%   0,2500%       -     0,25%           -          -
HSBC GIF - Global Emerging Markets Bond I                       EUR      LU0551370561   LU0551370306    0,500%   0,2500%       -     0,25%           -          -
HSBC GIF - Global Emerging Markets Bond I H                     EUR      LU0431287282   LU0747734787    0,500%   0,2500%       -     0,25%           -       0,025%5
HSBC GIF - Global Emerging Markets Bond X6                      USD      LU0404503277   LU0404503194    0,500%   0,2500%       -     0,20%7          -          -
HSBC GIF - Global Emerging Markets Bond X H6                    EUR      LU0473929775   LU0473929692    0,500%   0,2500%       -     0,20%7          -       0,025%5
HSBC GIF - Global Emerging Markets Local Currency Rates I       USD            -        LU0992595826    0,625%   0,3125%       -     0,25%           -          -
HSBC GIF - Global Emerging Markets Local Currency Rates I       EUR            -        LU0992597285    0,625%   0,3125%       -     0,25%           -          -
HSBC GIF - Global Emerging Markets Local Currency Rates I O     EUR            -        LU0992598929    0,625%   0,3125%       -     0,25%           -       0,025%5
HSBC GIF - Global Emerging Markets Local Currency Rates X6      USD      LU0996084553   LU0996084397    0,600%   0,3000%       -     0,20%7          -          -
HSBC GIF - Global Emerging Markets Local Debt I                 USD      LU0234594348   LU0234594009    0,625%   0,3125%       -     0,25%           -          -
HSBC GIF - Global Emerging Markets Local Debt I                 EUR      LU0551371965   LU0551371700    0,625%   0,3125%       -     0,25%           -          -
HSBC GIF - Global Emerging Markets Local Debt X6                USD      LU0404505058   LU0404504911    0,600%   0,3000%       -     0,20%7          -          -
HSBC GIF - India Fixed Income I                                 USD      LU0780248364   LU0780248281    0,550%   0,2750%       -     0,25%           -          -
HSBC GIF - India Fixed Income I                                 EUR      LU0780249255   LU0780249172    0,550%   0,2750%       -     0,25%           -          -
                                  6                                                                                                          7
HSBC GIF - India Fixed Income X                                 USD      LU0780248521   LU0780248448    0,500%   0,2500%       -     0,20%           -          -
HSBC GIF - RMB Fixed Income I                                   USD      LU0692310633   LU0692310807    0,375%   0,1875%       -     0,20%           -          -
HSBC GIF - RMB Fixed Income I                                   EUR            -        LU0708054647    0,375%   0,1875%       -     0,20%           -          -
HSBC GIF - RMB Fixed Income I O                                 EUR            -        LU0782296759    0,375%   0,1875%       -     0,20%           -       0,025%5
Renten High Yield
HSBC GIF - Asia High Yield Bond XD                              USD            -        LU2067029749    0,600%   0,3000%       -     0,20%           -          -
HSBC GIF - Asia High Yield Bond XD H                            EUR            -        LU2067029822    0,600%   0,3000%       -     0,20%           -       0,025%5
HSBC GIF - Euro High Yield Bond I                               EUR      LU0165129155   LU0165129072    0,550%   0,2750%       -     0,20%           -          -
                                      6                                                                                                      7
HSBC GIF - Euro High Yield Bond X                               EUR            -        LU0404498767    0,500%   0,2500%       -     0,15%           -          -
HSBC GIF - Global High Yield Bond I                             USD      LU0780246400   LU0780246319    0,550%   0,2750%       -     0,20%           -
HSBC GIF - Global High Yield Bond I H                           EUR            -        LU0850060707    0,550%   0,2750%       -     0,20%           -       0,025%5
HSBC GIF - US High Yield Bond I                                 USD            -        LU1890106484    0,550%   0,2750%             0,15%           -          -
                                                                                   48
Übersicht der Fonds für institutionelle Kunden (5)

                                                        Anteils-                                    Manage-    davon                          Outper-    Depot-
                                                                   Ausschüttend     Thesaurierend                         KVG-   Admin-
                        Name                            klassen-                                     ment-   Production-                     formance-    bank-
                                                                       ISIN             ISIN               1             Gebühr8 gebühr³
                                                        Währung                                     gebühr      Fee²                          gebühr4    gebühr
Renten Short Duration
HSBC Euro Short Term Bond I                                EUR     FR0010495051     FR0010495044    0,300%7   0,2500%7      -         -          -           -
HSBC GIF - Global Short Duration Bond X6                   USD           -          LU1163226506    0,200%    0,1000%       -      0,11%7        -           -
HSBC GIF - Global Short Duration High Yield Bond I         USD           -          LU0922810196    0,450%    0,2250%       -      0,20%         -           -
HSBC GIF - Global Short Duration High Yield Bond I H       EUR           -          LU0922810600    0,450%    0,2750%       -      0,20%         -       0,025%5
Nachhaltigkeit
HSBC RIF SRI Euro Bond I                                   EUR            -         FR0010489567    0,400%    0,2000%        -         -         -          -
HSBC RIF SRI Euroland Equity I                             EUR            -         FR0010250316    0,750%7   0,375%7        -         -         -          -
HSBC GIF Global Lower Carbon Equity I                      USD      LU1689525381          -         0,400%    0,2000%        -     0,25%7        -          -
HSBC GIF Global Lower Carbon Equity X6                     USD            -         LU1674673774    0,350%    0,1750%        -      0,20%7       -          -
HSBC GIF Global Lower Carbon Bond X6                       USD            -         LU1674673006    0,350%    0,1750%        -      0,15%7       -          -
HSBC MSCI Europe Select SRI Index A                        EUR     DE000A2DXMD9           -         0,225%7       -      0,225%7       -         -       0,06%7
HSBC MSCI World Select SRI Index A                         EUR     DE000A2H5YR8           -         0,225%7       -      0,225%7       -         -       0,06%7
Liquidity Funds
HSBC Canadian Dollar Liquidity Fund A                      CAD     IE00B233G129     IE00B233G343    0,170%    0,0200%       -      0,03%         -          -
HSBC Euro Liquidity Fund A                                 EUR      IE0030028439     IE0030819498   0,170%    0,0200%       -      0,03%         -          -
HSBC Sterling Liquidity Fund A                             GBP      IE0007966447     IE0030819050   0,170%    0,0200%       -      0,03%         -          -
HSBC US Dollar Liquidity Fund A                            USD      IE0009489620     IE0030819274   0,170%    0,0200%       -      0,03%         -          -
Multi Asset / Mischfonds
HSBC Horizont 1+ I                                         EUR           -          DE000A2N67U6    0,720%        -      0,07%8       -           -      0,07%7
HSBC Horizont 2+ I                                         EUR           -          DE000A2N67V4    0,770%        -      0,07%8       -           -      0,07%7
HSBC Horizont 4+ I                                         EUR           -          DE000A2PBFJ0    0,810%        -      0,07%8       -           -      0,07%7
HSBC Horizont 7+ I                                         EUR           -          DE000A2PBFK8    0,840%        -      0,07%8       -           -      0,07%7
HSBC Horizont 11+ I                                        EUR           -          DE000A2PBFL6    0,870%        -      0,07%8       -           -      0,07%7
HSBC Horizont 16+ I                                        EUR           -          DE000A2PBFM4    0,900%        -      0,07%8       -           -      0,07%7
HSBC GIF Global Emerging Markets Multi-Asset Income I      USD           -           LU1711226511   0,675%    0,3375%       -      0,25%          -          -
HSBC GIF Multi-Asset Style Factors I                       EUR     LU1529682137      LU1460782227   0,700%    0,3500%       -      0,20%          -          -
HSBC GIF Multi-Asset Style Factors X6                      EUR     LU1529682210      LU1460782573   0,550%    0,2750%       -      0,15%7         -          -
HSBC Multi Markets Select MD                               EUR     DE000A0RAD67            -        1,500%7       -      0,05%        -         20%       0,12%7
HSBC Multi Markets Select LD                               EUR     DE000A2PL118            -        1,500%7       -      0,05%        -         20%       0,12%7
HSBC GIF China Multi Asset Income I O                      EUR           -           LU1903293055   0,675%    0,3375%       -      0,25%          -      0,025%5
HSBC Portfolios - World Selection 1 B H                    EUR           -           LU0931136328   0,500%        -         -      0,25%          -       0,06%5
HSBC Portfolios - World Selection 2 B H                    EUR           -           LU0931136757   0,500%        -         -      0,25%          -       0,06%5
HSBC Portfolios - World Selection 3 B H                    EUR           -           LU0931136914   0,600%        -         -      0,25%          -       0,06%5
HSBC Portfolios - World Selection 4 B H                    EUR           -           LU0931137219   0,600%        -         -      0,25%          -       0,06%5
HSBC Portfolios - World Selection 5 B H                    EUR           -     49    LU0931137565   0,650%        -         -      0,25%          -       0,06%5
Übersicht der Fonds für institutionelle Kunden (6)

                                                             Anteils-                                       Manage-    davon                        Outper-    Depot-
                                                                        Ausschüttend        Thesaurierend                         KVG-   Admin-
                          Name                               klassen-                                        ment-   Production-                   formance-    bank-
                                                                            ISIN                ISIN               1             Gebühr8 gebühr³
                                                             Währung                                        gebühr      Fee²                        gebühr4    gebühr

Asset Backed Fonds

HSBC GIF - Global Securitised Credit Bond Bond I                USD           -             LU1823213381    0,650%    0,3250%       -     0,20%        -          -

HSBC GIF - Global Securitised Credit Bond Bond X 6              USD     LU2080989697        LU1717580259    0,600%    0,3000%       -     0,15%        -          -

HSBC GIF - Global High Yield Securitised Credit Bond X6         USD           -             LU1194162217    0,700%    0,3500%       -     0,15%        -          -
HSBC GIF - Global Investment Grade Securitised Credit Bond
                                                                USD           -             LU1194161839    0,450%    0,2250%       -     0,15%        -          -
X6
HSBC GIF - Global Investment Grade Securitised Credit Bond
                                                                EUR           -             LU1808483801    0,450%    0,2250%       -     0,15%        -       0,025%5
H6

                                                                                       50
Berechnungsmethodik der Vergütung
HSBC Deutschland/HSBC Global Asset Management (Deutschland)

Eigene Berechnung                                                                                                        Berechnungsbeispiele

 Name des Fonds                                                                                                           HSBC GIF – Global Emerging Markets Debt Total Return (EUR Hedged)

 Managementgebühr                                                                                            %            Managementgebühr                                                                                       0,50 %

 ./. Production-Fee                                                                                          %            ./. Production-Fee                                                                                 -0,25 %
                                                                                                                          ./. KVG-Gebühr                                                                                     -
 ./. KVG-Gebühr                                                                                              %
                                                                                                                          ./. Rabatt der Lagerstelle1                                                                        -
 ./. Rabatt der Lagerstelle1                                                                                 %
                                                                                                                          = bei HSBC Deutschland / HSBC Global Asset Management
 = bei HSBC Deutschland / HSBC Global Asset Management                                                                                                                                                                           0,25 %
                                                                                                             %            verbleibende Vertriebsgebühr
 verbleibende Vertriebsgebühr
                                                                                                                          Zuzüglich ggf. anfallender, anteiliger Outperformance-Gebühr
 1   Ggf. mit der Lagerstelle individuell zu verhandeln
                                                                                                                          HSBC Multi Markets Select
                                                                                                                          Managementgebühr                                                                                   1,00 %
 Name des Kunden
                                                                                                                          ./. Production-Fee                                                                                 -
 Entgelte und Erlöse, die bei arbeitsteiliger Leistungserbringung im HSBC-Konzernverbund
 anfallen, werden in der Regel zwischen den an der jeweiligen Leistung beteiligten HSBC-                                  ./. KVG-Gebühr                                                                                    -0,05 %
 Einheiten aufgeteilt.
                                                                                                                          ./. Rabatt der Lagerstelle1                                                                        -
                                                                                                                          = bei HSBC Global Asset Management verbleibende
                                                                                                                                                                                                                             0,95 %
                                                                                                                          Vertriebsgebühr
                                                                                                                          Zuzüglich ggf. anfallender, anteiliger Outperformance-Gebühr
                                                                                                                          1 Ggf. mit der Lagerstelle individuell zu verhandeln

1.    Die Managementgebühr deckt die Gebühren für die Anlageverwaltungs-, Anlageberatungs- und Vertriebsdienstleistungen, die dem jeweiligen Teilfonds der Gesellschaft von der Verwaltungsgesellschaft, von den Anlageberatern und den
      Vertriebsstellen erbracht werden. Bei HSBC Global Investment Funds (GIF) besteht die Managementgebühr jeweils zur Hälfte aus der Beratungsgebühr und der Vertriebsgebühr.
2.    Die Production-Fee steht bei HSBC Global Investment Funds (GIF) und Französischen FCP Fonds dem Portfolio Manager zu. Bei HSBC Global Liquidity Funds enthält die Production-Fee auch die KVG Gebühr sowie die laufenden Kosten
      der Fonds.
3.    Die Admingebühr fällt gemäß Prospekt zur Deckung der Betriebskosten, Verwaltungs- und Kontoführungsgebühren von HSBC GIF Fonds an. Über-/Unterdeckungen gleicht die Managementgesellschaft unter Beteiligung der
      Vertriebsstellen aus.
4.    Bei diesen Fonds erhält die KVG einen Teil der/die gesamte Performancegebühr, soweit diese gemäß Verkaufsprospekt anfällt. X% (s.o.) jährlich von der vom Fonds erwirtschafteten Rendite über einem festgeschriebenen Schwellenwert.
      Der Schwellenwert ist den wesentlichen Anlegerinformationen (KIID) des Fonds zu entnehmen.
5.    Für die Währungsabsicherung erhebt die Depotbank/Verwaltungsstelle eine Gebühr von max. 2,5 Basispunkten p. a.
6.    Anteile der Klassen X & L sind für institutionelle Anleger im Sinne von Artikel 174 des Luxemburgischen Gesetzes vom 17. Dezember 2010 über Organismen für gemeinsame Anlagen zur Umsetzung der OGAW IV-Richtlinie 2009/65/EG
      in luxemburgisches Recht erhältlich. Für den Erwerb der Klasse X gilt außerdem, dass der Anleger in eine der folgenden Kategorien fallen muss: Unternehmen oder Pensionsfonds von Unternehmen, Versicherungsgesellschaften,
      eingetragene wohltätige Organisationen oder von Körperschaften der HSBC-Gruppe verwaltete oder beratene Fonds und andere vom Verwaltungsrat genehmigte institutionelle Anleger. Anteile der Klasse L für den HSBC GIF - BRIC
      Equity können seit dem 01.04.2010 nur noch von Anteilsinhabern gezeichnet werden, die einen regelmäßigen Sparplan haben.
                                                                                                                    51
7.    Bei diesem Prozentsatz handelt es sich um ein Maximum. Der gezahlte Betrag wird in den Halbjahres- und Jahresberichten der Gesellschaft bekannt gegeben.
8.    Die KVG-Gebühr ist bereits in der Managementgebühr enthalten.
You can also read