2020 FILLING THE SHELVES - Arla Foods
←
→
Page content transcription
If your browser does not render page correctly, please read the page content below
CONSOLIDATED HALF-YEAR REPORT

2020
                                FILLING
                                THE
                                SHELVES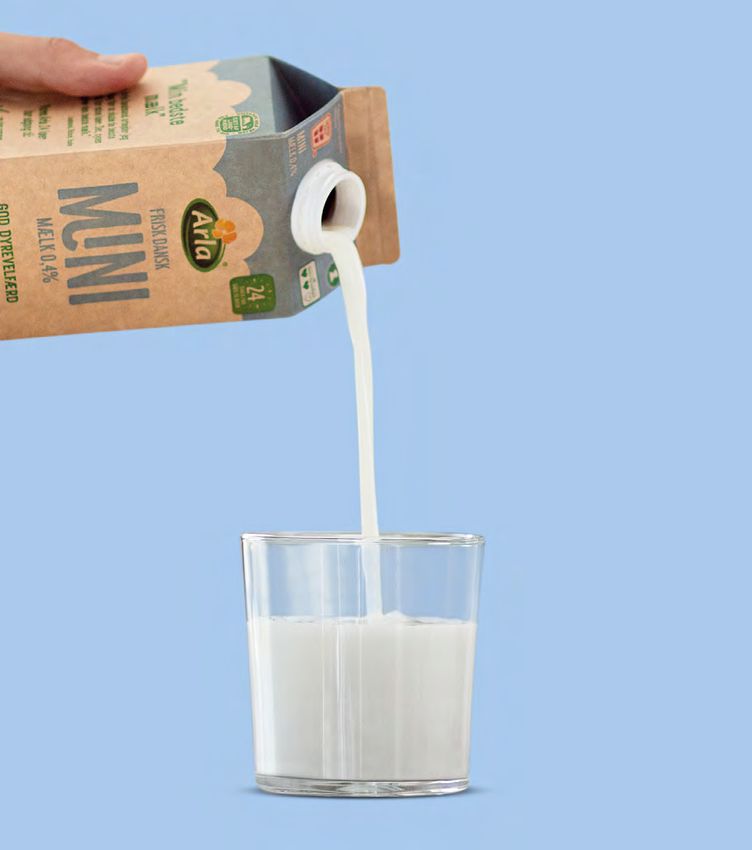
Table of Contents

                  Management Review

                  03	Half-year 2020 performance at a glance
                  04	Message from the Chairman of the Board of Directors
                  05 Message from the Chief Executive Officer
                  06	Highlights
                  07	Celebrating our everyday heroes
                  08	Our sustainability journey
                  09	Essential business priorities for 2020

                  Our Performance Review

                  10	Market overview
                  12	Financial performance
                  15	Financial outlook

                  Our Interim Consolidated
                  Financial Statements

                  16 Primary statements
                  21 Notes

                  27	Glossary
                  28	Corporate calendar

   Our vision
                  Arla Half-year Report 2020

                  The first half of 2020 was the most unusual period in
  Create the      recent history, with the Covid-19 virus forcing almost the
future of dairy   entire world into lockdown and making us rethink how we
to bring health   work and do business. Arla couldn’t have survived and
and inspiration   delivered outstanding results in this period without the
                  extraordinary dedication of its employees and farmer
 to the world,    owners. We would like to honour them with our cover.
   naturally.     Thank you for your continuous commitment!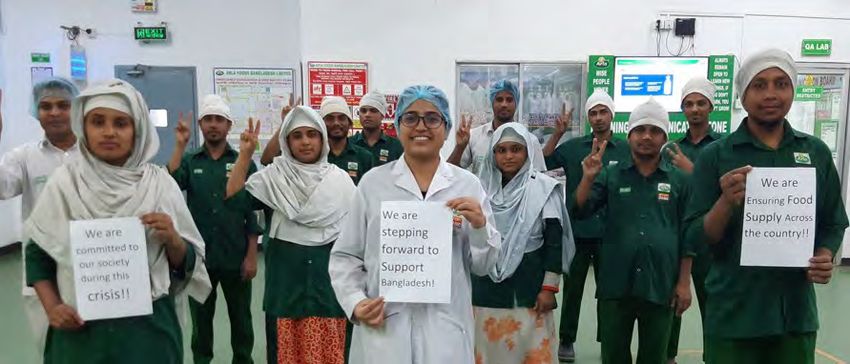
Management Review          Our Performance Review         Our Interim Consolidated Financial Statements

Half-year 2020
Performance at a glance
     Financial performance

                             Revenue                                              Performance price*                                                         Milk volume                                                              Profit share**

                          5.4                                                      37.0                                                                      7.0                                                                  3.0%
                           (BILLION EUR)                                             (EUR-CENT/KG)                                                            (BILLION KG)                                                             (OF REVENUE)

                                                            5.4                                                       37.0                                                                        7.0                                                                       3.0%
                                                            5.2                                                       36.1                                                                        7.0                                                                       2.3%
                                                            5.1                                                       34.7                                                                        7.0                                                                       2.2%
     Target 2020: 10.4-10.8 billion                                                                                                                                                                           Target 2020: 2.8-3.2%

     Cost and cash                                                                                       Quality of business

                                                                       Leverage                           Strategic branded volume driven                                          Brand share                                          International share***
                                                                                                                  revenue growth

                     69                                              2.6                                          10.4%                                                    48.3%                                                      24.2%
                     (MILLION EUR)

                                              69                                         2.6                                                        10.4 %                                                    48.3%                                                     24.2%
                                              97                                         3.0                                                         4.6%                                                     45.7%                                                     21.0%
                                              95                                         2.6                                                         3.0%                                                     44.6%                                                     19.2%
     Target 2020: 75-100 million                      Target 2020: 2.8-3.4                               Target 2020: 2-4%                                       Target 2020: ≥ 48%                                          Target 2020: ≥ 23%

    Half-year 2020      Half-year 2019     Half-year 2018                                            * Based on 4.2 per cent fat, 3.4 per cent protein
                                                                                                     ** Based on profit allocated to owners of Arla Foods amba
                                                                                                     *** International share is based on retail and foodservice revenue, excluding revenue from third party manufacturing, Arla Foods Ingredients and trading activities.

3    ARLA FOODS          HALF-YEAR REPORT 2020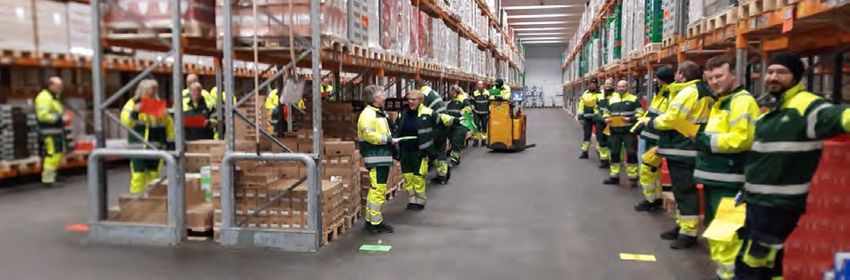
Management Review Our Performance Review Our Interim Consolidated Financial Statements
MESSAGE FROM THE CHAIRMAN OF THE BOARD OF DIRECTORS
We faced uncertainties
with a strong
cooperative spirit
With the Covid-19 pandemic causing significant market changes and extreme volatility
for our business, crisis management and keeping up a strong cooperative spirit were the
defining factors during the first six months of 2020.
We close the first half of this turbulent year better than Arlagården® and Climate Check Developing our democracy
Performance price expected thanks to the agility of the business organi- off to a great start Member meetings and democratic discussions are
sation and our farmer owners, and a strong focus on We entered 2020 with clear targets set on key to our cooperative structure and when most of
managing the negative effects of Covid-19. However, sustainability for 2030 and 2050. Our cooperative the world closed down in March, we had to act
we are looking into a challenging second half of 2020: reached important milestones on this journey as we quickly to ensure timely and steady communication
37.0
the effects of Covid-19, Brexit and a general recession updated and implemented our farm management with our farmer-owners and within our business.
paint a picture of a continued uncertain period. programme Arlagården® and launched our new, Digital meetings were the solution to the challenge,
globally aligned Climate Check programme that will but in the long run not meeting face-to-face is not
The events of the first half year affected our help farmers identify emissions on farms and optimal, and physical meetings will be resumed as
performance price. After holding a steady milk price provide a clear picture of possible actions to reduce soon as possible.
(EUR-CENT/KG) throughout 2019, the volatility in the dairy market them further. We already have some of the most
returned. Considering the severe challenges of the climate efficient farmers in the global dairy farming As it seems we will have to keep up this way of
ongoing pandemic, we maintained a reasonable sector and with a submission rate of 100 per cent working for the months to come, thus we will work
performance price for our farmer owners at 37.0 to the Arlagården® programme and 90 per cent on on developing the format further to use it as a
37.0 EURcent/kg. the first run of the voluntary Climate Checks, Arla supplement to physical meetings going forward.
36.1 farmer-owners showed their commitment and We are facing uncertainty in the wake of the
34.7 Throughout these critical months Arla farmers took all engagement in securing a sustainable future for our pandemic with a strong cooperative mindset and
required measures to continue production in a safe way, cooperative and dairy products. Together these in a firm position to face the challenges ahead.
ensuring the volumes needed to process and deliver a programmes accumulate one of the world’s largest
steady flow of dairy products to our customers and sets of externally verified farm data and a solid Jan Toft Nørgaard
consumers. This effort was widely acknowledged by foundation for benchmarking, knowledge sharing Chairman of the Board of Directors
consumers and governments and highlighted the and research across the dairy industry.
HY 2020 HY 2019 HY 2018 importance of continuous delivery of quality products.
4 ARLA FOODS HALF-YEAR REPORT 2020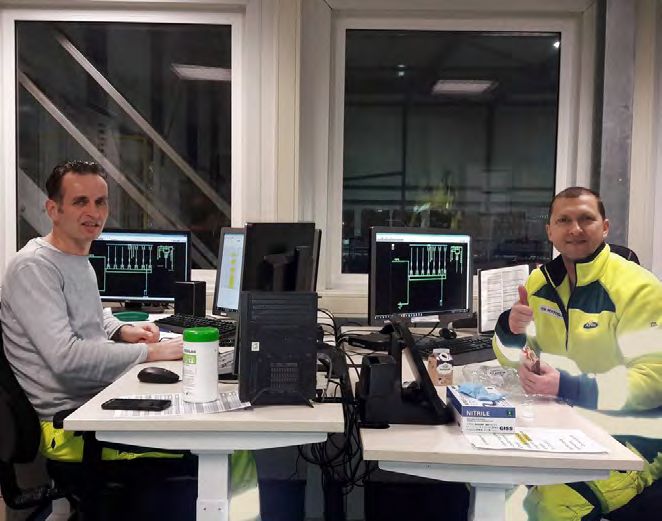
Management Review      Our Performance Review   Our Interim Consolidated Financial Statements

    MESSAGE FROM THE CHIEF EXECUTIVE OFFICER

    Arla performed above
    expectations despite
    the global pandemic
    In the massive disruption of Covid-19, Arla was agile to meet the changed customer and
    consumer needs. Whilst protecting the health and safety of our people, we utilised our good
    positions across categories and geographies to their full potential and maintained a steady
    flow of the products in demand in these abnormal times.

                                                   We are very proud to have provided food to the                Especially Lurpak® and Puck® exceeded expectations           Furthermore, we reached another milestone in the
        Strategic branded volume driven            society during the pandemic, and at the same time to          with 17.7 and 16.7 per cent growth respectively,             transition to sustainable dairy. With extensive commit-
                revenue growth                     have built our brands, delivered efficiencies and             compared to the same period last year. The Arla® brand       ment from our owners, we updated our farm manage-
                                                   strengthened our financial robustness.                        performed well in retail, but was negatively affected by     ment programme, Arlagården® to fully align audit
                                                                                                                 the drop in foodservice. Revenue was further strength-       methods and reporting for all 9,700 Arla farmers and

    10.4%
                                                   Overall, our performance in the first half of 2020 was        ened by our licence agreement on Kraft® branded              started to accumulate one of the world’s largest sets of
                                                   better than expected, with most of our key perfor-            cheese in MENA, which became operational last year.          externally verified data on animal welfare and climate
                                                   mance indicators exceeding their expected levels. We                                                                       impact from dairy farming.
                                                   maintained a stable and competitive milk price to our         Arla Foods Ingredients also delivered a strong
                                                   owners, with a performance price at 37.0 EURcent/kg           performance following a high demand for our unique           Robust cooperative in continued uncertainty
                    (EUR-CENT/KG)                  of milk. Our revenue reached a record-high EUR 5.4            protein ingredients in child nutrition and medical           Due to the continued severe economic uncertainty
                                                   billion, 2.8 per cent ahead of the first half of 2019. As a   products.  Our result reflects the efforts of an organisa-   caused by Covid-19 and the impending consequences
                                                   result of our solid performance and cash flow, our            tion that reacted fast to the abruptly changed               of Brexit, we will not comment on the external outlook
                                                   financial leverage ended on 2.6, positively well below        consumer needs. Combined with our agile supply               for the second half of 2020. However, we confirm all of
                                          10.4 %   our target range of 2.8-3.4.                                  chain, we provided extensive support and flexibility to      our own full-year targets and expect to deliver on or
                                           4.6%                                                                  our customers during the different phases of disruption.     above them. With our relatively strong performance
                                           3.0%    Home consumption boosted brands                                                                                            despite the crisis, I believe that we have yet again
                                                   Lost foodservice sales and lower commodity prices in          Results delivered as planned despite the crises              proven that Arla stands strong against major
                                                   the first half were more than offset by exceptionally         Despite the crisis, we maintained a strong internal          challenges and provides one of the world’s most
    Target 2020: 2-4%
                                                   high branded volume growth of 10.4 per cent. The              commitment to our transformation programme,                  robust co-operatives for dairy farmers.
                                                   overriding reason for the boost in branded and retail         Calcium. As planned, we delivered EUR 69 million in
                                                   volumes in both Europe and international was the              sustainable cost savings, mainly from reduced indirect       Peder Tuborgh
      HY 2020      HY 2019      HY 2018            increased eating and cooking at home.                         spend and optimized supply chain operations.                 CEO

5   ARLA FOODS          HALF-YEAR REPORT 2020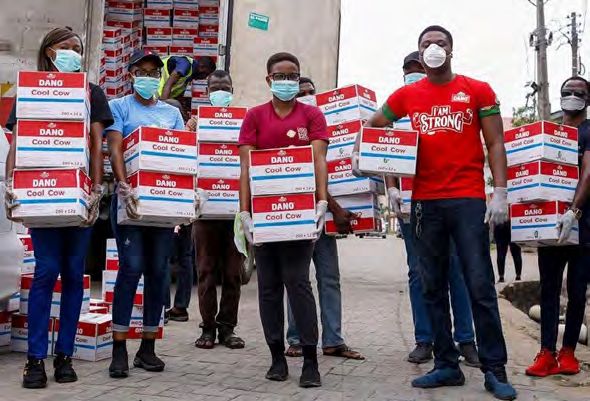
Management Review   Our Performance Review   Our Interim Consolidated Financial Statements

Highlights
The first half of 2020 was the most unusual period in recent history, with a global pandemic causing major shifts in demand and
consumer behavior. Our task was to was to continue to run the business as per usual, under these extraordinary times, and deliver food
to our customers and consumers. While managing the crisis, we also entered a completely new market with plant-based products,
qualified for a label ensuring good animal welfare, and drove our newest brand in the Middle-East to success.

    Lurpak® sales soared                                                              Our new brand, Kraft® delivered                                                         Welcoming JÖRĐ,
    during lockdown                                                                   amazing results in MENA                                                                 our plant-based range
    While all key markets of Lurpak® were                                             Kraft®, our newest brand, for which we                                                  Keeping our product portfolio relevant
    hit by lockdown in March and April,                                               acquired a licence last year to produce                                                 to our consumers ensures the greatest
    sales soared to unprecedented heights                                             and market in MENA, delivered almost                                                    profitability for our farmer owners. As
    in almost all markets. In total sales                                             50 per cent above expectations for                                                      more and more of our consumers
    were up by a staggering 17.7 per cent                                             revenue in the first half of 2020. In the                                               started to combine milk with plant-
    compared to the same period in 2019.                                              professional hands of our brand team,                                                   based drinks in their diet, we knew we
    In the UK, Lurpak’s main market,                                                  Kraft® flourished in the Ramadan                                                        had to make a bold and unusual move
    demand surged even more, by 20.3                                                  season, and the growth was further          Arla24 is now labelled                      for a dairy company: to enter the
    per cent. An all time record was also                                             boosted by the increased consump-           as milk produced with good                  plant-based market. Building on our
    broken, when in a single week in April                                            tion of dairy products at home during       animal welfare                              innovation edge, in May we launched
    86 truckloads of Lurpak® were shipped                                             the Covid-19 curfew.                        Our best-selling milk in Denmark,           JÖRÐ This is our new range of
    to the UK. This of course put some                                                                                            Arla24 is now marked with the Danish        plant-based drinks made with natural
    strain on our dairy in Holstebro,                                                                                             Veterinary and Food Administration’s        Nordic ingredients, such as oat, barley
    Denmark, where Lurpak® is produced.                                                                                           green “ Better Animal Welfare” label,       and hemp. It’s now available in the
    To serve the increasing demand           A skyriously great campaign                                                          which acknowledges that Arla milk has       Danish market, soon to be followed by
    colleagues took extra shifts during      was launched for Skyr                                                                been produced with a high focus in          Sweden and the UK, during the second
    weekends, while our global planning      Our best in category yoghurt, Arla®                                                  animal welfare. Arla24 milk received        half of 2020 and 2021, respectively.
    and logistics team was working hard to   Skyr was supported by a big product                                                  two hearts, which among other things
    closely follow the unusual fluctuation   quality campaign in three core markets                                               means that cows are not tied up in the
    in demand.                               during spring. Creatively, we used the                                               cowsheds, and that they are on grass
                                             Icelandic nature as a metaphor to                                                    during the spring and summer time.
                                             describe how good Skyr is. As an                                                     This labelling makes it easier for
                                             additional attention grabber we also                                                 consumers to choose dairy products
                                             launched our own catchy adverb,                                                      with the best care for cows.
                                             “skyriously”.

6    ARLA FOODS     HALF-YEAR REPORT 2020
Management Review Our Performance Review Our Interim Consolidated Financial Statements
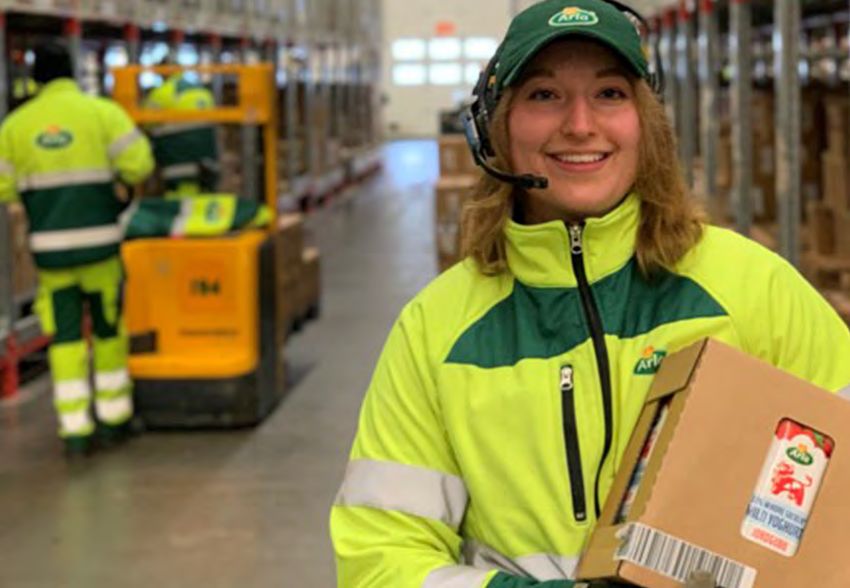
Celebrating our everyday heroes
When the situation is extraordinary, the ideas and solutions need to be too. Our farmers and colleagues from across the whole value chain
went above and beyond to find out-of-the-box solutions for the problems caused by Covid-19. We dealt with unusually large swings in
demand; helped each other across our value chain by trying out new roles; started selling products that were meant for sale to
restaurants to other customers; and also found means to help local communities. Here are few examples of our many everyday heroes.
Managing work, life and Breaking records and helping
hundreds of cows children in need
Managing work and private life was a Despite the challenges of keeping a
balancing act for our farmer owners as safe distance and managing a volatile
well, when the daycares and schools demand, our UK production sites
closed down in most countries. Many reached outstanding achievements and
had to provide education for their even broke records during the crisis.
children, while also keeping their Thanks to the great collaboration
employees and animals safe, the milk between their teams, Aylesbury Dairy
Packaging must go on quality high and taking part in Arla’s Supporting restaurants and health broke their own record and increased Rolling up the sleeves to keep
When the Nigerian city of Lagos, democratic decision making from a care personnel in one go their output to 840,000 milk cartons in production going
where Arla has a packaging plant, went distance. As for everyone, keeping Our team in Sweden came up with a just one shift, and 1.5 million in 24 To help out dairies dealing with increased
into lock-down, 110 of our Nigerian distance in both their work and leisure way to support many vulnerable groups hours. This meant an 25 per cent demand while colleagues were calling in
colleagues isolated themselves at the time was not an easy obstacle to - public transport drivers, health care capacity increase compared to the sick or quarantined, our office team in
plant in a temporary accomodation to overcome, but they knew that the more personnel and local restaurants - with same period last year. Finland rolled up their sleeves and
maintain production. Until the consistently they did it, the sooner the one gesture. They bought snack bags quickly learned new skills. After a quick
situation normalised, they spent all spread of the virus would slow down. and food packages from Arla’s training session on safety, hygiene and
their time at the plant, working, restaurant and café customers, who waste handling in production, the over 25
sleeping, eating, and sometimes were struggling with the lack of guests, ”volunteers” who would otherwise work
playing a well-deserved match of table and distributed the packages to bus in office jobs in our supply chain, finance,
tennis. Without them, the Nigerian drivers, emergency care personnel and or foodservice segment jumped in and
consumers wouldn’t have been able to other health care workers. This move produced or packed the goods they
get their daily dairy from us. also helped our foodservice business, as normally would only eat (and sell). “As
they were loosing their most important sales slowed down in foodservice due to
customers, restaurants. restaurants and public institutions closing
down, we figured helping supply chain is
the best way to ensure we sell as much
as possible in retail”, said Katja Knuutinen,
head of foodservice in Finland.
7 ARLA FOODS HALF-YEAR REPORT 2020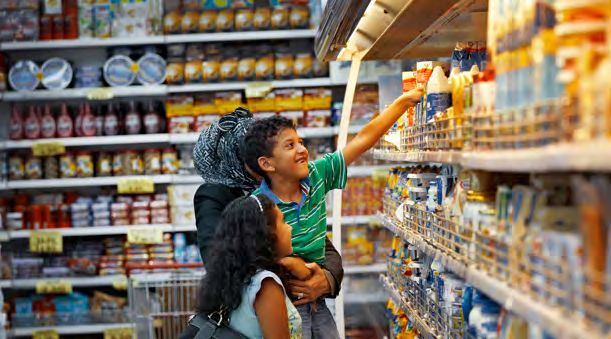
Management Review   Our Performance Review   Our Interim Consolidated Financial Statements

      Our sustainability journey
      continues despite the crisis
      We have continued our sustainability journey during the trying months of the Covid-19 crisis. We found ways to serve the growing demand for
      nutritious dairy products as people were stocking up at the beginning of the lockdowns, and also donated to those in need. Our ambitious
      carbon assessment programme on farms rolled out successfully with a participation rate above expectations, and we also continued to reduce
      our carbon footprint through better packaging solutions and by reducing product waste.

                   Arla farmers smash
                   carbon assessment
                                                    to restaurants, cafes and canteens closing
                                                    down. Our Pandemic Planning Group
                                                                                                 1.4 million slices of pizza thanks to
                                                                                                 Arla® Pro mozzarella, and milk enough
                                                                                                                                               “By taking                   the new bucket consists of 40 per cent
                                                                                                                                                                            less plastic, causes 30 per cent less
                   submission rate                  addressed this through a range of actions,   for 4.8 million bowls of cereal for           continuous                   CO₂e emissions, and is 100 per cent
      A major milestone was met by our
      cooperative in the first half of 2020,
                                                    from a company-wide register of waste
                                                    products, to the creative approach taken
                                                                                                 hardworking nurses, doctors, hospital
                                                                                                 staff and families in need. “The challenges
                                                                                                                                               action on                    recyclable. As we sell around 17 million
                                                                                                                                                                            buckets of Skyr a year this means that
      which puts Arla at the forefront of the       in Finland. There the foodservice team       of coronavirus are hitting the dairy          climate and                  the new packaging reduces Arla’s CO₂e
      industry when it comes to climate             sold products meant for restaurants and      industry hard with a surplus of milk. To      nutrition,                   emissions by 440 tonnes on a yearly
      impact measurement. 90 per cent of our        catering companies to consumers via          ensure Arla milk goes to a good home,                                      basis and cuts our annual plastic usage
      farmer owners, covering 96 per cent of        pop-up roadside markets and organised        we redistributed them to where they           we aim                       by 270 tonnes. The new Skyr bucket is
      our milk pool submitted our Climate           the first ever Arla Drive-in Dairy Tour,     are needed most”, says Jonathan Dixton,       to build                     now introduced in Denmark, Sweden,
      Check questionnaire. With this question-      where consumers could tour around the        Vice president of Arla Foodservice UK.                                     Germany, UK and the Netherlands.
      naire we aim to triple the speed of CO₂e      dairy in their cars, while also buying                                                     confidence
      reduction on farm by helping farmers          high-quality products.                                                                     in dairy as
      identify the main sources of emissions                                                                            New packaging
      while we also accumulate one of the                                                                               innovation             part of a
      world’s largest sets of externally verified   Bringing sustainable nutrition                                      saves 400              sustainable
      data bases on the climate impact from         to those in need                                                    tonnes of CO₂e
      dairy farming. After farmers submit data,     Butter, cheese, yogurt and milk that                                yearly                 future.”
      an emissions expert visits their farm and     should have been destined for Britain’s                             Our market
      they together draw a clear plan for           cafes and restaurants were distributed                              leading Icelandic      Hanne Søndergaard,
      actions to reduce emissions further.          into the homes of some of health care                               style yoghurt,         CMO
                                                    workers and the most vulnerable              Arla® Skyr, got new packaging during
                                                    families in the country thanks to a new      the spring. The major change in the
      Winning the fight against food waste          partnership between Arla and three           new packaging is that part of the plastic
      In the early weeks of the pandemic one of     food charities. Arla’s products have         is replaced with cardboard, which is not
      the challenges Arla was facing was a rapid    been providing enough dairy for              only more environmentally friendly, but
      escalation in finished product waste, due     4 million slices of Lurpak buttery toast,    also fully recyclable. With this change

8   ARLA FOODS    HALF-YEAR REPORT 2020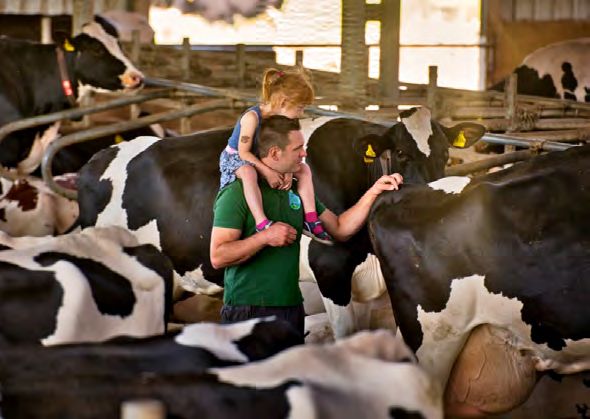
Management Review   Our Performance Review   Our Interim Consolidated Financial Statements

       Essential business
       priorities for 2020
       Our essential business priorities are the stepping stones on our Good Growth 2020 strategy.
       They are defined by the executive management team, and approved by the board of directors.
       When our 2020 business priorities were set, no one foresaw a global pandemic. Had we known
       it, our priorities might have looked different, but we are proud to say that we achieved the targets
       set in most fields, despite the circumstances. Nevertheless, Covid-19 interfered with the
       development of our new strategy. As we proceed with defining the details of the evolution of
       Good Growth beyond 2020, we will build on the learnings from the disruption of Covid-19 and
       ensure that Arla will continue to quickly adapt to new realities.

             Deliver Calcium transformation                       Drive core brands and boost innovation

             Succeed with commercial priorities                  Build strong customer partnership and grow

           Excite our people about future of Arla, including     Take lead and execute sustainability agenda
            the new strategy
                                                                  Grow Arla Foods Ingredients

                                                                                                                             Keep the business
                                                                                                                              running and performing
                                                                                                                              during Covid-19

                                                                                                                             Adapting to a new
                                                                Target achieved
                                                                                                                              reality and planning
                                                                Trend on track                                                ahead

9   ARLA FOODS   HALF-YEAR REPORT 2020
Management Review   Our Performance Review   Our Interim Consolidated Financial Statements

Our performance review

                 In the first half of 2020, Arla delivered strong results across all key
                 performance indicators even though the Covid-19 pandemic disrupted
                 consumer behaviour, global supply chains and the global economy in
                 unprecedented ways. Due to our strong positions in retail and firm
                 execution throughout our value chain, we managed to keep our milk
Torben Nyholm    price stable at a competitive level during the crisis, with a performance
Chief Financial Officer
                 price of 37.0 EURcent/kg of milk. Our brands performed exceptionally
well, resulting in a historically high branded volume growth of 10.4 per cent, mainly
driven by increased dairy consumption at home. Despite the challenges caused by
Covid-19 hitting Arla from farmers throughout our production lines to our sales
organisation, we managed to accommodate large swings in volumes and in the
composition of our product portfolio, while also maintaining good cooperation with
our customers. At the same time our transformation and efficiency programme
delivered results ahead of expectations, at EUR 69 million.

10   ARLA FOODS      HALF-YEAR REPORT 2020
Management Review Our Performance Review Our Interim Consolidated Financial Statements
Market overview
Unparalleled disruption due to Covid-19 essential foods. During the lockdown consumers The economic disruption caused by the pandemic of restaurants, cafes and canteens around the world
In the first half of 2020, the global macroeconomic made fewer trips to grocery stores, which meant also affected exchange rates, however with a mixed created a surplus of milk mainly redirected to the
environment was characterised by Covid-19 and the larger baskets at a single shopping and heightened impact and volatile changes across core Arla commodity markets. The contraction of the export
start of the economic crisis triggered by it. Due to reliance on online grocery shopping. These changes currencies. Compared to the first half of 2019 SEK market together with the milk surplus and the
lockdowns, curfews and other containment caused significant swings in demand for dairy decreased towards EUR, while USD increased. The accumulation of unsold supplies lead to a significant
measures restricting movement and travel first in products that will very likely continue in the second GBP was almost flat against EUR. The overall effect drop in all commodity categories.
China in early 2020, followed in March by most of half of 2020 as well, along with the growth in of currency changes on Arla’s revenue was neutral
Europe and the US, the global food industry e-commerce, especially in case a second wave of during the first half of 2020. By the end of the first half of the year, commodity
experienced logistics and supply chain challenges. Covid-19 hits the markets. markets showed signs of recovery, with prices stabilizing
The environment remained challenging even after Milk markets plunged but show resilience close to, but still somewhat lower than, pre-pandemic
the measures were eased in most countries. Another consequence of the pandemic is severe Notwithstanding the effects of the Covid-19 crisis, levels. Given the economic hardships that many
uncertainty around the macroeconomic outlook. the global market for milk consumption and dairy countries are facing, demand is likely to remain
Customer and consumer behaviour changed When the pandemic arrived to the Western world in products showed resilience during the first half of subdued in the coming months, which could keep
significantly even though the impact of the economic early spring, an economic slowdown was already 2020 and is even projected to grow slightly by the international prices of dairy products under pressure.
crisis is yet to be felt by consumers on a larger scale, forecasted by analysts for 2020. With the Covid-19 end of the year.
and in their spending on dairy products. Nevertheless, crisis hitting many nations’ economies hard, the
as restaurants, cafes and canteens closed down, depth of the crisis and the speed of the recovery is That said, the export of dairy products sharply
consumers cooked more and more at home, and in still largely uncertain, partly because currently large declined due to the Covid-19 lockdowns and the
many markets, they engaged in “panic buying” at the government help packages mitigate the impact in widespread economic slowdown, mainly affecting
beginning of the crisis, stocking up large quantities of most countries. exports from Europe and New Zealand. The closure
Gross domestic product growth rate Commodity price developments
(per cent) (standardised milk price, EUR)
10 0.4
5
0 0.3
-5
-10 0.2
18 19
15
16
17
20
9
9
9
9
19
9
9
9
9
9
19
19
0
20
0
0
20
20
0
20 20
.1
1
.1
r. 1
1
l. 1
1
1
t. 1
.2
.2
r. 2
l. 2
20
20
20
20
b.
ay
n.
g.
p.
v.
c.
b.
ay
n.
ar
ar
Jan
Jan
Ju
Ju
Ap
Ap
Oc
No
De
Fe
Se
Fe
Au
Ju
Ju
M
M
M
M
Advanced economies World Emerging market and developing economies Cheddar Gouda Mozzzarella WMP
* Source: IMF * Source: GDT, Trigona Dairy Trade
11 ARLA FOODS HALF-YEAR REPORT 2020Management Review Our Performance Review Our Interim Consolidated Financial Statements
Performance review
Stable milk price despite circumstances Due to the strong profit, our most important Volumes and brands drive revenue growth Branded volume growth development
Despite the extremely challenging market circum- performance indicator, the performance price ended During the first half of 2020, revenue grew 2.8 per HY 2018 to HY 2020
stances, Arla managed to keep the milk price stable at a healthy 37.0 EURcent/kg of milk, compared to cent to EUR 5.4 billion, compared to EUR 5.2 billion
at a competitive level, with a slight increase in the 36.1 EURcent/kg of milk in the first half of 2019. in the first half of 2019. Revenue growth was HY 2020 10,4%
prepaid milk price in the beginning of the year, offset Our strong positions in retail resulted in unprecedented primarily driven by higher branded volumes in retail,
HY 2019 4.6%
by a small decrease towards the end of the period. branded volume growth of 10.4 per cent, which as well as M&A revenue impacts. The increase was
Overall, the average prepaid milk price was 34.4 contributed largely to the strong performance price, offset by a significant decrease in revenue from our HY 2018 3.0%
EURcent/kg of milk, compared to 34.2 EURcent/kg along with the continued success of our transformation foodservice business segment, due to the lockdown
of milk in the first half of 2019. This development is and efficiency programme, Calcium, and the strong of restaurants, canteens and cafes, and the lower
particularly strong when seen in combination with execution throughout our value chain. commodity prices.
our 3.0 per cent net profit, an extraordinary result for compared to the same period last year. Prices
a first half of the year. Milk intake from our farmer owners and other external Branded volume growth positively impacted affected revenue slightly negatively.
sources was overall unchanged compared to the first revenue by EUR 106 million or 2 per cent. Branded
half of 2019. While milk intake from our farmer owners volume growth in retail was exceptionally strong in M&A positively impacted revenue by EUR 65 million
slightly increased, by 0.4 per cent, milk intake from the UK, Germany and MENA, and from a brand or 1.2 per cent, mainly driven by our licence
other sources decreased, leaving the overall milk intake perspective, Lurpak® performed above expectations, agreement to manufacture, market and distribute
virtually unchanged at 7 billion kilos. with a staggering 17.7 per cent sales growth Kraft® branded cheese in MENA.
Owner milk price
(EURc/kg)
37.0
36.1
34.7
34.4
34.2
M&A positively impacted the
revenue by (EUR)
32.6
65 miO
mainly driven by our licence
agreement to manufacture, market
and distribute Kraft® branded
HY 2018 HY 2019 HY 2020 cheese in MENA.
Average prepaid milk price Performance price
12 ARLA FOODS HALF-YEAR REPORT 2020Management Review Our Performance Review Our Interim Consolidated Financial Statements
Performance review (CONTINUED)
Extraordinary branded growth driven by Commercial segment growth driven by brands
increased home consumption
Arla realised extraordinary strategic branded volume growth Europe Our European commercial segment was highly affected by the Covid-19 crisis in the first half of 2020, as virtually
of 10.4 per cent during the first half of 2020, far ahead of our all markets went into lockdown from March. Nevertheless, the segment delivered revenue of EUR 3,178 million, compared
target range of 2 to 4 per cent. This increased our branded to EUR 3,149 million in the same period last year. Our food service business in Europe experienced a steep decline due to
share of revenue to 48.3 per cent, equalling an increase of the closure of restaurants. However, significantly increased home consumption and e-commerce sales drove strong performance of retail, which
2.6 percentage points compared to the first half of 2019. more than compensated the food service reduction. Our branded volumes in the European markets performed exceptionally, with 6.3 per cent
This unprecedented growth was mainly due to changes in growth, compared to 2.3 per cent in the same period last year. Brand share increased to 53 per cent, compared to 52 per cent in the first half of 2019.
consumer behaviour during the global lockdown, as with the The growth was primarily driven by StarbucksTM, Lurpak®, and the Arla® brand, with 29.5, 20.0 and 3.1 per cent respectively. From a market point of
closure of restaurants people cooked more at home and in view, branded volumes grew by the highest rate in the UK at 15.9 per cent, followed by Germany and the Netherlands/Belgium/France region at 9.3
general consumed more dairy products. and 7.9 per cent respectively.
Our best performing brands were Lurpak® with a branded
volume growth of 17.7 per cent, and Puck® with a branded International Despite the challenging circumstances due to Covid-19, our international commercial segment delivered
volume growth of 16.7 per cent. The Arla® brand and Castello® significant revenue growth of 22.1 per cent. Revenue increased to EUR 1,024 million, compared to EUR 839 million in the
performed below expectations due to challenges in the same period last year, which constitutes the highest revenue growth in the past five years. The main driver for the growth
foodservice segment of the branded sales, with a branded was MENA, with 36.7 per cent branded growth, as consumption of dairy products at home increased due to the lockdowns in the region. Our Kraft®
volume growth of 3.3 and -0.5 per cent, respectively. Our milk cheese business was also a big contributor to the success in MENA. All other international markets contributed positively to revenue growth, the
based beverages performed in line with expectation, at 13.1 success primarily driven by increased branded volumes, with SEA at 10.3 per cent, North America at 5.0 per cent, and West Africa at 4.7 per cent of
per cent branded growth, mainly driven by StarbucksTM. branded volume growth. As a result, the branded share of the revenue in the segment grew to 87 per cent.
AFI: In the first half of 2020, Arla Foods Ingredients continued to discover and deliver the wonders of whey through a strong
Branded volume growth by global brand performance supported by stable operations despite turbulence caused by Covid-19. Within the ingredients segment, the
value added business grew 7.2 per cent following a high demand for our unique protein ingredients in our child nutrition
and medical products. This demand growth more than offset the Covid-19 effects, namely the lower whey intake due to decreased mozzarella
production for foodservice, and the reduced demand for sports nutrition. Higher market prices for lactose and a strong customer demand for dry
blend quality conclude a positive first half year. Our child nutrition manufacturing business performed in line with the same period last year, but
difficult trading conditions in the important Chinese market slowed growth considerably.
3.3% 17.7% -0.5%
HY 2019: 5.3% HY 2019: 1.6% HY 2019: -4.1% Trading 2020 started strongly for our trading business as the trend from the end of 2019 continued. Protein prices
continued to increase whilst fat prices remained stable. However, the lockdowns in China, and across Europe and US due to
Covid-19 impacted the global market gravely, resulting in a dramatic fall in prices as manufacturers started to clear stocks.
Demand for Arla products remained relatively strong as the lower prices meant that areas where the trading business has a strong presence, such as
MENA, continued to buy product. We were able to manage the trading product portfolio to accommodate the significant volatility resulting from
“panic-buying” and the shutdown of foodservice business by working closely with our global planning team and adjusting product mix and volumes.
16.7% 13.1% As a result of this flexibility, Arla did not have to make any arrangements for the restriction or disposal of its members milk.
HY 2019: 4.2% HY 2019: 11.9%
13 ARLA FOODS HALF-YEAR REPORT 2020Management Review Our Performance Review Our Interim Consolidated Financial Statements
Performance review (CONTINUED)
Continued success cent of revenue which is at the middle of operations combined with positive net Net profit Our equity ratio increased to 35 per cent
of all Calcium workstreams our target range (2.8 – 3.2) and 0.7 working capital development. compared to 32 per cent at the same
While focusing on business continuity
throughout the Covid-19 crisis, Arla is
percentage points ahead of last year’s.
This was partly driven by increased Arla continued improving net working 3.o% time last year. The current ratio is on
level with prior years while the extraordi-
well on track to deliver the planned consumption of dairy products at home. capital during the first half of 2020, (OF REVENUE) nary low ratio in 2019 was attributable to
efficiency initiatives across Calcium successfully reducing net working capital the one time pay out of full profit in 2019
workstreams, with EUR 69 million in Arla in a strong financial position to 30 days. The decrease was primarily related to the financial year 2018.
savings. Our guidance for total savings in Despite the challenges posed by the a result of lower trade receivables.
2020 increased to EUR 90-100 million. Covid-19 crisis, Arla was in a very strong Increased working capital requirements
The savings mainly came through financial position at the end of the first half primarily related to our international Calcium savings,
improved efficiencies in indirect costs of 2020. We ended with a financial leverage business were offset by the effect of the
and optimised supply chain operations,
where less travelling, more online
of 2.6, below our target range of 2.8-3.4.
This constitutes a decrease of 0.4
utilisation of receivables and supply
chain finance programmes, as well as 69 Financial leverage
development
meetings, reduced marketing and lower compared to the first half of 2019. This was improved internal processes. (MILLION EUR)
energy prices due to the Covid-19 crisis driven by a positive development in EBITDA 3.0
gave favourable tailwind in costs combined with a positive development in Our largest Capex investment projects
2.6 2.6
compared with the first half of 2019. The net working capital. In March 2020, Arla continued to be executed during the
favourable impact of Covid-19 was offset paid out the supplementary payment Covid-19 crisis, however at a slightly
by difficulties in building up further related to the net profit for 2019 according slower pace than originally expected. Key Net working capital*
efficiencies in our supply chain, as we to the retainment policy. Capex projects included the capacity
had to accommodate large swings in
demand and in the composition of our Cash flow from operating activities
increase in mozzarella production at our
site in Branderup, Denmark, and 30
product portfolio. increased to EUR 477 million in the first increased activities in the construction of (DAYS)
half of 2020, compared to EUR 204 our powder tower in Pronsfeld, Germany.
Net profit in target range million in the same period last year. This Our Capex investments, including right of
In the first half of 2020 Arla achieved a strong cash flow is primarily explained by use assets totalled EUR 278 million for
* Trailing 3 months average number.
net profit of EUR 163 million, or 3.0 per strong underlying cash flow from the first half of 2020.
HY 2018 HY 2019 HY 2020
14 ARLA FOODS HALF-YEAR REPORT 2020Management Review Our Performance Review Our Interim Consolidated Financial Statements
Financial outlook
Due to the severe uncertainty around the duration and intensity of the economic and market impacts caused by
the Covid-19 pandemic, Arla refrains from commenting on the external market outlook for the second half of 2020.
However, based on our current knowledge and strong financial performance realised during the first half of 2020,
we provide the below cautious guidance for our own full year 2020 financial performance.
We expect revenue and net profit to follow the guidance communicated in our 2019 Annual Report, while we have updated our guidance on Brexit exacerbates uncertainty
branded volume growth, brand share, international share, Calcium and leverage following the strong developments in the first half of 2020. Little progress in the negotiations between the
UK and the EU and delays due to the Covid-19
crisis created further uncertainty on the future
trading relationship. Currency market volatility
Guidance 2020 has continued to affect our business and will
impact our 2020 results.
Revenue Profit share Calcium
Following the end of the transition period on
10.4-10.8 2.8-3.2% ≥ 90-100 31 December 2020, the UK will leave
the EU single market and customs
union. There is still a risk that no
(BILLION EUR) (OF REVENUE) (MILLION EUR)
(original guidance: 75-100)
deal will be agreed, thus we are
continuing to engage political
stakeholders in the UK and EU,
advocating for a Free Trade
Leverage Agreement that supports the
dairy industry. We have
≤ 2.8 continued preparing the
business to minimise the
negative impact of a number
(original guidance: 2.8-3.4)
of potential outcomes as
much as possible, but we
recognise that deal or no
Strategic branded volume deal, there will be disruption
International share Brand share driven revenue growth to trade flows between the
UK and EU, and additional
> 23.5% > 48.5% ≥ 6% costs to our business in the
future.
(original guidance: ≥ 23.0%) (original guidance: ≥ 48.0%) (original guidance: 2-4%)
15 ARLA FOODS HALF-YEAR REPORT 2020Management Review Our Performance Review Our Interim Consolidated Financial Statements
Our interim
consolidated
financial
statements Arla’s consolidated annual report is prepared in accordance with the International Financial Reporting
Standards (IFRS) as adopted by the EU and additional disclosure requirements in the Danish Financial
Statement Act. This interim consolidated report for 2020 is issued on a voluntarily basis. Management
has decided not to fully apply IAS 34. The interim consolidated report is prepared according to the same
accounting policies as applied in the consolidated annual report for 2019. No new IFRS standards with
effect from 1 January 2020 have been implemented. Refer to the management review for details on
how we have managed the Covid-19 and Brexit situations. Neither of these have triggered any
significant changes to our accounting estimates. For a detailed description of the accounting policies
and uncertainties in accounting estimates, please refer to our consolidated annual report 2019.
The interim
consolidated report
has not been subject
to an external audit.
16 ARLA FOODS HALF-YEAR REPORT 2020Management Review Our Performance Review Our Interim Consolidated Financial Statements
Income statement Comprehensive
income
(EURm) Half-year Half-year Develop- Full-year (EURm) Half-year Half-year Full-year
2020 2019 ment 2019 2020 2019 2019
Revenue 5,377 5,232 3% 10,527 Profit for the period 166 129 323
Production costs -4,203 -4,167 1% -8,325
Gross profit 1,174 1,065 10% 2,202 Other comprehensive income
Items that will not be reclassified to the income statement:
Sales and distribution costs -745 -701 6% -1,416 Remeasurements of defined benefit schemes 23 -41 -50
Administration costs -203 -187 9% -389 Tax on remeasurements of defined benefit schemes -3 9 11
Other operating income 17 23 -26% -64
Other operating costs -31 -39 -21% 39 Items that may be reclassified subsequently to
Share of results after tax in joint ventures and associates 6 14 -57% 34 the income statement:
Earnings before interest and tax (EBIT) 218 175 25% 406 Value adjustments of hedging instruments 25 -22 -22
Fair value adjustment of certain financial assets -1 -1 -2
Specification: Adjustments related to foreign currency translation -56 1 42
EBITDA 443 382 16% 837 Tax on items that may be reclassified to the income statement - - -1
Depreciation, amortisation and impairment losses -225 -207 9% -431 Other comprehensive income, net of tax -12 -54 -22
Earnings before interest and tax (EBIT) 218 175 25% 406
Total comprehensive income 154 75 301
Financial income 3 13 -77% 10
Financial costs -38 -44 -14% -69 Allocated as follows:
Profit before tax 183 144 27% 347 Owners of Arla Foods amba 151 68 289
Non-controlling interests 3 7 12
Tax -17 -15 13% -24 Total 154 75 301
Profit for the period 166 129 29% 323
Non-controlling interests -3 -7 -57% -12
Arla Foods amba's share of profit for the period 163 122 34% 311
17 ARLA FOODS HALF-YEAR REPORT 2020Management Review Our Performance Review Our Interim Consolidated Financial Statements
Balance sheet
(EURm) Half-year Half-year Develop- Full-year (EURm) Half-year Half-year Develop- Full-year
2020 2019 ment 2019 2020 2019 ment 2019
Assets Equity and liabilities
Non-current assets Equity
Intangible assets and goodwill 941 958 -2% 982 Common capital 1,927 1,784 8% 1,894
Property, plant, equipment and right of use assets 2,721 2,583 5% 2,710 Individual capital 464 432 7% 498
Investments in associates and joint ventures 460 453 2% 468 Other equity accounts -104 -111 -6% -72
Deferred tax 30 55 -45% 43 Profit for the period 163 122 34%- -
Pension assets 37 - - 16 Proposed supplementary payment to owners - - - 127
Other non-current assets 21 22 -5% 24 Equity attributable to the owners of Arla Foods amba 2,450 2,227 10% 2,447
Total non-current assets 4,210 4,071 3% 4,243 Non-controlling interests 46 53 -13% 47
Total equity 2,496 2,280 9% 2,494
Current assets
Inventory 1,154 1,133 2% 1,092 Liabilities
Trade receivables 771 979 -21% 889 Non-current liabilities
Derivatives 75 37 103% 20 Pension liabilities 235 244 -4% 249
Other receivables 252 257 -2% 240 Provisions 25 21 19% 23
Securities 425 454 -6% 435 Deferred tax 75 103 -27% 81
Cash and cash equivalents 150 115 30% 187 Loans 1,887 1,743 8% 1,951
Total current assets 2,827 2,975 -5% 2,863 Total non-current liabilities 2,222 2,111 5% 2,304
Total assets 7,037 7,046 0% 7,106 Current liabilities
Loans 740 1,123 -34% 776
Trade and other payables 1,123 1,130 -1% 1,158
Provisions 9 10 -10% 9
Derivatives 83 105 -21% 86
Current tax 9 5 80% 5
Other current liabilities 355 282 26% 274
Total current liabilities 2,319 2,655 -13% 2,308
Total liabilities 4,541 4,766 -5% 4,612
Total equity and liabilities 7,037 7,046 0% 7,106
18 ARLA FOODS HALF-YEAR REPORT 2020Management Review Our Performance Review Our Interim Consolidated Financial Statements
Equity
Common capital Individual capital Other equity accounts
Total Equity after
special purposes
value adjustment
Non-controlling
non-controlling
non-controlling
Capital account
Supplementary
Delivery-based
Reserve for fair
value through
adjustments
Contributed
instruments
Total before
of hedging
Reserve for
Reserve for
Reserve for
certificates
the period
exchange
individual
individual
Result for
payment
interests
interests
interests
Injected
foreign
capital
capital
owner
OCI
(EURm)
Equity at 1 January 2020 885 1,009 271 68 159 127 -94 12 10 - 2,447 47 2,494
Profit for the period - - - - - - - - - 163 163 3 166
Other comprehensive income 20 - - - - - 25 -1 -56 - -12 - -12
Total comprehensive income 20 - - - - - 25 -1 -56 163 151 3 154
Payments to owners - - -10 -4 -7 - - - - - -21 - -21
Dividend to non-controlling interests - - - - - - - - - - - -4 -4
Supplementary payment related to 2019 - - - - - -127 - - - - -127 - -127
Foreign exchange adjustments 13 - - -2 -11 - - - - - - - -
Total transactions with owners 13 - -10 -6 -18 -127 - - - - -148 -4 -152
Equity at 30 June 2020 918 1,009 261 62 141 - -69 11 -46 163 2,450 46 2,496
Equity at 1 January 2019 928 886 222 72 162 290 -72 14 -31 - 2,471 48 2,519
Profit for the period - - - - - - - - - 122 122 7 129
Other comprehensive income -32 - - - - - -22 -1 1 - -54 - -54
Total comprehensive income -32 - - - - - -22 -1 1 122 68 7 75
Payments to owners - - -10 -4 -9 - - - - - -23 - -23
Dividend to non-controlling interests - - - - - - - - - - - -2 -2
Supplementary payment related to 2018 - - - - - -289 - - - - -289 - -289
Foreign exchange adjustments 2 - -1 -1 1 -1 - - - - - - -
Total transactions with owners 2 - -11 -5 -8 -290 - - - - -312 -2 -314
Equity at 30 June 2019 898 886 211 67 154 - -94 13 -30 122 2,227 53 2,280
19 ARLA FOODS HALF-YEAR REPORT 2020Management Review Our Performance Review Our Interim Consolidated Financial Statements
Cash flow
(EURm) Half-year Half-year Full-year (EURm) Half-year Half-year Full-year
2020 2019 2019 2020 2019 2019
EBITDA 443 382 837 Cash and cash equivalents at 1 January 187 119 119
Reversal of share of results in joint ventures and associates -6 -14 -34 Net cash flow for the year -36 -4 66
Change in net working capital -14 -76 79 Exchange rate adjustment of cash funds -1 - 2
Change in other receivables and other current liabilities 69 8 -37 Cash and cash equivalents at 30 June 150 115 187
Reversal of other operating items without cash impact 18 -51 16
Dividends received from joint ventures and associates 6 - 8
Interest paid -28 -33 -69 Free operating cash flow
Interest received 1 2 3 Cash flow from operating activities 477 204 773
Taxes paid -12 -14 -30 Operating investing activities -205 -201 -456
Cash flow from operating activities 477 204 773 Free operating cash flow 272 3 317
Investment in intangible fixed assets -29 -22 -52 Free cash flow
Investment in property, plant and equipment -193 -195 -425 Cash flow from operating activities 477 204 773
Sale of property, plant and equipment 17 16 21 Cash flow from investing activities -194 -338 -571
Operating investing activities -205 -201 -456 Free cash flow 283 -134 202
Sale of financial assets 11 20 37
Acquisition of enterprises 0 -163 -168
Sale of enterprises - 6 16 Strong operating cash flow
Financial investing activities 11 -137 -115
Cash flow from operating activities increased by EUR A supplementary payment of EUR 127 million from the
Cash flow from investing activities -194 -338 -571 273 million to EUR 477 million compared to EUR 204 2019 profit allocation was paid out in March 2020. Indi-
million in the first half of last year. The strong cash flow vidual capital of EUR 21 million were paid out to owners
Supplementary payment regarding the previous financial year -127 -289 -289 was a result of higher EBITDA. who either resigned from Arla or retired.
Paid in and out from equity regarding individual capital instruments -21 -23 -24
Cash flow from operating investment activities amounted The strong cash flow in the period resulted in a net
Paid out to non-controlling interests -4 - -15
to EUR -205 million which was consistent with the level reduction of interest-bearing debt amounting to EUR
Loans obtained, net -117 483 295 at first half of last year. Key CAPEX projects included the 261 million compared to end of last half-year. Cash and
Repayment of lease debt -33 -32 -66 capacity increase in mozzarella production at our site in cash equivalents was EUR 150 million, compared to
Payment to pension liabilities -17 -9 -37 Branderup, Denmark and the construction of our new EUR 115 million at the end of last half-year.
Cash flow from financing activities -319 130 -136 powder tower in Pronsfeld, Germany.
The cash flow developed better than expected and
Free operating cash flow totalled EUR 272 million both the leverage and the equity ratio at half year are
Net cash flow -36 -4 66
representing an improvement of EUR 269 million considered to be at healthy levels.
compared to the first half of last year.
20 ARLA FOODS HALF-YEAR REPORT 2020Management Review Our Performance Review Our Interim Consolidated Financial Statements
Revenue
Revenue up following sales of more branded products Revenue split by commercial segment, Revenue split by commercial segment,
Half-year 2020 Half-year 2019
Revenue increased by EUR 145 million or 2.8 per cent M&A activities in 2019 including the acquisition in
to EUR 5,377 million, compared to EUR 5,232 million in Bahrain, a later license agreement to sell and distribute
the first half of last year. Changed sales mix with higher Kraft branded cheese in MENA and the divestment
sales of branded products contributed to an increase of of the remaining Allgäu-activities contributed to a net
EUR 106 million while prices decreased revenue by EUR revenue increase of EUR 65 million.
28 million.
For more information on the development of our
commercial segments refer to the Financial review on 5,377 5,232
page 13. MILLION EUR MILLION EUR
Development in revenue Europe 59% Europe 60%
(EURm) International 19% International 16%
Arla Foods Ingredients 7% Arla Foods Ingredients 7%
Trading and other sales 15% Trading and other sales 17%
5,400 2 5,377
65
106 Revenue by commercial segment, Half-year 2020
5,300 (EURm)
5,232 -28
5,200
5,100 Europe Arla Foods Ingredients
3,178 360
HY 2019: 3,149 HY 2019: 352
5,000
19
s
x
A
cy
20
i
ce
M&
/m
n
20
20
pri
rre
me
HY
HY
Cu
les
lu
Sa
Vo
International Trading and other sales
1,024 815
HY 2019: 839 HY 2019: 892
21 ARLA FOODS HALF-YEAR REPORT 2020Management Review Our Performance Review Our Interim Consolidated Financial Statements
Costs
Calcium continues to deliver cost savings Operational costs split by functions Half-year Half-year
(EURm) 2020 2019
Operational costs amounted to EUR 5,151 million com- The cost related to weighed-in raw milk increased by
pared to EUR 5,055 million in the first half of last year, EUR 4 million. The prepaid milk price to farmer owners Production costs 4,203 4,167
representing an increase of 1.9 per cent. increased EUR 21 million compared to first half of last Sales and distribution costs 745 701
year. The costs of other milk decreased by EUR 17 million. Administration costs 203 187
The cost of production increased to EUR 4,203 million
Total 5,151 5,055
compared to EUR 4,167 million in the first half of last Sales and distribution costs increased primarily within
year. our International business due to higher activity level
while marketing spend was at the same level as the first Specification:
Excluding the cost of raw milk, the cost of production half of last year. Weighed-in raw milk 2,473 2,469
increased EUR 31 million to EUR 1,729 million Other production materials* 897 884
compared to EUR 1,698 million in the first half of last Administration costs increased by EUR 16 million Staff costs 667 625
year. The sales of more branded products resulted in primarily due to increased salary and IT costs. The cost
Transportation costs 323 328
additional cost. This was partly offset by cost savings of salaries includes the effect from a change in holiday
achieved through our transformation programme accrual principles in Denmark. Marketing costs 112 116
Calcium. Finally, production cost increased due to the Depreciation, amortisation and impairment 225 206
effect of M&A activities. Staff costs increased to EUR 667 million, compared Other costs** 454 427
to EUR 625 million in the first half of last year, due Total 5,151 5,055
to increased cost within production, insourcing of
distribution activities in the UK, higher sales activities
within International and M&A effect from the Bahrain Average number of full-time employees 19,610 19,016
acquistion in 2019.
*Other production materials includes packaging, additives, consumables and changes in inventory
**Other costs mainly includes maintenance, utilities and IT
Development in operational costs
(EURm)
5,200
49 -3 5,151
88 -42
5,150
Weighed-in raw milk Half-year Half-year
(EURm) 2020 2019
5,100 mkg EURm mkg EURm
5,055 4
5,050 Owner milk 6,360 2,228 6,332 2,207
Other milk 625 245 684 262
Total 6,985 2,473 7,016 2,469
5,000
19
st
A
y
20
lum o n
tm nd
nc
M&
co
ts
vo al c es i
e msts
20
20
es a
ix
en
rre
lk
inv ium
ing tion ang
HY
HY
Cu
Mi
re- Calc
lud era Ch
inc op
22 ARLA FOODS HALF-YEAR REPORT 2020Management Review Our Performance Review Our Interim Consolidated Financial Statements
Net working capital
Strong net working capital position Net working capital Half-year Half-year
(EURm) 2020 2019
Net working capital decreased by EUR 180 million to Provision for expected losses increased by EUR 5 million
EUR 802 million, corresponding to a decrease of 10 per to a level of EUR 17 million at 30 June 2020. Inventory Inventory 1,154 1,133
cent compared to the carrying amount at 30 June 2019. increased due to a slightly higher prepaid milk price and Trade receivables 771 979
higher volumes. Trade and other payables amounting to Trade and other payables -1,123 -1,130
Trade receivables decreased by EUR 208 million, which EUR 1,123 million was consistent with the level at
Net working capital 802 982
was driven by utilisation of trade receivables finance 30 June 2019.
programmes in the UK and Germany and by timing of
customer payments, which lead to fewer days outstanding We continuously strive to optimise our net working
in 2020 compared to 2019. capital positions through initiatives such as increased
use of global procurement agreements, optimisation Inventory Half-year Half-year
During the Covid-19 crisis we have carefully monitored of inventory levels, improved payment terms, as well as (EURm) 2020 2019
the development of trade receivable balances and not utilisation of financing programmes with customers and
experienced any significant adverse development in suppliers.
Inventory before write-downs 1,182 1,153
overdues.
Write-downs -28 -20
Total inventory 1,154 1,133
Raw materials and consumables 297 275
Work in progress 332 349
Finished goods and goods for resale 525 509
Net working capital Total inventory 1,154 1,133
(EURm)
1,500
1,175 1,220
1,091 1,141 Trade receivables Half-year Half-year
971 (EURm) 2020 2019
1,000
1,052 1,061
982
928 Trade receivables before provision for expected losses 788 992
802 Provision for expected losses -17 -13
500 Total trade receivables 771 979
HY 2016 HY 2017 HY 2018 HY 2019 HY 2020
Net working capital excluding payables related to owner milk
Net working capital
23 ARLA FOODS HALF-YEAR REPORT 2020Management Review Our Performance Review Our Interim Consolidated Financial Statements
Capital employed
Continued high level of investment Intangible assets and goodwill Half-year Half-year
(EURm) 2020 2019
The carrying value of non-current assets increased The recognised value of associates and joint ventures
to EUR 4,210 million compared to EUR 4,071 million was EUR 460 million compared to EUR 453 million Goodwill 668 679
30 June 2019. 30 June 2019. This primarily consists of the carrying Licenses and trademarks 84 90
values of investments in Mengniu and LRF. The Group’s IT and development projects 189 189
Intangible assets and goodwill reduced marginally proportionate share of the net asset value of COFCO
Total intangible assets and goodwill 941 958
compared to last year due to amortisation of trademarks including the investment in Mengniu was EUR 348
and foreign exchange rate effects. No impairment of million, compared to EUR 327 million 30 June 2019.
goodwill was made in the first half year of 2020. The carrying amount of the investment in COFCO
includes goodwill amounting to EUR 151 million. Property, plant and equipment and right of use assets Half-year Half-year
The carrying value of property, plant, equipment and (EURm) 2020 2019
right of use assets increased by EUR 138 million to EUR
2,721 million. Investments in the first half year amounted Land and buildings 971 911
to EUR 249 million while total depreciation was EUR 189
Plant and machinery 1,140 1,069
million, both consistent with the first half of last year.
Fixtures and fittings, tools and equipment 214 205
Assets in the course of construction 396 398
Total property, plant and equipment and right of use assets 2,721 2,583
Hereof right of use assets Half-year Half-year
Investments and depreciation of property, plant, equipment and right of use assets (EURm) 2020 2019
(EURm)
249 Land and buildings 127 93
250
56 Plant and machinery 16 24
222
Fixtures, fittings, tools and equipment 83 79
30
Total right of use assets 226 196
200 189
192 175 193 34
32
150 161 155
Associates and joint ventures Half-year Half-year
148 149 147 143 (EURm) 2020 2019
137
116
100 Share of equity in COFCO/Mengniu 197 179
Goodwill in COFCO/Mengniu 151 148
Share of equity in other associates 78 90
50 Recognised value of associates 426 417
Share of equity in other joint ventures 34 36
Recognised value of associates and joint ventures 460 453
0
HY 2016 HY 2017 HY 2018 HY 2019 HY 2020
Right of use assets Depreciation property, plant and equipment Investments property, plant and equipment
24 ARLA FOODS HALF-YEAR REPORT 2020You can also read