CURRENT TRENDS IN MOTORCYCLE-RELATED CRASH AND INJURY RISK IN AUSTRALIA BY MOTORCYCLE TYPE AND ATTRIBUTES
←
→
Page content transcription
If your browser does not render page correctly, please read the page content below

CURRENT TRENDS IN
                                     MOTORCYCLE-
                                     RELATED CRASH AND
                                     INJURY RISK IN
                                     AUSTRALIA BY
                                     MOTORCYCLE TYPE
                                     AND ATTRIBUTES

                                     Laurie Budd
                                     Trevor Allen
                                     Stuart Newstead
   MONASH
  UNIVERSITY                         November 2018
                                     Report No. 336
CURRENT TRENDS IN MOTORCYCLE-RELATED CRASH AND INJURY RISK IN AUSTRALIA BY MOTORCYCLE TYPE AND
                                                                                  ATTRIBUTES| 1
ACCIDENT RESEARCH CENTRE
                         REPORT DOCUMENTATION PAGE

        Report No.                 Date                     ISBN                        ISSN                       Pages
           336                 November 2018          978-1-925413-06-9           1835-4815 (online)                92

Title and sub-title:
CURRENT TRENDS IN MOTORCYCLE-RELATED CRASH AND INJURY RISK IN AUSTRALIA BY MOTORCYCLE
TYPE AND ATTRIBUTES
Author(s):
L.Budd, T.Allen, & S. Newstead
Sponsoring Organisations - This project was funded as contract research by the following organisations: Transport for
New South Wales, New South Wales State Insurance Regulatory Authority, Royal Automobile Club of Victoria, NRMA
Motoring and Services, VicRoads, Royal Automobile Club of Western Australia, Transport Accident Commission, New
Zealand Transport Agency, the New Zealand Automobile Association, Queensland Department of Transport and Main
Roads, Royal Automobile Club of Queensland, Royal Automobile Association of South Australia, South Australian
Department of Planning, Transport and Infrastructure, Accident Compensation Corporation New Zealand, and by grants
from the Australian Government Department of Infrastructure, Regional Development and Cities and the Road Safety
Commission of Western Australia.

Abstract:
The purpose of this study was to characterise current and future motorcycle related road trauma to guide effective safety
interventions and future research. Police reported crash data for South Australia, Western Australia, Queensland, Victoria and
New South Wales and registration data for Victoria and New South Wales for the years 2005 to 2014 were matched with
Redbook model types and Road Vehicle Certification Scheme (RVCS) motorcycle characteristic data after decoding models
from vehicle identification numbers. These data sources were combined to analyse trends by attributes for injury crashes,
registered vehicles and crash rates per registered vehicle. Analysis also considered the odds of a fatal or serious injury
outcome given involvement in an injury crash.
Average crash risks per registered motorcycle were 1% per year for injury crashes and 0.5% per year for a fatal or serious injury
crashes with just under half of all reported motorcycle injury crashes resulting in fatal and serious injuries, around twice the rate
for cars. Injury crashes in rural and remote regions occurred at higher proportions than expected. Thirty-five percent of injury
crashes (and 40% of fatal and serious injury crashes) were in rural or remote regions and just under 30% (and just over 30% for
fatal and serious injury crashes) occurred in speed zones of 80 km/hr or more. The odds of a more serious injury crash were
48% higher if the crash region was remote (relative to rural). Over 50% of motorcycle injury crashes were multi-vehicle and
outcomes for this crash type were more likely to be fatal and serious than for single vehicle crashes. For the 20% of injury
crashes which involved one vehicle turning in front of another, the odds of a more severe outcome were about twice that for a
single vehicle injury crash. Single vehicle crashes had 30% lower odds of a more serious injury outcome if the vehicle remained
on the carriageway. While the proportion injury crashes involving older riders (60+ years) was small, this proportion doubled
over 10 years (to 7%) and their injury outcomes were poorer.
A unique feature of the study was the ability to study factors affecting crash risk and injury outcomes for motorcyclists related to
motorcycle type and other attributes including engine capacity and power to weight ratio. Crash rates and injury outcomes
varied significantly by motorcycle type. Furthermore, those motorcycle types with the highest crash risk and highest risk of
serious injury outcomes, namely sports motorcycles, are becoming more prevalent in the fleet, which is adversely affecting
motorcycle safety. Further adverse effects on motorcycle safety are stemming from the trend to increasing power to weight ratio
of newer motorcycles, which has shown a significant association with more severe injury outcomes in a crash. Analysis results
also suggest that the effectiveness of the LAMS criteria could also be improved by considering motorcycle type in the restriction
criteria.
Suggested countermeasures include addressing motorcyclist conspicuity and vulnerability, reduced speed limits where
appropriate in higher speed zones and remote areas, licensing and speed enforcement, vehicle safety technologies and
motorcyclist focussed road infrastructure improvements.
Key Words:                                                    Disclaimer
   Motorcycle injury crash risk                                   This report is disseminated in the interest of information
   Vehicle characteristics, LAMS, type,                           exchange. The views expressed here are those of the
   Countermeasures                                                authors, and not necessarily those of Monash
                                                                  University

  Reproduction of this page is authorised.                                   Monash University Accident Research Centre,
                                                                    Building 70, Clayton Campus, Victoria, 3800, Australia.
                                 www.monash.edu.au/muarc             Telephone: +61 3 9905 4371, Fax: +61 3 9905 4363

                                                                        MONASH UNIVERSITY ACCIDENT RESEARCH CENTRE | 2
PROJECT SPONSORED BY

CURRENT TRENDS IN MOTORCYCLE-RELATED CRASH AND INJURY RISK IN AUSTRALIA BY MOTORCYCLE TYPE AND
                                                                                  ATTRIBUTES| 3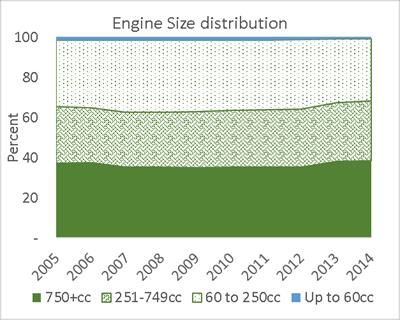
PREFACE
Project Manager / Team Leader:
A/Prof Stuart Newstead
Research Team:
Laurie Budd
Contributorship Statement
A/Prof Stuart Newstead: Project conception
Dr Trevor Allen: Review and management and final version of report
Laurie Budd: Assembly, analysis design, preparation and statistical analysis of datasets and first
draft of report
Ethics Statement
Ethics approval was not required for this project.
MONASH UNIVERSITY ACCIDENT RESEARCH CENTRE | 4
CONTENTS
CONTENTS ....................................................................................................................................................... 5

FIGURES ........................................................................................................................................................... 7

TABLES ............................................................................................................................................................. 9

ACKNOWLEDGMENTS .................................................................................................................................. 10

EXECUTIVE SUMMARY ................................................................................................................................. 11

PART 1 INTRODUCTION ............................................................................................................................. 17

PART 2 DATA ............................................................................................................................................... 18

            2.1       RVCS and Redbook data ........................................................................................................ 18
            2.2       Registration data ...................................................................................................................... 18
            2.3       Crash data ............................................................................................................................... 19
PART 3 METHODOLOGY ............................................................................................................................ 21

            3.1       Crash covariates used in crash severity analyses................................................................... 23
PART 4 RESULTS ........................................................................................................................................ 25

            4.1       Summary – Descriptive Analysis ............................................................................................. 25
            4.2       Summary – Logistic Regression Analysis ............................................................................... 27
            4.3       Changes in registrations (VIC and NSW) and injury crash rates and risk over time ............... 31
            4.4       Effects of jurisdiction ................................................................................................................ 35
            4.5       Effects of year of manufacture ................................................................................................. 35
            4.6       Effect of engine size ................................................................................................................ 43
            4.7       Effect of power-to-weight ratio ................................................................................................. 47
            4.8       Effect of LAMS status .............................................................................................................. 50
            4.9       Effect of Redbook type ............................................................................................................ 51
            4.10          Effect of engine capacity and Redbook type ....................................................................... 55
            4.11          Effect of rider attributes ........................................................................................................ 56
            4.12          Effect of crash location ........................................................................................................ 63
            4.13          Effect of crash conditions ..................................................................................................... 68
            4.14          Effect of crash types ............................................................................................................ 71
PART 5 DISCUSSION .................................................................................................................................. 77

            5.1       Limitations of using registrations as the measure of exposure ............................................... 77
            5.2       Overall trends in crashes and crash/crash severity risk .......................................................... 77
            5.3       Multi-vehicle crashes ............................................................................................................... 78
            5.4       Single-vehicle crashes ............................................................................................................. 79
            5.5       Overall trends in motorcycle attributes: registrations and risk ................................................. 80
            5.6       Safest motorcycle types ........................................................................................................... 80
            5.7       Least Safe Motorcycle Types .................................................................................................. 81
            5.8       LAMS status............................................................................................................................. 81
            5.9       Riders ....................................................................................................................................... 82
            CURRENT TRENDS IN MOTORCYCLE-RELATED CRASH AND INJURY RISK IN AUSTRALIA BY MOTORCYCLE TYPE AND
                                                                                              ATTRIBUTES| 5
PART 6 CONCLUSIONS .............................................................................................................................. 83
PART 7 REFERENCES ................................................................................................................................ 84
PART 8 APPENDICES .................................................................................................................................. 85
8.1 Logistic Regression Modelling details ..................................................................................... 85
8.2 Correlations.............................................................................................................................. 85
8.3 Linearity of continuous variables within the logistic relationship ............................................. 86
8.4 Effect of Registration Year on Injury Crash Risk ..................................................................... 86
8.5 Alternative modelling of Redbook types .................................................................................. 88
8.6 Frequency of Redbook types by jurisdiction ............................................................................ 91
MONASH UNIVERSITY ACCIDENT RESEARCH CENTRE | 6FIGURES
Figure 1 Percent of crashed motorcycles matched with matching registration data ................................. 18
Figure 2 Injury crashes per 100,000 registered motorcycles (bars) and registered motorcycles (solid line)
in NSW and Victoria......................................................................................................................................... 31
Figure 3 Australian motorcycle injury crashes by severity and jurisdiction (2005 to 2014) ....................... 32
Figure 4 Predicted probability of an injury crash for each year, at average engine capacity and power-to-
weight ratios for NSW and VIC (alpha=0.05) .................................................................................................. 33
Figure 5 Predicted probability of a fatal or serious injury crash for each year, at average capacity and
power-to-weight ratios for NSW and VIC (alpha=0.05) ................................................................................... 34
Figure 6 Crash severity odds ratios for each registration year, relative to the base year of 2005 ............ 34
Figure 7 Crash severity odds ratios for each jurisdiction, relative to NSW ................................................ 35
Figure 8 Distribution of motorcycle age and year of manufacture amongst NSW and VIC registered
motorcycles in 2005 and 2014 ......................................................................................................................... 36
Figure 9 Odds of an injury crash for each year of manufacture relative to 1990 ....................................... 37
Figure 10 Odds of a fatal or serious injury crash for each year of manufacture relative to 1990 .................... 38
Figure 11 Odds of a more serious injury crash for each year of manufacture relative to 1990 ...................... 39
Figure 12 Injury and fatal and serious injury crash rates by motorcycle age and registration year ................ 40
Figure 13 Ten year average injury crash distribution by motorcycle age and rider licence type or engine size
......................................................................................................................................................................... 41
Figure 14 Ten year average injury crash rates per 100,000 registrations by motorcycle age and Redbook
type .................................................................................................................................................................. 42
Figure 15 Stacked distribution of engine size amongst RVCS matched registration data (2005 to 2014) and
Average Injury crash rates per 100,000 registrations by LAMS status and engine capacity .......................... 43
Figure 16 Injury and fatal and serious injury crash rates per 100,000 registrations by engine size categories
......................................................................................................................................................................... 44
Figure 17 Odds of an injury and of a fatal or serious injury crash for each engine size category relative to the
251-749 cc categories ..................................................................................................................................... 45
Figure 18 Predicted probability of an injury or fatal and serious injury crash by engine capacity for 2014 and
each jurisdiction, at average power-to-weight ratios (alpha=0.05) .................................................................. 46
Figure 19 Predicted probability of a more severe injury crash outcome by engine capacity for metropolitan
NSW in 2014 at reference covariate values and average engine power-to-weight ratio (alpha=0.05). Note:
Motorcycle engine capacities are typically range 50cc-1600cc....................................................................... 47
Figure 20 Stacked Distribution of power-to-weight ratio amongst RVSC matched registration data (2005 to
2014) and the Average Injury crash rates per 100,000 registrations by LAMS status and power-to-weight
ratio .................................................................................................................................................................. 47
Figure 21 Injury and fatal and serious injury crash rates per 100,000 registrations by power-to-weight ratio
categories (kW/t).............................................................................................................................................. 48
Figure 22 Predicted probability of an injury or fatal and serious injury crash by power-to-weight ratio for 2014
and each jurisdiction, at average engine capacity (alpha=0.05) ..................................................................... 49
CURRENT TRENDS IN MOTORCYCLE-RELATED CRASH AND INJURY RISK IN AUSTRALIA BY MOTORCYCLE TYPE AND
ATTRIBUTES| 7Figure 23 Predicted probability of more severe injury crash outcome by power-to-weight ratio (PWR) for
metropolitan NSW in 2014 at reference covariate values and average engine capacity (alpha=0.05) .......... 49
Figure 24 Injury and Severe Injury crash rates per 10,000 registrations by LAMS status and Redbook type 50
Figure 25 Injury and Severe Injury crash rates per 100,000 registrations by LAMS status ............................ 51
Figure 26 RVCS matched registration data (2005 to 2014) by Redbook type, percentage of all and counts
per registration year ......................................................................................................................................... 52
Figure 27 Injury crash rates per 100,000 registrations by Redbook type (2005 to 2014) ............................... 53
Figure 28 Odds of an injury crash by Redbook type (2005 to 2014) ............................................................... 54
Figure 29 Odds of a fatal or serious injury crash by Redbook type (2005 to 2014) ........................................ 54
Figure 30 Odds of a severe injury crash outcome by Redbook type (2005 to 2014) ...................................... 55
Figure 31 Proportion of crashes by rider attribute categories ......................................................................... 57
Figure 32 Proportion of crashes with licence type within a Redbook type by crash injury .............................. 58
Figure 33 Proportion of crashes with female riders and proportion of crashes of rider age groups within a
Redbook type by crash injury category: over 2004-2015 ................................................................................ 58
Figure 34 Injury Crash rates per 100,000 registrations for rider attributes by crash year ............................... 59
Figure 35 Average 10 year injury crash proportions for motorcycle age groups by rider sex and age ........... 60
Figure 36 Average 10-year injury crash rates per 100,000 registrations of same Redbook type by Rider age
......................................................................................................................................................................... 61
Figure 37 Average 10-year injury crash rates per 100,000 registrations of Redbook type by Rider sex ........ 62
Figure 38 LAMS Ratio of rider age grouped injury crash rates per registration: Approved to Not Approved 62
Figure 39 Odds ratio of a severe injury crash outcome by rider licence type ................................................. 63
Figure 40 Odds Ratio of a severe injury crash outcome by rider age, sex and helmet wearing status .......... 63
Figure 41 Proportion of injury crashes by crash location ................................................................................ 64
Figure 42 Crash rates per 100,000 registrations for crash location by crash year.......................................... 65
Figure 43 10-year average injury crash rates per 100,000 registrations by .................................................... 66
Figure 44 LAMS Ratio of location grouped injury crash rates per registration: Approved to Not Approved ... 67
Figure 45 Odds ratio of a severe injury crash outcome by crash location ...................................................... 67
Figure 46 Proportion of injury crashes by crash conditions ............................................................................. 68
Figure 47 Crash rates per 100,000 registrations for crash conditions by crash year ...................................... 69
Figure 48 LAMS Ratio of condition grouped injury crashes rates per registration: Approved to Not Approved
......................................................................................................................................................................... 70
Figure 49 Odds ratio of a severe injury crash outcome by crash conditions................................................... 70
Figure 50 Proportion of injury crashes by crash types .................................................................................... 71
Figure 51 Crash rates per 100,000 registrations for crash types by crash year ............................................. 72
Figure 52 Average 10-year injury crash rates per 100,000 registrations by Redbook type and crash type ... 73
MONASH UNIVERSITY ACCIDENT RESEARCH CENTRE | 8Figure 53 LAMS Ratio of crash type grouped injury crash rates per registration: Approved to Not Approved 73
Figure 54 Odds ratio of a severe injury crash outcome by multi and single vehicle crash types .................... 74
Figure 55 Odds ratio of a severe injury crash outcome by manoeuvre or object hit ....................................... 75
Figure 56 Specific type crash rates per 100,000 registrations (disaggregated) by Redbook type.................. 76
Figure 57 Odds of an injury crash and the odds of a fatal or serious injury crash, for each registration year, 87
Figure 58 Predicted probability of a severe injury crash outcome for each registration year and jurisdiction,
for metropolitan regions, at average capacity and power-to-weight ratios and reference values of other
covariates (alpha=0.05, model v) .................................................................................................................... 88
Figure 59 Odds of an injury crash by Redbook type (2005 to 2014) referenced against all other types ........ 89
Figure 60 Odds of a fatal or serious injury crash by Redbook type (2005 to 2014) using referencing against
all other types .................................................................................................................................................. 90
Figure 61 Odds of a more serious injury crash by Redbook type (2005 to 2014) using two different models of
referencing ....................................................................................................................................................... 90
Figure 62 RVCS matched registration data (2005 to 2014) by Redbook type and Jurisdiction ...................... 91
TABLES
Table 1 Percent match for RVCS data with NSW and VIC registrations (by year) ...................................... 19
Table 2 Percent contribution to whole injury crash dataset by Jurisdiction .................................................. 20
Table 3 Percent VIN decoded by Jurisdiction ............................................................................................... 20
Table 4 Percent VIN decoded by crash year for Western Australia ............................................................. 20
Table 5 Comparison of engine capacity in full and reduced (RVCS matched) logistic regression
(registration) data sets ..................................................................................................................... 21
Table 6 Motorcycle attributes used in registration data logistic regression models ..................................... 22
Table 7 Motorcycle attributes used in crash data logistic regression models .............................................. 23
Table 8 Risk Characteristics by Redbook type ............................................................................................. 30
Table 9 Injury crash Odds ratio reductions associated with engine capacity by type .................................. 56
Table 10 Serious and fatal crash odds ratio reductions associated with engine capacity by type ............. 56
Table 11 Goodness of fit statistics for Table 6 Logistic regression models ................................................ 85
CURRENT TRENDS IN MOTORCYCLE-RELATED CRASH AND INJURY RISK IN AUSTRALIA BY MOTORCYCLE TYPE AND
ATTRIBUTES| 9ACKNOWLEDGMENTS
The authors would like to acknowledge the assistance of A/Prof Michael Fitzharris and Dr Jason Thomson in collating the
motorcycle VIN data from RVCS, which informed the analysis dataset.
MONASH UNIVERSITY ACCIDENT RESEARCH CENTRE | 10EXECUTIVE SUMMARY
Introduction
Motorcycles have shown the fastest relative growth of all registered motor vehicles in Australia over the last 10 years.
The proportion of road fatalities and seriously injured road users that are motorcyclists has also increased in recent years
to 19% of all fatalities in 2016. The aim of this project was to characterise current trends in motorcycle related road
trauma to guide effective safety interventions such as targeted infrastructure improvements, rider education programs,
recommendation of vehicle safety features and licensing initiatives. A unique aspect of this project was the inclusion of
more detailed motorcycle characteristic information, including LAMS status, Redbook motorcycle type, and power to
weight ratio, in the analysis of injury crash risk. This was achieved by matching vehicle specification data to both
registration and police reported crash data.
Data and Methods
Police reported crash data for South Australia (SA), Western Australia (WA), Queensland (QLD), Victoria (VIC) and New
South Wales (NSW), and annual snapshots of registration data for Victoria and New South Wales, for the years 2005 to
2014, were matched with motorcycle type based on Redbook categories and other vehicle characteristics using a
process of Vehicle Identification Number decoding based on motorcycle attribute data from the Road Vehicle
Certification Scheme (RVCS). The combined dataset for the 10-year period was used to summarise trends by
motorcycle type and attributes for injury crashes, registered vehicles and raw crash rates per registered vehicle. Logistic
regression was used to estimate the odds of a severe injury crash outcome in the event of a crash. Crashes were
matched to vehicle registration data so that the odds of a fatal and serious injury crash or the odds of an injury crash per
registered vehicle year could also be estimated.
Evaluation of LAMS status, engine capacity, motorcycle year of manufacture, power-to-weight ratio and motorcycle type
as predictors of injury or fatal and serious injury crashes were made through logistic regression modelling. Correlations of
these covariates were examined; power-to-weight ratio (PWR) and engine capacity were not strongly correlated. This
meant that the combined predictive power of both power-to-weight ratio and engine capacity could be compared with the
predictive power of LAMS status or year of manufacture.
Key Results
Overall injury crash outcomes
1. Injury crash outcomes were worse for motorcyclists than drivers of other vehicle types, and this difference increased
over the 10-year period.
Adjusted for motorcycle attributes and year, the crash risk was approximately 1% per annum for an injury crash
and 0.5% per annum for a fatal or serious injury crash. Just under half of reported motorcycle injury crashes
resulted in fatal and serious injuries. In contrast, about one quarter of passenger vehicles from Police reported
injury crashes involved fatal and serious injury crashes.
The proportion of severe injury1 outcomes increased for motorcycle injury crashes over the 10-year period. In
raw terms, the ratio of fatal and serious to minor injury crashes increased from 0.8 to 1.0. When adjusted for
crash, rider and vehicle attributes, the odds of a severe outcome for an injury crash increased from 2010 and
peaked in 2013 at 1.83 times the 2005 odds ratio.
2. Injury crash outcomes differed significantly between state jurisdictions:
The number of motorcycle injury crashes increased in NSW over the ten years, whereas for other jurisdictions
this was not the case. Over the period, injury crashes in WA, VIC and SA were fairly stable and in QLD they
declined. When expressed relative to registration numbers (which increased over 10 years), there were overall
decreasing crash rates for NSW and VIC.
The odds of a more severe injury crash outcome were lower for SA and higher for QLD and VIC when
compared to NSW.
3. There were more motorcycle injury crashes than population proportions would predict in remote and rural areas but
this trend decreased over time.
35% of injury crashes (and 40% of serious injury crashes) were in rural or remote regions and just under 30%
(and just over 30% for fatal and serious injury crashes) occurred in speed zones of 80 km/hr or more.
Over the 10-year period the proportion of injury crashes in 50 km/h and lower speed zones increased.
1
Severe injury= fatal injuries and injuries requiring hospital admission.
Serious injury= injury requiring hospital admission.
CURRENT TRENDS IN MOTORCYCLE-RELATED CRASH AND INJURY RISK IN AUSTRALIA BY MOTORCYCLE TYPE AND
ATTRIBUTES| 114. Injury crash severity was higher in more remote regions and in higher speed zones.
The odds of a more severe injury crash were 48% higher if the crash region was remote (relative to rural).
The odds of a more severe injury crash were 49% higher if speed zone was 80 km/hr and over (relative to 60
and 70 zones).
Crash types, speed zones and road conditions
5. Serious injury outcomes for motorcyclists were less likely in lower speed, and intersection crashes 2.
The odds of a more severe injury crash outcome were lower by 12% if the crash was at an intersection (relative
to not at an intersection). Intersection crashes represented about 40% of all injury and serious and fatal injury
crashes.
The odds of a more severe injury outcome were lower by 11% (p Raw injury crash rates for riders aged 60 years and over doubled over the ten years.
The proportion of riders aged 60 years and older involved in injury crashes doubled (from 3% to 7%) over the
10-year period.
The odds of a severe injury crash outcome increased with rider age and were higher by 39% (p19. High power-to-weight ratio (PWR) motorcycles occupied a significant and increasing proportion of the motorcycle-
registered fleet, which is a concern due to observed associations between PWR and severe injury outcomes.
More than thirty percent of registered motorcycles had a power-to-weight ratio (PWR) exceeding the LAMS limit
of 150 kW/t.
The proportion of 350 kW/t registrations almost doubled over the 10-year period.
The injury and fatal and serious injury crash risks and the odds of a severe injury crash outcome were all found
to be associated with increasing PWR, although the estimated effects on crash severity were small within the
normal PWR ranges.
20. In the definition of LAMS status, the association between engine capacity and injury crash risk varied significantly
between different motorcycle types.
Engine capacity was found to be associated with increases to injury crash risk for some motorcycle types (e.g.
Naked, Sport, Off-road other) yet associated with decreases for others (e.g. Off-road Enduro). See Table 9 and
Table 10 for detail.
However, LAMS status was also found to be confounded with rider experience, so it is possible that the
motorcycle type effect was produced by types that were most popular amongst the inexperienced. Off-road
motorcycle injury crashes are also more likely to be under-reported.
21. While older motorcycles were not a large presence in the registered fleet, their prevalence was high amongst
crashes involving unlicensed and novice riders.
Motorcycles aged 16 years and over made up about 16% of registrations.
The injury crash rates for this group of older motorcycles remained lower than that of the other age groups over
the ten years.
This motorcycle age group was made up of the greatest proportion of unlicensed and learner riders and learner
rider injury crashes and this proportion increased over the 10-year period.
The odds on an injury crash decreased with each (more recent) year of manufacture after 2007, suggesting
safety benefit for newer motorcycles.
Suggested countermeasures
Road Users
1. Strategies to increase conspicuity of motorcyclists to other road users. Low conspicuity is associated with the risk of
collision (Oxley, 2011). Countermeasures to improve rider conspicuity so that multi-vehicle motorcycle injury crashes
are mitigated or reduced in severity include:
a. The use of daytime running lights (DRL) and modulating headlights are likely to have benefits. Road safety
regulations in some states of Australia (including NSW and Victoria) permit the use of modulating
headlights on motorcycles that meet specific requirements (e.g. Road Safety Regulations 2009 S.R. No.
118/2009). Further study is needed to establish efficacy with motorcycles on Australian roads.
b. Promotion of the use of high visibility clothing is recommended to increase rider physical conspicuity and
improve outcomes in low ambient light, glare and poor weather as well as in multi-vehicle crashes
generally. Wells et al (2004) showed that crash risk was higher for riders using darker helmets and that
riders wearing any reflective or fluorescent clothing had a 37% lower risk of crash related injury than other
riders. Scope for improvement was established in 2016 (Allen et al.) in findings that over half of passing
riders were wearing dark colours with no fluorescent or reflective surfaces.
c. Future evaluation of high visibility clothing and effects on injury crashes. Some jurisdictions (including
Victoria) already make the use of high visibility clothing a requirement for learner riders, making a future
evaluation of this policy using crash data possible. While the balance of current evidence suggests positive
benefits, preliminary results from the current MUARC case-control study did not show reduced injury crash
risk for those wearing high visibility clothing.
2. Licence refresher training for older riders, to pre-empt further increases in serious injury and fatalities for this group
due to changes related to the ageing rider population and their greater vulnerability. The Victorian older road user
study (2006-2015) found that older riders experienced growth in licensing of almost 300% and within the licensed,
the learner permits doubled over the period 2006 to 2015. Older motorcyclists were also more likely to ride on open
roads, which at higher speeds makes them more vulnerable. It also found them more likely to have injuries when
stopped or maneuvering. While a reduced crash risk has been associated with more years of on-road riding
experience in Victoria (Allen et al. 2017), preliminary data from the MUARC case-control study suggests that riders
returning from an extended break in riding (>12mths) are at increased risk of an injury crash. Thus, skill-based
training or education targeted for older returning riders may improve their crash risk and injury outcomes.
3. Promote the use of high quality protective clothing. This may include education strategies or introducing national
MONASH UNIVERSITY ACCIDENT RESEARCH CENTRE | 14standards for motorcycle protective clothing. A star rated system for motorcycle clothing is currently being
developed in Australia to help riders make informed choices.
4. Police continue with licence checking strategies to reduce the increasing prevalence of injury crashes involving
unlicensed riders and improve compliance to licensing requirements. Automatic Number Plate Recognition might
have particular benefits when applied to the motorcycle population.
5. Road user-based safety strategies should also accommodate and target female riders, given the growing
percentage of female riders and their increased representation in motorcycle injury crashes.
Speed related
6. Strategies to reduce vehicle travel and impact speeds. Motorcyclists are vulnerable to impacts with other vehicles,
the ground and road infrastructure (ETSC, 2008). Lower travel speeds decrease the severities of impact injuries
(ACEM 2004) and give riders and other road users more time to react to a situation. In Victoria, inappropriate rider
speed was found to be associated with other forms of rider error for multi-vehicle crashes (Allen et al, 2017). Thus
countermeasures to address the high proportion of injury crashes with severe outcomes generally include:
a. Identify appropriate advisory speeds and speed limits in high motorcycle exposure and crash risk areas,
especially at intersection and corner approaches, and employ speed lowering strategies where needed
(such as reduced limits or increased enforcement).
b. Police continue with, or increase frequency of, speed enforcement for all vehicle types, including camera
enforcement of motorcycles from the rear, and covers approaches to intersections (see above).
c. Intelligent Speed Adaption as a penalty for recidivist speeders (Oxley 2011, NSW Centre for Road Safety
2010) and for general use to help road users maintain speeds within limits may be useful. This requires
further evaluation.
Road infrastructure
7. Improvement of road infrastructure for motorcyclists in high-speed zones, on open roads in rural locations, and at
intersections (40% of injury crashes), including addressing turn-in-front-of (20% of injury crashes) injury crashes.
The road environment, (mostly in the form of design and maintenance issues), has been identified as a secondary
contributor to motorcycle crashes in 78% of cases and has been identified as a primary contributor in a higher
proportion of single vehicle than multi-vehicle crashes (Allen et al. 2017). Allen et al. (2017) identified common road
design issues were poor intersection design, poorly signed roads, reduced road widths and fixed obstructions.
Maintenance issues identified as most common included: loose material on the road and a poor road surface
condition. Infrastructure has been evaluated by MUARC for VicRoads and the TAC generally, but it may be
necessary to design an evaluation specific to motorcycles to find the most cost-effective infrastructure
improvements. In the recent Safer Road Infrastructure Project (SRIP) evaluation (Budd & Newstead 2016),
significant rider injury reductions (bracketed) were associated with the following treatments:
shoulder sealing (29%);
shoulder sealing and hazard removal (58%).
In the recent Safer Road Infrastructure Project (SRIP) evaluation, significant fatal and serious rider injury reductions
(bracketed) were associated with the following treatments:
intersections in metropolitan areas (61%)
rural road segment (52%)
shoulder sealing (41%)
traffic signal treatments (75%)
new traffic signal installations (91%)
right turn modification (63%)
installation of fully controlled right turn and extension/installation of right turn lane (80%)
Suggestions for road infrastructure countermeasures are:
a. Suitable barrier instalment to reduce run-off road injuries in targeted locations and bends (Oxley, 2011).
b. Skid resistant surfaces and improved road and shoulder surfaces generally to help motorcyclist maintain
control given the inherent instability of a two-wheeled vehicle.
CURRENT TRENDS IN MOTORCYCLE-RELATED CRASH AND INJURY RISK IN AUSTRALIA BY MOTORCYCLE TYPE AND
ATTRIBUTES| 15c. Dedicated turning lanes to reduce turn-in-front-of crashes.
d. Signs and shrubs that do not obscure motorcycles; visibility must be optimal (Doǧan et al, 2004), especially
in glary conditions.
e. Reduced speed limits on approach to complex intersections (Oxley, 2011).
f. Fully controlled signals for turns, to reduce turn-in-front-of crashes.
Vehicles
8. Promote or support motorcycle safety technologies that mitigate high-speed run-off road and cornering crashes as
well as intersection crashes. These may need further evaluation by simulation or by real-world crash analyses as
they penetrate the fleet.
a. Anti-lock braking systems (ABS) are the most recent well-developed motorcycle technology with strong
evidence of safety benefits (Rizzi et al, 2009 and 2015). The inherent instability of motorcycles is
exacerbated when braking (Oxley, 2011, Ouellet, 2006). Ineffective braking has been identified as a key
contributor to these crash types (Hawthorn et al. 1997, Allen et al. 2017). It is noted the braking
technologies need to work with other impact speed lowering strategies (discussed in point 2) including
inappropriate speed zones and travel speeds for both multi- and single vehicle crashes. ABS has recently
been mandated in Europe for all new motorcycles with greater than 125cc engine capacity. A similar
strategy is likely for Australia from 2019. Other strategies to increase uptake of ABS into the Australian
fleet are recommended.
b. Motorcycle Autonomous Emergency Braking (MAEB) is similar to the equivalent technology for passenger
cars (AEB). This is currently being developed and evaluated with positive preliminary findings (Savino
2013). Further support, development and evaluations are required before MAEB reaches the market.
c. Collision and hazard warning systems. Collision warning systems (CWS) can warn of impending collisions
and departures from lanes. An Advanced Rider Assistance System (ARAS) provides warnings to the rider if
their approach speed to a hazard is inappropriate, including curves and intersections. While these systems
offer potential based on the known contribution of human error (by other road users or riders) to serious
injury motorcycle crashes (Allen et. al, 2017), more work is needed to determine their effectiveness in
motorcycles and their acceptance by riders (Oxley 2011, SAFERIDER 2010, Huth & Gelau 2013).
d. Airbags may be associated with an overall benefit in reducing injury severity (Ulleberg, 2003). Further
research and development is also required.
9. Promote current and future safety technologies for other vehicle types that are likely to reduce prevalence of
crashes with motorcycles. Current technologies (e.g. AEB, ESC) are likely to reduce collisions with motorcyclists.
Future technologies that reduce fail-to-give-way errors by the other road user would offer significant potential for
reducing motorcycle injury crashes.
10. Further research on injury crash risks associated with engine size, rider experience and motorcycle type. This is
needed to validate the observed relationships of crash risks varying positively and negatively with engine size
depending on the type of motorcycle (Redbook). If valid, then there is opportunity to reduce injury outcomes of
novice riders by re-assessment of the LAMS to allow for engine capacities relevant to the motorcycle type.
MONASH UNIVERSITY ACCIDENT RESEARCH CENTRE | 16PART 1 INTRODUCTION
Motorcycles have shown the fastest relative growth of all registered motor vehicle types in Australia over the past 10
years. Exposure has increased significantly, with motorcycle registrations increasing by approximately 5% per year and
estimated kilometres travelled increasing by 4 per cent per year (BITRE, 2017). While the number of motorcycle
fatalities today is similar to ten years ago, the proportion of all road fatalities that are motorcyclists has increased over the
same period from 13% to 18% (based on 5-year averages, ABS, 2017). For every motorcyclist killed, 35 more are
hospitalised due to traffic related crashes. Motorcyclists accounted for just under 1 in 4 cases of traffic-hospitalised injury
in 2013, compared to 1 in 2 for passenger cars (BITRE, 2017). Therefore, while national trends in motorcyclist fatality
rates per registered vehicle have improved, the absence of a reduction in absolute number of fatalities and increased
proportion of all road-related serious injuries highlights a need to understand better the characteristics and trends of
these crashes, so that effective countermeasures can be developed.
The aim of the project was therefore to characterise current and future motorcycle related road trauma to guide effective
safety countermeasures such as targeted infrastructure improvements, rider education programs, recommendation of
safety features and licencing initiatives. In particular, the association of crash risk and motorcycles currently approved by
the Learner Approved Motorcycle Scheme (LAMS) was examined to establish its relevance to rider safety. Australian
Police reported motorcycle injury crash data as well as vehicle characteristics from registration data were used to
examine trends and crash risks for motorcycle crashes over a 10-year period (2005-2014). Odds ratios adjusted for
jurisdictions and registration years were also examined.
CURRENT TRENDS IN MOTORCYCLE-RELATED CRASH AND INJURY RISK IN AUSTRALIA BY MOTORCYCLE TYPE AND
ATTRIBUTES| 17PART 2 DATA
2.1 RVCS and Redbook data
Data for all motorcycles certified by the (Australian) Road Vehicle Certification Scheme (RVCS) over the period 1985 to
2015 were compiled by Monash University Accident Research Centre (MUARC) from the RVCS website4. These data
were merged with motorcycle classification data purchased from Redbook 5. The variables within this data were mostly
complete (not missing) for motorcycle VIN (Vehicle Identification Number), body type (e.g. “Solo”), engine capacity,
power, tare and Redbook type. Other variables such as engine type (e.g. “2ST”), ADR class and intake type were up to
30% missing, so were not used in this analysis.
The RVCS data were used to produce a list of unique 12 digit VINs that could be translated into make, model and variant
and associated other variables. Sometimes more than one variant, body type, engine capacity, power and tare were
associated with a unique 12 digit VIN. In these cases, the average, minimum and maximum values and multiple
Redbook categories were associated with the VIN. These VINs were used to decode crash and registration data into
makes and models and to associate other Redbook and RVCS variables. As the years of crash and registration data
surpassed the upper year of RVCS data, decoded data is richest in the years just prior to the upper limits (Table 1).
In the charts, tables and modelling which follow, cases with more than one Redbook type were counted in every category
that they appeared within unless otherwise stated.
In addition to the RVCS variables, the LAMS (Learner Approved Motorcycle Scheme) status as approved or not
approved was added as a variable according to the criteria defined on government web pages6.
2.2 Registration data
Motorcycle registrations over the period 2004 to 2016 were extracted from annual mid-year snapshots of registration
data from New South Wales (NSW) and Victoria (VIC) provided to MUARC for generating the Used Car Safety Ratings7.
A set of unique motorcycles (with information on years registered) was prepared for each jurisdiction. These two
registration sets were decoded and matched with RVCS and Redbook data. By using registration plate, VIN and year of
manufacture (YOM), these motorcycles could be matched with the respective crash data, enabling the associated RVCS
and Redbook data to also be matched to the crash data. Full VIN meant that YOM was not really needed for the
Victorian crash data matching, however, even with YOM, a 12 digit VIN and registration plate was not always unique for
the NSW registration data. When this occurred (NSW), the registration year was compared with the crash year to see
which non-unique motorcycle was the best match. Match success is presented in Figure 1.
Figure 1 Percent of crashed motorcycles matched with matching registration data
4
http://rvcs.infrastructure.gov.au/pls/wwws/pubrvcs.Notify_Search
5
This was done by J.Thompson for other projects.
6
https://www.sa.gov.au/topics/driving-and-transport/drivers-and-licences/motorcycle-licences/learner-approved-motorcycles
http://www.transport.tas.gov.au/__data/assets/pdf_file/0009/108477/MR42_10_14_fact_sheet_LAMS_approved_motorcycles.pdf
http://www.transport.wa.gov.au/mediaFiles/licensing/LBU_DL_B_LAMS_Fact_Sheet.pdf
http://www.rms.nsw.gov.au/documents/roads/licence/approved-motorcycles-for-novice-riders.pdf
https://www.qld.gov.au/transport/licensing/motorcycles/learner-approved
www.vicroads.vic.gov.au/licences/licence-and-permit-types/motorcycle-licence-and-learner-permit/approved-motorcycles-for-novice-
riders
7
http://howsafeisyourcar.com.au/Rating-Process/What-is-UCSR/
MONASH UNIVERSITY ACCIDENT RESEARCH CENTRE | 18Continuing from this matching, information on crashed motorcycles (year of crash, severity of crash, number of crashes
per year) was matched to the registration data, so that for each registration year, a motorcycle could be classed as
crashed or not for the purposes of logistic regression analysis.
Over the period, there were 668,075 unique NSW and 580,349 unique Victorian registered motorcycles, which translated
respectively to 447,987 and 379,168 cases (67% and 65%) with associated RVCS data. Table 1 depicts the proportions
matched by year.
TABLE 1 PERCENT MATCH FOR RVCS DATA WITH NSW AND VIC REGISTRATIONS (BY YEAR)
2005 2006 2007 2008 2009 2010 2011 2012 2013 2014
% of all with RVCS match 61 58 61 63 73 74 74 75 75 74
In addition to the RVCS source, engine size was a variable within the VIC registrations data. Where VIN decoding
produced a make and model, and where RVCS data matching came up with a missing engine size, the engine size from
VIC registrations information could be merged onto the same (RVCS) makes, models and VINs for NSW registrations.
A number of limitations to the registration data should be noted.
Motorcycles were identified within NSW registration data by a motorcycle indicator variable, and were easily
distinguished from passenger, plant and heavy vehicles. Motorcycles were identifiable with and without sidecars;
however, two wheeled vehicles could not be separated from three and four wheeled non-passenger vehicles.
Motorcycles were identified in a similar manner within the Victorian registrations, however, the number of wheels was
provided and three and four wheeled vehicles were excluded.
In addition, interrogation revealed that NSW motorcycle registrations (with no missing VIN) provided over 2007 to 2012
numbered almost double the corresponding motorcycle registrations reported for NSW in the Australian Bureau of
Statistics motor vehicle censuses. In this period, off-road motorcycle registrations were more than doubled, however
sports, road and cruiser motorcycles were also observed to increase by at least 40%. To address this limitation, the rate
of change in ABS recorded registrations were used to model the registration count for 2017 to 2012. This ‘ABS-adjusted’
count was used when analysing raw crash rates per registration. All charts using the adjusted counts are labelled as
such. When presenting raw crash rates per disaggregated registration data (, for example by engine size, year of
manufacture or Redbook type), data as provided were used, as it was not possible to adjust by registration attributes.
This will have the effect of reducing crash rates, over all years, or by year for 2017 to 2012, where the registration count
for the attribute is over represented. Crash risk measured from crashes matched to registration data will be less
susceptible to this bias because the registration year was included as a regression variable, so estimates were adjusted
for differences related to the year.
The use of registrations as a measure of exposure for injury crash risk estimates is also limited. This measure of
exposure does not account for kilometres travelled and thus over-estimates the risk for vehicles types that are garaged
for most days of the year (e.g. tourers), and under-estimates the risk for vehicles that spend most days on the road. In
addition, injury crashes involving recreational off-road motorcycling on unsealed roads (either on or off public roads) is
likely to be under-represented, due to the remoteness of crash location. This limitation is further discussed in Section 5.
2.3 Crash data
An analysis dataset was compiled from Police reported crash data from five Australian Jurisdictions, (Queensland (QLD),
NSW, VIC, South Australia (SA), and Western Australia (WA)) over the crash years 2005 to 2014 inclusive. This
compilation comprised 83,256 motorcycles involved in injury crashes (with at least one person injured in the crash). More
than half of the potential cases were from New South Wales and Victorian combined data (Table 2). Excluding Western
Australian data, about 80% of these motorcycles had a recorded VIN to decode, so that in excess of 60% of motorcycles
could be associated with motorcycle characteristics data obtained via RVCS (Table 3). For Western Australia, VINs
were only available for 21% of the data, and these were available only for specific crash years (
Table 4).
The VINs from both registration and crash data were decoded. The reasons generally for failure of VIN decoding
include: no VIN, unusual VIN (e.g. 00000N), incorrectly recorded VIN and VIN is not within the scope of the decoding
syntax. Minority makes, tricycles, quads and most vehicles with year of manufacture prior to 1990 are beyond the scope
of the VIN decoder.
CURRENT TRENDS IN MOTORCYCLE-RELATED CRASH AND INJURY RISK IN AUSTRALIA BY MOTORCYCLE TYPE AND
ATTRIBUTES| 19TABLE 2 PERCENT CONTRIBUTION TO WHOLE INJURY CRASH DATASET BY JURISDICTION
Frequency Percent
NSW 25,482 31
VIC 20,473 25
QLD 14,127 17
WA 17,594 21
SA 5,580 7
Total 83,256 100
TABLE 3 PERCENT VIN DECODED BY JURISDICTION
% with VIN %decoded % with RVCS data
NSW 79 73 59
VIC 89 84 68
QLD 81 75 60
WA 23 21 18
SA 86 80 65
Total 70 65 53
TABLE 4 PERCENT VIN DECODED BY CRASH YEAR FOR WESTERN AUSTRALIA
2005 2006 2007 2008 2009 2010 2011 2012 2013 2014
% with VIN decode 18 38 33 37 21 22 26 0 15 0
Injury crashes were further disaggregated into the categories: Fatal, Serious and Minor. Serious injury crashes involved
a person being hospitalised. Minor injury crashes involved no hospitalisations nor fatalities. The combination of fatal and
serious injury crashes combined is often given the title, severe injury crashes.
MONASH UNIVERSITY ACCIDENT RESEARCH CENTRE | 20PART 3 METHODOLOGY
Data were analysed by two methods. The first method, involved basic aggregations to describe trends in the combined
registration and injury crash data. The second method involved logistic regression analysis for estimations of relative
crash and injury risk.
For the chart presentations, injury crash data were aggregated across crash year and other variables, regardless of the
unique-ness of a motorcycle. If a motorcycle crashed twice in a year, it was counted twice as a crashed motorcycle. In
addition, for crashed motorcycle basic aggregates, motorcycles were not excluded if registration data could not be
matched. Motorcycles within the registration data were always unique within a registration year. Basic motorcycle
registration aggregates were created without excluding specific years of manufacture, however in order to establish the
uniqueness of a motorcycle, a VIN needed to be present. When presented data were disaggregated by RVCS variables,
aggregates obviously excluded motorcycle cases that could not be matched with RVCS data. Consequently, raw crash
risks presented from the basic aggregates were merely raw rates of injury crashes per registrations and were inclusive of
all available years of manufacture.
The dataset prepared for the logistic regression analysis needed only an indicator that an injury crash occurred for the
motorcycle within the registration year. Multiple crashes per year were not factored into the logistic regression analyses.
When logistic regression was undertaken to estimate crash risks per registered motorcycle, only crash data that matched
to registration data could be included. Logistic regressions were modelled with and without RVCS variables. When
modelling without RVCS variables, cases which did not match with RVCS data could be included. In order to make this
full set more comparable to the reduced set with fully RVCS matched cases, motorcycles with a year of manufacture
under 1990 (, representing 10% of registrations in a year with a recorded VIN) were excluded. Obviously, the reduced set
excluded cases which did not match to RVCS data, however, the reduced set also excluded cases with missing tare
weight, engine power and engine capacity. The full and reduced datasets were found to have very similar annual
distributions of many variables, including motorcycle age, jurisdiction and LAMS status. In addition, there were similar
distributions of injury and fatal/serious injury annual crash rates. The RVCS matched data (reduced) however, showed a
slight bias towards motorcycles with smaller engine capacities (Table 5).
TABLE 5 COMPARISON OF ENGINE CAPACITY IN FULL AND REDUCED (RVCS MATCHED)
LOGISTIC REGRESSION (REGISTRATION) DATA SETS
% of non-missing
Up to 60 to 251- 750+cc (missing)
Cases 8 60cc 250cc 749cc
Full 2,449,902 1.2 32.6 30.4 35.8 (2.7)
Reduced: 1,917,358 1.4 33.7 30.4 34.5
(RVCS matched and no missing)
Of the RVCS matched data with missing tare, power, type or engine capacity (13,266 cases), 96.4% were 1137cc Sport
type cycles and 97.7% were NOT learner approved motorcycles and the crash rates were higher than the set without
missing values: for fatal and serious crash rates, 36% higher, and for injury crash rates, 20% higher.
Two broad logistic models were employed; one to estimate the contribution of various factors on the odds of an injury
crash, and the second to estimate the contribution of various factors to the odds of a severe injury crash outcome given
that an injury crash had already occurred. The crash (and RVCS) matched registration dataset was used to model the
odds of an injury crash and the odds of a fatal and serious injury crash. These regression models could be adjusted for
variables found within RVCS and registration data, such as: registration year, jurisdiction and motorcycle attributes (year
of manufacture, engine size, tare weight, power and Redbook type). (RVCS matched) crash data were used to model
the odds of a severe injury crash outcome given an injury crash, and, in addition to registration year, jurisdiction and
motorcycle attributes, covariate adjustment by crash attributes could be made in these models. Crash covariates are
listed in Section 2.
Both of these broad types of logistic regression models were performed on full and reduced data sets: full being all
unique motorcycle cases for each year analysed with the restriction of a YOM of 1990 and greater; and reduced being a
further reduced dataset restricted to only RVCS matched data and no missing values for tare, power or size. Where
appropriate reduced datasets also excluded cases with a missing Redbook type.
8
A case here is a unique vehicle-year. Data is in long form with respect to year of registration.
CURRENT TRENDS IN MOTORCYCLE-RELATED CRASH AND INJURY RISK IN AUSTRALIA BY MOTORCYCLE TYPE AND
ATTRIBUTES| 21You can also read