Traffic Crash Characteristics in Shenzhen, China from 2014 to 2016
←
→
Page content transcription
If your browser does not render page correctly, please read the page content below
Traffic Crash Characteristics in Shenzhen, China from 2014 to 2016

Downloaded from: https://research.chalmers.se, 2021-11-09 23:17 UTC

     Citation for the original published paper (version of record):
     Li, G., Liao, Y., Guo, Q. et al (2021)
     Traffic Crash Characteristics in Shenzhen, China from 2014 to 2016
     International Journal of Environmental Research and Public Health, 18(3): 1-24
     http://dx.doi.org/10.3390/ijerph18031176

N.B. When citing this work, cite the original published paper.

research.chalmers.se offers the possibility of retrieving research publications produced at Chalmers University of Technology.
It covers all kind of research output: articles, dissertations, conference papers, reports etc. since 2004.
research.chalmers.se is administrated and maintained by Chalmers Library

                                           (article starts on next page)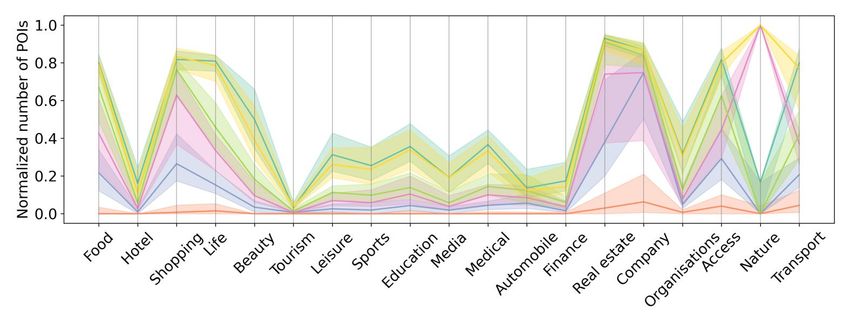
International Journal of
               Environmental Research
               and Public Health

Article
Traffic Crash Characteristics in Shenzhen, China from
2014 to 2016
Guofa Li 1 , Yuan Liao 2, * , Qiangqiang Guo 3 , Caixiong Shen 1 and Weijian Lai 1

                                           1   Institute of Human Factors and Ergonomics, College of Mechatronics and Control Engineering,
                                               Shenzhen University, Shenzhen 518060, China; guofali@szu.edu.cn (G.L.);
                                               1810273023@email.szu.edu.cn (C.S.); laiweijian2018@email.szu.edu.cn (W.L.)
                                           2   Department of Space, Earth and Environment, Division of Physical Resource Theory,
                                               Chalmers University of Technology, 41296 Gothenburg, Sweden
                                           3   Department of Civil and Environmental Engineering, University of Washington, Seattle, WA 98195, USA;
                                               guoqq17@uw.edu
                                           *   Correspondence: yuan.liao@chalmers.se

                                           Abstract: Road traffic crashes cause fatalities and injuries of both drivers/passengers in vehicles
                                           and pedestrians outside, thus challenge public health especially in big cities in developing countries
                                           like China. Previous efforts mainly focus on a specific crash type or causation to examine the crash
                                           characteristics in China while lacking the characteristics of various crash types, factors, and the
                                           interplay between them. This study investigated the crash characteristics in Shenzhen, one of the
                                           biggest four cities in China, based on the police-reported crashes from 2014 to 2016. The descriptive
                                           characteristics were reported in detail with respect to each of the crash attributes. Based on the
                                           recorded crash locations, the land-use pattern was obtained as one of the attributes for each crash.
                                           Then, the relationship between the attributes in motor-vehicle-involved crashes was examined using
                                           the Bayesian network analysis. We revealed the distinct crash characteristics observed between the

                                    examined levels of each attribute, as well the interplay between the attributes. This study provides an
Citation: Li, G.; Liao, Y.; Guo, Q.;
                                           insight into the crash characteristics in Shenzhen, which would help understand the driving behavior
Shen, C.; Lai, W. Traffic Crash            of Chinese drivers, identify the traffic safety problems, guide the research focuses on advanced driver
Characteristics in Shenzhen, China         assistance systems (ADASs) and traffic management countermeasures in China.
from 2014 to 2016. Int. J. Environ. Res.
Public Health 2021, 18, 1176. https://     Keywords: police-reported crashes; traffic safety in China; motor-vehicle; human driver
doi.org/10.3390/ijerph18031176

Academic Editors: Gabriella Mazzulla
and David Rojas                            1. Introduction
Received: 2 December 2020
                                                 Road traffic crashes are a major challenge to ensuring the public health of human
Accepted: 26 January 2021
                                           beings [1]. According to the Global Status Report on Road Safety 2018 [2] from the World
Published: 28 January 2021
                                           Health Organization, the number of deaths in road crashes is estimated to be 1.35 million
                                           per year. Usually, the number of deaths in road crashes is higher in big cities with higher
Publisher’s Note: MDPI stays neu-
tral with regard to jurisdictional clai-
                                           population density than in smaller cities [3,4]. It is estimated that 70% of the world’s
ms in published maps and institutio-
                                           population will live in cities by 2050 [3], challenging the transportation systems. Therefore,
nal affiliations.
                                           investigating the traffic crash statistics would help identify the traffic safety problems,
                                           based on which effective solutions (e.g., personalized advanced driver assistance systems,
                                           individualized driver training programs, autonomous driving systems, traffic management
                                           countermeasures) could be proposed to enhance traffic safety, especially in the big cities in
Copyright: c 2021 by the authors.          developing countries like China. In China, it has been reported that the fatality rate per
Licensee MDPI, Basel, Switzerland.         100,000 registered vehicles is 6.5 times the number in the U.S. and 13.6 times the number
This article is an open access article     in Japan [5], indicating that investigating the crash characteristics is urgently needed for
distributed under the terms and con-
                                           traffic safety enhancement.
ditions of the Creative Commons At-
tribution (CC BY) license (https://
creativecommons.org/licenses/by/
4.0/).

Int. J. Environ. Res. Public Health 2021, 18, 1176. https://doi.org/10.3390/ijerph18031176                    https://www.mdpi.com/journal/ijerph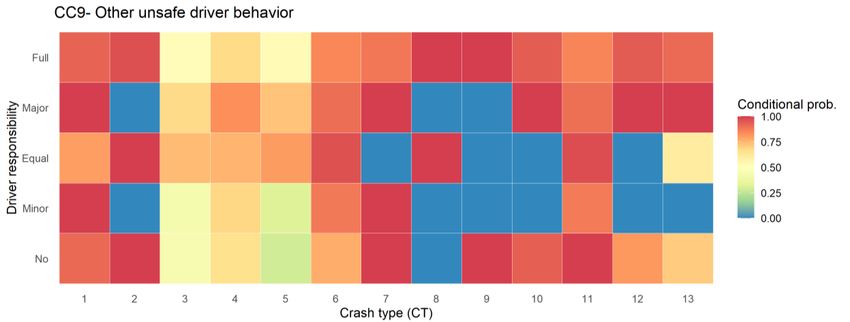
Int. J. Environ. Res. Public Health 2021, 18, 1176                                                                                    2 of 24

                                              Many previous studies have examined the crash characteristics in China in the past
                                        decade. A brief review of related studies is presented in Table 1. Among the various
                                        data sources for crash characteristics analysis, police-reported crashes are one of the most
                                        important data sources. The analysis presented in this study was also based on police-
                                        reported crashes. The summary is shown in Table 1 also shows that most of the studies
                                        only focus on a specific type of crashes (e.g., crashes between vehicles and pedestrians) and
                                        the number of studies on the traffic crash characteristics in China is still limited, especially
                                        in the big cities.
                                              Shenzhen, as one of the four biggest cities in China, has 13,020,000 registered residents
                                        on a total area of 1997 km2 in 2019. The median age of the population is 31 years old. The
                                        life expectancy of people is 83 years old. The main industries include high-tech companies,
                                        financial services, modern logistics, etc. In 2015, the total length of city roads was 6447 km
                                        and the road network density was 7.16 km/km2 in Shenzhen [6]. The number of owned
                                        motor vehicles was 0.28 per resident on average and the number of passenger-trips was
                                        2069 million from 15,120 buses [7]. However, the traffic problems in Shenzhen have been a
                                        major limitation of its rapid development [8]. To the best of our knowledge, the traffic crash
                                        statistics with respect to various attributes (e.g., road type, crash type, crash causation,
                                        driver information, land-use patterns) in Shenzhen have not been well-reported in the
                                        previous literature.
                                              Therefore, to fill the research gaps in the literature, the aim of this study is to investigate
                                        the traffic crash statistics in Shenzhen, China, based on the police-reported crashes from
                                        2014 to 2016. Specifically, we are interested in answering the research questions as follows:
                                              (1) What are the characteristics of traffic crashes in Shenzhen, such as road type, crash
                                        type, and driver profiles?
                                              (2) What are the land-use patterns of the occurred crashes?
                                              (3) What is the interplay between the main attributes of motor-vehicle-involved crashes?
                                              The main contributions of this study can be summarized as follows: (1) This study
                                        extends the analysis of traffic crash characteristics from single crash type to a more complete
                                        picture of the crashes to better identify the problems that need to be solved for traffic safety
                                        enhancement. (2) This study uses clustering techniques on open data of the points of
                                        interest in urban systems to get the land-use patterns of the study area (i.e., Shenzhen).
                                        This enriches the original crash records with land-use patterns as their spatial context,
                                        resulting in a more holistic set of crash records. (3) The interplay between the attributes
                                        in motor-vehicle-involved crashes is established by using the classical Bayesian network
                                        method. The revealed interplay contributes to a condensed picture of how different the
                                        crash attributes are associated with each other. (4) This study provides an insight into the
                                        crash characteristics in one of the four biggest cities in China. These contributions would
                                        help understand the driving behavior of Chinese drivers and guide the research focuses
                                        and traffic management countermeasures to improve traffic safety in Shenzhen.
Int. J. Environ. Res. Public Health 2021, 18, 1176 3 of 24
Table 1. A brief review of the studies on traffic crashes in China. Data source: a—yearbook; b—police-reported; c—self-collected; d—emergency medical center; and e—forensic institution.
Registered
Data Data
Reference Region in China Area (km2 ) Residents Focus
Year Source
(million)
[9] China 9,600,000 1300 1951–1999 a general crash statistics with no-specified crash type
[10] China 9,600,000 1300 2000–2005 a motorcycle accidents
[11] China 9,600,000 1300 2002–2006 b fatality crashes with no-specified crash type
[12] China 9,600,000 1300 1951–2008 a all reported crashes
[13] China 9,600,000 1300 2007–2013 b severe crashes with high numbers of fatalities and injuries
[14] China 9,600,000 1300 2009–2013 b crashes with more than 10 deaths with no-specified crash type
[15,16] Guangdong 179,700 115.21 2006–2010 b hit-and-run crashes; pedestrian-motor vehicle crashes
[17] Xi’an 10,752 10.2 2006–2011 b taxi crashes
[18] Hunan 211,800 69.18 2014 b motorcyclist crashes
[19] Jiangxi and Shaanxi 372,500 85.42 2003–2014 b fatigue crashes involving truck drivers
[20] Jiangxi and Shaanxi 372,500 85.42 2006–2015 b truck crashes on mountainous expressways
[21] Beijing, Shanxi and Chongqing 255,512 90.06 2006–2011 b crashes between passenger vehicles and pedestrians
[22,23] Beijing 16,410 21.53 2009–2012 b, c crashes between vehicles and vulnerable road users; side crashes between
vehicles at intersections
[24] Chaoyang, Beijing 470 2.585 2004 b general crash statistics with no-specified crash type
[25] Shanghai 6340 24.28 2008–2011 b drunk driving crashes
[26] downtown, Shanghai 645 - 2009 b pedestrian crashes
[27] Wuhan 8569 11.21 2008–2012 b fatality crashes with no-specified crash type
[28] downtown, Wuhan 8771 people per km2 2015 d severe crashes with no-specified crash type
[29] Taixing, Jiangsu 1172 1.18 2012–2014 b electric bicycle crashes
[30] Tianjin 11,966 15.61 2011–2013 e drunk driving crashes
[31] Changsha and Zhuzhou 23,081 12.41 2010–2016 b truck rear-end crashes
[32] Changsha 11,819 8.39 2014–2016 b pedestrian crashes
[33] Ningbo 9816 8.54 2011–2015 b crashes between vehicles and two-wheelers
[34] Shenzhen 1997 11.4 1994–2013 d mortality rate of road traffic accidents
[35] Shenzhen 1997 11.4 2010–2016 d weather and road traffic accidents
[8] Shenzhen 1997 11.4 2018 d the role of road traffic injuries in public safety
[36] Shenzhen 1997 11.4 2014 c child safety restraint and road safety
[37] Nanshan District, Shenzhen 187 1.3 2005–2014 b road traffic accidents and urban planningInt. J. Environ. Res. Public Health 2021, 18, 1176 4 of 24
2. Materials and Methods
2.1. Original Data Materials
This study was based on a three-year (2014–2016) dataset of police-reported traffic
crashes in Shenzhen, China. A traffic crash will get into the police records in the following
situations: (1) a crash happens and any of the involved drivers, passengers, or pedestrians
calls the police; (2) a crash happens but the involved traffic participants don’t call the police
and take a long time to negotiate without achieving an agreement, which results in severe
congestion and the congestion attracts the police to handle the dispute.
The data were obtained from the Road Safety Research Platform (RSRP) in China [38].
The RSRP is managed by the Traffic Management Research Institute of the Ministry of
Public Security, and its aim is to establish a resource sharing platform in the big data era
to better support road safety research, technological innovation, and transformation of
research findings to practical applications for road safety improvement in China. This
platform shares various publicly available traffic data including the traffic crash records in
Shenzhen from 2014 to 2016, the driving behavior data of older drivers, etc.
In total, 237,255 crashes were reported in the 3 years where 436,412 traffic participants
were involved in these crashes. Detailed information of each crash was recorded, as shown
in Table 2. The category details of each road type can be found in the Code for Transport
Planning on Urban Road (GB 50220-1995) [39] and the responsibility is determined by the
polices according to Article 76 of the Road Traffic Safety Law of the People’s Republic of
China [40]. In general, the recorded attributes of traffic crashes can be categorized into two
groups including crash-related attributes (# 1–8) and the attributes of drivers involved in
the crashes (# 9–12).
2.2. Land-Use Patterns of Crashes
Although the textual locations of the crashes were recorded, it is inconvenient to
analyze the geolocation characteristics using the original textual locations in Chinese. To
better understand the geolocation characteristics of the crashes, we firstly used reverse
geocoding to find the GPS coordinates of the crashes from Google Maps API. Next, in
order to aggregate the GPS coordinates of crashes into discrete zones, we divided the study
area into hexagonal zones with a short diagonal of 500 m for each of them. The obtained
hexagonal zones of the crashes were used to reveal the details of crashes that occurred
in each area. However, only knowing in which zone the crashes occur is not informative
enough from the perspective of policy-making [28]. Therefore, more details about the
land-use patterns (which are not included in the police records) of the crash occurrence
locations are needed.
Land-use pattern refers to how the land is used to support a variety of human activities.
For example, high-density land use is typical in the central city with various restaurants
and low-speed urban roads where the road users are mixed. Different types of land-use
generate trips that can be distinct from each other in terms of vehicle type, average speed,
and the interactions between drivers and pedestrians, which in turn have the potential to
cause distinct road accidents [41].Int. J. Environ. Res. Public Health 2021, 18, 1176 5 of 24
Table 2. Values of each recorded attribute.
# Attribute Acronym No. of Levels Level Description
1 Day of week - 7 (1) Mon; (2) Tue; (3) Wed; (4) Thu; (5) Fri; (6) Sat; (7) Sun
2 Time of day - 24 Hourly interval from 0 to 23
3 Weather - 6 (1) Sunny; (2) Cloudy; (3) Light rain; (4) Heavy rain; (5) Haze or fog; (6) Unknown
4 Road type RT 11 (1) Highway; (2) 1st class road; (3) 2nd class road; (4) 3rd class road; (5) 4th class road; (6) Urban
expressway; (7) Urban street; (8) Residential road; (9) Public parking space; (10) Public square;
(11) Other road; (12) Unknown
5 Crash causa- CC 20 (1) Motor vehicles not driving on the allowed lanes; (2) Unsafe lane change; (3) Unsafe U-turn;
tion (4) Not following traffic rules at signalized intersections; (5) Not yielding pedestrians or straight-
going vehicles while turning left; (6) Not yielding the right-hand-side vehicles at unsignalized
intersections; (7) Not backing a car following traffic rules; (8) Not following with a safe distance;
(9) Other unsafe driver behavior; (10) Not passing vehicles driving in the opposite direction fol-
lowing traffic rules; (11) Opening or closing doors to obstruct vehicles or pedestrians; (12) Driving
in the opposite direction; (13) Not driving on the right-side of a road; (14) Illegal use of dedicated
lanes; (15) Not following traffic signals; (16) Non-motor vehicles not driving on the allowed lanes;
(17) Illegal crossing of non-motor vehicles on lanes for motor vehicles; (18) Not yielding pedestrians
at the zebra-crossing area; (19) Others; (20) Unknown
6 Crash type CT 15 (1) Collision with fixed objects; (2) Collision with non-fixed objects; (3) Collision with motor
vehicles in transport; (4) Collision with stopped vehicles; (5) Other collision type between vehicles;
(6) Sideswipe crashes with pedestrians; (7) Other collision type between vehicles and pedestri-
ans; (8) Vehicle falling down cliffs; (9) Fire; (10) Passenger falling out of vehicles; (11) Crushing
pedestrians; (12) Rollover; (13) Other collision type between vehicles and humans; (14) Others;
(15) Unknown
7 Injuries - - -
8 Deaths - - -
9 Gender - 3 (1) Female; (2) Male; (3) Unknown
10 Age - - -
11 Vehicle type - 7 (1) Car; (2) Bus; (3) Truck; (4) Motorcycle; (5) Non-motor vehicle; (6) Others; (7) Unknown
12 Responsibility - 7 (1) Full responsibility; (2) Major responsibility; (3) Equal responsibility; (4) Minor responsibility;
(5) No responsibility; (6) Unable to determine; (7) UnknownInt. J. Environ. Res. Public Health 2021, 18, 1176 6 of 24
The land-use pattern of the study area in this paper is characterized by 19 types of
Points of Interests (POIs) including food, hotel, shopping, life services, beauty, tourism,
leisure, sports, education, culture, medical services, automobile services, finance, real
estate (office buildings, residential areas, dormitories), industrial zone, governmental
agencies and organizations, access (exits or entrances to highways, parking lots, etc.),
natural attractions, and transportation facilities. First, the Place API of Baidu Maps was
used to retrieve these POIs in each zone with a radius of 500 m centering its centroid as
the searching range. A vector of 19 POI type counts was thereby created to quantify the
land-use pattern of each zone. Next, Principle Component Analysis (PCA) was applied to
keep 95% of the variance after the normalization of Min-Max on the 19-POI vector of all
the crash zones. With the output of PCA, K-means algorithm was then used to cluster the
crash zones to minimize the squared error between the empirical mean of a cluster and
the vectors of crash zones in the cluster [42]. A variety of different values of K from 2 to 20
were examined to maximize the silhouette value, which is an indicator that quantifies how
well the samples were appropriately clustered [43]. The K value was finally determined by
balancing the number of clusters and the silhouette value. A more detailed description of
the application of K-means algorithm on POI clustering can be found in Gao, Janowicz,
and Couclelis (2017) [43]. Finally, the land-use pattern of each crash was obtained as one of
the attributes for further analysis to examine the interplay between the attributes.
2.3. Interplay between the Attributes Using Bayesian Network Analysis
Besides revealing the descriptive characteristics of crash occurrence, it is also important
to find out the interplay between these crash attributes because they are not always inde-
pendent of each other [44]. Understanding the interplay between the attributes supports
data-driven policy-making [45], e.g., how the land-use pattern and road type are associated
with a variety of crash causations and therefore, how to prevent them accordingly.
Therefore, based on the enriched crash attributes with land-use pattern, this study
further uses Bayesian networks to explore the traffic crashes of motor-vehicle drivers
regarding the interplay between the 12 attributes including day of week, time of day,
weather, crash causation, road type, gender, age, responsibility, vehicle type, injuries and
deaths, crash type, and land-use cluster. To conduct the Bayesian network analysis, the
values of the attributes need to be discretized. Therefore, the number of deaths plus
injuries is discretized into four levels (L1: 0; L2: 1∼4; L3: 5∼9; L4: ≥10), and driver age is
discretized into 13 levels by using a 5-year-interval for each level (L1: 70; L13: Unknown). It should be noted that 18 is
the legal age of being an adult in China, therefore the L1 and L2 levels of driver age are
defined asInt. J. Environ. Res. Public Health 2021, 18, 1176 7 of 24
criterion (BIC), with Tabu Search as the learning algorithm to simultaneously learn the
model structure and the parameters [46].
The source codes and the related documents are available online [50].
3. Results
To characterize the crash occurrence characteristics in Shenzhen, we firstly examined
the influence of the recorded attributes, and then investigated the land-use patterns of the
crashes to serve as an additional attribute. Based on the recorded and derived attributes,
Bayesian networks were used to explore the interplay between the attributes to present a
map on their interplay.
The traffic crash characteristics between these three years were examined and the re-
sults were almost the same across the three years with no statistical significance. Therefore,
we combined the crash records of all these three years for a general analysis.
3.1. Influence of the Crash Attributes
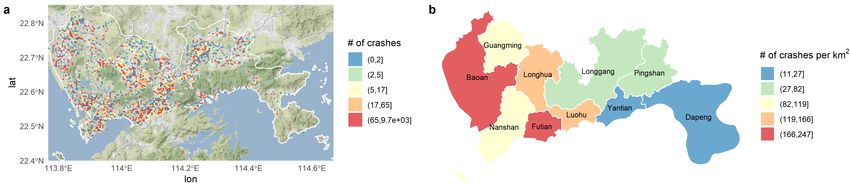
The study area was divided into hexagonal cells of a 500-m short diagonal. A total
of 1629 zones that have at least one crash record in each were obtained, which is shown
in Figure 1. In general, crashes happened per unit area in Futian District, Baoan District,
Longhua District, and Luohu District are more than the other areas because most companies
and facilities (e.g., hospitals, railway stations) are in these four districts, resulting in the
high travel demand in these areas. The detailed influences of the attributes on these crash
records are shown as follows.
Figure 1. Crash distribution in Shenzhen from 2014–2016. (a) Number of crashes in the hexagonal zones. (b) Number of crashes per
km2 by district.
3.1.1. Road Type
The crash statistics on different road types and the corresponding percentages are
shown in Table 3. The results show that crashes that happened on normal urban roads
overwhelm the crashes on other types of roads, accounting for 53.1% of all the crashes. The
number of crashes that happened on highways ranks second, accounting for 16.5% in the
three years. The numbers on other roads, city expressways, and 1st class roads account
for 11.0%, 5.2%, and 3.8% of all the crashes, respectively. Considering the percentages of
deaths and injuries on each road type, the results show that normal urban road/street is
the most important area that needs to be studied for safety enhancement, because it is the
most frequently used road type for travel in people’s frequently visited urban areas.Int. J. Environ. Res. Public Health 2021, 18, 1176 8 of 24
Table 3. The crash characteristics on different road types.
Crashes Deaths Injuries
# Road Type
No. % No. % No. %
RT7 Normal urban road/street 126,047 53.1 1045 67.2 130,566 71.7
RT1 Highway 39,137 16.5 108 6.9 4293 2.4
RT6 City expressway 12,360 5.2 62 4.0 4081 2.2
RT2 1st class road 8961 3.8 67 4.3 6150 3.4
RT10 Public square 1509 0.6 11 0.7 1428 0.8
RT8 Road in residential or indus- 821 0.3 14 0.9 891 0.5
trial communities
RT4 3rd class road 238 0.1 3 0.2 261 0.1
RT3 2nd class road 215 0.1 0 0.0 68 0.0
RT9 Public parking lot 98 0.0 5 0.3 82 0.0
RT5 4th class road 7 0.0 0 0.0 18 0.0
RT11 Other road 26,005 11.0 240 15.4 23,812 13.1
RT12 Unknown 21,857 9.2 0 0.0 10,431 5.7
3.1.2. Crash Type
The crash characteristics in different crash types are shown in Table 4. The crashes
between vehicles have three categories, collision with motor vehicles in transport (CT3),
collision with stopped vehicles (CT4), and other collision types between vehicles (CT5). In
other words, any crashes that do not meet the definitions of CT3 or CT4 will be categorized
as CT5. Among all the crash types, ‘collision with motor vehicles in transport’ is the
dominant one, accounting for 66.5% of all the crashes, 51.0% of the deaths, 66.2% of the
injuries. Among all the other crash types, pedestrian-related crashes only account for 7.0%
of all the crashes (CT6, 7, and 11), but lead to 30.6% of the deaths and 15.8% of the injuries,
which indicates that pedestrian safety is one of the most important research topics for
traffic safety enhancement in the current autonomous driving era. The other crash type
results in Table 4 show that collisions with other vehicles and fixed objects account for 7.4%
and 7.6% of all the crashes, respectively.
Table 4. The crash characteristics in different crash types.
Crashes Deaths Injuries
# Crash Type
No. % No. % No. %
CT3 Collision with motor vehicles in transport 157,715 66.5 793 51.0 120,561 66.2
CT1 Collision with fixed objects 18,080 7.6 10 0.6 3749 2.1
CT5 Other collision type between vehicles 17,650 7.4 2 0.1 14,665 8.1
CT6 Sideswipe crashes with pedestrians 16,076 6.8 302 19.4 28,167 15.5
CT4 Collision with stopped vehicles 2103 0.9 85 5.5 1382 0.8
CT2 Collision with non-fixed objects 840 0.4 0 0.0 86 0.0
CT12 Rollover 665 0.3 1 0.1 650 0.4
CT11 Crushing pedestrians 470 0.2 173 11.1 559 0.3
CT10 Passenger falling out of vehicles 315 0.1 0 0.0 579 0.3
CT13 Other collision type between vehicles and humans 292 0.1 0 0.0 214 0.1
CT7 Other collision type between vehicles and pedestrians 67 0.0 0 0.0 30 0.0
CT9 Fire 55 0.0 0 0.0 2 0.0
CT8 Vehicle falling down cliffs 32 0.0 0 0.0 37 0.0
CT14 Others 821 0.3 181 11.6 712 0.4
CT15 Unknown 22,074 9.3 8 0.5 10,688 5.9
To examine the influence of road type on the occurrence of different crash types, we
illustrated the number of crashes on different road types for all the crash types in Figure 2.
The Chi-square test was used to determine whether there is a statistical significance.
The results show that the crash number of road types differ by crash types (χ2 = 19,559,
p < 0.001). For example, more crashes between vehicles and pedestrians (CT6) happen onInt. J. Environ. Res. Public Health 2021, 18, 1176 9 of 24
normal urban roads/streets (RT7). Highway (RT1) is associated with more rollover crashes
(CT12) and crashes with non-fixed objects (CT2). Collisions between vehicles on a public
parking lot (RT9) are not as dominant as on other road types.
Figure 2. The number of crashes by crash type × road type. Unknown and others are removed.
3.1.3. Weather
Regarding weather shown in Table 5, 83.1% of the crashes happened on sunny days,
followed by light rain and cloudy accounting for 11.4% and 5.4%, respectively. A similar
trend can be observed in the numbers of deaths and injuries. The recorded number of
crashes in heavy rain is 54 during the three years with no deaths. The recorded crash
number in haze or fog weather is 102 with 2 deaths and 29 injuries in total. It should be
noted that there is no snow weather in Shenzhen because of the subtropics climate.
Table 5. The crash characteristics in different weather.
Crashes Deaths Injuries
Weather
No. % No. % No. %
Sunny 197,075 83.1 1225 78.8 158,482 87.0
Cloudy 12,869 5.4 146 9.4 8022 4.4
Light rain 27,120 11.4 182 11.7 15,505 8.5
Heavy rain 54 0.0 0 0.0 23 0.0
Haze or fog 102 0.0 2 0.1 29 0.0
Unknown 35 0.0 0 0.0 20 0.0
3.1.4. Crash Causation
The descriptive crash statistics with respect to different causations are shown in
Table 6. The results show that the top three causations of traffic crashes are other unsafe
driver behavior (CC9), not following at a safe distance (CC8), and unsafe lane change
(CC2). The percentages of crashes caused by CC9, CC8, and CC2 are 53.2%, 15.1%, and
9.8%, respectively. Among the other crash causations, it should be noted that non-motor
vehicles not driving on the allowed lanes (CC16) leads to 0.7% of all the crashes, but the
number of deaths caused by CC16 is 2.1%, three times the percentage of all the crashes.Int. J. Environ. Res. Public Health 2021, 18, 1176 10 of 24
Table 6. The crash characteristics with respect to different crash causations.
Crashes Deaths Injuries
# Crash Causation
No. % No. % No. %
CC9 Other unsafe driver behavior 126,263 53.2 909 58.5 111,140 61.0
CC8 Not following with a safe distance 35,879 15.1 45 2.9 12,733 7.0
CC2 Unsafe lane change 23,178 9.8 9 0.6 4444 2.4
Not yielding pedestrians or
CC5 straight-going vehicles while turning 7832 3.3 12 0.8 8410 4.6
left
Not passing vehicles driving in the
CC10 5635 2.4 24 1.5 6236 3.4
opposite direction following traffic rules
CC7 Not backing a car following traffic rules 3616 1.5 27 1.7 2158 1.2
Not yielding the right-hand-side
CC6 1930 0.8 1 0.1 1569 0.9
vehicles at unsignalized intersections
Non-motor vehicles not driving on the
CC16 1672 0.7 33 2.1 2827 1.6
allowed lanes
CC12 Driving in the opposite direction 1538 0.6 15 1.0 2817 1.5
CC3 Unsafe U-turn 1381 0.6 4 0.3 1581 0.9
CC14 Illegal use of dedicated lanes 1288 0.5 1 0.1 2776 1.5
CC13 Not driving on the right-side of a road 1235 0.5 5 0.3 2589 1.4
Illegal crossing of non-motor vehicles
CC17 1226 0.5 2 0.1 1602 0.9
on lanes for motor vehicles
Opening or closing doors to obstruct
CC11 694 0.3 0 0.0 1204 0.7
vehicles or pedestrians
Motor vehicles not driving on the
CC1 582 0.2 0 0.0 661 0.4
allowed lanes
CC15 Not following traffic signals 366 0.2 10 0.6 669 0.4
Not following traffic rules at signalized
CC4 362 0.2 8 0.5 595 0.3
intersections
Not yielding pedestrians at the
CC18 300 0.1 17 1.1 492 0.3
zebra-crossing area
CC19 Others 19,760 8.3 398 25.6 17,396 9.6
CC20 Unknown 2518 1.1 35 2.3 182 0.1
The number of crashes on different road types for all the crash causations are shown
in Figure 3a and the information for different crash causations in the various crash types
are shown in Figure 3b. The Chi-square test results show that the crash number of crash
causations vary across different road types (χ2 = 53,238, p < 0.001) and crash types
(χ2 = 30,304, p < 0.001). According to Figure 3a, a significant share of crashes on highways
(RT1) are caused by unsafe lane change (CC2), not following with a safe distance (CC8),
and other unsafe driver behavior (CC9). However, for urban roads such as the 1st class
road (RT2), the crash causation is dominated by the other unsafe driver behavior (CC9). As
for the crash type results in Figure 3b, most of the crash types are associated with other
unsafe driver behavior (CC9), and this dominance is more salient for the crashes with
fixed objects (CT1). For the crashes involving motor vehicles (CT3), the crash causation is
more diverse with unsafe lane change (CC2), not following a safe distance (CC8), and not
yielding while turning left (CC5) also frequently observed besides CC9.Int. J. Environ. Res. Public Health 2021, 18, 1176 11 of 24
Figure 3. The number of crashes by (a) crash causation × road type, and (b) crash causation × crash type. Unknown and others
are removed.
3.1.5. Month of Year, Day of Week, and Time of Day
The numbers of crashes from January to December are illustrated in Figure 4a. The
general trends are similar across the three years. As illustrated, the number of crashes in
February is the lowest point of a year because people in Shenzhen are mainly from other
cities in China and they will go back their hometown for the Chinese lunar new year in
February which is the most important festival in China. The numbers of crashes in January
and March are also not high because people may go back their hometown earlier and come
back to Shenzhen later. Similarly, the lower number in October is mainly because of the
National Day holiday at the beginning of October which is one of the longest holidays
in China.
The average numbers of crashes from Monday to Sunday are shown in Figure 4b. The
illustrated results show that the number of crashes is the highest on Friday and lowest on
Sunday. The numbers on the other days of week are similar. As for the effect of time of
day, the illustrated results in Figure 4c show that the number of crashes keeps at a high
level from 9 a.m. to 9 p.m. with two peaks (i.e., 11 a.m.–1 p.m. and 4 p.m.–7 p.m.) and a
trough around 2 p.m. The number continuously declines from 6 p.m. to 5 a.m., but rapidly
increases from 7 a.m. to 9 a.m. To further examine the day of week and time of day patterns,
the number of crashes with respect to these two attributes is illustrated in Figure 5. The
results show that the crash occurrence patterns from Monday to Thursday are similar.Int. J. Environ. Res. Public Health 2021, 18, 1176 12 of 24
Figure 4. The crash occurrence with respect to time. (a) Month of year; (b) day of week; (c) time of day. The shadow area indicates the
range from the minimum to the maximum.
Figure 5. The crash occurrence patterns across time of day and day of week.
3.1.6. Driver Gender
Among all the motor-vehicle drivers who were involved in the crashes, 69.1% of them
are male and 20.9% of them are female while the rest are unknown because the polices did
not record the gender information. According to the research report of metropolis’ road
traffic development in China [6], the male/female proportion of the complete proportion
in China is about 104:100 and the male/female proportion of all the drivers in China is
about 2:1. Table 7 shows the number of crashes male and female drivers involved in with
different responsibility levels. The Chi-square test shows that the driver responsibility
differs between the two genders (χ2 = 7888, p < 0.001). We define the responsibility-prone
drivers as the drivers with full, major, or equal responsibility in crashes. The results in
Table 7 show that the percentages of responsibility-prone drivers in the male and female
groups are 53.8% and 72.8%, respectively. However, it has been frequently reported
in previous studies that male drivers tend to perform more aggressively than female
drivers or at least as aggressively [51,52] with higher willingness for sensation seeking and
committing unsafe driving actions such as speeding [53,54]. It needs more investigation
into the observed gender difference here.Int. J. Environ. Res. Public Health 2021, 18, 1176 13 of 24
Table 7. The crash characteristics with respect to crash responsibility and driver gender.
Drivers Full Major Equal Minor No Unknown
Gender
% No. % No. % No. % No. % No. % No. %
Male 69.1 95,891 44.9 7451 3.5 11,743 5.5 5474 2.6 92,674 43.4 494 0.2
Female 20.9 40,982 63.4 2668 4.1 3422 5.3 566 0.9 16,930 26.2 116 0.2
Unknown 10.0 3371 11.0 205 0.7 233 0.8 26 0.1 642 2.1 26,306 85.5
3.1.7. Driver Age
Table 8 shows the number of crashes that drivers from different age groups are
involved in with different responsibility levels. The Chi-square test shows that the re-
sponsibility differs between the age groups (χ2 = 2506, p < 0.001). The age distribution
of drivers is generally consistent with the overall population in Shenzhen, however, the
peak age of drivers shifts slightly towards the middle (31∼35 vs. 26∼30). With the in-
crease of driver age, the percentage of responsibility-prone drivers in all the crash-involved
drivers gradually declines from the highest (61.4%) for group 19∼25 to the second-lowest
(39.5%) for group >70. The general trend in Table 8 demonstrates that the percentages
of responsibility-prone drivers in the age groups from 18 to 45 are all higher than 10%,
accounting for 77.7% in total of all the responsibility-prone drivers. The results suggest
that the driving safety of old drivers will become one of the most challenging problems of
driving safety in China in about 20 years.
Table 8. The crash characteristics with respect to crash responsibility and driver age. The column of Pop. shows the overall population’s
age structure.
Pop. Drivers Full Major Equal Minor No Unknown
Age
% No. % No. % No. % No. % No. % No. %
70 0.1 137 32.6 15 3.6 14 3.3 7 1.7 246 58.6 1 0.2
Unknown 0 9.5 2072 7.1 18 0.1 100 0.3 10 0.0 715 2.4 26,319 90.0
3.1.8. Vehicle Type
As for the influence of vehicle type on drivers’ crash involvement, the results are
presented in Table 9. The Chi-square test suggests that the responsibility differs between
the vehicle types (χ2 = 23,880, p < 0.001). It shows that the percentages of responsibility-
prone drivers for the car, bus, truck, and motorcycle groups are 49.0%, 34.7%, 10.2%, and
1.6%, respectively. Although the total number of responsibility-prone drivers in the bus
and truck group is less than the number of responsibility-prone car drivers, 54.6% of the
involved bus drivers and 50.9% of the involved truck drivers take full responsibility for the
occurrences, while the number for car drivers is 41.7%, lower than the numbers of bus and
truck drivers. The number of motorcycle drivers is 15.9%. Therefore, once a crash involves
a bus or a truck, the driver of that bus or truck is more likely to take full responsibility for
the crash occurrence than car drivers and motorcycle drivers.Int. J. Environ. Res. Public Health 2021, 18, 1176 14 of 24
Table 9. The crash characteristics with respect to crash responsibility and vehicle type.
Drivers Full Major Equal Minor No Unknown
Vehicle Type
% No. % No. % No. % No. % No. % No. %
Car 49.0 63,143 41.7 4789 3.2 7530 5.0 3023 2.0 56,186 37.1 16,715 11.0
Bus 34.7 58,575 54.6 4193 3.9 5747 5.4 1747 1.6 32,889 30.6 4195 3.9
Truck 10.2 16,035 50.9 854 2.7 1517 4.8 602 1.9 8673 27.5 3850 12.2
Motorcycle 1.6 790 15.9 397 8.0 457 9.2 600 12.1 1918 38.6 803 16.2
Others 4.5 1693 12.1 89 0.6 146 1.0 89 0.6 10,570 75.8 1353 9.7
3.2. Land-Use Pattern of Crashes
In total, 6 land-use clusters were obtained based on the POI profiles. See Figure 6. The
land-use clusters 4 and 5 are the first tier with the highest land-use intensity and diversity,
especially for residential and commercial activities. Land-use cluster 4 is also characterized
by a greater number of natural attractions than the other clusters. Clusters 1 and 6 form the
second tier with a moderate level of commercial land use but high residential intensity. As
the third tier, land-use clusters 2 and 3 are mainly associated with the rural and industrial
areas, respectively.
The descriptions of each of the land-use clusters are summarized in Table 10. The
results show that more than 50% of the crashes happened in the areas with high land-use
intensity (LUC5, 23.9%) or rural characteristics (LUC2, 27.7%). The industrial areas (LUC3,
16.2%) and the areas with a medium level of land-use intensity and many residential places
(LUC1, 12.9%) rank the third and fourth respectively with respect to the number of crashes.
The rural areas (LUC2) have the largest number of crashes despite all types of activities
(POIs) being sparse, which is different from the second-largest source LUC5 featured with
high density and diversity of human activities.
The distinct land-use patterns of LUC2 and LUC5 have an equally large number of
crashes, but in different traffic environments (road types). It turns out that 50% of the
crashes in both land-use clusters happened on normal urban road/street (RT7), however,
33% of the crashes in LUC2 happened on highways (RT1) as compared with only 4.7% of the
crashes in LUC5. On the contrary, there were 33% of the crashes in LUC5 happened on the
first-class roads (RT2) and the other roads (RT11). LUC5 has many places where a variety
of activities happen, therefore it tends to induce low-speed accidents due to congestion
and complex driving environment. Differently, LUC2 mainly includes highways, thus the
accidents happened in LUC2 are expected to be featured with high speeds.
The low-speed in LUC5 and the high-speed in LUC2 may lead to different crash
occurrence characteristics. Hence, we examined the differences in deaths and injuries in
these two land-use clusters. The results show that the number of deaths and the number of
injuries are 0.0071 and 0.63 per crash in LUC2, respectively. The numbers are 0.0068 and 0.83
per crash in LUC5. The Kolmogorov–Smirnov test results show that there is no statistical
significance on the number of deaths between LUC5 and LUC2. However, the number of
injuries in LUC5 is significantly greater than the number in LUC2 (D = 0.10, p < 0.001).
Therefore, our results show that the crashes that happened in high land-use intensity areas
and rural areas have a similar level of fatality rates while crashes that happened in the high
land-use intensity areas cause more injuries than the rural areas.Int. J. Environ. Res. Public Health 2021, 18, 1176 15 of 24
a
b
Figure 6. Land-use pattern results. (a) Land-use cluster (LUC) of the crash locations. (b) Normalized
number of Points of Interests (POIs) for each cluster. The shadow area indicates the range from the
25th percentile value to the 75th percentile value.
Table 10. The traffic crash facts with respect to land-use cluster.
Land-Use Crashes Deaths Injuries
Description
Cluster No. % No. % No. %
Medium level of land-use
LUC1 intensity with many 30,607 12.9 178 11.4 29,361 16.1
residential places
LUC2 Rural area 65,691 27.7 469 30.2 41,058 22.5
LUC3 Industrial area 38,396 16.2 310 19.9 32,486 17.8
High land-use intensity with
LUC4 18,220 7.7 75 4.8 9234 5.1
many natural attractions
LUC5 High land-use intensity 56,783 23.9 386 24.8 47,348 26.0
Medium level of land-use
LUC6 intensity with many natural 17,207 7.3 119 7.7 16,810 9.2
attractions
Unknown Unknown 10,351 4.4 18 1.2 5784 3.2
3.3. Interplay between the Attributes of Motor-Vehicle Driver Involved Crashes
To analyze the interplay between the examined crash attributes, we removed the
‘others’ and ‘unknown’ records for good descriptiveness of the obtained results. In total,
235,901 crash records with motor-vehicle-drivers were obtained to analyze the interplay
between the crash attributes based on Bayesian networks.
The obtained structure of the interplay between the crash attributes is shown in
Figure 7a. The results show that day of the week affects the occurrence time of the traffic
crashes. The crash occurrence dependence of the time of day on the day of the week (day
of week → time of day) has also been illustrated in Figure 4, where crashes tend to happen
more frequently on Friday through 4 p.m. to 8 p.m. as compared with the other days ofInt. J. Environ. Res. Public Health 2021, 18, 1176 16 of 24
the week. The results also illustrate that female and male motor-vehicle drivers tend to
involve in crashes at different times of day (time of day → driver gender). Besides, female
drivers have relatively concentrated vehicle types (i.e., cars), while male drivers overwhelm
the population of truck and bus drivers(driver gender → vehicle type). Moreover, driver
gender also affects the taken responsibility in crashes and the road type of the occurred
crashes. Driver age is also found to be associated with Vehicle type (driver age → vehicle
type), and vehicle type is associated with crash type and driver responsibility (vehicle type
→ crash type, driver responsibility).
The illustrated results in Figure 7a also show that the number of injuries and deaths is
affected by the crash type (crash type → injuries and deaths) and the role/responsibility of
motor-vehicle drivers (driver responsibility → injuries and deaths). For instance, the results
shown in Table 4 show sideswipe crashes with pedestrians (CT6), crushing pedestrians
(CT11), and collision with stopped vehicles (CT4) tend to cause a higher number of deaths
per crash as compared with the other crash types. Besides, the given results in Figure 7a
also show that the responsibility of motor-vehicle drivers is associated with the crash
type (driver responsibility → crash type). We can also observe that road type and crash
causation are associated with the land-use pattern of the occurred crashes(crash causation
→ land-use cluster, road type → land-use cluster).
For detailed interpretation of the relationship between crash causation, crash type, and
driver responsibility (highlighted in blue in Figure 7a), we further examined the conditional
probability of crash causation CC9 (53.2% of total crashes) as dependent on the crash type
and driver responsibility, as shown in Figure 7b. For the single-vehicle crash types (CT8
and CT9), almost all the crashes are caused by CC9 for the full-responsibility drivers. For
the crash types that involve multiple motor-vehicles/objects (CT3-5), the crash causation is
more complicated and only about half of the crashes are ascribed to CC9, different from the
other crash types. For crushing pedestrian crashes (CT11), most of the crashes with drivers
taking equal or no responsibility are due to CC9, while the other three responsibility groups
are with lower conditional probabilities for CT11.
a b
Figure 7. Interplay between the examined crash attributes. (a) Network structure with a highlighted attribute, crash causation.
(b) Conditional probability of CC9 on crash type and the responsibility of motor-vehicle drivers.
4. Discussion
4.1. Traffic Crash Characteristics in Shenzhen, China
Among all the crash types, ‘collision with motor vehicles in transport’ is the dominant
one, accounting for 66.5% of all the crashes, 51.0% of the deaths, 66.2% of the injuries.
NHTSA (2018) also reported that this crash type was the most common first harmful event
in fatal crashes (39.2% of all fatal crashes) [55]. These numbers show that ‘collision with
motor vehicles in transport’ challenges traffic safety the most and is urgently needed to
be solved in the vehicle and transportation safety technology communities. The statistics
in the U.S. show that collisions with fixed objects and non-collisions together accounted
for 39.0% of all fatal crashes in 2017, and the number for rollover crashes is 17.1%. TheseInt. J. Environ. Res. Public Health 2021, 18, 1176 17 of 24
numbers in the U.S. are much higher than the numbers in Shenzhen, China, indicating
that traffic management countermeasures and intelligent systems in vehicles should be
designed differently across countries.
According to the hourly records of weather in Shenzhen during 2014–2016 [56], the
weather was rainy for 26.4% of the time which is greater than the percentage of crashes in
rainy weather (i.e., 11.4%). However, it has been frequently reported in previous studies
that drivers are more likely to be involved in crashes on rainy days mainly because of the
degraded vision field [27]. This is not in contradiction with the results presented in Table 5
because people would avoid traveling on rainy days (especially in heavy rain) for safety if
applicable [57]. Therefore, the reduced traveling frequency on rainy days would probably
lead to a lower percentage of crashes on rainy days (11.4%) than the percentage of rainy
days in the three years (26.4%).
With respect to crash causation, ‘other unsafe driver behavior while driving’ (CC9)
ranks the highest, accounting for 53.2% of all the crashes and 58.5% of all the deaths in the
three-year dataset of this study. This causation covers driver distraction, drowsy driving,
drunk driving, driving on call, pedestrian or cyclist not following traffic rules, etc. However,
the exact detailed causations were not recorded by the polices. To further improve the
quality of police-reported crash records for driving safety enhancement in Shenzhen, traffic
policies should clearly specify the detailed causations in the crash records in the future.
Rear-end crashes have been well-reported as one of the most typical crash types, which
is complied with the results in this study that ‘not following with a safe distance’ (CC8)
ranks the second and accounts for 15.1% of all the crashes. Besides, frequent lane change
significantly challenges driving safety. The results presented in Table 6 show ‘unsafe lane
change’ (CC2) leads to 9.8% of all the crashes in the examined crash records. In general, the
top three causations (CC9, CC8, and CC2) account for 78.1% of all the crashes. The statistics
shown in Table 6 could provide an overview of the crash causations in Shenzhen and guide
the traffic-safety-related studies, policies, and practical countermeasures to address the
safety issues.
Usually, people drive to work around 8 a.m. and go back home around 4–7 p.m.,
resulting in congestions during morning and evening peak hours [58,59]. However, the
number of crashes that occurred from 7 a.m. to 9 a.m. is far fewer than the numbers
during the evening peak hours in this study. This may probably because drivers do not
have many negative emotions in the morning, while their emotions would be affected by
their experience during the day, resulting in negative (typically depressed and irritable)
emotion states while driving in the evening peak hours [60]. Previous studies have reported
that negative emotion states are closely related to aggressive driving which significantly
challenges driving safety [4,61]. This explains why there are more crashes during the
evening peak hours than during the morning peak hours. Differently, the number of
crashes in the evening peak hours on Friday was more than the other workdays probably
because of the more activities on Friday night [62]. NHTSA (2018) also reported that
Friday night is the deadliest periods throughout 2017 [55]. Fewer crashes occurred on
Saturday and Sunday morning, and the number of crashes on Sunday is the lowest in a
week probably because people tend to enjoy their stay at home on Sunday [62]. The found
crash characteristics with respect to the day of the week are consistent with the reported
trends in previous studies [58,63].
Considering the percentage of responsibility-prone drivers in each age group of the
crash-involved drivers, our results show that the number is the lowest for drivers younger
than 18 probably because minors would only be allowed to drive under the supervision of
their parents and the presence of parents degrades their aggressive driving because of the
monitoring effect [64], while the number reaches the highest for age group 19∼25 mainly
because of the no monitoring effect from their parents and drivers’ higher violation rates,
underestimation of various violation risks, lower level of motivation to follow traffic rules,
and overly involved in running red lights than older mature drivers [65]. Similarly, youngInt. J. Environ. Res. Public Health 2021, 18, 1176 18 of 24
male drivers involved in fatal collisions were twice as likely to be speeding as male driver
from the ages of 35 to 44 in the U.S., in 2013 [66].
Compared with the drivers of passenger cars, professional drivers such as truck
and bus drivers spend more time behind the wheel dealing with complicated driving
tasks, and they are regulated by higher requirements on transport efficiency and fuel
consumption. The higher requirements and long-time driving would lead the drivers to
be fatigue and/or distracted, which would increase the probability to be involved in full
responsibility crashes. Another reason leading to the higher involvement of truck and bus
drivers in full responsibility crashes is that the blind zones of buses and trucks are larger
than cars. Because objects (e.g., pedestrians, fixed objects on-road) in the blind zones of
a vehicle are difficult to be noticed by the driver [67], the larger blind zones of buses and
trucks would make the blind zone related crash risk higher than cars. This characteristic of
bus/truck driving makes it attention-demanding to take care of surrounding road users
and keep a safe distance from them. Therefore, ADAS systems for buses and trucks should
properly address the safety challenges in the blind zones to improve driving safety, such as
the blind zone warning systems.
In exploring the land-use patterns of the occurred crashes, we found that rural and
central urban areas are featured with more frequent crashes than the areas with other
land-use patterns. A study found that densely populated areas for public services may
increase the traffic risks [68]. This is partly consistent with our finding in this study that
the areas of high land-use intensity (LUC5) have the second-highest number of crashes.
Interestingly, the highest number of crashes occurred in the rural areas (LUC2) with low
land-use intensity in Shenzhen, different from the previous knowledge that rural areas
usually have fewer or, at most, a similar number of crashes [55]. The illustrated results
in Figure 6a show that the LUC2 mainly distributes along the coastline where people
in Shenzhen intensively go for walking every day. Typical characteristics of the areas
near the coastline in Shenzhen include that there is almost no commercial shops or stores
and the around city expressways and main roads are with higher speed limits (usually
60∼80 km/h), resulting in the crash locations being clustered as rural areas. The high
density of people activities and the high driving speed in LUC2 may be the leading causes
of the high numbers of crashes and deaths. Our statistical analysis results also show that
there is no statistical significance between LUC2 and LUC5 in Shenzhen regarding the
number of fatalities, but the number of injuries in LUC5 is significantly greater than the
number in LUC2. Differently, a meta-analysis on the relationship between speed and road
safety [69] show that lower speed has a more positive effect on reducing fatalities in rural
areas than in urban areas, but the lower speed has a more positive effect on reducing
injuries in urban areas than in rural areas. According to the findings in [69], the LUC5 with
lower driving speed should have fewer injuries than LUC2, which is different from our
findings. This may probably because of the differences between the real rural areas in [69]
and the coastline areas with rural characteristics in Shenzhen, but this needs further and
deeper investigations.
In our Bayesian network analysis, we summarize the relationship between the crash
attributes where the crash causation is dependent on the crash type and driver responsibility
is highlighted. The results suggest that the crashes between motor vehicles and pedestrians
are not always due to the misbehavior of the driver side. Even for those crashes where
drivers take part of the responsibility, there are also some unsafe behaviors from the
pedestrian side. Although the detailed unsafe behaviors of drivers and/or pedestrians
were not recorded, one of the major unsafe driver behaviors from the existing literature
is drunk driving [55]. Of the persons who were killed in crashes in 2017 in the U.S., 29%
died in alcohol-impaired driving crashes [55]. This again highlights the importance of
specifying and regulating the taxonomy of crash causations in police-reported crash records
in Shenzhen, China. Besides, our Bayesian network analysis results show that driver age
is found to be associated with vehicle type (driver age → vehicle type). This is intuitive
since most bus and truck drivers in China are young or middle-aged drivers. DifferentInt. J. Environ. Res. Public Health 2021, 18, 1176 19 of 24
vehicle types result in different patterns of crash type and driver responsibilities (vehicle
type → crash type, driver responsibility), confirming the results presented in Section 3.1.8
where we found that a bus or truck driver is more likely to take full responsibility of
the crash occurrence than car drivers and motorcycle drivers in bus or truck-involved
crashes. Besides, road type and crash causation are also found to be associated with land-
use pattern of the occurred crashes. This has been described and discussed in detail in
Section 3.2 For example, LUC5 indicates the high land-use intensity areas where urban
roads with low-speed-limit and crash with low-speed vehicles and pedestrians are the
typical characteristics.
4.2. Implications of the Findings in This Study
China has an emerging driver population and cultural values that result in aberrant
driving behaviors and scrambling to gain the right of way, producing a high number of
crashes [5]. Although it has been frequently reported in previous studies that attributes
including driver gender, age, day of the week, time of day, weather, etc. affected drivers’
involvement in crashes [52,55,70,71], few studies in the literature have investigated the
crash characteristics in China from multi-aspects based on policed-reported crash records.
Finding out these characteristics would help understand the behavior of Chinese road
users and guide the research/application focuses to further improve road safety from the
following aspects in general:
(1) Many missing values (the unknown values in the tables) or attributes (e.g., driving
exposure information, property loss) and un-clarified details (e.g., the exact causation in
the ‘other unsafe driver behavior’ category) can be observed in our presented results. To
avoid these problems in future crash records, portable electric devices can be developed
and deployed for each traffic police to record crash details with a list of required inputs
including the automatically recognized GPS information, the specified unsafe driver be-
havior (e.g., drunk driving), etc. This would add value to the collected data for traffic
characteristics analysis.
(2) Current ADAS systems have been extensively focused on the prevention of colli-
sions with a motor vehicle in transport (CT3). However, sideswipe crashes with pedestrians
(CT6) and crushing pedestrian crashes (CT11) have not been well addressed in the current
literature. Our crash type results show that CT6 and CT11 crashes accounted for 6.8% and
0.2% of all the crashes but caused 19.4% and 11.1% of all the deaths, respectively. Therefore,
pedestrian-related ADAS systems should be well developed to address the high death
numbers in pedestrian-related crashes. Besides, the selection of typical scenes is critical
for the development of ADAS systems [72,73]. The frequently observed crash causations
(e.g., not following with a safe distance, unsafe lane change), crash types (e.g., CT3, CT6,
CT11), occurrence locations (e.g., normal urban road/street) in this study could be selected
as the typical scenes in priority for the development of solutions to improve driving safety
in Shenzhen.
(3) Land-use pattern affects crash occurrence. Our results show that most of the crashes
happened in rural areas (LUC2) dominated by highway collisions in Shenzhen, different
from the second-ranking land-use cluster LUC5 (the areas of high land-use intensity).
LUC2 is with low land-use intensity and it mainly distributes along the coastline with
speed limits from 60∼80 km/h, while the LUC5 mainly distributes in the central urban
areas with extensive human activities. These results indicate that the traffic management
authorities in Shenzhen should design different strategies to prevent crashes in the areas
with different land-use patterns. For example, more deceleration zones and alerting signals
(e.g., flashing lights) can be considered in the areas where crashes frequently occur in
LUC2, while more guardrails can be used to regulate pedestrian behavior and to separate
motor-vehicles from pedestrians in LUC5.
(4) The Bayesian network analysis reveals the complex interplay between the examined
attributes of motor-vehicle crashes, complementing the single-attribute analysis. For
example, the interplay results show that vehicle type affects drivers’ responsibility inYou can also read