CFA Institute Research Challenge - Hosted by
←
→
Page content transcription
If your browser does not render page correctly, please read the page content below
CFA Institute Research Challenge
                                                                 Hosted by
                                                    CFA Society Taiwan
                                                National Taiwan University

The CFA Institute Research Challenge is a global competition that tests the equity research and valuation, investment report writing, and
presentation skills of university students. The following report was prepared in compliance with the Official Rules of the CFA Institute Research
Challenge, is submitted by a team of university students as part of this annual educational initiative and should not be considered a professional
report.

Disclosures:
Ownership and material conflicts of interest:
The author(s), or a member of their household, of this report does not hold a financial interest in the securities of this company.
The author(s), or a member of their household, of this report does not know of the existence of any conflicts of interest that might bias the
content or publication of this report.
Receipt of compensation:
Compensation of the author(s) of this report is not based on investment banking revenue.
Position as an officer or director:
The author(s), or a member of their household, does not serve as an officer, director or advisory board member of the subject company.
Market making:
The author(s) does not act as a market maker in the subject company’s securities.
Disclaimer:
The information set forth herein has been obtained or derived from sources generally available to the public and believed by the author(s) to be
reliable, but the author(s) does not make any representation or warranty, express or implied, as to its accuracy or completeness. The information
is not intended to be used as the basis of any investment decisions by any person or entity. This information does not constitute investment
advice, nor is it an offer or a solicitation of an offer to buy or sell any security. This report should not be considered to be a recommendation by
any individual affiliated with CFA Society Taiwan, CFA Institute or the CFA Institute Research Challenge with regard to this company’s stock.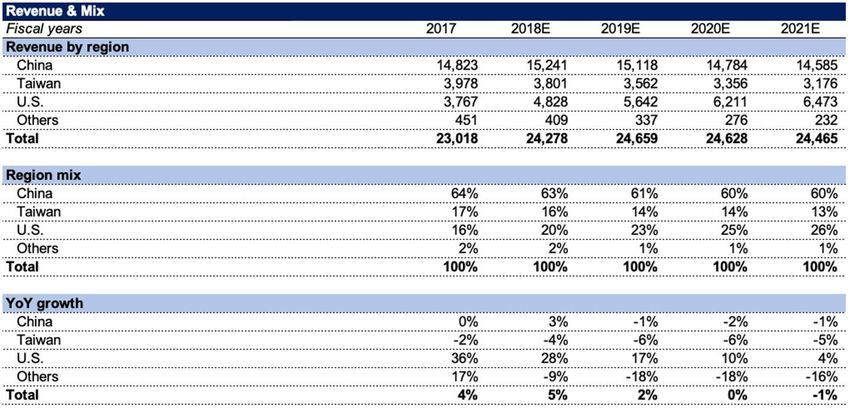
This report is published for educational purposes
only by students competing in The CFA Institute National Taiwan University
Research Challenge.
Equity|TWSE|Consumer Products|Consumer Staples 10 December 2018
Recommendation: Gourmet Master Co., LTD (2723 TT)
SELL When the Bakery Café Bakes in Caffeine Fading
We initiate coverage of Gourmet Master (GM) with a SELL rating and NT$190 target
Target Price NT$190
price, implying a 20% downside based on 20x 2019E P/E. Our 2019E EPS is 17%
Current Price (7 Dec.) NT$237 below the Street consensus.
Downside -20%
China (63% of total 2018E revenue): Pressures on revenue and operating margins
The China revenue growth has decelerated to 3% in 2018E from c.7% in 2016/17. We
Company Profile
expect revenue to further dip by -1%/-2% in 2019/20E in view of fading upsides from
NT$ 183.0 -
52-Weeks Price Range remodeling, online delivery competition, and China’s slower retail sales growth. We
NT$ 397.6
forecast GM’s per store sales decline in China will enlarge to 7% in 2019-20E, vs. 4%
Shares Outstanding 180M
in 2017-18E. Furthermore, start-up coffee brands like Luckin Coffee emerges as new
Market Cap. NT$ 42.7B threats to GM, as Luckin rapidly increases online visibility through heavy digital
USD/TWD (7 Dec.) 30.84 channel investment. We forecast the company’s operating margin in China will thus
Dividend Yield 2.3% decrease to 6% in 2019-20E, from c.10% in 2017-18E.
2018 P/E 24.8x
The US (20%): Slower store expansion due to aggressive competitors
Source: Bloomberg After stores increased from 40 to 55 in the US, GM’s US per store sales decreased by
c.12% over 2017-18E. We expect GM’s per store sales in the US to keep declining
Valuation Methodology Price (NT$) c.10% in 2019-20E due to elevating competition and cannibalization. Like GM, Paris
P/E 190 Baguette (PB) is an Asian bakery café in the US that aims to triple their US exposure
DCF 189 to 300+ stores by 2020E. We believe not only PB but further new entrants that
Target price 190 replicate GM’s business strategy will end up eroding GM’s market and slowing the
revenue growth almost half to 10% in 2020E, from 28% in 2018E.
Source: Team estimates
Taiwan (16%): Revenue to shrink amid fiercer competition
Since store format upgrade has ended in 1Q18, and organic growth loses its
Operating Margin and EPS Forecast
momentum, we expect GM’s per store sales in Taiwan to decrease by 9%/8% YoY in
15.0% 13
2019-20E, from 11%/9% in 2017-18E. Among the fierce competition, GM posts the
11 fewest registered members despite ongoing expansion. Compared with Taiwan coffee
10.0%
9 industry sales growing at 4% CAGR from 2012-17, we believe GM’s revenue growth
5.0% will fall to c.6% in 2019-20E because of failure to boost retention rates, from c.4% in
7
2017-18E.
0.0% 5
Initiate with NT$190 P/E-derived TP and SELL rating
We set GM’s one-year target price at NT$190, based on 20x 2019E EPS (at the lower
OPM (%; LHS) EPS (NT$; RHS)
end of P/E band), implying a 20% downside and cross-checked with DCF valuation. We
Source: Company data, Team estimates believe 20x P/E is fair due to GM's earnings downtrend in 2019E. We project that OPM
(peaked out in 3Q17 at 12.7%) would be 8.4%/7.0% in 2019/20E, and would result in
Stock Price Movement a -2% earnings growth in 2019E. Although the share price has undergone huge
12,000 500 correction this year, we believe the worst has not come yet, as the market has not
10,000 400 priced in vanishing competitive advantage due to rising engagement by other players
8,000
300 and the absence of moat.
6,000
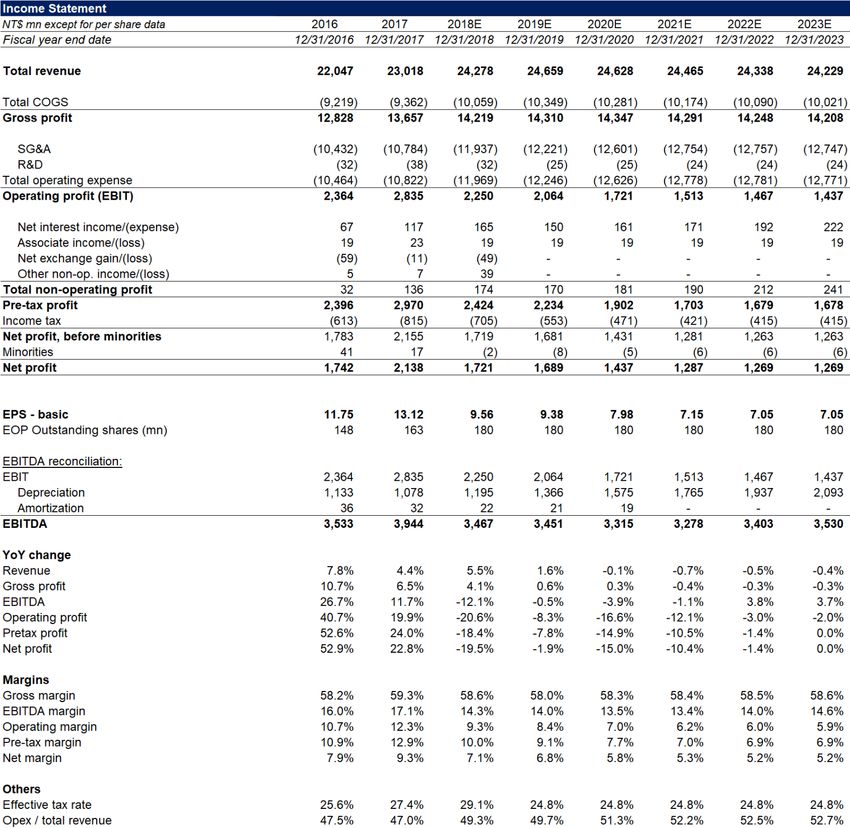
200 Gourmet Master’s Key Financials
4,000
2,000 100 Year 2017 2018E 2019E 2020E 2021E 2022E 2023E
0 0 Revenue (NT$mn) 23,018 24,278 24,659 24,628 24,465 24,338 24,229
Revenue YoY (%) 4.4 5.5 1.6 -0.1 -0.7 -0.5 -0.4
Gross profit margin (%) 59.3 58.6 58.0 58.3 58.4 58.5 58.6
Operating margin (%) 12.3 9.3 8.4 7.0 6.2 6.0 5.9
TWSE (LHS)
Net income (NT$mn) 2,138 1,721 1,689 1,437 1,287 1,269 1,269
Gourmet Master TWSE (LHS)
Net income YoY (%) 22.8 -19.5 -1.9 -15.0 -10.4 -1.4 0.0
Source: Bloomberg Earnings Per Share (NT$) 13.12 9.56 9.38 7.98 7.15 7.05 7.05
Dividend Per Share (NT$) 5.4 4.3 4.2 3.6 3.2 3.2 3.2
Dividend yield (%) 1.5 1.8 1.8 1.5 1.4 1.4 1.4
P/E (x) 18.1 24.8 25.3 29.7 33.2 33.6 33.6
Source: Company data, Team estimates
National Taiwan University 1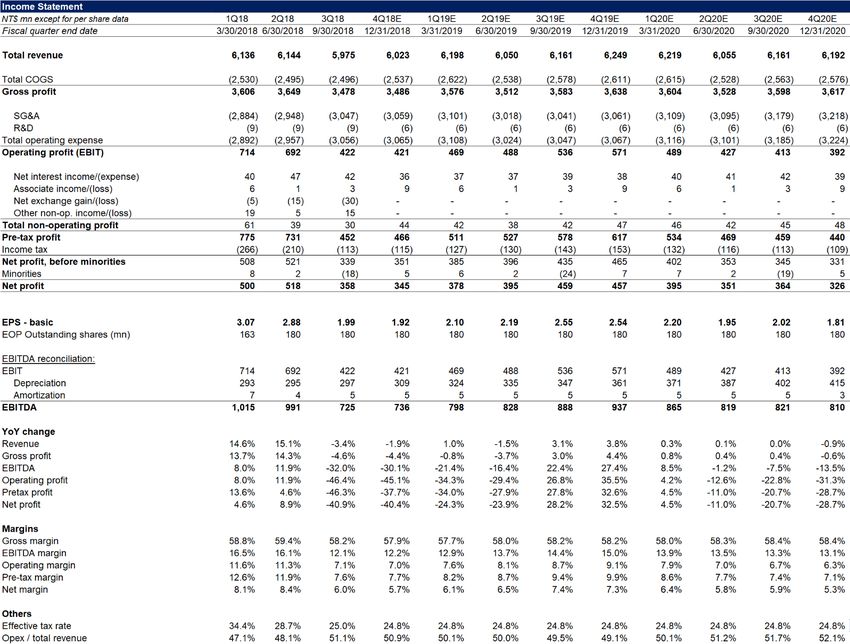
Figure 1 Sales Breakdown by Region                            Business Description
                                                              Company Overview
                                                              Gourmet Master Co. Ltd. (GM), the holding company of 85°C Café, is a bakery café
                                                              providing a variety of food products including bread, beverage, and cake. By regions,
                                                              63% of sales come from China, 20% from the US, 16% from Taiwan and 1% from
                                                              Australia and Hong Kong (Figure 1).

                                                              Expansion Track Overview and Current Expansion Plan
                                                              GM started selling cakes and beverages in Taiwan, and through its franchise model, it
                                                              has broadened its reach to 443 stores by 3Q18. In contrast, GM embraces the self-
                                                              owned business model to manage food safety, for a consistent marketing strategy in
Source: Company data
                                                              China. GM positions itself as a bakery café to capture the rapidly growing Chinese
                                                              market. GM has 607 self-owned stores in operation. After expanding in China, GM
Figure 2 Product Mix by Region
  100%                                                        landed on the US as an Asian bakery specialist. Following China's operating experience,
                  25%            30%             30%          GM expands its market with self-owned business model and runs 49 stores. Overall,
   80%
   60%            20%                                         beverage accounts for 55% revenue in Taiwan, bread for 55% revenue in the US, and
                                 30%                          a more balanced product mix in China (Figure 2 and Figure 3).
   40%                                           55%
                  55%
   20%                           40%
                                                 15%          Aside from the three major markets, GM also extended its footprint to Australia in
       0%
                                                              2007 and Hong Kong in 2012 by forming joint ventures with local enterprises. GM
            USA      China                   Taiwan
        Bread      Beverage                    Cake
                                                              bought back 50% ownership from Café de Coral in 2014 and directly ran all stores in
                                                              Hong Kong thereafter.
Source: Company data

Figure 3 Store Numbers by Region                              Recent Regional Strategies
                                                         26
                                                              In the US, GM will open two new central kitchens in Northern California and Texas to
1,200                                            24
                                       15
                                                 40      49   support its store expansion. It also makes inroads into delivery services through
                    12      13
                                       25
 900         9
                    14      17                          443   partnership with DoorDash at select branches.
             7                       400     429
                    332     350
 600        341
                                                              In China, GM will focus on 2nd generation store remodeling and slow its expansion
 300                489     502      538     580        607
                                                              pace. By 3Q18, the proportion of 2nd generation stores reached 77%, and GM will
            410
   -                                                          refurbish the rest in following years. In addition, GM wants to target young females
            2013 2014 2015 2016 2017 9M18                     through its new store format and plans to expand into inland China by opening new
        China       Taiwan           US          Others       stores in lower tier cities.
Source: Company data
                                          In Taiwan, GM has completed all the remodeling projects in 1Q18. Furthermore,
Figure 4 Shareholder Structure as of 3Q18 facing the trend of online food delivery services, GM has recently launched an in-
                                          house 85 Café app, which allows customers to order online and collect points.
                        Others
                         12%                                  In Australia, GM announced changes in the local management team (but still owning
                                  Chairman                    51% of the Australian entity) starting from 3Q18. GM aims to take more active control
                   QFIIs
                                  Wu and his                  of the business, hoping to see more positive performance.
                                   family
                   37%
                                    51%
                                                              Shareholder Structure
                                                              Chairman Wu, the founder of Gourmet Master, and his family hold 51% of equity
Source: Company data
                                                              directly and indirectly via investment vehicles (Figure 4), having a strong commitment
                                                              in senior management and board of directors (Appendix 8). Between 2015 and 2017,
                                                              foreign ownership gradually increased from 30% to 40%. However, as the stock price
Table 1 Corporate Governance
                                                              started to fall and foreign ownership dropped to 37%, we believe it is a signal that
                                            GM        Peers   foreign institutional investors are doubtful about GM’s prospects.
Executives
Number of Executives                       5           10     Corporate Governance
Avg. Tenure (Years)                        7            5
                                                              In order to justify the efficiency and credibility of its management, we compare GM
Remuneration (% of PBT)                   0.58        6.25
                                                              to its peers (Appendix 8). GM operates in a relatively small group of management with
Directors
                                                              longer average tenure and high attendance rate (Table 1). The board of directors
Number of Board Members                     7          10
Independent Directors                       3           3     consists of 7 people and 3 of them are independent directors. Considering
Avg. Meeting Attendance %                  97          90     management’s remuneration, even though GM has experienced a robust growth in
Remuneration (% of PBT)                   0.95        3.35    recent years, executives’ and directors’ pay and performance related bonus remain
Source: Company data                                          stable and remuneration-to-profit-before-tax (PBT) ratio is lower than its peers
                                                              (include President Chain Store Corp., BreakTalk, and etc).

National Taiwan University                                                                                                                         2
Figure 5 Revenue Growth by Region Investment Summary
40% 36% We issue a “Sell” recommendation on Gourmet Master, with a target price of
28% NT$190 due to falling revenue growth and OPM in China, the US and Taiwan (Figure
30%
20%
17% 5 and Figure 6).
10%
10% 4%
4% 5% 2% We analyze the company by breaking down to major operating regions:
0% 0% -1% 0%
3% -1% -2% -1% 1) China: Growth ceiling given declining benefits from remodeling projects, weaker
-2%
-10% -4% -6% -6% -5% consumer demand, and fiercer competition.
2017 2018E 2019E 2020E 2021E
China Taiwan US Overall 2) US: Softer outlook in face of aggressive expansion by competitors.
Source: Company data, Team estimates 3) Taiwan: Lack of imminent catalysts and failure to boost retention rates.
Figure 6 OPM by Region China (63% of total 2018E revenue): Pressures on revenue and OPM
16.0% 14.4% The rectification effect of 2nd generation stores on revenue
13.5%
13.5% The forward momentum brought by 2nd generation stores will lose gas along with the
13.0% 13.0% 13.0%
12.0% 12.3% 11.0%
10.5% increased ratio of 2nd generation stores. GM’s revenue growth has decelerated to 3%
11.4% 9.3% 8.0% in 2018E from c.7% in 2016/17, when remodeling initiatives rolled out. We expect GM
8.0% 8.4% 6.7%
8.3% 7.0% to finish remodeling all of its stores in 2022E (Figure 7), which will result in a -1%
6.2% revenue growth. 2nd generation stores help extend customers’ stay and raise the
6.8%
4.0% 5.2% 4.5% higher-margin beverage mix to 30% from 25%, due to enlarged seating areas. We
2017 2018E 2019E 2020E 2021E
China Taiwan US Overall
believe that GM’s per store sales growth in China will fall to -7% in 2022E from 4% in
Source: Company data, Team estimates 2014.
Figure 7 Expected Remodeling Schedule Challenge by weakening consumer market
800 100% China’s retail sales YoY growth has declined to 8.1% in 11M18 from 10.7% in 1M14,
700 and we do not expect the trend to reverse in near future given an undesirable
600 80%
500 60%
macroeconomic condition in China (Figure 8). As purchasing power continues to slow
400 down, consumers may be less willing to spend on aspirational goods such as pastries
300 40%
and coffee, dragging GM’s revenue.
200 20%
100
0 0% Lagging behind in online delivery hurts GM’s OPM
Online delivery services are heating up in China, but GM is shying away from the
Gen 1 opportunity, instead increasing it’s operating expense by 4% in 2018 to fund
Gen 2 traditional promotion pipelines. We believe it will increase by c.6% in 2019-20E. GM
Ratio of Gen 2 Stores intentionally holds back on sales through online delivery, which is 10% of total
Source: Team estimates revenue in 2018E, compared to competitor Luckin Coffee’s 50% (Figure 10). The
competition became fiercer when the leading traditional chain store, Starbucks,
Figure 8 China Retail Sales YoY Growth stepped into the battle in September 2018. Moreover, 48% of Luckin Coffee’s
12% customers are 24 and below, vs. 26% of GM’s customers (Appendix 16), attracted by
11% the convenience of online delivery services. This coincides with GM’s target
customers group, hindering GM’s promotions efforts (Figure 9). With this in mind, we
10%
forecast the company’s operating margin in China to thus decrease to 6% in 2019-20E,
9%
from c.10% in 2017-18E.
8%
Jun-15
Nov-15
Dec-17
Jul-17
Oct-18
Apr-16
Sep-16
Feb-17
May-18
Jan-15
Figure 10 Coffee brands online delivery timeline and sales proportion
Source: National Bureau of Statistics of China
Figure 9 SG&A Expense in China
NT$ mn
8,200 8,081 8,050 8,095 8,094 56.0%
55.5%
8,000 54.8%
54.0%
7,800 7,658 53.2%
53.0%
7,600
52.0%
51.7%
7,400
7,200 50.0%
2017 2018E 2019E 2020E 2021E
SG&A SG&A/Revenue(%; RHS)
Source: Company data, Team estimates Source: Company data
National Taiwan University 3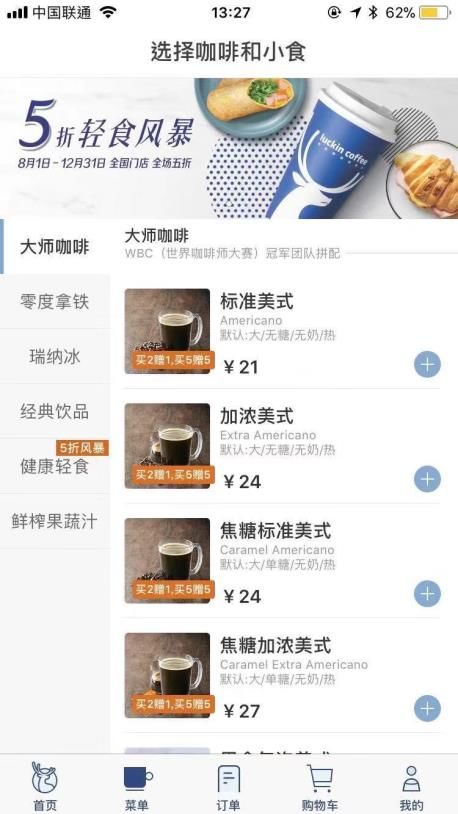
Figure 11 GM’s Store Number & Per Store                        The US (20%): Slower store expansion than aggressive competitors
Sales in the US                                                Elevating competition and reined expansion to weigh on revenue growth
NT$ mn                                                         After stores increased from 40 to 55 in the US, GM’s US per store sales decreased by
160                                                      100
          116
                                                               c.12% over 2017-18E. We expect GM’s per store sales in the US to keep declining
120              102                                     80
                                90
                                                               c.10% in 2019-20E due to elevating competition and cannibalization (Figure 11). In
                                          82             60
 80                                                 75         order to meet its mid-term target of 100 stores by 2022E in the US, GM expects a
                                                         40    smaller central kitchen to commence operation in 1Q19, and we expect the company
 40                                                      20
          40      55       70        82        91              to pencil in construction of another central kitchen in Texas in 2Q20-3Q20E. However,
  0                                                      0     site selection for central kitchens will rein expansion to the West and thus result in
          2017   2018E 2019E 2020E 2021E
                                                               cannibalization.
                 Store number in the US (LHS)
                 Per store sales in the US (RHS)
Source: Company data, Team estimates                           Like GM, Paris Baguette (PB) is an Asian bakery café in the US that aims to target more
                                                               Asian communities and to triple their US exposure to 300+ stores by 2020E, vs.
Figure 12 Paris Baguette and 85 Café US                        estimated GM store addition of 15/12 stores in 2019/20E. We render GM will miss
Store Location                                                 growth opportunity from pent-up demand for Asian bread, given its slower expansion
                                                               pace than competitor. In addition to focusing on corporate growth in California and
                                                               New York, PB has already established footholds in Texas, Illinois, and New Jersey,
                                                               where large Asian communities reside (Figure 12).

                                                               We believe that PB will not be the only player aiming for rapid expansion in the US
                                                               Asian bakery market, due to a low entry barrier. PB, along with possible new entrants
                                                               who replicate GM’s business strategy, will end up eroding GM’s market and cut its
                                                               revenue growth nearly in half to 10% in 2020E, from 28% in 2018E.
Source: Company data
                                                               Taiwan (16%): Revenue to shrink amid fiercer competition
Figure 13 GM’s Store Number & Per Store Declining per store sales due to settled refurbishment and under-monetized
Sales YoY in Taiwan                            expansion
                                           500
 -3%                                           Since store format upgrade has ended in 1Q18, and organic growth loses momentum
                                    474
                             467           480 in a competitive market, we expect GM’s per store sales to decrease by 9%/8% YoY in
 -5%                  458
               446                     -7% 460 2019-20E (Figure 13). Similar to refurbishment in China, GM introduced the 2 nd
 -7%
 -9%    429                     -8%        440 generation stores in Taiwan in 2013-14, leading to an SSSG uptick after the initial
                  -9%    -9%                   launch and refurbishment each year. However, with refurbishment complete in 1Q18
-11%       -11%                            420
                                               and no strategies for a next revamp round, we thus do not envisage any construction
-13%                                       400
        2017 2018E 2019E 2020E 2021E
                                               stimulus to the topline.
            Store number in Taiwan (RHS)
                                        GM has been unable to retain its customers amongst this fierce competition. Its
            Per store sales YOY in Taiwan (%; LHS)
Source: Company data, Team estimates    registered customer members are at 170,000, the fewest among competitors, and
                                        almost half of rival Louisa Coffee. Although GM will continue to steadily expand its
Figure 14 Taiwan Coffee Shops Recent 5- store number to 474 in 2021E from 429 in 2017, its failure to defend amid fiercer
year Sales CAGR & Number of Members     competition has already reflected on its 2% sales CAGR in 2012-2017, indicative of
Thousand                                under-monetized expansion (Figure 14). We thus believe GM’s revenue growth will
8,000                               60%
                                        fall to c.6% in 2019-20E because of failure to boost retention rates, from c.4% in 2017-
6,000                               40% 18E.
4,000
                                                2% 20%
2,000
      0                                                  0%

                   number of members (LHS)
                   5YR Sales CAGR (RHS)
Source: Company data, Team estimates

National Taiwan University                                                                                                                          4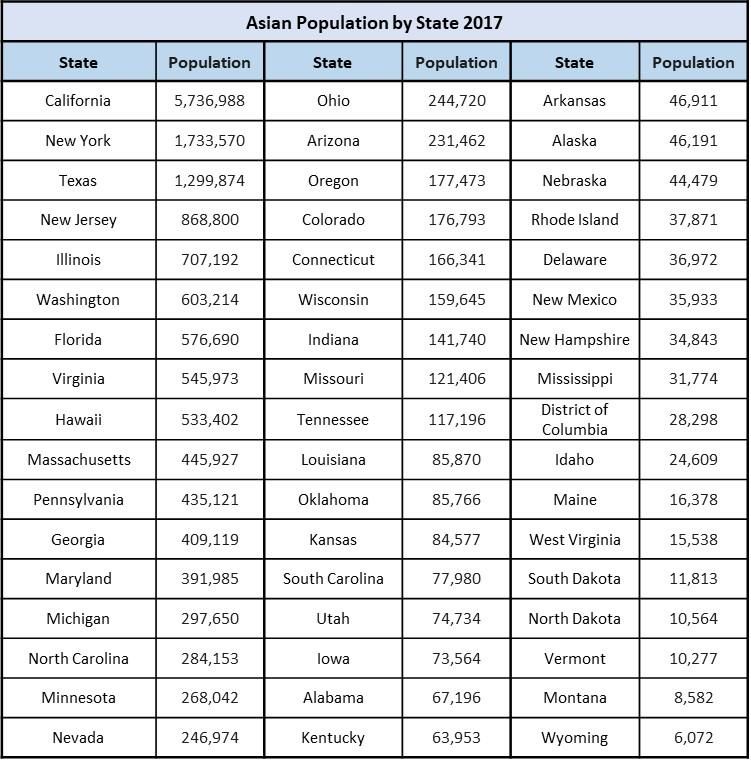
Valuation
Table 2 Target Price Table                     P/E valuation is our primary methodology
 Valuation Methodology           Price (NT$)   Our 12-month target price of NT$190 is based on 20x 2019E EPS, implying a 20%
 P/E                                     190   downside. We reason that P/E multiple is an appropriate metric since it helps us
 DCF                                     189   capture the sustained earnings growth that the company will achieve.
 Target price                            190
Source: Team estimates                         In our sampling horizon, P/E mean of 25x is representative of average growth outlook
                                               in China’s 2nd generation store era and accelerating topline growth in the US (Figure
                                               15). We believe our target multiple of 20x is fair, considering: 1) The company’s
Table 3 P/E Summary                            operation has hit a ceiling, with escalating competitive pressure and slower store
                         2018E      2019E      expansion, and we forecast earnings to grow -2%/-15% in 2019/20E, much lower than
 Gourmet Master          19.8x      20.2x      the market consensus 15%/26%; 2) The last time GM traded at the lowest end of our
 Taiwan                  27.6x      25.6x      P/E band was at the time when CNY depreciated acutely against TWD.
 Greater China           39.4x      29.8x
 Asia Pacific            27.9x      24.7x      Peer comparison
 The US                  26.6x      23.1x      We also turn to P/E multiple comparison with global peers (Table 4). Our comparable
Source: Bloomberg, Team estimates              companies are mostly from Taiwan, Greater China, and the US, where GM runs the
                                               majority of their business. In Pan Asia, we choose the most representative public
                                               companies from the space of retailers and food and beverage manufacturers based
                                               on similar product mix (bread, coffee, or tea). Some of comparable companies are
                                               restaurants, like Haidilao, since they provide alike two-way services (dine-in and
                                               takeout). In the US, on top of coffee vendor Starbucks, our comparable peers are
                                               mostly quick service restaurants, like McDonald’s and Yum!, as GM has a more
                                               takeout-centric business there.

                                               Since GM's earnings growth of -2% in 2019E is lower than most of the peers', we argue
                                               that GM does deserve a discount to the average P/E multiple in its major business
                                               regions (vs. 25.6x/29.8x/23.1x in Taiwan/Greater China/the US) (Table 3). Our 20x
                                               multiple is also reasonable given its earnings growth in Asia Pacific region scope. GM
                                               is now traded at 25x 2019E EPS, and we think the current valuation premium comes
                                               from excess optimism about GM’s growth story overseas, while the market overlooks
                                               potentially vanishing competitive advantage due to rising engagement by other
                                               players and the absence of moat.

                                               Figure 15 Gourmet Master’s Forward P/E Band

                                                500                                                 OPM dilution from CK in
                                                                                                            the US
                                                400
                                                                                                                              34x
                                                300                                                                           29x
                                                                                                                              25x (Mean)
                                                200                                                                           20x
                                                                                                                              16x
                                                100                     Gen 2 remodeling in China
                                                                        and fast growth in the US
                                                  0
                                                 1/2/2016    7/2/2016     1/2/2017      7/2/2017    1/2/2018      7/2/2018
                                               Source: Bloomberg, Team estimates

National Taiwan University                                                                                                          5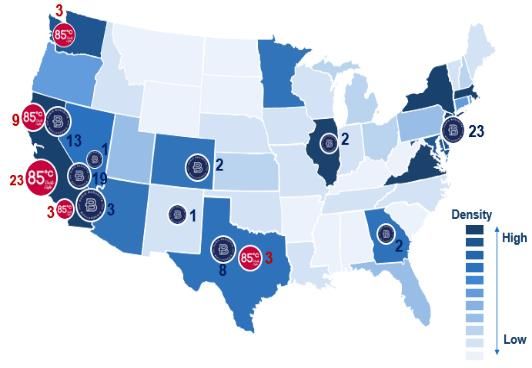
Table 4 Gourmet Master’s Comp Table
Market EPS (LC) NI YoY P/E (x)
PX_Last
Ticker Com pany nam e Cap
(LC) 2017 2018E 2019E 2018E 2019E 2018E 2019E
(US$m n)
Taiw an
2723 TT Gourmet Master 236.5 1,400 13.12 9.56 9.38 -20% -2% 19.8 20.2
1216 TT Uni-President 68.9 12,537 7.01 3.09 3.29 -56% 6% 22.0 20.7
2912 TT President Chain Store Corp 313.0 10,406 29.83 9.89 10.75 -67% 9% 31.2 28.7
5903 TT Taiw an FamilyMart 213.0 1,564 6.30 7.30 7.89 15% 9% 29.6 27.4
Average (excl. GM) 27.6 25.6
Greater China
6862 HK Haidilao 17.2 11,734 n.a. 0.32 0.50 66% 57% 47.3 30.2
601933 CH Yonghui Superstores 7.3 10,871 0.19 0.17 0.24 -13% 42% 46.2 33.0
Table 5 WACC Assumption 345 HK Vitasoy 31.4 4,044 0.56 0.67 0.80 20% 20% 44.6 37.5
603866 CH Toly Bread 47.8 3,099 1.14 1.38 1.68 25% 22% 32.9 27.0
WACC Assumptions 1579 HK Yihai 19.9 2,590 0.27 0.46 0.61 78% 35% 37.0 27.9
Risk-free Rate 10yr TW Gov’t Bond Yield 603711 CH Xiangpiaopiao 19.1 1,273 0.74 0.73 0.90 14% 27% 28.6 23.2
Average 39.4 29.8
TWSE Total Return Index to
Asia Pacific
Capture Dividend Yields and WOW AU Woolw orths Group 29.2 26,708 1.23 1.25 1.36 7% 9% 23.0 21.2
Market Return
Capital Gains over 5-yr CPALL TB CP All 71.5 19,033 2.14 2.31 2.62 5% 14% 29.9 26.4
Horizon DFI SP Dairy Farm 9.1 12,242 0.30 0.36 0.40 21% 11% 25.3 22.4
Monthly Returns to Regress MAKRO TB Siam Marko 33.0 4,753 1.29 1.20 1.26 -6% 5% 26.9 25.7
Beta against TWSE Index’s over 5- 2212 JP Yamazaki Baking 2,411 4,404 114.41 73.94 86.49 -36% 17% 29.8 25.5
SSG SP Sheng Siong Group 1.1 1,161 0.05 0.05 0.05 1% 11% 22.1 20.4
yr Horizon
BREAD SP BreadTalk Group 0.9 332 0.04 0.02 0.03 -46% 26% 38.6 31.2
Cost of Equity CAPM Model
Average 27.9 24.7
Weighted Average Borrowing U.S.
Cost of Debt Rate By Tranches Based on MCD US McDonald's 183.0 131,271 6.67 7.74 8.23 12% 3% 22.0 20.7
3Q18 Disclosures SBUX US Starbucks 65.5 75,131 2.67 2.42 2.73 6% 3% 25.0 22.2
Weighted Average Tax Rate YUM US Yum! Brand 90.4 27,177 4.23 3.72 3.80 14% -2% 23.4 22.9
Tax Rate YUMC US Yum China Holdings 35.0 12,233 1.50 1.51 1.62 6% 6% 21.4 20.0
Based on Regional Earnings %
CMG US Chipotle Mexican Grill 467.4 10,721 6.26 8.52 11.94 26% 39% 45.3 32.3
Source: Team estimates
DNKN US Dunkin' Brands Group 71.6 5,115 2.28 2.83 2.99 7% 2% 21.9 20.7
WEN US Wendy's 17.1 3,552 0.42 0.55 0.66 29% 9% 27.3 22.7
Table 6 WACC Calculation Average 26.6 23.1
WACC Calculation
Source: Bloomberg, Team estimates
Cost of Equity 7.3%
Risk Free Rate 1.0% Using DCF valuation to support
We also apply DCF valuation approach to cross-check our valuation methodology. We
Beta 0.96
ration that DCF is suitable to provide valuation support because GM tends to generate
Market Risk Premium 6.5% predictable, positive cash flows. In addition, DCF model incorporates our long-term
Cost of Debt (after tax) 2.4% view of the company’s growth sustainability and the impact of potential risks on
bottom-line.
Cost of Debt 3.2%
Tax Rate 25% Our model factors in our earnings forecast up to 2023E and a terminal growth rate of
Debt-to-Total-Capital Ratio 2.1% 1.5% thereafter, roughly in-line with long-term GDP growth. We consider our terminal
WACC 7.2%
growth assumption reasonable since the company operates in a mature industry, and
the characteristic of low entry barrier as well as possible material consumer
Source: Bloomberg, Team estimates
preference change in bakery & café can alter competitive landscape and thus result in
value depletion. Our WACC comes in at 7.1%, which assumes a risk-free rate of 1.0%,
Table 7 Equity Value Calculation a market risk premium of 6.5% and an equity beta of 0.96x (calculated by regressing
NT$ Million
monthly excess return against TAIEX’s over a five-year time frame), with cost of debt
of 3.2%, a targeted debt-to-capital ratio of 2.1%, and a 25% effective tax rate.
Enterprise Value 29,182
Cash and Equivalents 2,138 DCF valuation echoes our call
Total Debt 903 Our DCF-based target price of NT$189 for GM is derived from our two-stage DCF
model, after rounding, and echoes our call. Overall, we factor China’s disrupted
Equity Value 33,994
business in the presence of new retail mode and weaker macroeconomic conditions,
Shares Outstanding 180 fiercer competition from other Asian bakery participants in the US, and revenue
Value Per Share 189 downtrend in Taiwan into our forecast. See Table 6 and Appendix 7 for DCF
assumption and calculation.
Source: Bloomberg, Team estimates
National Taiwan University 6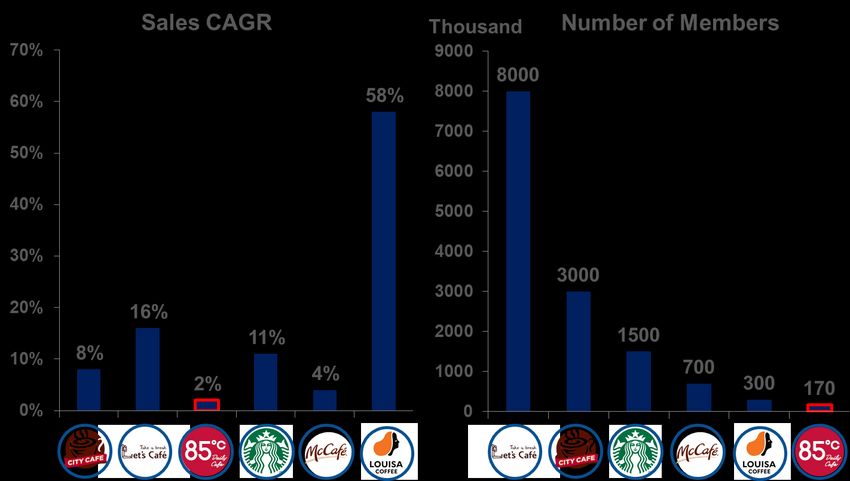
Figure 16 Per Capita Coffee Consumption                     Industry Overview and Competitive Positioning
    by Country                                                  Because Gourmet Master runs bakery café business in China, Taiwan and the US, we
          kgs
     15                                                         focus on bread and beverage in China, bread in the US, and beverage in Taiwan
     10                                                         according to revenue proportion.
      5                                              0.1kg
                                               China industry overview and positioning (Bread/Beverage: 40%/30% of revenue in
      0                                        China)
                                               Low penetration of coffee and bakery market in China
                                               If we look into industry data, penetration of the coffee and bakery market is low in
               Per Capita Coffee Consumption   China. According to Euromonitor, China’s current annual baked goods consumption
    Source: International Coffee Organization  per-capita is only 7kg, far below 9/23/40 kg in Taiwan/Japan/the US. The same story
                                               occurs in Chinese coffee market. According to International Coffee Organization (ICO),
    Figure 17 Shares of Major Coffee Brands in China’s current annual coffee consumption per-capita is only 0.1kg (Figure 16), far
    China by Volume                            below 2.2/3.6/5.4kg in Taiwan/Japan/the US, indicating that the Chinese are not used
        Others Gourmet Master                  to drinking coffee in their daily lives.
            15%             2%
           Pacific
             3%
                                                                Budget fresh coffee cannot reap benefits
          Cross Straits                Starbucks                Our team believe that budget fresh coffee suppliers like 85°C Café, whose price ranges
               4%                         51%                   from Rmb 10 to 15, will not gain meaningful market share from the secular trend of
          Costa     McCafe                                      consumption upgrade. According to iResearch, drinking coffee can bring three stages
           6%        6%
                                                                of mental satisfaction: 1) to meet physical demand or refreshing; 2) to satisfy
                    ShangDao
                      13%                                       customer’s emotional needs; and 3) to fulfill the requirements for social activities.
    Source: iResearch                                           Unlike high-priced coffee vendors such as Starbucks, which has already established
                                                                image of networking space, low-priced fresh coffee brings mostly first-stage
    Figure 18 China Coffee Brand Delivery                       satisfaction. We render that GM’s budget coffee will not gain significant market share
0   Service Launch Time                                         (Figure 17) in era of ongoing premiumisation, while customers would rather turn to
                                                                much cheaper, more accessible instant coffee for satiating refreshing demand
                                                                (Appendix 14).

                                                                Fiercer competition from customer habits to online food delivery
                                                                Traditional business model has been challenged since more competitors aggressively
                                                                focus on food delivery services in recent years (Figure 18), including Luckin Coffee and
    Source: Company data
                                                                Coffee Box. The proportions of orders submitted through food delivery platforms in
                                                                Tier 1 and Tier 2 cities are 20% and 40%, respectively, according to Meituan. New
    Figure 19 China Baked Goods Market                          retail model has proliferated and helps startups nibble market share in recent years
    RMB mn                                                      by deep involvement in promotions and delivery service. We expect the new business
    400,000                            CAGR 12.3%         13%
                                                                model to mature in 5 years, thanks to rising food delivery service penetration and high
     300,000                                                    internet user base (Appendix 23). The number of entrants embracing new business
                                                          12%
     200,000                                                    model will rise, and comparables will stimulate sales throughout heavy promotion
                                                          11%   and advertisement. We expect the scenario will undermine the effectiveness of
     100,000
                                                                traditional market share gain strategy through store expansion, especially in inland
                0                                         10%   cities.

                                                                Fragmented market weakens brand power of large industrial bakeries
                          Baked goods Retail Value
                          YoY (%; RHS)                          Although China’s bakery market is growing (Figure 19), the market is still fragmented.
    Source: Euromonitor                                         According to Euromonitor, Toly Bread occupied the most market share in 2017, 10%
                                                                (Figure 20), while any other brand did not account for over 6%. Consumer preference
    Figure 20 Market Share of China Bakery                      is the main reason why well-known brands cannot enlarge their market share.
    Brands                                                      According to iResearch, consumers prefer to buy featured goods, made by
                                                                independent stores or artisanal producers. In addition, standardized goods produced
                                      Toly 10%
                                                                by central kitchens cannot satisfy different customer taste in the vast expanse of China.
                                             6%
                    Others
                                              4%
                     75%                     2%
                                             2%

      Toly                            Fujian Dali Group
      Panpanfood                      Garden Group
      Yatai International Group       Others

    Source: Euromonitor

    National Taiwan University                                                                                                                        7
Figure 21 US Bakery Café Market, 2017               The US industry overview and positioning (Bread/Beverage: 55%/20% of revenue in
                                                    the US)
                                                    Low-single digit CAGR of bakery goods market
             Others         Starbucks               The total consumption for bakery products will reach US$67.7 billion in 2022E, with
              36%              28%                  5-yr CAGR of 3%. The US bakery café market is one of the largest in the world, with
                        Dunkin                      total sales revenue amounting to US$59 billion. However, three major players take
                        Brands                      over 50% market share, which means new brands will have a difficult time competing
   Panera                29%                        with market leaders (Figure 21). GM relies on its brand recognition being a seller of
     7%                                             unique Asian bread as well as competitive pricing of bread ($1.5-$2 per unit) to snatch
Source: Euromonitor                                 a piece of market share in the US. If we look into the strategy of its Asian bread
                                                    competitors in the US like Paris Baguette, aiming to reach 300+ stores by 2020E and
Figure 22 US Fresh Coffee Market, 2017              1,000 stores by 2030E, we expect Paris Baguette may end up weighing on GM’s
                                                    operation.

              Others        Starbucks               Mild growth in the coffeehouse-dominated coffee market
               38%             40%                  In the US, the total coffee revenue will reach US$16 billion by 2022E with 5-yr CAGR
                                                    of 4%. Per capita consumption of coffee in 2017 grew to 4.8 kilograms from 4.2
                     Dunkin’                        kilograms in 2012, and the figure was still relatively low, compared to several
                      22%                           European countries. In addition, large coffeehouse chains dominate coffee market in
Source: IBISWorld                                   the US, with more than 60% of share (Figure 22). We reason it will be tough for GM
                                                    to strengthen its foothold in US coffee market due to American dietary habit and
Figure 23 Taiwan Fresh Coffee Market                presence of chain giants.
NT$ mn
 4,000                         CAGR 14.6%     20%
                                                    Taiwan industry overview and positioning (Beverage/Bread: 55%/15% of revenue in
3,000                                               Taiwan)
 2,000                                         10% Fresh coffee market faces saturation
                                                    The current market size of fresh coffee is NT$1,799.2 million (US$58.3 million), with
 1,000
                                                    YoY growth expected to decline gradually to 11.7% from 18.2% between 2018E and
     0                                         0%   2022E (Figure 23). Convenience store (CVS) continues to dominate this space with
                                                    high visibility and standardized offerings. Specialist coffee shops also enjoy rapid
          Coffee Retail Value        YOY (%; RHS)   growth thanks to better return per square meter and featured themes catering to
Source: Euromonitor                                 specific customers (Figure 24). Market saturation is in progress and the sector is very
                                                    competitive. We render that market share gain and customer retention will be key
Figure 24 Store Numbers of Taiwan Coffee factors to watch for GM since demand growth will moderate in coming years.
Shops
# of stores                                         The rise of supermarkets poses threat to artisanal bakeries
14,000                         12,454 12,955 13,546 Taiwan’s consumption of baked goods, amounted NT$32,732 million (US$1,061
12,000            11,506 11,998                     million) in 2017, is growing slowly at low single digit in next 5 years (Figure 25).
           11,053
10,000                                              Independent and chained artisanal bakeries continue to dominate the distribution of
  8,000
                                                    baked goods, thanks to their smaller scale of production, which allows for greater
  6,000
                                                    customization and more-innovative products that are needed in order to stand out in
  4,000
  2,000                                             a very competitive sector. However, rising engagement in artisanal baked goods by
      0                                             supermarkets to drive growth, which leverage well-known retail names, marketing
            2012 2013 2014 2015 2016 2017           capabilities, and good access to capital, has pose threat to distribution share of
   Let's Café (FamilyMart) City Café (PCSC)         individual bakeries.
  Specialist Coffee Shops    Cafés
Source: Company data, Euromonitor

Figure 25 Taiwan Baked Goods Market
NT$ mn                            CAGR 2.3%
40,000                                        3%

35,000
                                              2%
30,000
                                              1%
25,000

20,000                                        0%
         2017 2018E2019E2020E2021E2022E

              Baked goods Retail Value(LHS)
              YoY(%; RHS)
Source: Euromonitor

National Taiwan University                                                                                                               8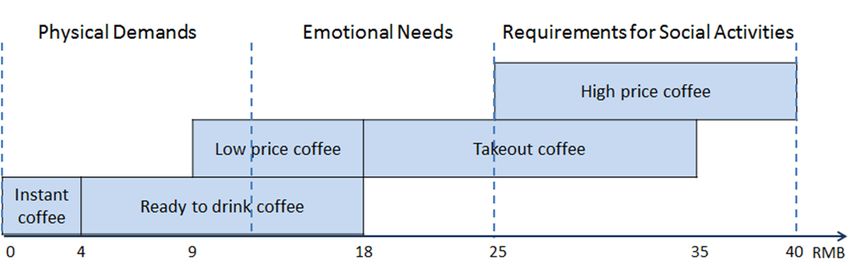
Figure 26 Total Store Number                                           Financial Analysis
 800                                                                   Softer revenue outlook due to peers and cautious development
                                            646        674
                    580         616                                    After posting multi-year double-digit revenue growth, GM is now at the crossroad as
 600     538                                                           its China business began losing traction. While new entrants utilize online platforms
                                   446        458         467
            400          429
                                                                       to bolster brand equity to gain market shares from brick-and-mortar businesses,
 400
                                                                       deliberate control on delivery service amid fierce competition undermines traditional
 200                                                          82
                                                                       expansion and weighs on per store sales, falling 4%/6%/7% YoY in 2018-20E.
                          40           55         70
               25
   0
                                                                       Furthermore, we believe store addition guidance in China will be revised downward
          2016       2017 2018E 2019E 2020E
                                                                       after the political incident to reflect a more cautious management, and thus forecast
                      China  Taiwan  US
                                                                       a net store addition of 36/30/28 in 2018-20E (Figure 26), lower than the pattern
Source: Company data, Team estimates                                   guided (~40 per year). We forecast revenue in China to falter by 1-2% YoY.

Figure 27 Per Store Sales and YoY Growth Growth momentum in the US remains in our view, thanks to stretched reach into
by Region                                more Asian clusters. We forecast central kitchens in Northern California and Texas to
 NT$ mn                                  complete construction in 4Q18E-1Q18E and 2Q20E-3Q20E respectively, and a net
                                         store addition of 15/15/12 in 2018-20E respectively (Figure 26). We estimate per
  100
                                         store sales in the US to falter 12%/11%/9% in 2018-20E and do not see the trend
   80
                                         reverse due to competition and cannibalization (Figure 27). Revenue growth in the
   60
                                         US will thus moderate to 10% in 2020E from 36% in 2017.
  40
  20                                                                   Topline growth in Taiwan lacks construction catalyst after refurbishment cycle ended
   0                                                                   in 1Q18, and relatively low customer retention in a very competitive sector bodes ill
                                                                       for the company. We forecast per store sales to drop 9%/9%/8% YoY in 2018-20E
            2018E
            2019E
            2020E

                                2018E
                                2019E
                                2020E

                                                  2018E
                                                  2019E
                                                  2020E

                                                                       (Figure 27), dragging revenue in Taiwan by 4%/6%/6% YoY.
                    US             China               Taiwan
Source: Company data, Team estimates        Deteriorating operating margin in view of selling and marketing cost pressure
                                            Boycott online and offline after the political incident in August put an end to the
Figure 28 OPM by Region                     significant OPM rally in China since it hit the trough in 2013-14, and 3Q18 OPM came
16.0%      14.4%                            in at 5% (-7% YoY, -6% QoQ). Unfavorable operating leverage will take time to climb
                   13.5%
            13.5%        13.0%  13.0% 13.0% back to pre-incident level after the resumption of food delivery service in late
12.0% 12.3%       11.0%
                         10.5%              September, but the progress should be slower than company expected (3-6 months),
         11.4%      9.3%        8.0%        in our view, due to overall economy slowdown and softening consumption demand.
 8.0%                      8.4%       6.7%
                                7.0%
                                            Moreover, rising new retail model will disrupt the ongoing OPM recovery, as
                   8.3%
                                      6.2% competitors accelerate their investment in marketing to build up brand awareness.
                          6.8%
 4.0%                           5.2%   4.5% We believe OPM will be deteriorated because of promotional burden to sustain
        2017 2018E 2019E 2020E 2021E
                                            market share and thus forecast OPM to be 8.3%/6.8%/5.2% in 2018-20E (Figure 28).
         China            Taiwan             US              Overall

Source: Company data, Team estimates                                   High start-up cost and unfavorable capacity utilization will weigh on operating
                                                                       leverage after GM undertakes central kitchen addition in the US, and thus depress
Figure 29 Capital Expenditure                                          regional OPM before new production base ramps up. 3Q18 OPM came in at 11.5%.
NT$ mn                                                                 With central kitchens in place in 4Q18E-1Q19E and 2Q20E-3Q20E, we think OPM of
2,500
                               2,099                                   these two periods will dip ~2% QoQ as a result. While broadening Asian customer
                                       1,919 1,995
 2,000              1,790                                              base through expansion bodes well for GM’s operating leverage in the near term, we
                                                        1,598
 1,500     1,331                                                       reason that comparable Asian chained bakery cafés undertaking rapid expansion will
                                                                       dilute GM’s regional OPM and forecast OPM to be 11.0%/10.5%/8.0% in 2018-20E.
 1,000

  500                                                                  In Taiwan, the wide adoption of franchise model shifts headcount and operating cost
    0                                                                  burden to franchisees, and hence GM enjoys a relatively more stable and higher OPM.
           2016 2017 2018E 2019E 2020E 2021E                           We expect the trend in Taiwan to continue and forecast a 13% OPM onwards.
Source: Company data, Team estimates
                                                                       Cash flow analysis
                                                                       GM has a stable, sufficient cash flow to support its expansion thanks to its retail
                                                                       business nature, and the cash conversion cycle is -12 days in 3Q18, which represents
                                                                       a low liquidity risk. Expansion of self-owned stores and central kitchen construction
                                                                       are the primary capital expenditure items for GM. Capex has increased since 2016 and
                                                                       we think it will reach a peak in 2018E. Capex will edge lower onwards mainly due to
                                                                       slower expansion in China, but buildout of another central kitchen in Texas will result
                                                                       in capex similar to 2019E level (Figure 29).

National Taiwan University                                                                                                                                  9
Figure 30 Risk Matrix Investment Risks
We evaluate the risks of Gourmet Master and describe the impact and likelihood of
investment risks in Figure 30 and Table 8.
Higher GDP growth in China and the US
According to Euromonitor, 2019E GDP growth in China and the US are estimated to
decline by 0.5 ppt to 6.1%/2.4% from 6.6%/2.9% in 2018E (Figure 31). However, if the
trade tension between China and the US eases, a rebound in consumer confidence
will lead to an acceleration in economic activities and GDP growth. In that case, GM
would benefit from both markets and hence generate higher revenue than we expect.
Source: Team estimates
Stronger pricing power in the US
Table 8 Risk Factors and Impact The states of California and Washington claimed minimum wage would increase from
2018 to 2020 at 10% CAGR which would pressure the whole retail industry. To relieve
Risk Impact the impact of increasing wages, the entire industry could raise unit prices. Based on
Benefit from GDP
Higher GDP growth in
growth and hence our research (Appendix 24), GM’s product pricing is lower than that of other
China and the US
increases revenue competitors in the US, which means GM has more room in adjusting its price and
Stronger pricing power keeping competitive advantage. We believe the overall OPM would remain stable with
OPM remains stable
in the US effective pass-through, which would change our forecast of the target price.
High probability of tax Net income
reduction in China increases High probability of tax reduction in China
In September 2018, the Chinese government announced the “Individual Income Tax
Better reported
Appreciation of CNY and Reform,” and it would take effect from 2019. Individual tax exemption has been raised
profit due to
USD against TWD
translation gain to Rmb 60,000 from Rmb 42,000 per year. This new regime affects almost 60 million
Higher-than-expected Momentum for taxpayers to be exempted from individual income tax. To further stimulate the
performance of 3rd future revenue
generation stores growth economy and restore investors’ confidence, the Chinese government is planning to
Source: Team estimates lower levies on enterprises. In the US, tax deductions boosted enterprises’ profits up
16% on average from FactSet research. If the Chinese government dramatically cuts
Figure 31 GDP Growth in China and the US the corporate tax rate in 2019, GM’s net income would rise as a result and affect our
target price (Table 9).
Appreciation of CNY and USD against TWD
As GM uses CNY, USD and TWD as its functional currencies and TWD as its reporting
currency, any significant appreciation in CNY or USD against TWD will drive GM’s
reported profit due to translation gain. Owing to the heating trade war in China, the
exchange rate of CNY/TWD has depreciated since 3Q15 (Figure 32). If the exchange
rate of CNY/TWD changes from depreciation to appreciation in following years (Table
10), GM may report a better profit than our projection. However, since GM manages
all its businesses locally and not by importing from other countries, we believe the
Source: Euromonitor impact of foreign exchange has been minimized.
rd
Figure 32 FX Effect on China's Revenue Higher-than-expected performance of 3 generation stores
Growth GM is currently preparing to launch its 3rd generation remodeling, testing the kiosk
15% 5.1 setups and optimizing ordering processes. If the 3rd generation stores can successfully
5.0 maximize asset utilization and attract more customers, it is highly possible the
10%
4.9
execution of 3rd generation remodeling will become the momentum of future revenue
5% growth.
4.8
0%
4.7
-5% Table 9 Sensitivity of China/US Tax Rate Table 10 Sensitivity of FX Rate against TWD
4.6
-10% US Tax (Federal + State) USD / TWD
4.5
-15% 4.4 NT$ 19% 24% 29% 34% 39% NT$ 29.5 30.5 31.5 32.5 33.5
China Corporate Tax
15% 211 208 205 203 200 4.1 194 193 193 192 192
CNY / TWD
20% 203 200 198 195 192 4.3 192 192 191 191 190
FX Effect Real Growth(QoQ)
25% 195 192 190 187 184 4.5 191 190 190 189 189
CNY/TWD(RHS)
Source: Team estimates 30% 187 184 182 179 177 4.7 189 188 188 187 187
35% 179 176 174 171 169 4.9 187 187 186 186 185
Source: Team estimates Source: Team estimates
National Taiwan University 10Appendix: Table of Contents
Appendix Page
1 Income Statement 12
2 Quarterly Income Statement Forecast 13
3 Balance Sheet 14
4 Cash Flow Statement 15
5 Revenue Forecast by Region 15
6 Operating Margin by Region 16
7 Discounted Cash Flow Analysis 16
8 Corporate Governance 16
9 Five-force Analysis 17
10 Gourmet Master’s Competitors Analysis 18
11 Asian Population Proportion of Select Cities Where 85C Café Operates 19
12 Demographic Breakdown of Gourmet Master Customers in the US 20
13 Asian Population by States in 2017 20
14 The Hierarchy of Drinking Coffee 21
15 Demand for Instant Coffee and Fresh Coffee in China 21
16 Age Breakdown of Luckin Coffee Customers in China 21
17 85C Café in China by Yicai City Tier System 22
18 Taiwan Major Coffee Vendors Membership Program 23
19 Luckin Coffee Promotional/Advertising Program Snapshot 23
20 Financial Statement Forecast Assumptions 24
21 Glossary 25
22 Historical Stock Price Performance Recap 25
23 Chinese Mobile Internet Users 26
24 Average Selling Price (ASP) of Beverage and Baked Goods in the US, 2017 26
25 GM’s 5-yr Forward P/E band 26
National Taiwan University 11Appendix 1: Income Statement Source: Company data, Team estimates National Taiwan University 12
Appendix 2: Quarterly Income Statement Forecast

Source: Company data, Team estimates

Source: Company data, Team estimates

National Taiwan University                        13
Appendix 3: Balance Sheet
Balance Sheet
NT$ mn except for per share data          2016       2017      2018E      2019E      2020E      2021E      2022E      2023E
Fiscal year end date                   12/31/2016 12/31/2017 12/31/2018 12/31/2019 12/31/2020 12/31/2021 12/31/2022 12/31/2023

Cash & equivalents                         3,151      2,795      2,243      2,716       2,923      3,657      4,645      5,980
Short-term securities                      2,448      3,868      3,599      3,599       3,599      3,599      3,599      3,599
Accounts receivables                         297        358        331        343         340        337        335        332
Inventory                                    707        768        697        660         651        643        637        629
Prepaid expense                              275        465        436        442         452        449        447        443
Other current assets                         137        199        133        137         136        135        134        133
Total current assets                       7,015      8,454      7,438      7,898       8,102      8,821      9,797     11,116

Net PP&E                                   5,058      5,593      6,657      7,209      7,629       7,461      7,100      6,376
Net intangibles                               64         46         40         19        -           -          -          -
Total long-term investments                  418        698      1,243      1,262      1,282       1,301      1,320      1,340
Other long-term assets                       882      1,018        897        897        897         897        897        897
Toal non-current assets                    6,421      7,354      8,836      9,387      9,807       9,659      9,317      8,613
Total assets                              13,436     15,808     16,275     17,285     17,909      18,480     19,114     19,728

Short-term debt                              187      1,024        745        745         745        745        745        745
Accounts payable                           1,230      1,273      1,185      1,219       1,203      1,188      1,178      1,163
Tax payable                                  182        176        138        183         130        124        124        123
Accrued expenses                           1,262      1,560      1,663      1,665       1,750      1,749      1,744      1,731
Deferred revenue                           1,048      1,360      1,415      1,437       1,393      1,350      1,312      1,268
Other current liabilities                     27         48         48         50          31         31         37         30
Total current liabilities                  3,935      5,441      5,195      5,298       5,251      5,188      5,138      5,060
Long-term debt                               615        155        159        159         159        159        159        159
Other long-term liabilities                  218        285        449        449         449        449        449        449
Total liabilities                          4,768      5,881      5,802      5,906       5,859      5,795      5,746      5,668

Share capital                              4,163      4,163      4,170      4,170      4,170       4,170      4,170      4,170
Retained earnings                          4,523      5,920      6,656      7,570      8,247       8,888      9,577     10,275
Other common equity                          (95)      (228)      (381)      (381)      (381)       (381)      (381)      (381)
Total common equity                        8,590      9,855     10,445     11,359     12,036      12,676     13,366     14,064
Minority interest                             77         72         28         19         14           8          3         (3)
Total shareholders' equity                 8,668      9,927     10,472     11,379     12,050      12,685     13,369     14,061
Total liabilities & equity                13,436     15,808     16,275     17,285     17,909      18,480     19,114     19,728

Days sales outstanding, DSO                    5          6          5          5           5          5          5          5
Days of inventory, DIO                        28         30         25         23          23         23         23         23
Days payables outstanding, DPO                49         50         43         43          43         43         43         42
Cash conversion cycle, CCC                   (16)       (14)       (13)       (15)        (15)       (15)       (15)       (14)

Source: Company data, Team estimates

National Taiwan University                                                                                                  14
Appendix 4: Cash Flow Statement
Cash Flow Statement
NT$ mn except for per share data          2016       2017      2018E      2019E      2020E      2021E      2022E      2023E
Fiscal year end date                   12/31/2016 12/31/2017 12/31/2018 12/31/2019 12/31/2020 12/31/2021 12/31/2022 12/31/2023

Net Profit                                 1,742      2,138      1,721      1,689       1,437      1,287      1,269      1,269
Minorities add-back                           41         17         (2)         (8)         (5)        (6)        (6)        (6)
Depreciation                               1,133      1,078      1,195      1,366       1,575      1,765      1,937      2,093
Amortization                                  36         32         22         21          19        -          -          -
Associate (income)/loss                      (19)       (23)       (19)       (19)        (19)       (19)       (19)       (19)
Net (inc)/dec in working capital             339        294        227        118         (43)       (49)       (38)       (61)
Other non-cash items                          14        (57)       696        -           -          -          -          -
Cash flow from operations                  3,285      3,479      3,839      3,166       2,963      2,978      3,142      3,276

Capital expenditure                        (1,331)    (1,790)    (2,099)    (1,919)    (1,995)    (1,598)    (1,575)    (1,370)
ST securities                              (1,271)    (1,627)      (432)       -          -          -          -          -
LT securities                                  (1)        (0)      (652)       -          -          -          -          -
Other items                                    50        (58)        94        -          -          -          -          -
Cash flow from investments                 (2,553)    (3,474)    (3,090)    (1,919)    (1,995)    (1,598)    (1,575)    (1,370)

Cash dividends paid                         (353)      (741)       (978)     (775)       (760)      (646)      (579)      (571)
Equity issuance/(repurchase)                 -          -           -         -           -          -          -          -
Debt issuance/(paydown)                      (83)       365        (431)      -           -          -          -          -
Other items                                  (72)        52         107       -           -          -          -          -
Cash flow from financing                    (508)      (324)     (1,301)     (775)       (760)      (646)      (579)      (571)
Total cash flows                             225       (319)       (552)      473         207        734        988      1,335
FX impact                                   (129)       (37)          0       -           -          -          -          -
Net change in cash                            96       (357)       (552)      473         207        734        988      1,335

Cash balance, BOP                          3,055      3,151      2,795      2,243       2,716      2,923      3,657      4,645
Cash balance, EOP                          3,151      2,795      2,243      2,716       2,923      3,657      4,645      5,980

Source: Company data, Team estimates

Appendix 5: Revenue Forecast by Regions

Source: Company data, Team estimates

National Taiwan University                                                                                                  15
Appendix 6: Operating Margins by Regions
          20%

          15%

          10%

           5%

           0%
                         2017                  2018E            2019E                  2020E                   2021E
           -5%

         -10%

         -15%

         -20%

                                       China           Taiwan    US           Others           Overall

Source: Company data, Team estimates

Appendix 7: Discounted Cash Flow Analysis
DCF calculation
Fiscal year                                                         2019E           2020E           2021E            2022E         2023E
Fiscal year end date                                              12/31/2019      12/31/2020      12/31/2021       12/31/2022    12/31/2023

EBIT                                                                     2,064          1,721             1,513         1,467         1,437
Less: EBIT x tax rate                                                     (511)          (426)             (374)         (363)         (356)
NOPAT                                                                    1,553          1,295             1,138         1,104         1,081
Add: Depreciation                                                        1,366          1,575             1,765         1,937         2,093
Add: Amortization                                                           21             19               -             -             -
Less: Increase/(decrease) in net working capital                           118            (43)              (49)          (38)          (61)
Less: Capital expenditure                                               (1,919)        (1,995)           (1,598)       (1,575)       (1,370)
Free cash flow to firm                                                   1,139            851             1,256         1,427         1,744
  % growth                                                                              -25%               48%           14%           22%
Terminal value                                                                                                                       31,227
Total FCFF                                                              1,139            851             1,256          1,427        32,970
Discount time factor                                                      -              1.0               2.0            3.0           4.0
Discounted FCFF                                                         1,139            794             1,094          1,159        24,995
Source: Company data, Team estimate

Appendix 8: Corporate Governance
1.    Shareholder Structure
The top 10 shareholders account for 57.8%, in which 90% is insider related.
                                                                                                 Holding %
                        Infinity Emerging Markets Limited                                             23.0
                        Wu Cheng-Hsueh (Chairman)                                                     14.5
                        Henderson I Yield Growth                                                       8.8
                        Zhang Hua Ting                                                                 1.9
                        Karst Peak Asia Master Fund                                                    1.9
                        Zhang Hua Ting Trust Account                                                   1.8
                        Zhang Hua Ting Trust Account                                                   1.8
                        Buena Vista Opportunities Master Fund Ltd.                                     1.6
                        Macquarie Asia New Stars Fund Investment Account                               1.3
                        Macquarie Asia New Stars Fund                                                  1.3
                        Top 10 Total                                                                  57.8
                        Management Total                                                              14.5
                        Director Total                                                                46.3
Source: Company data

National Taiwan University                                                                                                           16
2. Corporate Governance
The table summarizes Gourmet Master’s governance in corporate. Peer companies include Breadtalk, President Chain Store and
La Kaffa. It is clearly that Gourmet Master operates in a relatively small group of management with longer tenure and controlling
directors with significant shareholdings. In terms of executives’ and directors’ remuneration, even though under a robust growth
in recent years, total salary and directors’ fee remain stable.
Gourmet Master Peer Companies
Executives
Number of Executives 5 10
Average Tenure (Years) 7 5
Remuneration (% of net profit before tax) 0.6 6.3
Board Members
Number of Board Members 7 10
Directors Owing Shares 3 4
Shares Held (%) 46.3 26.3
Non-employee Directors 3 8
Average Meeting Attendance % 97.1 90.4
On Board of Other Companies 3 3
Average Tenure (Years) 5 7
Remuneration (% of net profit before tax) 1.0 3.4
Source: Company data
Appendix 9: Five-force Analysis
Threat of New Entrants
5
4
3
2 Bargaining Power of
Threat of Substitute Products
1 Suppliers
0
Bargaining Power of
Competition in the Industry
Customers
Source: Team estimates
Bargaining Power of Suppliers: Global demand and supply affect the price of raw ingredients
Historically, Gourmet Master has a steady gross margin, thanks to diversified local procurement strategy. Considering the jump in
gross profit margin to 58% in 3Q18, from 52% in 1Q10, and variance less than 2 ppts QoQ, we estimate 1 point in “Bargaining
Power of Suppliers.”
Competition in the industry:
Gourmet Master’s competitors in the US and China are ambitious on their store expansion plan. For example, Paris Baguette aims
to run 300+ stores in the US by 2020, and Tous Les Jour targets 1,000 stores in China. Based on the faltering PSD of Gourmet Master
stemming from simultaneous aggressive expansion of Breadtalk as well as other local peers in China within 2012 and 2014, we
ration that the expansion of Paris Baguette and Tous Les Jour should significantly weigh on the performance of Gourmet Master
and thus assign 5 points to “Competition in industry.”
Bargaining Power of Buyers:
Myriads of alternatives are on shelves for bread and coffee in Greater China, ranging from tea to steamed buns, in our view, and
the availability of choices cause consumers to be sensitive to price hike. Therefore, Gourmet Master launches new products every
quarter to differentiate their products so as to minimize consumer’s price sensitivity and bargaining power. However, since
Gourmet Master has positioned itself at competitive pricing, it is fairly difficult for the company to embrace higher price while
keeps the original customer base in Greater China. As a result, we estimate 3 points in “Bargaining Power of Buyers.”
National Taiwan University 17Threat of Substitutes: Although there are many substitutes for baked goods and coffee, such as pastries, tea, and soft drinks, the substitution effect on the products of Gourmet Master should be smaller than that of pure beverage providers or bakeries, thanks to the company’s one- stop feature. We hence assign 2 points to “Threat of Substitutes.” Threat of New Entrants: Many Chinese new entrants show up and heighten the competition in China due to low enter barriers in the bakery and coffee industry. Some latecomers opt to leverage e-Commerce channels or trigger price war to nibble market share, on the back of venture capital funding. Moreover, low entry barriers and huge pent-up demand in the US market not only attract international bakery and café brands, but also entice small-sized bakery players to join the hunt for economic profit. New entrants are emerging threats to Gourmet Master, but Gourmet Master’s first-mover advantage and centralized production, which in turn brings economies of scale, could still create a few edges. We estimate 3 points in “Threat of New Entrants.” Appendix 10: Gourmet Master’s Competitors Analysis Paris Baguette: Headquarter: Seongnam, South Korea Paris Baguette is a bakery brand under the SPC Group, a large food chain in South Korea. It specializes in French bread, sandwiches, cakes, coffee, and etc. Currently, it owns more than 6,000 chain stores in Korea, the US, France, China, Singapore and Vietnam. Paris Baguette attempts to increase its US exposure by a store unit objective of 300+ in 2020E. Paris Baguette’s expansion strategy would bring threat to Gourmet Master in light of the similarity of these two companies on price positioning and store type (bakery café) in the US. BreadTalk: Headquarter: Singapore Breadtalk is a brand under BreadTalk Group (BREAD SP), whose business segments include bakery, restaurants, and food atrium. For its bakery business, it currently operates more than 950 stores in 17 countries, 48% of which are in Singapore. BreadTalk is a direct competitor for Gourmet Master in China because a large proportion of its stores worldwide is located in China (32%) and Hong Kong (11%), and they both exhibit high similarity in terms of site selection. Furthermore, when Gourmet Master accelerated its stretch into China during 2012-14, BreadTalk’s simultaneous expansion indeed exerted crowding out effect on Gourmet Master. Panera Bread: Headquarter: Missouri, USA Panera Bread is a chained bakery café/fast casual restaurants in the US and Canada. Product offerings include soups, salads, pasta, sandwiches, specialty drinks, and baked goods. The company was listed on NASDAQ exchange (Before delisted: PNRA US) before an equity buyout led by JAB Holding Company, a German private equity fund in consumer field, in 2017. Panera current has over 2,000 locations in the US. In May 2018, Panera Bread announced that it would now provide nationwide delivery service at all stores in the US. Tous Les Jour: Headquarter: Seoul, South Korea Tous Les Jours is a South Korean bakery franchise owned by CJ Foodville, a subsidiary of CJ Group (001040 KS). Tous Les Jours is an "Asian-French" bakery serving a selection of bakery goods and beverages. It has more than 1,300 branches in Asia and the US. City Café: Headquarter: Taipei, Taiwan City Café is a coffee brand owned by President Chain Store Corporation (PCSC, 2912 TT), a convenience store operator, and sells quality fresh coffee at a relatively lower price than others. PCSC now owns more than 5,000 stores in Taiwan, and its density is much higher than convenience store players (c.50% in market share term by unit). On top of coffee, City Café also makes inroads into tea drink market in order to offer customers with more beverage choices. McCafé: Headquarter: Illinois, USA McCafé is a coffee-house-style food and beverage brand, owned by the fast food conglomerate McDonald's (MCD US), and runs together with fast food restaurants. Currently, McDonald’s has over 35,000 stores worldwide, and it plans to add 2,000 more restaurants in China over next five years. McCafé poses a direct threat to Gourmet Master, given similar competitive pricing strategy and high store visibility. National Taiwan University 18
Louisa Coffee:
Headquarter: Taipei, Taiwan
Founded in 2006 by Ming Xian (Chris) Huang, Louisa Coffee is a coffee specialist shop brand in Taiwan. Louisa offers budget coffee
at premium quality as well as fresh food in order to cater customers’ appetite. The brand now eyes a store number target of 400
by the end of 2018, which will put itself behind 85C Café and Starbucks in Taiwan. Apart from membership program, Louisa also
addresses “lifestyle” by introducing different concept stores, such as library-alike and workspace-oriented, to bolster customer
loyalty.

Let’s Café:
Headquarter: Taipei, Taiwan
Similar to City Café, Let’s Café is also a chained coffee brand owned by the convenience store operator, FamilyMart (5903 TT),
which now runs at more than 3,000 locations in Taiwan. Business strategy of Let’s Café is akin to City Café as well, by providing
fresh quality coffee at competitive price and leveraging the high visibility of FamilyMart to lower customer acquisition cost. In
addition, Let’s Café taps into tea drink segment through cooperation with Twinings, a British tea marketer.
Starbucks:
Headquarter: Seattle, USA
Starbucks (SBUX US) is the biggest coffeehouse company in the world which has more than 28,000 stores in operation across 75
countries by the end of 2017. Its main products include coffee, tea and bakery goods. Among all the coffee brands mentioned,
Starbucks is the brand enjoying the highest price and brand equity.

Luckin Coffee:
Headquarters: Beijing, China
Luckin Coffee, founded in 2017 by Zhiya (Jenny) Qian, is representative of China’s “new retail” model, thanks to cheap delivery and
prevalence of online ordering in China. With more than 660 stores opened in 13 provinces within just a few months, it is now the
second largest coffee brand in China and a powerful threat to Starbucks and other coffee brands. Luckin completed a GIC-led Series
A funding worth of $200 million in June 2018 and joined “unicorn”, the start-up hall of fame, at $1 billion post-money valuation.
The company has been utilizing strong capital support to propel breakneck expansion via frequent online promotional activities.

RTD (Ready-to-drink coffee):
RTD refers to packaged coffee sold in stores and is prepared ready for consumption. The global RTD coffee market is expected to
reach $9.7 billion in 2018. RTD coffee are distributed mainly through modern trade channels, such as supermarkets and
convenience stores, and the brand equity of it is relatively lower.

In conclusion, Gourmet Master is now facing mounting competition pressure from other players: 1) Paris Baguette, Tous Les Jour
and Panera in the US; 2) McCafé, Luckin and BreadTalk in China; 3) City Café, Let’s Café, and Louisa Coffee in Taiwan.

Appendix 11: Asian Population Proportion of Select Cities Where 85C Café Operates
        Cupertino                   Milpitas                 Cerritos                 Daly City                 Alhambra
           (CA)                        (CA)                    (CA)                     (CA)                        (CA)
          63.5%                       61.8%                   61.0%                    58.4%                      52.0%
          Irvine                  Garden Grove              Torrance              Hacienda Heights               San Jose
           (CA)                        (CA)                    (CA)                     (CA)                        (CA)
          43.3%                       38.6%                   38.2%                    36.8%                      34.5%
         Cypress                   Chino Hills             Buena Park                 Gardena                    Newark
           (CA)                        (CA)                    (CA)                     (CA)                        (CA)
          31.7%                       30.7%                   28.0%                    27.8%                      26.7%
        Fullerton                   Berkeley               Sacramento                  Plano                   National City
           (CA)                        (CA)                    (CA)                     (TX)                        (CA)
          24.0%                       22.8%                   21.2%                    18.2%                      17.8%
        Glendale                     Bellaire              Richardson               Balboa Mesa                 Pasadena
           (CA)                        (TX)                    (TX)                     (CA)                        (CA)
          15.9%                       15.4%                   15.1%                    14.7%                      14.4%
       Los Angeles                 Mira Mesa               Korea Town               West Covina                  Tukwila
           (CA)                        (CA)                    (CA)                     (CA)                       (WA)
          12.8%                       44.3%                   32.2%                    25.6%                      16.6%
Source: Company data, US Bureau of Labor Statistics

National Taiwan University                                                                                                      19
You can also read