Information theory and player archetype choice in Hearthstone
←
→
Page content transcription
If your browser does not render page correctly, please read the page content below
Information theory and player archetype choice in Hearthstone
Mathew Zuparica , Duy Khuub , Tzachi Zachc
a Defence Science and Technology Group, Canberra, ACT 2600, Australia
b AustralianNational University, Canberra ACT 2601 Australia
c Ohio State University, Columbus OH 43210 United States
arXiv:2008.07663v2 [nlin.AO] 29 Sep 2020
Abstract
Using three years of game data of the online collectible card game Hearthstone, we analyse
the evolution of the game’s system over the period 2016–2019. By considering the frequencies
that archetypes are played, and their corresponding win-rates, we are able to provide narratives
of the system-wide changes that have occurred over time, and player reactions to them. Ap-
plying the archetype frequencies to analyse the system’s Shannon entropy, we characterise the
salient features of the time series of player choice. Paying particular attention to how entropy
is affected during periods of both small and large-scale change, we are able to demonstrate the
effects of increased player experimentation before popular decks and tactics emerge. Further-
more, constructing conditional probabilities that simulate understandable player behaviour, we
analyse the system’s information storage and test the explain-ability of current player choice
based on previous decision-making.
1. Introduction
Player choice in most adversarial games (Chess, Go, etc.) is limited to on-board actions,
where the distinguishing factor of success is typically experience enabling players to make
better choices over the course of a match. Collectible card games (CCGs) such as Magic: the
Gathering, Yu-Gi-Oh! and Hearthstone require players construct their specific deck of cards
before they engage other players. Decks consist of a limited number of cards (approximately
thirty) from a potential pool of thousands. The act of constructing a deck is arguably the most
meaningful choice a CCG player will make, usually determining the tactics that will be pursued
during a match. For CCGs with a significant number of players, popular decks (also referred to
as archetypes) inevitably emerge over time.
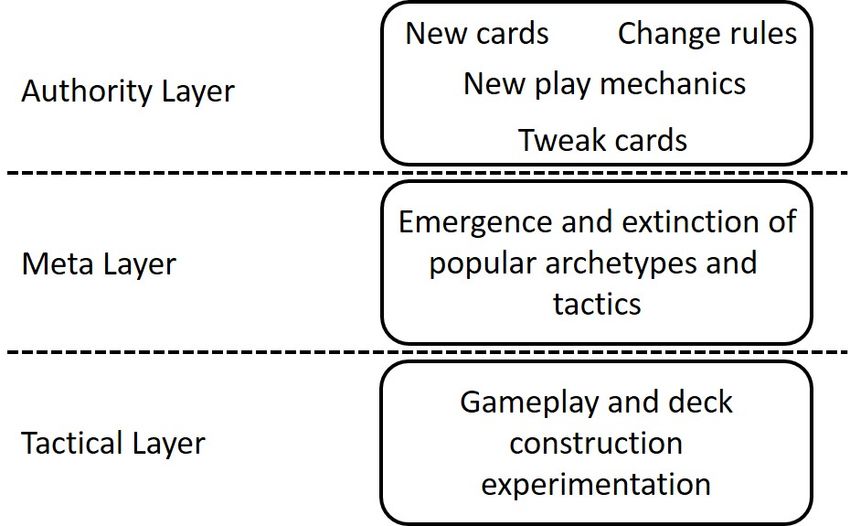
Online CCGs exist within a substantial system. Hearthstone for example currently boasts
approximately one hundred million players world-wide. Figure 1 presents an abstraction of
this system, divided into three layers: tactical, meta and authority. Gameplay occurs at the
tactical layer, where players attempt to make the best moves given the cards in their hand. Deck
construction also occurs at this layer, where players choose cards based on their preferred style
of play, relying on past experiences to refine their choice of cards. The meta for an online
CCG can be articulated as the emergence of archetypes and corresponding tactics over time.
As explained by Carter et al. [7], though the meta is peripheral to the rules and mechanics
of the game itself, it describes the environment that players will experience. The authority
Preprint submitted to Elsevier September 30, 2020Figure 1: Abstraction of the online CCG system.
layer in Figure 1 is the remit of the publisher of the CCG. At various times, the publisher will
initiate change into the tactical layer of the CCG, either by changing cards, adding new cards or
changing rules and/or play mechanics.
1.1. Past research
Due to the underlying difficulty involved in deck construction, the majority of past research
in CCGs has been focused on the discovery of optimal decks and/or determining the best game-
play options. Demonstrating this difficulty, in September 2018 standard players of Hearthstone
could construct approximately 4.11 × 1072 unique decks. To efficiently explore this sample
space, Garcı́a-Sánchez et al. [16] applied evolutionary algorithms to continuously evolve initial
decks and showed a noticeable improvement in win-rates against the majority of other deck
archetypes. In [17] the authors used evolutionary algorithms to create decks which outper-
formed archetypes within the meta when played by an artificial intelligence (AI). Most recently
the authors in [18] tested their methods in an international Hearthstone AI competition, placing
in the top 6% of entrants. Bursztein [5] demonstrated an algorithm which predicted opponent
moves in Hearthstone, boasting over 95% accuracy after the second turn. Remarkably, the
publisher requested that the author not publicly release the algorithm as it was game breaking.
Stiegler et al. [39] applied a utility system to automatically construct decks which considered
metrics relating to gameplay (cost effectiveness, card synergies, etc.), as well as popularity of
cards in the meta. The authors found that their algorithm was able to complete deck skeletons
into currently popular archetypes. Fontaine et al. [15] applied an algorithm which incentivised
both novelty and performance to imitate player decision-making and determine a set of popular
decks. Once decks were established the authors negatively affected (nerfed) some commonly
selected cards to limit their viability. Counter-intuitively, the authors found that the algorithm
included some cards more frequently after they were nerfed, suggesting that even an objectively
negative change may have a positive impact on the perception of a card’s viability. Bhatt et
al. [4] found that decks constructed by their algorithm possessed some degree of generality,
performing well against decks not in the current meta. Focusing on the meta layer of CCGs, de
Mesentier Silva et al. [11] applied an evolutionary algorithm to understand the impacts brought
2on the meta by improving and/or nerfing various cards. While it was possible to balance the
meta after initiating change, the authors noted that too much change was difficult to resolve.
1.2. Intent of this work
This work focuses on the CCG system itself as presented in Figure 1 — to the best of
our knowledge a topic not actively studied thus far. At a system-wide level we seek to under-
stand how changes enacted to the CCG by the publishers influence player decision-making. We
demonstrate how small and large-scale changes initiated in the tactical layer influence the evo-
lution of the CCG’s meta, and by extension the decisions players make in deck construction. To
enable this understanding we use three years of gameplay data from the CCG Hearthstone, con-
sidering both the frequencies that deck archetypes are played, and their corresponding win-rates
over the 2016–2019 period. To understand the effects that changes enacted by the publishers
have on the Hearthstone system, we focus on various information-theoretic measures as they
are a method to quantify the amount of surprise, randomness and complexity in an entire sys-
tem. Analysing the Hearthstone meta through the lens of information entropy, we understand
and characterise the evolution of complexity and uncertainty in the meta at any given time. Fur-
thermore, by considering the information storage exhibited within Hearthstone’s meta, we are
able to estimate how much previous player decision-making explains the underlying structure
seen in the current state of the meta.
1.3. Tactical elements and card properties
Though we focus on Hearthstone, many of the elements discussed in this section apply to
the majority of CCGs. During a match, two adversaries take turns selecting and playing cards
from their hand. At the start of each turn a specific number of cards are randomly dealt to
the player’s hand, drawn from the deck which has been constructed by the player beforehand.
During a player’s turn cards are activated by spending a predefined amount of in-game resource
(mana) which is replenished at the end of the player’s turn. Cards that have been activated are
then sent to the player’s discard-pile, out of play for the remainder of the match. The ultimate
goal for each player is to reduce their adversary’s health to zero.
Cards generally fall under two categories: minions and spells. Minions give the player
controllable characters which enable a range of defence and offence options. Spell cards range
from single-use damage-dealing cards, to cards which perform sustained effects over multiple
turns. Specific to Hearthstone [5, 11] are also weapon cards, equippable by the player, secret
cards, similar to spells but triggered once specific conditions are met, and hero cards, changing
the properties of the player’s in-game avatar. The synergies between card properties also affect
player choice during deck construction. For instance, the activation of many high value cards
may require complex conditions, which can only be satisfied if other specific cards are present.
For more information regarding Hearthstone card properties we refer the reader to [46].
1.4. Archetypes and character classes
Archetypes in CCGs generally fit into the following three categories:
3• Aggro archetypes rely on aggressive tactics to achieve victory. They typically focus on
low cost cards with the intent of overwhelming the adversary in the early stages of the
match. Aggro players that cannot maintain significant tempo in the early-to-mid stages
of the match typically lose.
• Control archetypes rely on relatively high-cost and high-value cards to win in the later
stages of a game. The moniker control comes from the archetype’s strategy in the early-
to-mid game of countering a variety of play-styles, thus granting player the time needed
to initiate the intended late-game finishing tactics.
• Combo archetypes generally rely on cards which contain synergies, with the intent to
knock out the opponent by playing a number of cards in conjunction with each other to
generate devastating effects. Much like control, combo archetypes must have some form
of counter for aggressive early-game play-styles, but mirroring aggro archetypes, they
also rely on knocking out control archetypes before their high-cost high-value cards are
activated.
Specific to Hearthstone in the 2016–2019 period, players must additionally choose one of
nine character classes: Druid, Hunter, Mage, Paladin, Priest, Rogue, Shaman, Warlock and
Warrior. Characters provide unique abilities, and grant the player character-specific cards.
Some characters generally favour specific archetypes due to these exclusive cards. For in-
stance Mages gravitate towards control archetypes due to the considerable range of spell cards
resulting in their ability to deal with a large number of adversary minions.
In a recent survey of online CCG players, Turkay and Adinolf [40] established that player
motivations fell under 4 categories: immersion, competition, socialisation and strategy devel-
opment. Thus, players can be motivated by more than simply winning, including finding com-
binations of cards particularly fun to play. A Hearthstone specific example of this is the card
Marin the Fox, which when summoned creates a treasure chest that, once destroyed, grants the
player with one of a number of extraordinarily powerful cards. It was recognised that success-
ful implementation of this tactic posed many risks as a number of archetypes possessed abilities
which would allow the opponent to steal the resulting powerful cards for themselves. Neverthe-
less, despite considerable risks this card did appear in a number of decks due to how satisfying
the chest’s rewards were if obtained.
1.5. Information-theoretic measures
Information-theoretic measures such as Shannon entropy quantify the amount of surprise
or randomness exhibited in a system [2, 27]. Hearthstone’s meta is a complex system where
archetypes emerge and disappear, and a range of behaviours can be exhibited as time progresses.
Measuring the amount of randomness displayed in the meta over time enables appreciation of
how balanced active archetypes are, how effective recent changes were, and ultimately help
characterise the state of the Hearthstone system. Past examples of Shannon entropy offering
insights into complex systems include: Miranskyy et al. [28] who used entropy measures to un-
derstand and compare rare events in defective software; Cao et al. [6] who developed Shannon
entropy-based measures on graphs to understand the underlying complexity of graph families;
4and Aggarwal [1] who recently applied generalised Shannon entropy measures to provide deci-
sion support in the face of multiple criteria that were often conflicting.
Associated with information entropy is the concept of system criticality [21], sometimes
referred to as the edge of chaos [35]. In mathematical [22], physical [31], biological [30]
and computational [23] systems, amongst others, criticality refers to the system being able
to respond and adapt to a rapidly changing environment. Intuitively, it can be viewed as a
dynamical system cycling through periods of relatively low and high entropy, spending the
majority of its time in intermediate entropy values. For an introduction to this topic refer to
[10, 32].
We additionally apply the concepts of distributed information storage [29], closely related to
information transfer [19]. The systematic explanation of how information is stored, processed
and transferred in distributed systems began in earnest with Schreiber’s [36] landmark work on
information transfer entropy, mathematically defining how information is transferred between
distinct processes in distributed systems. Information transfer has since been applied to great
effect in a wide range of applications, including neuroscience [41], multi-agent dynamics [25],
and social media [38]. A decade after Schreiber’s result, Lizier et al. [26] introduced local
active information storage (LAIS) to distinguish the dynamics displayed in cellular automata.
LAIS has since been applied to understand how information storage properties affect network
structure in biological and artificial networks [24], and characterise normal and diseased states
in cardiovascular and cerebrovascular regulation [13]. Wu et al. [47] demonstrated the util-
ity of localising other information-theoretic measures as a means of overcoming their known
weaknesses regarding image recognition.
This work applies LAIS to appreciate how much the past state of the Hearthstone meta
contributes to its current state. This is motivated by a number of studies which apply LAIS to
explore similarly themed questions on a number of complex systems. These include Wibral et
al. [45] who measured the local time and space voltage neurologically generated by stimulating
the visual cortex of an anaesthetised cat. The spatio-temporal structure of the corresponding
LAIS data characterised how the onset of visual stimulus led to spatio-temporal surprise (or
misinformation) about the proceeding visual outcomes. Wang et al. [44] explored collective
memory/storage via an information-theoretic characterisation of cascades within the dynamics
of simulated swarms. Using the interpretation that the LAIS of a system component charac-
terises the amount of past data used to predict the component’s next state, the authors calculated
the system-wide active information storage (AIS) by taking the expectation value over all com-
ponent states at any time period. They verified a long-held conjecture that information, used
for computation by the swarm, cascaded via waves rippling through the swarm, and found that
higher values of storage generally correlate with greater dynamic coordination. Cliff et al. [8]
explored the AIS within a multi-agent team by analysing implicit team interactions. The authors
noted that when an agent’s AIS values were high its movements were largely predictable.
51.6. Mathematical preliminaries
For a set of K + 1 time-ordered states, {X T , X T −1 , . . . , X T −K }, the LAIS of the state X T at
time T , based on its past K states, is given by
P(X T |X T −1 , . . . , X T −K )
aK (X T ) = log2 . (1)
P(X T )
Positive values of Eq.(1) imply that the past states of the variable provide information and
positively correlate with the current state. Conversely, negative values of LAIS indicate that the
variable’s past history does not correlate with its next state and is synonymous with surprise.
The expectation value of the LAIS (the AIS)
" #
K
ATK ≡ haK (X T )i = ∏ ∑ P(X T , X T −1 , . . . , X T −K )aK (X T ) (2)
n=1 X T −n
∈X T −n
is the explain-ability [26] of the information in the system. That is, when compared to the
corresponding Shannon entropy, the AIS gives the amount of information in the current system
that is explainable by the results of the previous time step(s). To further clarify this concept of
explain-ability, complementary to AIS is the entropy rate EKT , given by
EKT = −hlog2 P(X T |X T −1 , . . . , X T −K )i. (3)
When compared to the corresponding Shannon entropy, the entropy rate gives the amount of
information in the current system which is not explainable by the results of the previous time
step(s).
Following Lizier et al. [26] and Crutchfield and Feldman [9], the contrast between what is
explainable and what isn’t in the system is made clear by the following duality relation between
Shannon entropy — labeled H (X T ) — of the current state, AIS, and the entropy rate via
H (X T ) = ATK + EKT . (4)
Thus by Eq.(4) the percentage of information within the system which is explainable by past
results is given by ATK /H (X T ), and the remaining EKT /H (X T ) being the percentage of
information not explained by past results.
1.7. Outline of the paper
In the next section we detail the Vicious Syndicate website which is the source of the Hearth-
stone data considered in this work. Using this data, we then construct sample timelines of some
deck archetypes, demonstrating the dynamic evolution of the meta over time. We then look
at the data through the lens of Shannon entropy. In Section 3 we construct conditional prob-
abilities which simulate relatively simple, but nonetheless understandable, player deck choice
behaviour. These conditional probabilities are used to define the system-wide AIS values per
time period, ultimately applying Eq.(4) to understand how much of Hearthstone’s past state of
deck frequencies and win-rates contributes to its current state. In Section 4 we offer further
discussion and detail potential future work.
6Beast
Active Druid Archetypes
C'Thun
Jade
Malygos
Ramp
Token
Aggro-Token
Mid-Token
Big
Aggro
Miracle
Taunt
Quest
Spiteful
30 32 34 36 38 40 42 44 46 48 50 52 54 56 58 60 62 64 66 68 70 72 74 76 78 80
Data Reaper Report
Figure 2: Timeline of the Druid-based archetypes present in the meta. Vertical lines represent system changes
by the publisher — solid lines signify release of an expansion (new cards and game mechanics) in addition to a
rotation of a number of older cards out of the standard mode; dot-dashed lines signify the release of an expansion;
and, dotted lines signify release of balance patches (changes to existing cards). The horizontal axis corresponds to
the Data Reaper Report from which the data is drawn. The data for the first entry, report 30, was collected over the
period 14-20 December 2016. The data for the final entry, report 80, was collected over the period 6-13 February
2018.
2. Data explanation and exploration
2.1. Data collection and preparation: Vicious Syndicate
Vicious Syndicate has been collecting Hearthstone game data systematically since May
2016. The data was used to produce weekly Data Reaper Reports about the state of the Hearth-
stone meta-game [42]. Breaks in reporting occur near the release of new content by Hearth-
stone’s publishers. To contribute game data, players are asked to install a small plugin that
records their game play. That data is transmitted to the Vicious Syndicate team to be processed.
During any week between 2000 to 5000 players contributed game data, with tens of thou-
sands of games being processed to produce reports. Specific numbers of contributing players
and processed games can be found in each of the corresponding Data Reaper Reports [42]. Only
games of rank 15 and above are included for reporting purposes. Only opponent archetypes
are included for frequency reporting so as to avoid potential over-representation of archetypes
favoured by players who contributed data [43]. Deck identification algorithms are applied to
classify archetypes based on the cards played during a match. Though not every game provided
a definitive identification, algorithms achieved a high success rate (> 95%) in archetype classi-
fication. Additionally, win-rates were evaluated by taking the average of archetype match-ups
from the player perspective (those who contribute data) and the opponent perspective. The data
was additionally filtered to exclusively include the archetypes which battled all other archetypes
present in the meta at least twenty times per reporting period.
2.2. Archetype timelines
To illustrate an example Figure 2 depicts the timeline (from December 2016 to February
2018) of the Druid-based archetypes present in the meta. Each archetype (14 in total) is noted
on the vertical axis as they appear in chronological order. The horizontal axis corresponds to the
7Data Reaper Report from which the data is drawn. Each black horizontal bar designates the ap-
pearance of that particular archetype in the meta over the appropriate time period. Each vertical
line represents a specific change to the system: solid lines indicate the release of an expansion
(with new cards and game mechanics) in addition to a rotation of a significant proportion of
older cards out of the standard mode; dot-dashed lines signify the release of an expansion; and
dotted lines signify release of balance patches (changes to a number of existing cards).
The change that occurred after report 43 in Figure 2 was due to the release of the Journey
to Un’Goro expansion which introduced 135 new cards (some with new play mechanics) to the
game. Additionally, a card rotation occurred during this time, making 208 cards released prior
to 2016 unusable in the standard play format. Such rotations, which happen yearly around April,
are designed to prevent certain powerful cards and tactics from dominating the meta for too long,
and allowing new content to be released without requiring to account for all previously released
cards when testing for overpowered tactics. Two of the rotated cards, Emperor Thaurissan and
Aviana, greatly improved the viability of Malygos Druid. Thus the extinction of this archetype
after T = 43 in Figure 2 could be anticipated. On the other hand, player experimentation also
occurred due to the release of new content, with two new archetypes seeing significant play —
Ramp Druid and Token Druid. While Ramp Druid lost popularity with players soon-after, Token
Druid continued as a popular Druid archetype until a patch released after report 55 nerfed the
card The Crystal Core. This patch greatly affected the archetype Crystal Rogue, causing it to fall
out of the meta. Crystal Rogue was one of Jade Druid’s worst match-ups, in addition to being
a very favourable one for Token Druid. This flow-on effect led to the eventual disappearance of
Token Druid, and further cemented Jade Druid’s popularity in the meta.
2.3. Archetype frequencies and win-rates
In this work we label the set of all active archetypes in the Hearthstone meta for a particular
reporting period T as
X T = X1T , X2T , . . . , XNT , T ∈ {30, 149},
(5)
where N ≡ |X T |. T ∈ {30, 149} corresponds to the Data Reaper Report which was the source
of the data [42]. This spans approximately three years, being collected over the period 14
December 2016 to 27 December 2019.
For each archetype XiT , the frequency that it was played in time period T is labeled as
P(XiT ). For all XiT ∈ X T the complete set of P forms a discrete probability distribution with
the property
|X T |
∑ P XiT = 1.
(6)
i=1
Figure 3 depicts the frequencies of active archetypes played over the period 10–18 April 2017,
representing T = 44 in Eq.(5). In this figure all character classes are represented in the 26 active
archetypes, with the most frequently played archetype being Midrange Hunter.
This work also considers the win-rates between archetypes, with P(W |PX T , AX T ) denoting
i j
the conditional probability of winning, given that player (P) chose archetype Xi and faced ad-
versary (A) using archetype X j , at time period T . Win-rates and their transpose are equal to
8Frequency
0.15
0.10
0.05
Archetypes
n
e P ladin
st
in
r
ama
e
n
unte
Mid ental P adin
n
enta aman
Elemgro Sh gue
Dra ttle Prie
r
Zoo arlock
e
r
Cry nce Pr t
ogu t
alad
g
t
Han Shama
Sec Mage
e
s
Tau Warrio
k
ies
e H id
arrio
thra ladi
Elemntrol P ge
Mira Pries
Tok Druid
enta age
l Ma
Rame Druid
Prie
Fre a Mag
Pira Warloc
ranegn Dru
a
l Sh
Co ret Ma
Ag le Ro
al
Dea rloc Pa
R
EleBmurn M
nt W
dW
cle
gon
eze
p
stal
rang
te
di
loc
Jad
c
Exo
Mira
Sile
Mur
Mu
Mid
Figure 3: Archetype frequency data for T = 44, collected over 10–18 April 2017.
unity, leading to the identity
P(W |PX T , AX T ) = 1 − P(W |PX T , AX T ),
i j j i
(7)
⇒ P(W |PX T , AX T ) = P(L|PX T , AX T ),
j i i j
for W = win and L = lose. Additionally mirror match-ups amongst the same archetype are
equal to 0.5, i.e.
P(W |PX T , AX T ) = P(L|PX T , AX T ) = 0.5. (8)
i i i i
2.4. Shannon information entropy
Shannon information entropy is measured via
|X T |
H X T
P XiT log2 P XiT .
=− ∑ (9)
i=1
One of the main benefits of Shannon entropy is its ability in characterising the underlying com-
plexity in the system [37]. In general maximum entropy values are obtained by uniformly dis-
tributed probabilities — i.e. P(Xi ) = 1/|X | ∀ Xi ∈ X . Thus Eq.(9) offers insight into how
evenly distributed the archetypes in the meta are over any given reporting period if compared
the value of the theoretical maximum
Hmax X T = log2 X T
(10)
which is the logarithm of the number of active deck archetypes in the meta for any given time
period T .
95.5
ℋ(χ T )
ℋmax (χ T )
5.0
4.5
4.0
3.5
T
32 40 48 56 64 72 80 88 96 104 112 120 128 136 144
Figure 4: Graph of the Shannon information entropy (solid line) and its theoretical maximum (dashed line) —
defined in Eq.(9) and (10) respectively — derived from the frequencies that archetypes are played over each of the
reporting periods. Refer to Figure 2 for the specific meanings of vertical lines representing system changes.
Figure 4 depicts the Shannon entropy (solid line) and the corresponding maximum entropy
(dashed line) derived from archetype frequencies for each of the reporting periods. Vertical lines
represent changes to the system as explained in Section 2.2. Both entropy values largely mirror
each other over the entire time period which is expected. Noticeable increases and decreases
occur immediately after a system-wide change has been introduced. The most common of these
occurrences is a sharp increase, followed by a decrease in entropy until the next change occurs.
This particular behaviour in entropy indicates a marked escalation in archetype experimenta-
tion immediately after changes to the Hearthstone environment. System entropy decreases
soon-after due to players understanding and settling on popular decks and tactics, which have
emerged due to the changes. For the majority of Figure 4, this behaviour in entropy and the
assumed player decision-making it stems from is repeated semi-consistently.
There are instances in Figure 4 where change led to a marked decrease in entropy values.
As previously mentioned in Section 2.2, after T = 55 in July 2017 a patch nerfed the card The
Crystal Core, which led to the extinction of Crystal Rogue from the meta, along with other
archetypes. Only the new Jade Rogue emerged during this period, significantly decreasing the
amount of active archetypes. A similar situation occurred after T = 62 in September 2017
when a patch nerfed five cards. This decreased the frequency that Druid-based archetypes were
played. Mid-Token Druid and Ramp Druid (amongst others) were extinguished from the meta,
with only the new Tempo Rogue emerging during this period. Such events which corresponded
to decreases in system entropy relate to relatively small changes. These changes targeted a few
10∼
ℋ (χ)
1.00
0.95
0.90
0.85
T
32 40 48 56 64 72 80 88 96 104112120128136144
Figure 5: Graph of the normalised Shannon information entropy of the frequencies that archetypes are played
for each reporting period. As with Figure 4, vertical lines represent system changes occurring between reporting
periods.
archetypes perceived to be overpowered. Nevertheless, marked decreases in entropy values did
occur for the release of the Rastakhan’s Rumble (after T = 113 in December 2018) and Rise
of the Shadows (after T = 125 in April 2019) expansions which were major changes. Unlike
other expansions their effect led to a reduction of the system’s entropy as they both saw a drop
in active archetypes present in the meta. For both of these cases, the large drops in entropy
values were reversed due to the minor changes initiated after T = 114 (December 2018) and
T = 130 (May 2019). Both of these patches greatly encouraged deck experimentation and saw
the emergence of new archetypes.
Figure 5 depicts the normalised Shannon entropy, which is the Shannon entropy divided by
the theoretical maximum value
H˜ (X T ) = H (X T )/Hmax (X T ). (11)
For any time period, Eq.(11) varies between (0, 1), indicating how close the Shannon entropy
is to the theoretical maximum. As with the values in Figure 4, this graph displays sharp varia-
tions when system changes are introduced. We conjecture that the evolution of the normalised
Shannon entropy over time in Figure 5 shows hallmark signs of a system at criticality [21, 35].
The system responds and adapts to a rapidly changing environment, cycling through periods
of relatively low and high normalised entropy values. High values indicate that all active deck
archetypes are equally popular. If a deck’s popularity indicates its likelihood to obtain victory,
cases of high normalised entropy correspond to player choice offering little significance. This
case correlates with all active archetypes being equally probable of obtaining victory, with a va-
riety of equally viable tactics. Conversely, relatively low values indicate that only a small num-
ber of active archetypes are likely to be consistently victorious. Player choice would be biased
towards those few archetypes, with experimentation kept to a minimum. System-wide changes
occur to veer the Hearthstone system away from these extreme situations [5]. The trajectory in
Figure 5 spends the majority of its time at intermediate values. This indicates a scenario where
there are a range of viable archetypes, and player choice is not arbitrary as archetypes have
11varying strengths and weaknesses against each other. This scenario is reminiscent of Crutch-
field and Young’s [10] concept of the complexity spectrum where a system displays the most
complexity between its minimum and maximum normalised Shannon entropy values.
3. Information storage and understanding player choice
3.1. Local active information storage applied to archetype choices
Following Eq.(1), we construct the set of conditional probabilities P(XiT |X jT1−1 , . . . , X jTK−K )
which denote archetype XiT being chosen, given that the archetypes {X jT1−1 , . . . , X jTK−K } were
played in the past. Importantly, the conditional probabilities possess the property of simulating
understandable player behaviour. Additionally, the conditional probabilities must satisfy the
consistency condition
T −n |
K |X
P(Xi ) =
T
∏ ∑ P(X jTn−n ) P(XiT |X jT1−1 , . . . , X jTK−K ) (12)
n=1 jn =1
following Bayes’ theorem [27]. Using this notation, the LAIS associated with deck XiT , given
past choices, is given via
P(XiT |X jT1−1 , . . . , X jTK−K )
aK (XiT |X jT1−1 , . . . , X jTK−K ) = log2 . (13)
P(XiT )
This work applies the convention that LAIS values are zero if P(XiT ) = 0 — i.e. the archetype
XiT is not active for time period T . Additionally the AIS associated with each archetype, labelled
(arch)
AK (XiT ), is given as the LAIS expectation value over all past choices
T −n |
K |X
(arch) T
AK (Xi ) = ∏ ∑ P(X jTn−n ) P(XiT |X jT1−1 , . . . , X jTK−K )aK (XiT |X jT1−1 , . . . , X jTK−K ). (14)
n−1 jn =1
Archetype-AIS values in Eq.(14) are equivalent to the definition of agent rigidity given in [8],
used as a measure of agent predictability. Also used in this work is the total AIS for each time
period, labelled ATK , which is the LAIS expectation value over all past and current archetype
choices
|X T |
(arch)
ATK = ∑ AK (XiT ). (15)
i=1
3.2. Weightings applied to construct conditional probabilities
This work is guided by the assumption that player decision-making is solely influenced by
comparing past archetype frequencies and/or win-rates to adjust choices accordingly. Thus, if
a player chooses archetype X j in time period T − 1, then the probability that archetype Xi is
12chosen in the next time period T is weighted by a function of both archetypes in the previous
time period. This is expressed mathematically via
P(XiT |X jT −1 ) = ε (i) P(XiT )KT −1 (i| j), where KT −1 (i| j) = f XiT −1 , X jT −1 . (16)
The weighting K compares deck-frequencies, and/or win-rates that players experienced against
archetype Xi , given they played archetype X j in time period T − 1. The function f results in
a larger weighting if archetype Xi was played more frequently, and/or had a higher win-rate
against X j . Additionally, the coefficient ε (i) ensures that the consistency condition given by
Eq.(12) is satisfied. In order to test the assumption over multiple K-time periods the corre-
sponding conditional probabilities are given via
K
P(XiT |X jT1−1 , . . . , X jTK−K ) = ε (i) P(XiT ) ∏ KT −n (i| jn ), (17)
n=1
with the weighting factors K defined in Eq.(16). Additionally, by ensuring that the consistency
condition given in Eq.(12) is adhered to, the coefficients ε (i) are given as the following
−1
K |X T −n |
ε (i)
= ∏ ∑ P(X jTn−n )KT −n (i| jn ) . (18)
n=1 jn =1
Thus, over a general number of K time periods, the AIS associated with each archetype XiT , is
T −n |
K |X K
(arch) T
AK (Xi ) = ∏ ∑ P(X jTn−n )KT −n (i| jn ) ε (i) P(XiT ) log2 ε (i) KT −n (i| jn ),
∏ (19)
n−1 jn =1 n−1
with the AIS for the entire time period T given by Eq.(15).
Eq.(20) presents the exact forms of the weighting functions applied in Eq.(17) when con-
sidering past archetype frequencies fFR :
2sgn(∆P)|∆P|
e
T −1
T −1
P P
X − X
2
i j
esgn(∆P)| ∆P0.2 |
fFR (∆P) = Chari j × 1 where ∆P = i 6= j, (20)
T −1
e2sgn(∆P)|∆P| 2
P Xi − P̄(X T −1 )
2sgn(∆P)|∆P| 14
i = j,
e
and
|X T −1 | P(X T −1 )
P̄(X T −1 ) = ∑ k
(21)
k=1 |X T −1 |
is the mean value of the archetype frequencies played over time-period T − 1. The term Chari j
in Eq.(20) is a multiplicative factor which checks the character class of both archetypes, and
returns a value greater than unity if the character classes are equal, or 1 otherwise. As explained
13fFR (ΔΡ) fWR (Ρ)
ⅇ 2 sgn(ΔP) ΔP ⅇ 2 sgn(P-0.5) P-0.5
ΔP 2
6
sgn(ΔP) P-0.5 2
2 sgn(P-0.5)
ⅇ 0.2
5 6 ⅇ 0.5
0.5 0.5
ⅇ 2 sgn(ΔP) ΔP ⅇ 2 sgn(P-0.5) P-0.5
4
ⅇ 2 sgn(ΔP) ΔP
0.25 4 ⅇ 2 sgn(P-0.5) P-0.5
0.25
3
2 2
1
ΔΡ Ρ
-0.2 -0.1 0.1 0.2 0.2 0.4 0.6 0.8 1.0
Figure 6: Plots of the specific forms of the functional responses applied to the weightings in Eq.(16). Left panel
shows archetype frequencies fFR detailed in Eq.(20), and the right panel shows win-rates fW R detailed in Eq.(22).
in Section 1.4 each of the character classes gain access to class specific cards which require
a resource investment to both obtain, and learn how play effectively. Thus the term Chari j
simulates the resource hurdle and/or unwillingness involved in changing character classes. This
work sets Charii = 2, assuming that players are doubly likely to choose a deck if it is the same
character class as the deck they played in the previous time period.
Additionally, Eq.(22) gives the forms of the weighting functions applied in Eq.(17) when
considering past win-rates fW R :
2sgn(P−0.5)|P−0.5|
e P L PX T −1 , AX T −1
2
e2sgn(P−0.5)| P−0.5
0.5 |
j i
i 6
= j,
fW R (P) = 2sgn(P−0.5)|P−0.5|
1 where P = (22)
P̄
2
e
L |PX T −1 , AXi T −1
1
e2sgn(P−0.5)|P−0.5| 4
i = j,
and
|X T −1 |
P̄ L|PX T −1 , AX T −1 = ∑ P(XkT −1 )P L|PX T −1 , AX T −1 (23)
i k i
k=1
is the mean value of the win-rate for archetype Xi over time-period T − 1.
Figure 6 depicts the functional responses applied to the weightings in Eq.(20) (left panel)
and Eq.(22) (right panel). The grey and black trajectories in the left and right panels respec-
tively display an almost-linear response. Thus for these functions the probability of choosing
archetype Xi rises linearly the more it was played (left panel) and the better it performed against
X j in the previous time period (right panel). The remaining coloured trajectories present non-
linear responses. In the left hand plot, the quadratic weighting in orange grows slowly initially,
but then experiences the sharpest rise as ∆P → 0.27. This range is chosen due to the largest
frequency (occurring at T = 129) being Lackey Rogue played 26.5% of the time. In contrast to
this, the pink trajectory experiences its sharpest rise immediately after ∆P = 0, with a steady
rise afterwards. An equivalent picture is presented with the four trajectories on the right hand
panel of Figure 6. If the win-rate is less than 50% then the exponentials have a negative ar-
gument, leading to minimal weighting. If the win-rate is greater than 50% the arguments are
14AT1 (frequencies)
0.5
0.4
0.3
0.2
0.1
T
32 40 48 56 64 72 80 88 96 104112120128136144
Figure 7: Plots of Eq.(15) for K = 1 for total AIS associated with each time period. Each trajectory was calculated
assuming functional responses of the past archetype frequencies given in Eq.(20). Note that the colours for each
trajectory corresponds with the colours given to each functional response on the left panel of Figure 6.
positive and the weightings grow non-linearly, for all but the black trajectories. Mirroring the
left hand panel, the quadratic weighting in red grows slowly initially, experiencing the sharpest
rise as P → 1. This range is chosen due to the largest win-rate (occurring at T = 123) being
Taunt Warrior winning against Cube Rogue 96.7% of the time.
3.3. Comparing archetype frequencies and win-rates individually
Figure 7 depicts the total AIS defined in Eq.(15) for K = 1. The functional responses of
the past frequencies correspond to Eq.(20), with the colours of each trajectory matching the
colours given to each functional response in the left panel of Figure 6. A major feature of
Figure 7 is the marked difference between the AIS values with different functional responses.
The almost-linear (grey) and squared (orange) responses display similar AIS values, except at
T ∈ (124, 132). The highest AIS values are obtained by the pink trajectory, whose functional
response rises the sharpest as the difference between the frequencies becomes greater than 0, as
witnessed in the left panel of Figure 6. Thus, the functional response which rises the sharpest
immediately after the archetype under consideration compares favourably best aligns with ac-
tual player behaviour.
The AIS values in Figure 7 also experience a significant decrease whenever they cross time
periods where a major change is introduced into the system. Thus players base significantly less
of their decision-making on past outcomes immediately after such change. This is illustrated
by considering the five changes which happened between T = 39 and T = 63. At the end of
February 2017 (T = 39) a patch was released which nerfed the cards Small Time Buccaneer and
15AT1 (win-rates)
0.5
0.4
0.3
0.2
0.1
T
32 40 48 56 64 72 80 88 96 104 112 120 128 136 144
Figure 8: Plots of Eq.(15) for K = 1 for total AIS associated with each time period. Each trajectory was calculated
assuming functional responses of the past win-rates given in Eq.(22). Note that the colours for each trajectory
corresponds to the colours given to each functional response on the right panel of Figure 6.
Spirit Claws in order to break the dominance of Aggro Shaman in the meta. This patch, as well
as the patches released after T = 55 (July 2017) and T = 62 (September 2017), only affected a
handful of cards and were intended to affect a small number of archetypes in the meta. Though
such small changes substantially changed the meta and its corresponding Shannon entropy (as
shown in Figures 3 and 4), these changes did not substantially change the decision-making
players employed to choose archetypes, having very little effect on the AIS values. Interest-
ingly, AIS values actually increased immediately after T = 55, meaning this change actually
reinforced past decision-making. This is in stark contrast to AIS values occurring immediately
after T = 43 (April 2017) and T = 58 (August 2017), with the release of the Journey to Un’goro
and Knights of the Frozen Throne expansions, respectively. In fact, all of the major decreases in
AIS values in Figure 7 occurred immediately after significant changes were introduced.
Figure 8 presents the total AIS defined in Eq.(15) for K = 1. Functional responses of the past
win-rates are given in Eq.(22). The colours of each trajectory in Figure 8 matches the colours
in the right panel of Figure 6. Figure 8 displays many of the same features already discussed in
Figure 7. These include notable decreases in AIS values immediately after significant change
is introduced, and subdued responses (or slight increases) for minor change. Also, the highest
AIS values are obtained by the green trajectory, which has a similar functional response to the
pink trajectory which obtains the highest AIS values in Figure 7.
16AT1 (combined)
1.0
0.8
0.6
0.4
0.2
T
32 40 48 56 64 72 80 88 96 104 112 120 128 136 144
Figure 9: Plots of Eq.(15) for K = 1 for total AIS associated with each time period. The functional responses,
given in Eq.(24), compare both archetype frequencies and win-rates. Each trajectory is denoted by two colours
which signify which of the functional responses were combined on the left hand panel (archetype frequencies) and
right hand panel (win-rates) of Figure 6.
3.4. Combining archetype frequencies and win-rates
Figure 9 presents the AIS values which combine the archetype frequency and win-rate func-
tional responses given by
KT −1 (i| j) = fFR (∆P) × fW R (P) . (24)
| {z } | {z }
Eq.(20) Eq.(22)
Each trajectory in Figure 9 is composed of two colours. These signify which of the functional
responses were combined on the left hand panel (archetype frequencies) and right hand panel
(win-rates) of Figure 6. The trajectories in Figure 9 generally display similar features to those
seen in Figures 7 and 8. The main difference however is the marked increase in AIS values in
Figure 9, approximately doubling the values seen in Figures 7 and 8.
Recalling the duality relation between Shannon entropy, AIS and the entropy rate in Eq.(4),
we can compare the AIS values in Figure 9 with the Shannon entropy in Figure 4. Doing so en-
ables us to appreciate how much of the current state of the Hearthstone meta is captured by the
functional responses we have used to simulate player decision-making. Figure 10 plots the ex-
act value of this explain-ability (AT1 /H (X T )) per time period, for the highest AT1 values taken
from the green-pink trajectory in Figure 9. The value of AT1 /H (X T ) varies between [0, 1] for
any system. A value close to zero signifies that the assumptions used to construct the AIS reveal
very little about the current state of the system. Likewise, a value close to unity signifies that the
17AT1 /ℋ(χ T )
0.25
0.20
0.15
0.10
0.05
T
32 40 48 56 64 72 80 88 96 104112120128136144
Figure 10: Plot of the percentage of uncertainty (or surprise) within the Hearthstone meta that is explained by
considering past archetype frequencies and win-rates via the functional response given in Eq.(24).
assumptions applied to construct the AIS offers a near-to-complete explanation of the current
state of the system. The assumptions in Eq.(24) are designed to simulate understandable player
behaviour, with more popular and better performing archetypes having greater probability of
being chosen. For most time periods, Figure 10 shows that this simple principle explains ap-
proximately 20% of the Hearthstone meta. Though our assumptions do not take into account the
nuances of player motivations when faced with deck construction, the fact that AIS values drop
so dramatically immediately after large changes validates our assumptions. As discussed in
Sections 2.2 and 2.4, deck construction and tactics experimentation generally increases imme-
diately after such changes, leading to the emergence of new archetypes, and the corresponding
Shannon entropy. Hence, during these periods it would be incorrect to assume that relying on
past results to inform current decisions would lead to good outcomes. The dramatic decreases
in AIS values during these periods in Figures 7, 8 and 9 validates these assertions.
3.5. Active information storage of archetypes
(arch)
Figure 11 provides a heat-plot of the archetype AIS values per time period — A1 (XiT ) via
Eq.(14) — which were used to generate the largest combined AIS values (pink-green) in Figure
9. The horizontal axis of Figure 11 indicates each of the 166 deck archetypes considered in this
study, which are ordered alphabetically within each of the nine character classes. The vertical
axis indicates the data reaper report for the archetype AIS values. Horizontal lines in Figure 11
indicate changes occurring between reporting periods, as per the convention detailed in Section
2.2. White regions signify archetypes that did not contribute AIS values for that particular time
period. Non-zero AIS values signify that the frequency of play of these archetypes at time T
correlates with the state of the meta at time T − 1. The darker the colour, the more pronounced
the correlation.
Figure 11 reveals in greater detail the impact that change has on the various archetypes,
useful when comparing to the global picture given in Figures 7–10. Periods experiencing small
changes generally have minimal effect on the AIS values of the majority of the active archetypes
in the meta. Contrast to this, time periods experiencing large changes generally display disrup-
1831
35
39
43
47
51
55
59
63
67
71
75 0.168
Data Reaper Report
79
0.144
83
87 0.120
91 0.096
95
99 0.072
103 0.048
107
111 0.024
115
119
123
127
131
135
139
143
147
Druid Hunter Mage Paladin Priest Rogue Shaman Warlock Warrior
Archetype
Figure 11: Plot of Eq.(14), giving the archetype-AIS values per time period which were used to generate the
pink-green total AIS values in Figure 9.
tive effects, with a sizeable proportion of archetypes receiving zero AIS values, and a notice-
able change in the AIS values of the remaining active archetypes. Focusing again on the major
change occurring immediately after T = 43, Figure 9 displayed a sizable drop in total AIS val-
ues due to the Journey to Un’goro expansion and card rotation. The impacts of these changes
are made clearer in Figure 11, with a number of the active archetypes receiving no deck-AIS
values past T = 43. Nevertheless, archetypes which survive to T = 44 actually obtain a sizable
increase in AIS values, such as Midrange Hunter and to a lesser extent Miracle Rogue. Due
to these archetypes surviving the change and performing relatively well in the meta, we inter-
pret the relatively large increase in AIS values as these archetypes offering players a means to
reinforce their previous decision-making during a disruptive period.
4. Discussion and future work
In this work we applied a number of information-theoretic measures to characterise and
understand three years of game data of the online CCG Hearthstone. Producing the system’s
Shannon entropy using the frequencies that deck archetypes are played provided a unique and
useful characterisation of Hearthstone’s meta. One striking trend which manifested across the
majority of the time-period was that most of the variability in the entropy appeared immediately
after a system-wide change had occurred. Sharp increases in entropy values, usually followed
by decreases immediately after, implied a marked escalation in deck construction experimenta-
19tion after change had been initiated. Entropy decreasing soon-after can then be understood as
players understanding and exploiting the strong decks and tactics which emerged due to these
changes.
Additionally, by constructing conditional probabilities that particular archetypes were cho-
sen in the current time-period based on the past state of the system, we examined the infor-
mation storage exhibited in Hearthstone’s meta. Importantly, the weightings used to construct
the conditional probabilities simulated simple player decision-making. An undeniable feature
which emerged from the resulting AIS values were the significant decreases experienced during
periods of major change, implying that players base significantly less of their decision-making
on past outcomes during disruptive periods. Furthermore, small system changes did not signif-
icantly change the underlying decision-making players employed in their archetype choices. In
some instances AIS values actually increased, implying that such changes effectively reinforced
past player decision-making.
There are a number of avenues to further this work, both for CCGs and wider application
areas. Similar to [8], it may be possible to combine exploration of information transfer en-
tropy and AIS in an attempt to establish if the Hearthstone system in Figure 1 displays the
primitives (storage and communications) of a universal computer [14]. One could also consider
Fisher entropy [34] in an attempt to uncover control parameter(s) which influences CCG-system
criticality. An additional generalisation would include trying to algorithmically-optimise AIS
values by producing weights to replace the mathematical functions — Eqs.(20) and (22) —
used in this work. This optimisation would come with the challenge of interpreting the results
through the lens of understandable player behaviour [20]. It would also be meaningful to con-
sider the impact of constructing conditional probabilities based on archetype choices beyond
T − 1 — i.e. K > 1 in Eq.(13). As mentioned in [45] the choice must be made carefully,
since using too many past states can result in overestimation of the AIS value. Another novel
avenue would include an information-theoretic extension of the algorithmic deck construction
work of Fontaine et al. [15] by including generalised entropies similar to those considered in
Prokopenko et al. [33] to maximise synchronisation/coordination in artificial systems with the
intent of information-driven evolutionary design.
Applying similar methods to other game-related application areas, we posit that it would
be possible to gain appreciation of the evolution of other games with online systems similar
to Figure 1. An equivalent analysis of the real-time-strategy game Starcraft II, with its mix
of human players and AI [3], may offer non-trivial insights on the impacts of AI interacting
with wider society. Finally we hope that the information-theoretic results obtained about the
nature of decision-making behaviour in epochs of system-wide change will be used to examine
relevant data sets stemming from wider society. Such applications include: understanding the
economical impacts of shifts in the international political landscape [48]; and awareness of the
changing nature of population behaviours [12].
Acknowledgements
This work was supported by a Research Fellowship under Defence Science and Technology
Group’s Modelling Complex Warfighting strategic research initiative. The authors are grateful
20to the Vicious Syndicate team for agreeing to share their data set for research purposes. We
additionally acknowledge Ivan Garanovich, Scott Wheeler, Keeley McKinlay, Carlos Kuhn,
Alexander Kalloniatis, Sean Franco and Daniela Schlesier for fruitful discussions, and Mikhail
Prokopenko for helpful feedback on an early draft of this work.
References
[1] Aggarwal M. Decision aiding model with entropy-based subjective utility. Information
Sciences 2019;501:558-72.
[2] Arora P. On the Shannon measure of entropy. Information Sciences 1981;23:1-9.
[3] Arulkumaran K., Cully A. and Togelius J. AlphaStar: An evolutionary computation per-
spective. In: Proceedings of the Genetic and Evolutionary Computation Conference.
Prague, Czech Republic, July 13-17. ACM 2019 p. 314–5.
[4] Bhatt A., Lee S., de Mesentier Silva F., Watson C., Togelius J. and Hoover A. Exploring
the Hearthstone deck space. In: Proceedings of the 13th International Conference on the
Foundations of Digital Games Malmö, Sweden, August 7–10. ACM 2018.
[5] Bursztein E. I am a legend: Hacking Hearthstone using statistical learning methods. In:
Symposium on Computational Intelligence and Games. Santorini, Greece, September 20–
23. IEEE 2016.
[6] Cao S., Dehmer M. and Shi Y. Extremality of degree-based graph entropies. Information
Sciences 2014;278:22-33.
[7] Carter M,, Gibbs M. and Harrop M. Metagames, paragames and orthogames: a new vo-
cabulary. In: El-Nasr M., Consalvo M. and Feiner S. editors International Conference on
the Foundations of Digital Games Raleigh, NC, USA, May 29–June 01. ACM 2012 p.
11-7.
[8] Cliff O., Lizier J., Wang X., Wang P., Obst O. and Prokopenko M. Quantifying
long-range interactions and coherent structure in multi-agent dynamics. Artificial Life.
2017;23(1):34–57.
[9] Crutchfield J. and Feldman D. Regularities unseen, randomness observed: levels of en-
tropy convergence. Chaos 2003;13:25-54.
[10] Crutchfield J. and Young K. Computation at the onset of Chaos. In: Zurek W. editor.
Entropy, Complexity, and the Physics of Information. (Addison-Wesley: Massachusetts)
1990 p. 223-69.
[11] de Mesentier Silva F., Canaan R., Lee S., Fontaine M., Togelius J. and Hoover A. Evolving
the Hearthstone meta. In: IEEE Conference on Games. London, UK, August 20–23. IEEE
2019.
21[12] Dexter P. Historical analysis as a basis for population foresight. Futures. 2005;38:548-60.
[13] Faes L., Porta A., Rossato G., Adami A., Tonon D., Corica A. and Nollo G. Investigating
the mechanisms of cardiovascular and cerebrovascular regulation in orthostatic syncope
through an information decomposition strategy. Autonomic Neuroscience. 2013;178(1–
2):76–82.
[14] Feldman, D., McTague C. and Crutchfield P. The organization of intrinsic computation:
Complexity-entropy diagrams and the diversity of natural information processing. Chaos.
2008;18(4):043106.
[15] Fontaine M., Lee S., Soros L., de Mesentier Silva F., Togelius J. and Hoover A. Mapping
Hearthstone deck spaces through MAP-elites with sliding boundaries. In: Proceedings
of the Genetic and Evolutionary Computation Conference. Prague, Czech Republic, July
13-17. ACM 2019 p. 161–9.
[16] Garcı́a-Sánchez P., Tonda A., Squillero G., Mora A. and Merelo J. Evolutionary deckbuild-
ing in Hearthstone. In: Symposium on Computational Intelligence and Games. Santorini,
Greece, September 20–23. IEEE 2016.
[17] Garcı́a-Sánchez P., Tonda A., Mora A., Squillero G. and Merelo JJ. Automated playtesting
in collectible card games using evolutionary algorithms: A case study in hearthstone.
Knowledge-Based Systems. 2018;153:133–46.
[18] Garcı́a-Sánchez P., Tonda A., Fernández-Leiva A. and Cotta C. Optimizing Hearthstone
agents using an evolutionary algorithm. Knowledge-Based Systems. 2020;188:105302.
[19] Gencaga D., Knuth K. and Rossow W. A recipe for the estimation of information flow in
a dynamical system. Entropy. 2015;17:438–70.
[20] Hoffman R., Mueller S., Klein G. and Litman J. Metrics for explainable AI: Challenges
and prospects. 2018; arXiv preprint arXiv:1812.04608.
[21] Hohenberg P. and Halperin B. Theory of dynamic critical phenomena. Reviews of Modern
Physics 1977;49:435-79.
[22] Kalloniatis A., Zuparic M. and Prokopenko M. Fisher information and criticality in the
Kuramoto model of nonidentical oscillators. Physical Review E. 2018;98;022302.
[23] Langton C. Computation at the edge of chaos: Phase transitions and emergent computa-
tion. Physica D. 1990;42:12-37.
[24] Lizier J., Atay F. and Jost J. Information storage, loop motifs, and clustered structure in
complex networks. Physical Review E. 2012;86:026110.
[25] Lizier J. and Prokopenko M. Differentiating information transfer and causal effect. The
European Physical Journal B. 2010;73:605-15.
22You can also read