CFA Society Singapore Singapore Management University - CFA Institute Research Challenge
←
→
Page content transcription
If your browser does not render page correctly, please read the page content below
CFA Institute Research Challenge
             Hosted by
       CFA Society Singapore
  Singapore Management University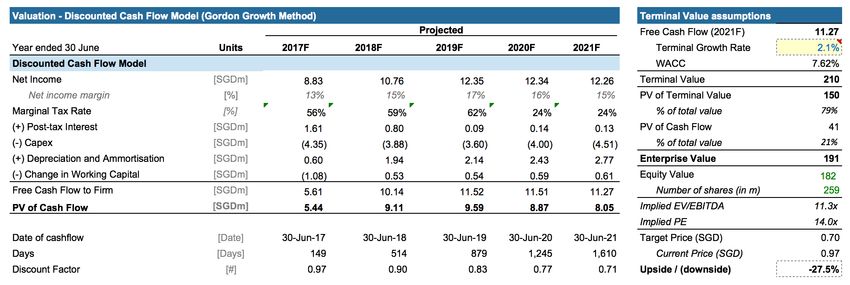
Cordlife Group Limited                                                                         å

SGX: CLGL:SP | Sector: Health Care | Industry: Providers & Services                                                           1 February 2017

Cutting the Cord: We initiate coverage on Cordlife with a sell call and a target price of
S$0.70, representing a downside of 27.5%.                                                                                 Sell
Further de-rating expected: Dismal 1Q17 results in the absence of non-core income suggests a             Price (1 Feb 17, S$)                  0.97
deterioration of earnings amid stagnation in Cordlife’s core market and intense competition in
growth markets. The decision to increase its stake in Stemlife Berhad has caused a negative              Target Price (S$)                     0.70
market reaction, sending share prices down by c30% since its peak in 2016. The resignation of
its previous CEO revealed cracks beneath the surface of this growth company and yet the high             Upside/Downside (%)                -27.5%
P/E of 28.5x suggests that investors still believe in the Company’s growth potential. Despite the
                                                                                                         Market Cap (S$mn)                  251.58
optimism, GreyStone Capital recommends a sell call on Cordlife.
                                                                                                         Number of Shares (mn)              259.36

Our take on CLGL:                                                                                        Avg. 3M Daily Vol (S$)            140,275
• Stagnant home market: Cordlife's growth in its home market has been stagnant over the
  past few years due to low fertility rates and sluggish growth in cord blood banking                    Free Float (%)                      50.9%
  penetration rates. We are also pessimistic about Cordlife's Singapore business in the years
                                                                                                         ROE (%)                              8.9%
  ahead due to a rising threat from public cord blood banking and the lack of support from
  local medical professionals.                                                                           LTM P/E (x)                           28.5
• Excessive optimism in India growth story: We believe that Cordlife has overestimated its
                                                                                                         52-week price range             0.94 - 1.72
  ability to grow in India due to two main reasons. First, the demographics and population
  characteristics of the country are not favourable to Cordlife in light of declining fertility rates
  in key regions, unaffordability of products, and religious influence. Second, we view the              Price Performance vs STI (Rebased)
  market competition in India to be extremely high and prospects are dim for Cordlife with no
  clear competitive advantage against major players.
• Questionable investments and corporate governance: Cordlife’s handling of top
  management departures leaves room for questions. Furthermore, board decisions and
  management strategies have been dismal with entry into markets with limited growth
  potential. Dubious decision were also made with regard to prior investments.
• Weak and unsustainable financials: Cordlife’s cash collection model results in a financing
  gap that will generate liquidity issues for the company. In addition, we observe that in recent
  years, the company has displayed consistently deteriorating key financial ratios including
  but not limited to gross/net income margin, debt ratios, and ROA ratios. These point to
  various inefficiencies that the company is facing such as lack of cost control and an overly
  heavy reliance on investment income, etc.
• Valuation: With a 5-year DCF valuation model as our primary valuation methodology,                     Major Shareholders
  factoring in a WACC of 7.6% and terminal growth rate of 2.1%, we arrived at a target price             Kunlum Investment Holding            21.4%
  of S$0.70, representing a downside of 27.5% from the last closing price. Our target price              Ltd
                                                                                                         Nanjing Xinjiekou Dept. Store        20.0%
  corresponds to an implied P/E of 14.0x and EV/EBITDA of 11.3x which is still consistent with
  industry norms. We strongly believe that Cordlife currently does not offer a compelling risk-          China Stem Cells (East) Co           9.84%
  reward profile for investors given its positioning against macro headwinds, weak growth                Ltd
  prospects and sub-par corporate governance.

                                                                                                         Analysts
 Financial Valuation and Metrics
                                                                                                         Haruki Chua Una Qiang
  Year                     FY16A         FY17E         FY18E         FY19E        FY20E       FY21E      haruki.chua.2014@economics.smu.edu.sg
                                                                                                         +65 9115 6533
  Revenue (S$ mn)            59.6          65.5          69.9          74.4          79.3       84.4     Ian Chua Yong Kwang
  Net Profit (S$ mn)         13.0           8.8          10.8          12.4          12.3       12.3     ian.chua.2014@accountancy.smu.edu.sg
                                                                                                         +65 9627 2720
  EPS ($)                    0.05          0.03          0.04          0.05          0.05       0.05
                             12.1           9.8          15.4          15.2          14.6       14.0     John Lim Keng Siang
  Rev Growth (%)                                                                                         kslim.2014@business.smu.edu.sg
  ROA (%)                      4.3          3.2           3.9           4.3           4.1          3.9   +65 8128 4195
  ROE (%)                    8.9%           6.5           7.5           8.1           7.6          7.1   Vedant Daga
                                                                                                         vedant.daga.2014@economics.smu.edu.sg
  P/E (x)                    25.2          37.2          30.6          26.6          26.6       26.8     +65 9469 5771
  EV/EBITDA (x)              15.2          16.5          15.6          15.4          15.2       15.0
                                                                                                         Zhong Ying Yi
  EBIT Margin (%)              3.2          1.3           1.8           1.7           1.5          1.3   yy.zhong.2014@economics.smu.edu.sg
                                                                                                         +65 9423 5769
  BV/Share (S$)              0.51          0.53          0.57          0.60          0.64       0.68

  Source: Company data, Bloomberg, GreyStone Capital estimates

                                                                                                                                         Page 1
Cordlife Group
2. Business Description
2.1 Core Business                                                                               Figure 2.1: Cordlife Operating Segments
Cordlife Group Limited (“Cordlife” or “the Group”), established in 2001, is a healthcare
company catering to the mother and child segment. It provides Cord Blood Banking and                                    Operating
Umbilical Cord Lining Banking services, which can be used in the future to harvest                                      Segments

Haematopoietic Stem Cells (HSCs) and Mesenchymal Stem Cells (MSCs) respectively
                                                                                                   Cord Blood           Cord Lining           Diagnostics
for the treatment of some diseases.                                                                 Banking              Banking               & Others

The business sells “hope” to expectant parents, as an insurance for the unexpected
                                                                                                                99.1%                            0.9%
possibility of their child being stricken with these diseases some day. Cordlife promises to
be that one chance to make an investment that could potentially save their child from
death. In addition, these stem cells could possibly treat the siblings, parents and                                           Source: Company data
grandparents in some cases, with a decreasing rates of success.
                                                                                                Figure 2.2: Pricing Structure in Singapore

2.2 Revenue Segments
Cord blood banking and cord lining banking are the main revenue sources for Cordlife,
accounting for 99.1% of its revenue in 2016. In 2013, Cordlife launched a complementary
offering, Metascreen, through its Diagnostics business unit. Metascreen tests newborn
babies for a wide variety of disorders. However, these complementary services contribute
less than 1% of Cordlife’s revenues (Figure 2.1), and appear to be inapplicable to the
group’s domestic market. Cordlife targets educated expectant mothers who place                                                Source: Company data
significant interest in the lives of their children. The service is considered as a luxury as
the initial payment is at a nominal fee of $1,950 (Figure 2.2), which adds significant cost     Figure 2.3 Revenue Breakdown by
to childbirth. In Singapore, this service can be subsidised by the the Child Development        Geography
Account (CDA) (Appendix B), with a dollar for dollar payment scheme.
                                                                                                                                              India
                                                                                                                                 S$12.2mn (20.5%)
2.3 Diversified operations over Asia-Pacific region
Headquartered in Singapore, 49.4% of Cordlife’s revenues come from its domestic
market. India, the expected growth market for the company, contributes 20.5% of
                                                                                                Hong Kong
revenues. The rest of the revenue come from Hong Kong (8.1%), Malaysia (5.8%),                                                  FY16
                                                                                                S$4.9 (8.1%)
Philippines and Indonesia (Figure 2.3).
                                                                                                                              S$59.6mn

3. Industry Overview and Competitive Positioning                                                Malaysia
                                                                                                S$3.5mn (5.8%)

3.1 Key Industry Factors - Cord blood and cord lining banking are expensive services                    Othes                                  Singapore
that mounts onto the already costly process of childbirth, making it only applicable to the             S$9.7mn (16.2%)                  S$29.4mn (49.4%)
wealthy in most countries and possibly the upper middle class of developed countries.                    Singapore   Others   Malaysia   Hong Kong   India

Therefore, the size of the affluent population is a critical factor for success in a country                                  Source: Company data
and this is reflected in a high industry penetration rate in Singapore and its struggle with
slow penetration growth rates in emerging markets.
                                                                                                 Figure 3.1: Porter’s 5 Forces Industry

In addition, a cord blood bank’s sales channels, comprising its partnered gynaecologists
and sale representatives, are crucial to its success of selling hope to expectant parents.
Success of the business is also largely dependent on favourable government regulations
which determine the ease of market entry and competition between players. Lastly,
although the uses of cord blood banking are currently limited, future medical
breakthroughs could be an additional boost to the success of the business.

3.2 Porter’s Five Analysis - Competitive rivalry is the strongest of the five forces that
shape the industry as there are at least five other firms vying for market share in the
markets that Cordlife has earmarked as strategic growth markets, with the only
exception in domestic market (62% market share). The services provided by cord blood
banks have limited differentiating factors, which make them close substitutes.                                                Source: Company Data
Competition between firms are dependent on their marketing capabilities. Threats of new
entrants are high due to low regulation in emerging economies and high potential for              Figure 3.2: Cordlife's market shares
growth. Management cited that a key component of cost is labor due to the scarcity of
expertise in the field and high demand for them in similar industries. Buyer bargaining
power is high as a result of numerous competitors offering the same service, which
makes the cost of switching relatively low. Threat from substitutes is moderate as well
since other life science technologies such as haploidentical transplants may be a better
alternative treatment.

Competitive Positioning - Cordlife is the market leader in its domestic market with 62% of
the private cord blood banking industry. In India and Hong Kong, Cordlife is the 2nd
largest player with 17.5% and 27% market share respectively (Figure 3.2). However, in
both countries it it falls far behind local incumbents which control nearly 50% of the
market. In each of its other market, Cordlife is the market leader (refer to Figure 3.3).                                      Source: Company data

                                                                                                                                                     Page 2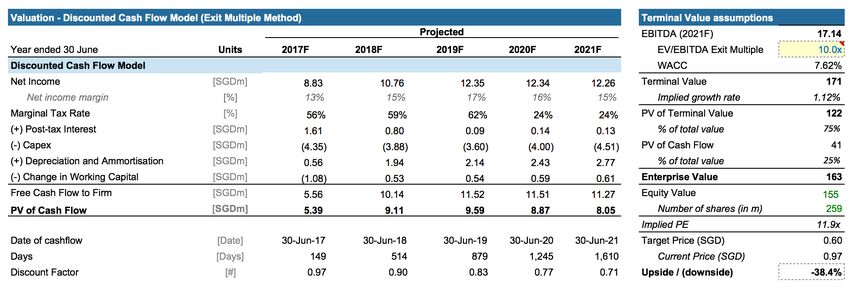
Cordlife Group
3.3 Private blood banking rate slumping in Western countries - The global cord blood
Figure 3.3: Key Competitors
banking market is highly fragmented and is characterized by the presence of dispersed
public and private cord blood banks operating all over the world. Despite the initial high
growth over the past decade, the private cord blood banking industry in the west is
currently challenged by declining banking rates and increasing costs due to the
requirements of new accreditation statuses. In the US, medical associations such as the
American Academy of Pediatrics and American Medical Association recommend public
cord blood banking over private cord blood banking due to the practice of unethical
marketing to pregnant mothers and high costs. European countries such as France and
Italy ban private cord blood banking completely. The use of cord blood in treatment is
gradually declining as a result of poor effectiveness in multiple situations, where
physicians often opt for more tried and tested cures. Potential customers are starting to
Source: DBS Vickers Research
realize the lack of use for stored cord blood as the number of cord blood transplants are
declining at an average rate of 11.9% from 2012 to 2014 (Figure 3.4). The private blood
banking industry in Western countries is seemingly in distress. Figure 3.4: Number of Cord Blood
Transplants in US
3.4 Shadowing the West - Compared to its Western counterpart, Asian private cord
blood banking industry started a decade later. Currently, it is still at a relatively early stage
1,400 0.04
where most countries have very low cord blood banking penetration rates such as 1180.0 1196.0 1220.0
0.02
1,200 1113.0
Philippines and Indonesia (Figure 3.5). With such low penetration rates, these countries 1,000 946.0
0.00
-0.02
are often viewed to have high potential for growth. However, the Asian private cord blood 800
-0.04
industry has begun to experience headwinds similar to its Western counterparts. The 600
-0.06
-0.08
Singapore and Hong Kong markets are fast realizing dismal prospects due to stagnating 400 -0.10
population rates and market saturation while the emerging markets do not have a large 200
-0.12
-0.14
enough affluent population to support such luxurious services. 0 -0.16
2010 2011 2012 2013 2014
No. of Cord Blood Transplant YOY % Growth
3.5 Limited use of Cord blood - The lack of medical advancements in cord blood stem
cell technology brings about a lack of utility for cord blood banking. However, private Source: BioInformant
banks have been overstating the utilization rates of stored cells when marketing their
products. Some private banks claim a utilization rate of 0.5%, yet medical experts have
suggested that retrievals are actually only between 0.04% and 0.0005% representing a
probability of 1 in 20,000. This low rate can be attributed to the following reasons: Figure 3.5: Cord Blood Penetration Rate in
Asian Countries
1) World Health Organization estimates that only 47 children out of one million, aged one
to fourteen, are stricken with Leukemia each year and stem cell transplant is usually not
Indonesia 0.2%
the first option for treatment, with only 20% of treatments applicable for the use of HSCs.
Philippines 0.1%
Furthermore, transplant doctors from the reputable Mayo Clinic do not view the patient’s
own cord blood as the ideal choice as it lacks the graft versus leukemia effect that is only China 2.1%
present when using stem cells from another individual. Hong Kong 7.5%
India 0.8%
2) Lack of use outside blood diseases - Claims that cord blood can be used to repair
Singapore 22.0%
tissues other than blood are extremely controversial as doctors are unable to replicate the
0.0% 5.0% 10.0% 15.0% 20.0% 25.0%
results consistently. To date, these treatments are considered “experimental”.
Source: Company Data
3) Ineffective once children exceed 45 kilograms - The amount of stem cells harvested
from umbilical cord blood will fall short of the minimum required for stem cell transplant
once the child exceed 45 kilograms. This usually happens when a child crosses the age
of 10. Treatment for children above 45 kilograms requires more HSCs, and a transplant
with too little HSCs may result in ineffective treatment due to slow formation of new blood
Figure 3.6: Number of Deliveries in Hong
in the early days of transplant.
Kong
3.6 Dipping macroeconomic indicators in competitive grown markets - The cord
100 0.05
blood banking industry in Cordlife’s key markets face slumping birth rates, which deters 90
90.3
0.00
the private cord blood banking industry from growth. Birth rates in Hong Kong were 80 -0.05
70
61.3
significantly boosted by Mainland Chinese childbirths seeking a high quality of service, 60
58.9 59.3 59.5 59.9 60.2 60.9 -0.10
-0.15
these births accounted for 35-40% of the annual new births. In 2013, China banned 50
40
-0.20
Mainland Chinese mothers from giving birth in Hong Kong, thereby slashing Cordlife’s 30
-0.25
20 -0.30
potential customers by 40% and pushing delivery growth to a meagre rate of 0.6% 10 -0.35
(Figure 3.6). 0
2012 2013 2014 2015 2016 2017 2018 2019
-0.40
No. of Births ('000) YOY % Growth
Source: Census and Statistics Department,
Hong Kong
Page 3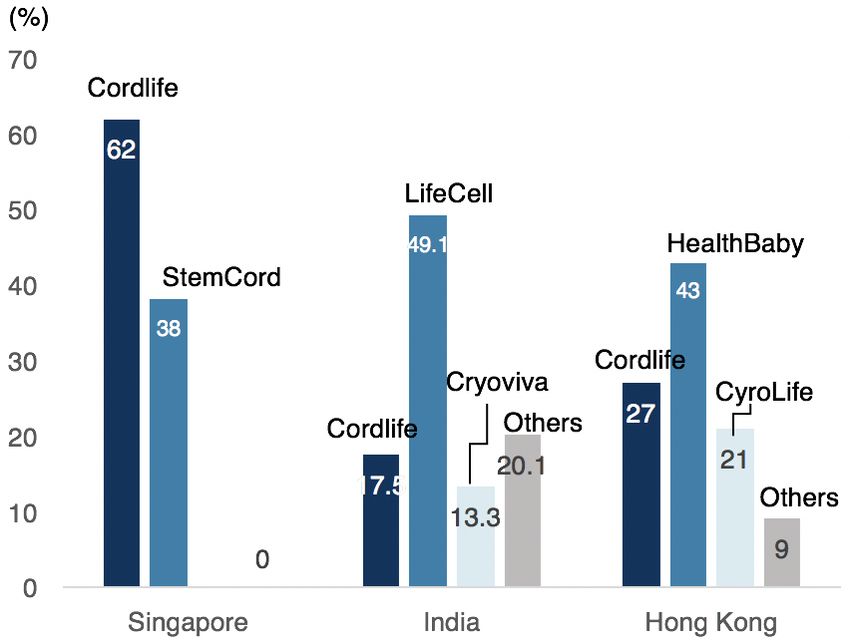
Cordlife Group
4. Investment Summary Figure 4.1.1: Singapore Total Population
Growth Rate
4.1 Stagnant home market
3.00%
Limited growth potential within Singapore – There are two ways for Cordlife to grow 2.50%
2.50%
revenue in Singapore and that is either through growth in market size, or through higher
2.00%
penetration rates. In spite of numerous government policies and incentives, there are
currently little positive indications regarding Singapore’s birth and total fertility rates in the 1.50%
1.60%
near term (as shown in figure 4.1.1) - this leads us to believe that the local market size will 1.30% 1.30%
continue to remain stagnant or shrink over the next few years. 1.00% 1.20%
0.50%
According to Deloitte, existing penetration rates for private cord blood banking are
expected to grow minimally from existing levels of ~22.2% to 22.4% in 2018 (Figure 0.00%
2012 2013 2014 2015 2016
4.1.2). This is in line with Cordlife’s historical performance, which has seen penetration
rates increase by a mere 0.4% since 2014. We believe penetration rates are stagnant Source: SingStat
within Singapore because of (i) An increasing number of parents who are donating their
cord blood to Singapore’s public cord blood bank SBCC and (ii) Medical professionals Figure 4.1.2: Private Cord Blood Banking
who are encouraging patients to store their cord blood with public cord blood banks. Penetration Rates in Singapore (%)
Singapore public cord blood bank - More parents are donating their cord blood to the
Singapore Cord Blood Bank (“SCBB”) and this can be seen from the strong growth of it’s
inventory at a 9% CAGR over the last 5 years. SCBB attributes the strong growth in 2018F 22.4
inventory to a growing awareness among parents in Singapore regarding the benefits of
storing their cord blood with public cord blood banks. In addition, storing of cord blood
with public banks is also supported by publications by extremely renowned institutions
such as the American Academy of Pediatrics and the American Society of Blood and 2016 22.2
Marrow Transplantation.
0.0 5.0 10.0 15.0 20.0 25.0
Local medical professionals - Singaporean medical professionals are encouraging
patients to donate cord blood to public banks instead of storing them with private banks in Source: Deloitte
light of the extremely low rates of use of privately stored cord blood. An increasing
number of parents are also growing aware that storing of cord blood with public banks
benefits a wider pool of patients and has a significantly higher chance of being used Figure 4.1.3: Percentage of Cord Blood
(2.2% vs 0.02%) (Figure 4.1.3). This is because one of the major limitations of cord blood Used
use is that transplant doctors often do not view the patient’s own cord blood as the best
choice for the patient due to the graft effect.
4.2 Excessive optimism on India growth story
Cordlife has ramped up efforts to capture the growing Indian market with its core
characteristics of high fertility rates and a burgeoning middle class. Though the company
has increased its marketing expenditure by 45.3% in 2015, we still see little effect on the
company’s top-line - with revenues experiencing a decline over the previous year. We
believe that Cordlife will not be able to successfully realise the perceived potential of the
Indian market because of 2 key reasons:
India’s demographics and population characteristics are not in Cordlife’s favour. Source: Greystone Capital Estimates
The monthly disposable income of the majority of households in India is insufficient to
enable them to afford the services of Cordlife (Figure 4.2.1). In addition, we see that
within the main target market of people living in urban areas, there is a low fertility rate of
Figure 4.2.1: India Monthly Disposable
1.8 (Figure 4.2.2). This is lower than many developed nations including the United States Income
and the United Kingdom. To make matters worse, the rate is declining as the millennial
population is more focused on career progression, independence and increased
350,000
Number of Households (in '000)
disposable income that results from not having children. 300,000
Households that cannot afford
private Cord blood banking
250,000
Lastly, we note that within India itself, a large portion of the market remains inaccessible 200,000
150,000
to Cordlife because of the influence of Hinduism, where parents are prohibited from
100,000
storing the umbilical cord after birth. We believe that this influence is substantial based on 50,000
census data which support the the fact that more then 80% of India's population 0
subscribe to these religions.
42
83
8
5
0
7
3
0
17
67
00
20
62
25
91
58
25
,4
,6
,0
1,
2,
4,
6,
10
16
25
Monthly Disposable Income (US$)
Even with all these obstacles within the Indian market, we do acknowledge that there is 2016 2021
still a sizable market for cord blood banking in India. With better education institutions and
greater awareness among people. It is forecasted that the market for cord blood banking Source: Euromonitor
in India will be growing with a CAGR of 15-20% from 2016-2021.
Page 4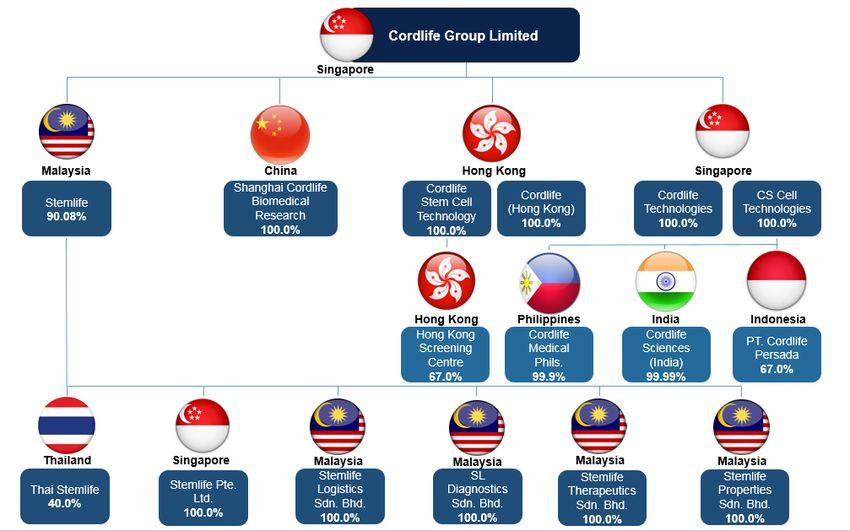
Cordlife Group
                                                                                                Figure 4.2.2: India Fertility Rates
Even with the high growth, Cordlife faces intense competition and lacks the
competitive advantage to challenge other major players - A study of the prices of
major suppliers show that Cordlife is the least competitive cord blood bank among the
top 3 players in India (Figure 4.2.3). As mentioned in The Economist, India is an
extremely price sensitive market and the ability to lower prices whilst providing similar
quality services is highly advantageous for any service provider.

Taking a look at each player’s presence across India, we see that the market leader,
LifeCell, has nearly 200 service centres and a network of 5,000 gynaecologists across
the country. They currently have approximately 100,000 customers that include some of
India’s biggest celebrities. The next closest competitor CyroViva also has more than 100
                                                                                                                          Source: United Nations ,World Bank
service centres. Comparatively, Cordlife has only 50 service centres in India catering to
about 20,000 clients. This lack of presence makes it difficult for the company to compete       Figure 4.2.3: Pricing Comparison
effectively against the larger players.

A recent Nielson survey in 8 of the biggest cities in India also revealed LifeCell to be the         Cordlife                                   60,000

most preferred service provider in the Indian market. This main competitor has
technological collaborations with Cryo-Cell, the world’s first private cord blood bank,              CyroViva                                  57,000

which has enabled it to possess equipment that matches Cordlife’s Sapex©2, an
automated cord blood processing system. In addition to this, LifeCell also offers a dual              LifeCell                        41,990

storage facility that Cordlife does not, which benefits clients by reducing risk from
external damage as well as faster retrieval times.                                                               0          10,000   20,000     30,000    40,000   50,000   60,000   70,000

                                                                                                                                                         Source: Company Data
4.3 Questionable Investments and Corporate Governance
                                                                                                Figure 4.3.1: Cord Blood Units in Stemlife
Puzzling decisions – Key decisions made by the board and its shareholders have been
peculiar, much to the ire of major shareholders who concurrently sold off their share in                  60000

Cordlife in the first quarter of 2016. These decisions include the surprising dismissal of                50000

former Chief Executive Officer, Mr Jeremy Yee, who claims to have been wrongly                            40000

dismissed as he was not given a chance to renegotiate details in his contract.
                                                                                                          30000

Venture into unappealing territory – Cordlife’s entry into Malaysia through its                           20000

investment in Stemlife coincides with a weakening demand for private cord blood                           10000

banking service (Figure 4.3.1). Demand for Stemlife’s service appears to have dwindled                               0

as the reported number of units stored appears to have stalled at 53,000 over the past                                    2007 2008 2009 2010 2011 2012 2013 2014 2015 2016

three years.
                                                                                                                                                        Source: Stemlife AR

This is further aggravated by a limited pool of customers as private cord blood banks do        Figure 4.3.2: Life-births in Malaysia
not have access to childbirths at public hospitals in Malaysia. This limits the market to
just 17% of all live-births in Malaysia (Figure 4.3.2). The Ministry of Health adheres to the                            Private,
European Union’s strict stand on the unethicality of private cord blood banking thereby                                   17%

limiting private cord blood banking’s access into public hospitals.

Despite the pessimism and Stemlife’s inability to turn a profit since 2014, Cordlife has
been increasing its stake in Stemlife and has consolidated the business as a wholly
owned subsidiary (Figure 4.3.3). In his annual report address, Dr Ho also warned of poor
market conditions and result in the year ahead.

Other investments – Apart from the major acquisition of Stemlife, Cordlife has been                                                                                         Public,
                                                                                                                                                                             83%
investing heavily in its Philippines and Indonesia business. On the surface, Indonesia
and Philippines appear to be ideal markets to enter with healthcare expenditure growing
at a five year CAGR of 10.4% and 9.8% respectively, figures shown in Appendix G.                    Source: Department of Statistics, Malaysia
However, a bulk of this expenditure is attributed to basic health care rather than luxury
                                                                                                Figure 4.3.3: Stemlife profits vs Cordlife
services like cord blood banking and growth in sales is unlikely to be as positive.
                                                                                                ownership

Indonesia’s growth of 10.4% is largely attributed to its Jaminan Kesehatan Nasional                  6                                                                                  100%

(JKN) universal healthcare scheme and its burgeoning middle class population which is                5
                                                                                                                                                                                        90%

expected to grow from 109 million to 168 million, figures are shown in Appendix G and H              4
                                                                                                                                                                                        80%

                                                                                                                                                                                        70%
respectively.                                                                                        3
                                                                                                                                                                                        60%

                                                                                                     2                                                                                  50%
Philippines’s growth in healthcare expenditure will also be a result of its National                 1
                                                                                                                                                                                        40%

Healthcare Insurance Programme (NHIP) backed by PhilHealth which is expected to                      0
                                                                                                                                                                                        30%

reach full coverage by 2020.                                                                        -1
                                                                                                             2011             2012        2013           2014      2015      2016       20%

                                                                                                                                                                                        10%

                                                                                                    -2                                                                                  0%

                                                                                                                                       Source: Greystone Capital

                                                                                                                                                                                      Page 5
Cordlife Group
With rapid expansion in high growth markets in mind, Cordlife has maximised its Figure 4.3.4: Stemlife Operating Margin
marketing efforts in its market entry into new cities in order to anchor the market. This has
resulted in severe margin compression from a 5-year high of 21% to 3% (Figure 4.3.4). 25%
Furthermore, according to their results presentation in November 2015, Cordlife is
20%
adopting the word of mouth and client referral methods to acquire customers. This is not
the most effective method as Pew Research studies have shown that only 24% of people 15%
surveyed feel that fellow patients and friends are more helpful when they need
information about alternative treatments, which cord blood banking falls under. 10%
5%
Unclear transaction rationale - On 3 October 2012, China Cord Blood Corporation
0%
(CCBC) sold US$50m par value of convertible notes to Golden Meditech to fund its 2012 2013 2014 2015 2016
expansion in China. These convertible notes were subsequently sold to Cordlife and
EBIT Margins
Magnum Opus on 10 November 2014, with Magnum Opus engaging a facility agreement
with Cordlife to borrow US$46.5m in order to partake 50% of the purchase of the Source: Stemlife AR
convertible note, representing a significant premium. This was a form of related party
transaction as Cordlife was directly related to CCBC and indirectly associated with GM
(Figure 4.3.5). Figure 4.3.5: Shareholdings in CBCC
Cordlife funded the purchase of the notes and loan to Magnum Opus with a S$120m
multicurrency debt issuance. It has to be noted that the nature of the entirety of
transaction would result in the exact same interest income earned as if Cordlife had used
the funds raised to purchase the entirety of the convertible note on its own. Cordlife’s risk
was also not mitigated in the transaction as Magnum Opus would likely default its interest
payment if CCBC defaults on Magnum Opus.
Source: Greystone Capital
In its extraordinary general meeting in November 2014, Cordlife presented this as an
“inorganic growth opportunity” yet it did not capitalise the opportunity to own a larger
share of CCBC. Had Cordlife purchased 100% of the convertible notes, their diluted
interest would amount to 27.51% instead of 17.79%. In summary, the only difference the
Figure 4.3.6: Convertible Note Transaction
facility agreement made was to reduce Cordlife’s potential diluted shareholding of CCBC,
while allowing Magnum Opus to gain 9.72% diluted ownership at almost no cost. Magnum
Opus is fully owned by Kam Yuen, former chairman of Cordlife.
S$120
multicurrency
debt
programme
5. Financial Analysis Cordlife
“CGL Note”
US$44.065m
Kam Yuen Facility Convertible
Agreement Note
5.1 Financing gap from cash flow mismatch – Cordlife incurs approximately 70% of
costs of sales upon signing of the contract due to the processing required to store cord 100% Magnum Opus
“Magnum Note”
US$44.065m
ownership
blood in addition to the upfront marketing and administrative costs. However, under its
pricing policy, customers are charged an upfront fee of $1,950 and a payment of $250
Source: Greystone Capital
over the next 20 years. As shown in fig 5.1, the costs required to prepare the cord blood
leads to an immediate cash outflow that is not matched by the cash inflow from the
upfront payment. This results in a huge financing gap that lasts for 19 years.
Figure 5.1: Cashflow Mismatch
Year Cash Flow Cumulative CF Cost Cumulative Cost
The financing gap will result in liquidity issues for Cordlife as they have to periodically
0 1950 1950 5842 5842
raise capital to cover this gap. This can be seen in the company’s increasing level of 1 250 2200 35 5877
2 250 2450 35 5912
debts in recent years up till the sale of the stake in CCBC. In addition, there are no strong 3 250 2700 35 5948
penalties for customers who terminate their policy prematurely upon their child growing 4 250 2950 35 5983
5 250 3200 35 6018
older and facing less possible use for the cord blood. These factors reflect fundamental 6 250 3450 35 6053
7 250 3700 35 6089
flaws in the company’s business model. 8 250 3950 35 6124
9 250 4200 35 6159
10 250 4450 35 6194
11 250 4700 35 6230
12 250 4950 35 6265
13 250 5200 35 6300
14 250 5450 35 6335
15 250 5700 35 6371
16 250 5950 35 6406
17 250 6200 35 6441
18 250 6450 35 6476
19 250 6700 35 6511
20 250 6950 35 6547
Source: Greystone Capital
Page 6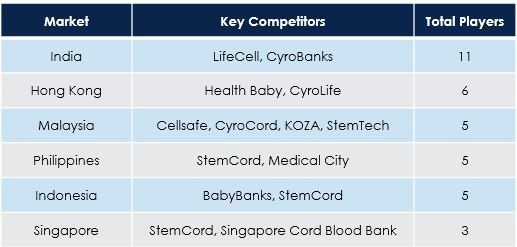
Cordlife Group

                                                                                              Figure 5.2: Decline of Gross Margins
5.2 Weakening Gross Margins – The Company has traditionally been able to maintain
gross margins at stable levels above 70%. However, this competitive advantage has
eroded and we witness a steady decline in gross margins over the last 4 years from 73%
to 66% (Figure 5.2). Management has attributed this to greater revenue contribution from
operations with lower profit margins and more stringent compliance practices, but the
conclusion is still an inability to reap cost efficiencies as the company has been claiming
to do so over the last few years. More importantly, this decline in margins has resulted in
a net fall in operating income, despite a deceptively decent top-line growth.

5.3 Declining revenue/delivery – “Deliveries”, defined by the company as the number
of new clients who store their cord blood, is a key driver of the company’s revenue. The
                                                                                                                   Source: Company Data
company has sold its strong growth potential and penetration ability by focusing on the
fact that the number of deliveries has increased substantially over the past few years.       Figure 5.3: Revenue/Client Delivery
However, upon a deeper analysis of this number, we see that in spite of the increase in
number of deliveries, the revenue/delivery has been steadily declining at an 18.3%
CAGR over the last 5 years, indicating that this growth in deliveries has been due to
either (i) Reduction in prices to gain market share (ii) Through acquisitions of cord blood
banking companies which charge lower prices for their services. This reveals a deceptive
picture of growth potential that investors should be aware of.

5.4 Crash of ROE – Perhaps the most important indicator for investors, the company’s
return on common equity has crashed, declining from 27.86% in FY2014 to 8.87% in
FY2016 (Figure 5.4). Breaking down this figure using the 5-step Dupont analysis raises
more insights:                                                                                                     Source: Company Data
                                                                                              Figure 5.4: Crash of ROE
1) Halving and deceptive net profit margins – Net margins fell by more then half from
55.8% in FY2015 to 22.3% in FY2016. This is largely attributed to a reduction in fair value
gains from financial investments and derivatives, which shows the companies’ overly
heavy reliance on its investment income in proportion to net income (an average ~30% of
net income has come from investment income over the last 3 years). In fact, upon
removal of gains from financial investments and derivatives, we see a 3-year average net
profit margin of 19% as compared to the current average of 47%.

                                                                                                        Figure Dupont Analysis
2) Decline of ROA – Striving for sales growth often means higher upfront investments in
assets such as accounts receivable, inventories, PPE etc; this is what Cordlife has been
doing with increased levels of both receivables and inventories. However, an increase in
assets without a matching rate of increase in sales will not bode well for the company in
the long run. To note, we also see that the average accounts receivable days for Cordlife
have steadily increased, displaying the company’s sacrifice of A/R collection efficiency to
boost sales.

3) Rising leverage (D/E and A/E) – Though the company improved its leverage position
in 2016 from 1.34x to 0.81x, its balance sheet is still significantly weaker then it was in
2014 (when D/E ratio was 0.13x). This debt to equity ratio is almost thrice as high when
compared to industry peers, which has an average D/E ratio of 0.3, raising another red
flag for investors.

5.5 Weak cash flow picture – For both FY2015 and FY2016, Cordlife generated
negative S$3.4m and S$4.4m of operating cash flows respectively. Compounded with the
rising levels of capital expenditure, Cordlife had a free cash flow of negative S$9.6m in
FY2016. This is mitigated by the company’s strong cash flow from investing activities
(attributed to the sale of their CCBC shares and early settlement of the loan to Magnum
Opus Holdings which generated a cashflow of $215.5m). However, FCF still remains as a
key indicator of weakness in Cordlife’s core business.

                                                                                                                  Source: Company Data

                                                                                                                                    Page 7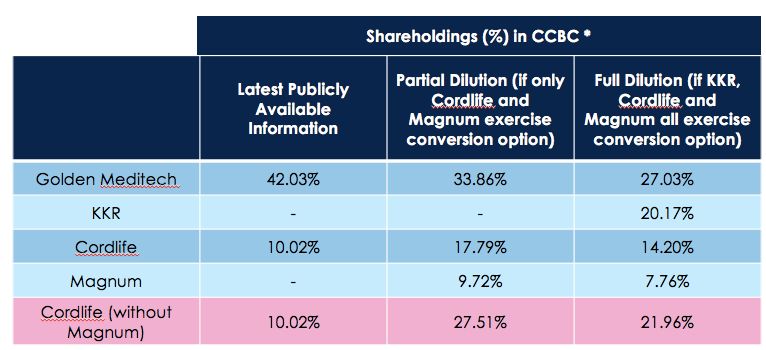
Cordlife Group
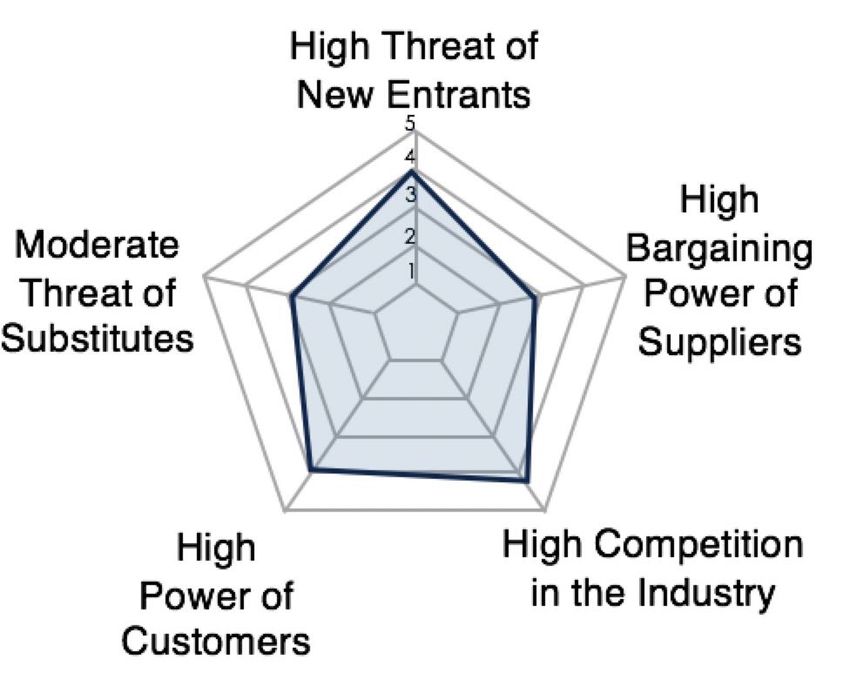
6. Valuation
Given the recurring nature of revenue flow, stable and positive operating cash flow, Figure 6.1: WACC
predictable capex requirements and net cash position, we adopted a 5-year DCF
valuation model as the favoured valuation method. Based on a WACC of 7.6% (Figure
6.1) and terminal growth rate of 2.1%, we arrived at a target price of S$0.70, representing
a downside of 27.5% from the closing price. Our target price corresponds to an implied
PE of 14.0x and EV/EBITDA of 11.3x which is still consistent with industry norms.
6.1 WACC and Terminal Growth
Considering the multiple geographical regions in which Cordlife operates, the team used
a blended equity market risk premium (EMRP) of 6.92% to calculate CoE. The blended
EMRP comprises the EMRPs of Cordlife’s core markets weighted according to their
percentage contribution to Cordlife’s total revenue (Figure 6.2). In addition, the team
opines that AAA-rated Singapore’s 10Y government bond with a yield of 2.30% remains
the best proxy for a risk-free rate. For Beta, we used a bottom-up approach to attain a
beta of 0.95 and a D/E ratio of 0.81 (Figure 6.3) as regressing Cordlife’s stock price
against a single Asian index would not be fully representative of its geographical
diversification. Lastly, a terminal growth of 2.1% attained by comparing the long-term Source: Greystone Capital
growth rate estimates by IMF and OECD across Cordlife’s various core markets. More
details can be found in Appendix I. Figure 6.2: Blended Equity Risk Premium
6.2 Revenue Projections
A top-down approach was taken to size Cordlife’s annual client base in each core market
with key drivers being (1) country population growth, (2) private cord blood banking
penetration growth rates and (3) Cordlife’s market share in each country. The obtained
market size was then multiplied using country-specific pricing plans to attain relevant and
reliable revenue projections. In addition, the team also factored in customer defaults and
premature terminations due to unsuitability for storage at 0.2% and 5%. Details and
assumptions can be found in Appendix J.
6.3 Alternative Valuation Methods
To supplement our primary DCF valuation, we used secondary approaches to calculate Source: PwC Tax Rates, Greystone Capital
implied intrinsic prices such as the Residual Income Model (RIM) and Exit-multiple based
DCF model. These methods achieved an intrinsic share price of S$0.63 and S$0.60 Figure 6.3: Beta Calculation
respectively, which are both below that of our TP of S$0.70 (Appendix K).
On a relative valuation (RV) basis, Cordlife is currently trading at a 1 year forward P/E of
28.5x versus a median P/E of 26.7x for the global cord blood bank peers (core peers) and
33.7x for local healthcare peers. However, we recognise the limitations of RV for a stock
like Cordlife due to the following reasons: (i) Inconsistency of revenue recognition
accounting policies and (ii) Differing geographical boundaries of operation resulting in
unsuitable peer comparisons. Refer to Appendix M for further details of Cordlife’s trading
comparables.
By consolidating the various implied prices in a football field chart (Figure 6.4 below), we
Source: Greystone Capital
observe that our TP of S$0.70 lies above 6 out of 7 valuation methods reflecting fairness
rather than being overly bearish. We note that the current price of $0.97 is way above the
range of most valuation methods and can only potentially be justified using a fwd P/E
multiple. As such, we are confident that a downside of 27.5% is well-justified.
Figure 6.4 Football Field Analysis
Source: Greystone Capital
Page 8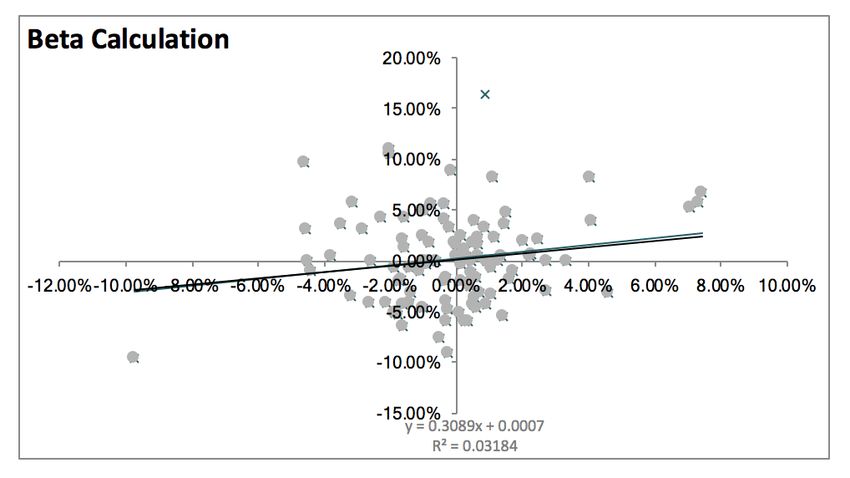
Cordlife Group

6.4 Sensitivity Analysis
                                                                                                 Figure 6.5: Sensitivity Analysis
Our sensitivity analysis (Figure 6.5) conducted by varying WACC (±1.0%) and terminal
growth rate (1.6% ~ 2.5%) reflects a potential price range of between S$0.58 and S$0.90
which is still below current price of S$0.97. This lends further support to our sell
recommendation.

6.5 Historical Comparisons
Using a P/B Band Chart, we observe that Cordlife is trading at a high of 2.2x. (Figure 6.6)
From a P/E Band Chart perspective, Cordlife is currently trading close to the historical                            Source: Greystone Capital
high P/E band of 29.3x indicating huge room for downward price adjustment. (Figure 6.7)
P/E metric is a more relevant metric considering the asset-light nature of the business.
                                                                                                 Figure 6.6: P/B Band Chart

6.6 Further de-rating Catalyst
We remain confident that Cordlife’s intrinsic value will be realized upon (i) subsequent
release of earnings result when regional headwinds hit the company’s bottom line or
(ii) when more light is shed on Cordlife’s intriguing corporate governance and recent
decisions made.

7. Investment Risks

Market Risk (MR1): Increase in curable disease
The value proposition of cord blood banking lies in the number of diseases that the stored
stem cells can treat. In the last three years, research on the potential use of stem cells in
therapy has increased from US$1.273bn to US$1.495bn. This amount spent was solely                                   Source: Greystone Capital
attributed to the United States National Institutes of Health (NIH). Given the potential of
stem cells and the amount invested to determine ways that it can be used in treatment,           Figure 6.7: P/E Band Chart
more discoveries of treatable diseases are likely to surface over time, which might
increase the demand for cord blood banking.

Operational Risk (OR1): Successful marketing campaigns
In its aggressive plan to expand in high growth markets in India, Indonesia and
Philippines. Cordlife has spent excessively on marketing, and if these marketing efforts
result in growth beyond expectation, our bull case estimates intrinsic value will be S$0.99
(14% higher).

Operational Risk (OR2): Improvement of distribution channel
As with most medical products, a crucial part of the business is the strength of its
distribution channels. The direct channels in this industry are the doctors and if Cordlife is
able to provide substantial medical benefits to convince more doctors and hospitals to
promote its service, it might result in higher sales.
                                                                                                                    Source: Greystone Capital
Strategic Risk (SR1): Acquisition by Nanjing Xinjiekou
Nanjing Xinjiekou acquired a 20% stake in Cordlife when Bonvest and Tai Tak divested.            Figure 7.1: Risk Matrix
Nanjing Xinjiekou plans to make Cordlife its strategic thrust into the cord blood banking
sector in South-east Asia, just as it had planned for CCBC to spearhead the Chinese
market. Nanjing Xinjiekou failed as market regulators blocked the move. Should Nanjing
Xinjiekou bid for it again and get the approval, Nanjing’s stake in Cordlife would be close
to 30%, the amount that constitutes a mandatory takeover offer. Nanjing Xinjiekou’s
previous acquisition of 20% of shares at $1.67 a share presented a premium of 32%.

Regulatory Risk (RR1): Removal of restrictions in public hospital
Cordlife’s stake in Stemlife is presently a poor investment due to the regulatory barrier of
entry, which prevents it from tapping on live-births in public hospitals and restricting it to
17% of all live-births in Malaysia. Should the Ministry of health remove this barrier of
entry, Cordlife, through its stake in Stemlife will benefit tremendously from the additional
83% of market that it can tap into, which might result in a significant growth in sales.

                                                                                                                                      Page 9
Cordlife Group
Waterfall Scenario Analysis Figure 7.2:Monte Carlo Simulation
We factored the various operational risks into our valuation model to attain the scenario
analysis chart below. We observe that even after adding optimistic growth in penetration
rates of up to +20% Y-o-Y growth for penetration rate and Cordlife’s market share in India
from our base case, a most bullish scenario of S$0.99 was attained, which is still only
marginally above the current price of S$0.97. We believe that our investment
recommendation still holds in spite of potential risks.
Source: Greystone Capital
Figure 8.1: Management Team
8. Corporate Governance
Source: Annual Report
Cordlife was awarded the 14th Singapore Investors Choice Awards issued by the
Singapore Investors Association of Singapore (SIAS) in 2013, giving strong grounds that
it has resolute corporate governance. However, we discovered a series of questionable Figure 8.2: Remuneration Packages
related party transfers that seems to go against the interest of its minority shareholders.
Moreover, company undertakings in recent years have not been well managed, as the
reason for the dismissal of the previous CEO, Mr Jeremy Yee remains unclear to this day.
Further suspicious activity occurred soon after Mr Yee’s departure as two considerably
large shareholders of Cordlife, Bonvest and Tai Tak concurrently sold their shares three
months after gaining seats on the board, fuelling speculations that they were not satisfied
with the Group’s activities after the dismissal of Mr Yee.
9. Conclusion Source: Annual Report
We strongly believe that Cordlife currently does not offer a compelling risk-reward profile
for investors given its positioning against macro headwinds, weak growth prospects, sub-
par corporate governance and high valuation. We reiterate a SELL call with a target price
of $0.70 and a 27.5% downside to its current price.
Page 10APPENDIX A
Appendix A: Package prices for Cordlife Singapore and Cordlife India
Cordlife Singapore - Cord Blood Banking Package (Updated on 16 October 2016)
Source: Cordlife Singapore Brochure
Cordlife India - Cord Blood Banking Package (Updated in 2016)
Payment Plans for 21 Years Client Agreement
Cordlife Schedule
of Fees (SGD)
One-time Flexi-12 Flexi-24 Flexi-36 Flexi-48
Enrolment Fee 104.30 104.30
104.30 208.59 250.31
(one-time)
Document 6.26 6.26 6.26 6.26
6.26
processing fees
Basic 1,042.97 one-time 88.65/month 44.85/month 27.12/month 20.65/month
Cordsure (Cord
blood and Cord
portions 1,251.56 one-time 108.47/month 56.32/month 35.46/month 27.12/month
processing and
storage
Explant (Cord
blood processing
and Patented
1,960.78 one-time 166.88/month 85.52/month 54.23/month 41.72/month
Explant
Differentiation
Culture
Source: Cordlife India Official Website
1SGD=47.94INR
APPENDIX AAPPENDIX B
Appendix B: Child Development Account and Medical Information Table
Overview of Child Development Account
You can pay for our cord blood banking packages through your Child Development Account (CDA),
where the amount you contribute to your child's CDA will be matched by the Government, dollar for
dollar.
In March 2016, the Government announced the CDA First Step which is a grant of $3,000 for
eligible Singaporean children born from 24 March 2016. It is paid automatically into the child’s
CDA. Initial upfront payment for cord blood banking services is funded by the Government.
Medical Information Table
Who is more helpful when you need Professional sources Fellow patients, friends and Both Equally
like doctors and nurses family
Time when professionals matter most
An accurate medical diagnosis 91% 5% 2%
Information about prescription drugs 85 9 3
Information about alternative 63 24 5
treatments
A recommendation for a doctor or 62 27 6
specialist
A recommendation for a hospital or 62 27 6
other medical facility
Time when non-professionals matter most
Emotional support in dealing with a 30 59 5
health issue
A quick remedy for an everyday health 41 51 4
issue
Times when the two groups are equally helpful
Practical advice for coping with day- 43 46 6
to-day health situation
Source: Pew Research Center’s Internet & American Life Project
APPENDIX BAPPENDIX C
Appendix C: Cordlife Ownership Chart
Rank Investor Name % Outstanding Position
1 LH Capital I Limited 21.40% 55,509,400
2 Nanjing Xinjiekou Department Store 20.00% 51,870,000
3 China Stem Cells East 9.84% 25,516,666
4 Robust Plan 6.99% 18,133,000
5 FIL Limited 6.90% 17,904,300
6 Providence Investment Pte 1.30% 3,365,000
7 Bonvests Holdings LT 1.20% 3,107,000
8 Yee Pinh Jeremy 0.68% 1,756,784
9 TIAA-CREF 0.35% 900,000
10 Ho Choon Hou 0.31% 792,061
11 Nord Est Asset Management 0.15% 389,300
12 Ho Han Siong 0.13% 350,000
13 Ho Sheng 0.12% 302,000
14 Gam Holding AG 0.12% 300,000
15 State Street Club 0.09% 230,100
16 Dimensional Fund Advisors 0.07% 192,700
Others 30.36% 78,740,043
Total 100.00% 259,358,354
Source: Bloomberg
APPENDIX CAPPENDIX D
Appendix D: Convertible Note Transaction
S$120
multicurrency
debt
programme
“CGL Note”
Cordlife
US$44.065m
Kam Yuen Facility Convertible
Agreement Note
“Magnum Note”
100% Magnum Opus
US$44.065m
ownership
APPENDIX DAPPENDIX E
Appendix E: Corporate Team Members
Mr Wong Chiang Yin Dr Wong Chiang Yin was appointed as Executive Director and Group
Executive Director & Chief Executive Officer of the Company on July 1, 2016. As Executive
Group Chief Executive Director and Group Chief Executive Officer, Dr Wong is responsible for
Officer identifying and implementing company-wide business growth strategies
and organisational structures, and directly oversees all aspects of the
Group’s growth and operating functions.
Mr Choo Boon Yong Mr Choo Boon Yong is responsible for all areas of financial and
Group Chief Financial accounting functions of the Group, including financial reporting,
Officer management reporting and budgeting.
Mr Choo was previously Group CFO of Seksun Group from August 2014
to January 2017. From August 2008 to July 2009, Mr Choo worked for
China Sports Interactive Media Holding Company as CFO. Mr Choo also
became Associate Director and Head of M&A of the Shanghai office of
Ernst & Young China from November 2005 to July 2008.
Ms Tan Poh Lan Ms Tan has 30 years extensive experience in the private and public
Executive Director healthcare sectors. She was most recently Chief Executive Officer (CEO)
and Group Chief of Fortis Healthcare Singapore where she successfully aligned and
Operating Officer integrated the businesses of Fortis Colorectal Hospital & Radlink.
Ms Jamie Woon Ms Jamie Woon is responsible for the planning, developing and
Geok Peng implementing the Group’s marketing strategies, marketing
Group Director, Brand communications and public relations activities. Her job scope also
Development & includes identifying and developing new products and services for the
Innovation Group.
Ms Woon was previously the Business Unit Director, Banking, from July
2014 to July 2016, where she was responsible for the strategic and
operational aspects of the Group’s businesses and oversees all of
Cordlife’s banking businesses.
Ms Lee Mei Suan, Director of Cordlife Organization Development
Stella
Business Unit
Director, Org
Development
Ms Tan Huiying Ms Tan Huiying is responsible for setting and maintaining Group quality
Group Director, standards in service and product offerings as well as standardising key
Quality & Operations laboratory and operational systems, applications and processes across
the Group.
She was previously the Business Unit Director, Diagnostics from January
2014 to July 2016. Her responsibilities included developing and
implementing growth and product strategies for the Group’s relatively
new diagnostics business to meet financial and non-financial goals.
Source: Company Corporate Presentation (November 2016)
APPENDIX EAPPENDIX F
Appendix F: Cordlife Past Accolades and organization chart
Cordlife Past Accolades
Cordlife Organization Chart
Source: Company Corporate Presentation (November 2016)
APPENDIX FAPPENDIX G
Appendix G: Indonesia and Philippines Healthcare Sector
Growth Rate of Healthcare Expenditure
Indonesia Philippines
Clearstate (EIU) 10.6% 10.8%
BMI Research (Fitch) 10.4% 9.8%
Source: Clearstate (EIU), BMI Research (Fitch)
Universal Healthcare Coverage (Indonesia and Philippines)
Indonesia Philippines
Scheme Jaminan Kesehatan Nasional National Health Insurance
(JKN) Programme (NHIP)
Payer Social Security Management Philippine Health Insurance
Agency for the Health Sector Corporation (PhilHealth)
(BPJS)
Provider Public and private healthcare Accredited healthcare providers
providers
Payment Method Primary healthcare providers who Health insurance benefits covered
participate in JKN receive under PhilHealth’s benefit
capitation payments, where a package are reimbursed on a
fixed amount is paid by BPJS for case rate payment system.
each participant enrolled in the
scheme. For hospital providers,
BPJS follows reimbursement
rates determined through the
Indonesia Case Based Groups
(INA-CBG) system by the Health
Ministry.
Impact of payment method on Poor provider participation in UHC Risk of fraudulent claims. UHC
provider behaviour delivery. UHC below full utilisation over-utilised.
level.
Source: Clearstate (EIU)
Population Demographic Shift (Indonesia)
Rise of the middle class as estimated by BCG (2012 and 2020F)
Main source of healthcare
expenditure growth
Source: BCG and Indonesian Central Bureau for Statistics (BPS): F - Forecast
APPENDIX GAPPENDIX H
Cordlife Group Valuation
Appendix H: Model Model
Summary
D
Key Inputs and Assumptions R
TP: S$0.70 CP: S$0.97 Bull
Beta Choice: Bottoms Up Base
RIM - Persistence Factor
Equity Risk Premium: Country Blended Bear
Scenario (Dashboard): Base DCF - Exit Multiple Method
Circuit Breaker (1-default, 0-reset) 1 DCF - Gordon Growth Method
Valuation Method DCF 1
P/BV - Core Peers
EV/EBITDA - Core Peers
0 0.5 1 1.5 2 2.5 3
Key Financial Summary
Historical Projected
FY ended 31 Dec Units 2012A 2013A 2014A 2015A 2016A 2017F 2018F 2019F 2020F 2021F
Income Statement
Revenue [SGDm] 30.3 34.7 49.1 57.6 59.6 65.5 69.9 74.4 79.3 84.4
Cost of Goods Sold [SGDm] (9) (9) (14) (18) (20) (22) (24) (25) (27) (29)
Gross Profit [SGDm] 22 25 35 40 39 43 46 49 52 56
Selling and Marketing Expenses [SGDm] (7) (8) (12) (18) (19) (22) (23) (24) (26) (28)
Selling, General & Administrative Expense [SGDm] (7) (9) (13) (16) (17) (19) (20) (21) (23) (24)
Total Operating Expense [SGDm] (13) (17) (26) (33) (36) (41) (43) (46) (49) (52)
Net Income [SGDm] 6.9 13.5 30.5 32.5 13.0 8.8 10.8 12.4 12.3 12.3
Balance Sheet
Cash and Cash Equivalents [SGDm] 13 8 33 16 70 75 81 89 97 104
Account Receivables [SGDm] 9 12 13 15 21 18 19 20 21 23
Long Term Receivables [SGDm] 24 39 46 153 65 65 65 65 65 65
Property, Plant and Equipment [SGDm] 6 8 8 10 13 16 18 20 21 23
Total Assets [SGDm] 90 120 191 333 270 275 284 295 305 316
Account Payables [SGDm] 3 8 9 12 13 11 11 12 13 14
Other Borrowings [SGDm] 3 6 13 12 11 11 11 11 11 11
Deferred Revenue [SGDm] 12 25 26 28 40 40 40 40 40 40
Total Liabilities [SGDm] 19 43 49 171 139 136 137 138 138 139
Total Shareholders' Equity [SGDm] 71 78 141 162 132 139 147 157 167 177
Key Ratios
Profitability Ratio
EBITDA Margin [%] 34% 43% 68% 57% 28% 24% 24% 22% 21% 20%
Net Profit Margin [%] 23% 39% 62% 56% 22% 13% 15% 17% 16% 15%
Return on Asset (ROA) [%] 10% 13% 20% 12% 4% 3% 4% 4% 4% 4%
Return on Equity (ROE) [%] 12% 18% 28% 21% 9% 7% 8% 8% 8% 7%
Payout Ratio [%] 67% 48% 17% 16% 278% 20% 20% 20% 20% 20%
Growth Ratios
Revenue Growth [%] 18% 14% 15% 12% 12% 10% 15% 15% 15% 14%
Net Income Growth [%] (18%) 95% 126% 6% (60%) (32%) 22% 15% (0%) (1%)
Solvency Ratios
Gearing Ratio (D/E) [%] 5% 12% 13% 134% 81% 81% 81% 81% 81% 81%
Debt Ratio [%] 3% 5% 7% 39% 29% 28% 28% 27% 26% 25%
Interest Coverage [x] 2767.0x 160.0x 41.5x 1.2x 0.3x 0.2x 0.6x 5.5x 6.4x 6.3x
Liquidity & Efficiency Ratios
Current Ratio [x] 3.5x 1.6x 3.1x 2.4x 5.2x 5.7x 5.9x 6.0x 6.1x 6.3x
Cash Conversion Cycle [Days] 28 -75 -103 -108 -96 -72 -61 -61 -61 -61
Days Receivable Outstanding [Days] 93 109 93 89 111 108 95 95 95 95
Days Payables Outstanding [Days] 105 200 210 213 224 196 170 171 170 171
Market Ratios
Price-to-Earnings (PE) [x] 12.3x 14.5x 9.7x 9.0x 25.2x 37.2x 30.6x 26.6x 26.6x 26.8x
Price-to-Book Value (PB) [x] 1.2x 2.5x 2.1x 1.8x 2.5x 2.4x 2.2x 2.1x 2.0x 1.9x
EV/EBITDA [x] 7.3x 13.0x 8.2x 8.7x 15.2x 16.5x 15.6x 15.4x 15.2x 15.0x
EV/Sales [x] 2.5x 5.6x 5.6x 4.9x 4.3x 3.9x 3.7x 3.5x 3.2x 3.0x
Dividend Yield [%] 5.45% 3.33% 1.81% 1.78% 11.05% 0.54% 0.65% 0.75% 0.75% 0.75%
Earnings per Share [S$] 0.04 0.06 0.12 0.12 0.05 0.03 0.04 0.05 0.05 0.05
DuPont Analysis
Net Profit Margin [%] 23% 39% 62% 56% 22% 13% 15% 17% 16% 15%
Revenue/Assets [%] 42% 33% 32% 22% 20% 24% 25% 26% 26% 27%
Assets/Equity [%] 130% 142% 142% 172% 205% 202% 195% 190% 185% 181%
Return on Equity (ROE) [%] 12.4% 18.1% 27.9% 21.4% 8.9% 6.5% 7.5% 8.1% 7.6% 7.1%
Return on Asset (ROA) [%] 9.5% 12.8% 19.6% 12.4% 4.3% 3.2% 3.9% 4.3% 4.1% 3.9%
Others
Capex/Revenue [%] 8% 5% 3% 3% 7% 7% 6% 5% 5% 5%
Marketing Expense as % of Revenue [%] 23% 22% 25% 31% 32% 33% 33% 33% 33% 33%
Administrative Expense as % of Revenue [%] 22% 27% 27% 27% 29% 30% 29% 29% 29% 29%
Effective Tax Rate [%] 11% 7% 5% 3% 6% 6% 6% 6% 6% 6%
APPENDIX HAPPENDIX I
Appendix I: WACC Assumptions
APPENDIX IAPPENDIX J
Appendix J: Revenue Assumptions
APPENDIX JAPPENDIX K
Appendix K-I: Intrinsic Valuation (DCF - Perpetuity Method)
Appendix K-II: Intrinsic Valuation (DCF - Exit Multiple)
Appendix K-III: Residual Income Model (RIM - Persistence Factor)
APPENDIX KAPPENDIX L
Appendix L: Sensitivity Analysis
APPENDIX LAPPENDIX M
Appendix M: Relative Valuation - Trading Comparables
APPENDIX MAPPENDIX N
Appendix N: Revenue Breakdown
APPENDIX NAPPENDIX O
Appendix O: Revenue Calculations
APPENDIX OAPPENDIX P Appendix P: Monte Carlo Simulation In our Monte Carlo simulation analysis, we varied the risk factors in a continuous form instead of discrete distributions. This allows us to account for rare random events that may have a large impact on our model. Among 5,000 runs, 57% of them yielded a valuation of our target price or lower, while
APPENDIX Q

Appendix Q: Income Statement

                               APPENDIX Q
APPENDIX R
Appendix R: Balance Sheet and Cash Flow Statement
Balance Sheet
Cash Flow Statement
APPENDIX RAPPENDIX S
Appendix S: Key Ratios
APPENDIX SAPPENDIX T
Appendix T: PPE Schedule
APPENDIX TDisclosures:
Ownership and material conflicts of interest:
The author(s), or a member of their household, of this report does not hold a financial interest in the securities of this company. The
author(s), or a member of their household, of this report does not know of the existence of any conflicts of interest that might bias the
content or publication of this report.
Receipt of compensation:
Compensation of the author(s) of this report is not based on investment banking revenue.
Position as a officer or director:
The author(s), or a member of their household, does not serve as an officer, director or advisory board member of the subject
company.
Market making:
The author(s) does not act as a market maker in the subject company’s securities.
Disclaimer:
The information set forth herein has been obtained or derived from sources generally available to the public and believed by the
author(s) to be reliable, but the author(s) does not make any representation or warranty, express or implied, as to its accuracy or
completeness. The information is not intended to be used as the basis of any investment decisions by any person or entity. This
information does not constitute investment advice, nor is it an offer or a solicitation of an offer to buy or sell any security. This report
should not be considered to be a recommendation by any individual affiliated with CFA Society Singapore, CFA Institute or the CFA
Institute Research Challenge with regard to this company’s stock.
CFA Institute Research ChallengeYou can also read