Spanish Photovoltaic Solar Energy: Institutional Change, Financial Effects, and the Business Sector
←
→
Page content transcription
If your browser does not render page correctly, please read the page content below
sustainability

Article
Spanish Photovoltaic Solar Energy: Institutional
Change, Financial Effects, and the Business Sector
Raquel Fernández-González 1 , Andrés Suárez-García 2 , Miguel Ángel Álvarez Feijoo 2, * ,
Elena Arce 2 and Montserrat Díez-Mediavilla 3
 1    ERENEA-ECOBAS, Department of Applied Economics and Faculty of Economics, Campus As
      Lagoas-Marcosende, University of Vigo, 36310 Vigo, Spain; raquelf@uvigo.es
 2    Defense University Center at Spanish Naval Academy, 36920 Marin, Spain; asuarez@cud.uvigo.es (A.S.-G.);
      elena.arce@cud.uvigo.es (E.A.)
 3    Solar and Wind Feasibility Technologies Research Group (SWIFT), Electromechanical Engineering
      Department, University of Burgos, Avda. de Cantabria s/n, 09006 Burgos, Spain; mdmr@ubu.es
 *    Correspondence: alvarezfeijoo@cud.uvigo.es

 Received: 7 February 2020; Accepted: 27 February 2020; Published: 2 March 2020

 Abstract: Spain is a country with a high dependence on fossil fuels. For this reason, in 2007,
 it implemented a bonus system that aimed to encourage the production of renewable energies,
 particularly photovoltaic solar energy. These production bonuses, guaranteed by the Spanish
 government, led to an exponential increase in the number of companies in the market and, consequently,
 the MWh produced. However, in 2012, given the excessive budgetary burden involved in maintaining
 this “feed-in tariff” system and after several years of institutional instability, the aforementioned
 system of incentives for phoyovoltaic (PV) energy was eliminated. This paper has tried to analyze
 the consequences of this institutional change, a clear example of the “hold up” problem. For this
 purpose, a sample of 5354 companies, which was divided, geographically, into Spanish regions and,
 temporarily, into three different periods, has been taken, considering diverse economic and financial
 variables. The results show a notable weakening of the sector that, due to the effects of the regulatory
 change, has lost attractiveness and profitability for investors and is consequently suffering from
 stagnation, which has led to the disappearance of many companies in the sector.

 Keywords: Spain; solar photovoltaics; institutional frameworks for energy transition; hold-up
 problem

1. Introduction
     The high dependence on fossil fuels in some countries causes a high energy bill. Among them is
Spain, which imports large quantities of fuel oil [1–4]. In 2000, 74% of the energy generated in Spain
came from fossil fuels. By 2012, however, the share of fossil fuels had fallen considerably to 52% [5,6].
This drop of more than twenty percentage points was the result of active policies implemented by the
Spanish government. In order to follow European policies in terms of implementing a less polluting
and more diversified energy model, Spanish governments promoted the production of renewable
energies, focusing especially on photovoltaic solar energy [7,8]. In response to its concerns about
energy efficiency and climate change, the European Union (EU) Directive 2009/28/EC was approved,
which set the goal that 20% of the EU’s energy consumption should be produced by renewable energies
by 2020. This last decree shows how each member country takes into account the starting situation
of the member countries and proposes different scenarios for each of them. Even so, the EU did not
approve a common regulation for all its members, but rather it is they who decide how to promote it.

Sustainability 2020, 12, 1892; doi:10.3390/su12051892                      www.mdpi.com/journal/sustainability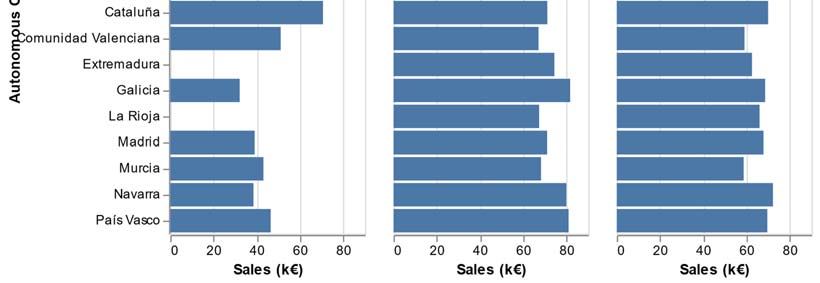
Sustainability 2020, 12, 1892 2 of 18
Sustainability 2020, 12, x FOR PEER REVIEW 2 of 18
Spain has
Spain has very
very favorable
favorableclimate
climateconditions
conditionsfor
fora ahigh
highproduction
production ofof solar
solar photovoltaic
photovoltaic energy,
energy, as
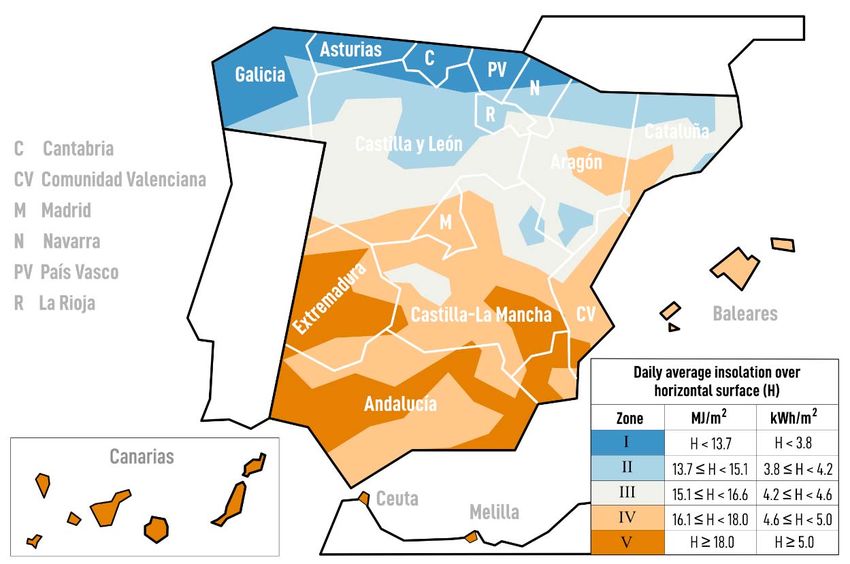
it is one of the European countries with the highest number of hours of solar radiation. Figure 1 shows1
as it is one of the European countries with the highest number of hours of solar radiation. Figure
shows
the mapthe map of climatic
of climatic zones in zones
Spain, in Spain, including
including graphic indicators
graphic indicators of daily over
of daily insolation insolation over
horizontal
horizontal surface. As can be seen in the figure, the regions in the southern half of the
surface. As can be seen in the figure, the regions in the southern half of the country have the greatest country have
the greatest
potential forpotential
harnessing for this
harnessing
energy.thisForenergy. For this
this reason, thereason, the government
government focused
focused mainly onmainly on
this type
this
of type of renewable
renewable energy
energy [9,10]. [9,10]. However,
However, in the
in addition, addition, theindecrease
decrease the costinof the cost
solar of solar
panels made panels
this
made this technology one of the most attractive for investors, this being another
technology one of the most attractive for investors, this being another reason that the government took reason that the
government
into took into account [11,12].
account [11,12].
Figure 1. Map
Figure 1. Map of
of climatic
climatic zones
zones in
in Spain. Own elaboration
Spain. Own elaboration with
with the
the data
data of
of [13].
[13].
As
As aaresult
resultof of
thisthis
urgent needneed
urgent to reduce the energy
to reduce bill and bill
the energy because
and of Spain’sof
because favorable
Spainʹsconditions
favorable
for obtaining cleaner and cheaper energy, since 2007, the government’s energy
conditions for obtaining cleaner and cheaper energy, since 2007, the governmentʹs energy decisions havedecisions
focused
on implementing a very aggressive subsidy policy, which has attracted thousands
have focused on implementing a very aggressive subsidy policy, which has attracted thousands of investors and
of
has led to the Spanish solar photovoltaic energy market experiencing great growth
investors and has led to the Spanish solar photovoltaic energy market experiencing great growth in in the following
years, both in terms
the following years,ofboth MWh in produced
terms of MWhand the number and
produced of companies
the numberin the sector (Figure
of companies in 2).
the This is
sector
shown by the fact that in 2007, photovoltaic production was assumed to be 152 MWh,
(Figure 2). This is shown by the fact that in 2007, photovoltaic production was assumed to be 152 while in 2010 it
reached
MWh, while3842 MWh
in 2010 and in 2018 the
it reached figure
3842 MWh reached
and in4744
2018MWh produced
the figure [14–16].
reached 4744This
MWh policy had certain
produced [14–
positive results: it increased the weight of renewable energies in the Spanish
16]. This policy had certain positive results: it increased the weight of renewable energies energy mix and reduced
in the
CO 2 emissions (7,5 t CO2/capita in 2007; 5,6 t CO2 /capita in 2010; 5,2 t CO2 /capita in 2018) [5,15].
Spanish energy mix and reduced CO2 emissions (7,5 t CO2/capita in 2007; 5,6 t CO2/capita in 2010; 5,2
t CO /capitapolicies
These
2 in 2018)led Spain to achieve excellent results, with a notable decrease in fossil fuel
[5,15].
consumption. In 2011, Spain reached the third place among the countries with more production in
Europe, which, in that year, was the world region where more photovoltaic energy was produced.
However, despite these good results, the Spanish executive decided to make a change in policies
to promote solar energy. The most important reason for this change was that the public treasury could
not assume such a high cost overrun caused by the feed-in tariff system in a scenario of economic
crisis. This renewable energy incentive system was widening the gap between generation costs and
revenues collected through tariffs, increasing the “tariff deficit” [5]. Moreover, the policy of premiums
implied an enormous transfer of public resources towards investors in photovoltaic energies, with
evident discomfort from other agents in the energy market, such as the large electricity companies who
claimed that the system in general was becoming more expensive due to such premiums. Therefore, in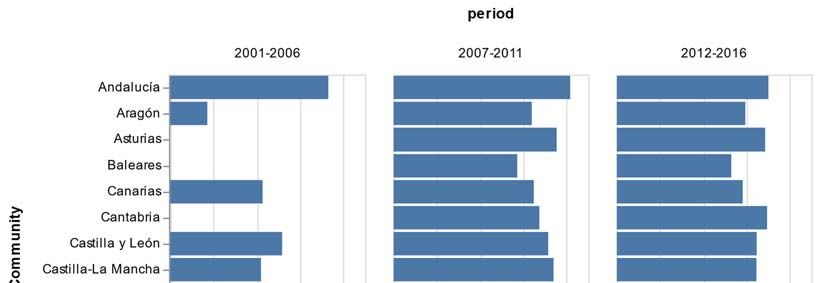
Sustainability 2020, 12, 1892 3 of 18
2012, after a succession of increasingly restrictive laws with public subsidies for photovoltaic energy,
these incentives were definitively abolished.
Sustainability 2020, 12, x FOR PEER REVIEW 3 of 18
5 000 700%
600%
4 000
500%
3 000 400%
2 000 300%
200%
1 000
100%
0 0%
2000 2001 2002 2003 2004 2005 2006 2007 2008 2009 2010 2011 2012 2013 2014 2015 2016 2017 2018
Electricity capacity (MW) Solar photovoltaic Spain Interannual variation
Figure 2.
Figure 2. Photovoltaic solar power generated in
in Spain.
Spain. Own elaboration with the data of [16].
The
Theserelationship
policies led between
Spainelectricity
to achieve companies
excellentand the country’s
results, politicaldecrease
with a notable elites is an inunderlying
fossil fuel
factor that can In
consumption. be 2011,
incorporated
Spain reached when explaining
the third place energy policy
among incountries
the Spain, although
with more the study
production of these in
relationships
Europe, which, forin our thatcase study
year, wasisthe inconclusive
world region duewhereto the lack
moreofphotovoltaic
qualitative information
energy was on the direct
produced.
relationships
However, between
despitelarge thesecompanies
good results, andthe political
Spanish leaders and the
executive causality
decided to makeof decisions.
a changeIninany case,
policies
it
toispromote
true thatsolar
evenenergy.
withoutThe the most
support of the electricity
important reason for companies,
this change thewas
bonus thatpolicy was approved
the public treasury
and
could applied by the such
not assume government
a high cost and overrun
was subsequently
caused byrectifiedthe feed‐in by the same
tariff socialist
system in agovernment.
scenario of
Beyond
economic thecrisis.
influence
This of lobbies onenergy
renewable the executive’s
incentivepolitical
system agenda,
was widening it seemsthe clear
gapthat the change
between in the
generation
economic scenario was
costs and revenues the key
collected factor.tariffs,
through Thus, increasing
since 2010,the theʺtariff
Spanish central
deficitʺ [5].government,
Moreover, the faced
policywith of
the doubts of
premiums the markets
implied and the consequent
an enormous transfer ofpressure from the European
public resources towards institutions,
investors in was forced to
photovoltaic
implement
energies, with a restrictive economic from
evident discomfort policy. Thisagents
other exemplifies the scenario
in the energy market,of the
suchchange in government
as the large electricity
priorities.
companiesThe whogovernment
claimed that was theforced to modify
system its policy
in general was onbecoming
renewablemore energies, which had
expensive dueinvolved
to such
unexpectedly
premiums. Therefore, rapid expansion.
in 2012, after Theaeffects
successionof the ofcancellation
increasinglyof the feed-in
restrictive laws tariff
withsystem
publicwere very
subsidies
significant.
for photovoltaic Althoughenergy, PVthese
solar incentives
power generation continuedabolished.
were definitively to grow, from 2014 onwards this growth
slowed Thedown
relationship
enormously, between with electricity
an annual companies
growth rate andbetween
the countryʹs
0.15%political
and 0.40% elites is an underlying
between 2014 and
factor[16].
2018 thatThis
can be trendincorporated
in production, whentogether
explaining withenergythe few policy in Spain,
companies thatalthough
entered the the study
market, of leads
these
relationships
to the stagnation for our
of the case studyIn
sector. is fact,
inconclusive
the directdue to the lack ofofqualitative
consequences institutional information
change have on the direct
fallen on
relationships
the business sector. between Thislarge
agent companies
has seen how and itpolitical
has gone leaders
from aand the causality
favourable economic of decisions.
scenario, In any
where
case,
the it is true that
profitability even without
of investment the support was
in photovoltaics of the electricity
high, companies,
to a completely the bonus scenario
unfavourable policy was as
approved
the regulationsand haveapplied by theAs
changed. government
a result of the andchange,
was subsequently
the possibilities rectified
of return by on
thethesame socialist
irreversible
government. made
investments Beyond arethe influencereduced,
drastically of lobbiestoon thethe executiveʹs
point political
that neither agenda,returns
minimum it seems norclear that
capital
the change in
amortisation arethe economic[14,17,18].
guaranteed scenario was the key factor. Thus, since 2010, the Spanish central
government,
The magnitudefaced with of thethechange
doubtsin ofenergy
the markets
policyand andthe its consequent
implicationspressure
have been from the European
widely studied
institutions,
by academia. wasAlthough
forced to implement
there is a wide a restrictive
varietyeconomic
of economic policy. This exemplifies
studies that have the scenario
analyzed of
this
the change
case in government
[7,8,14,17–24], this paper priorities.
providesThe government
a novel approachwas forced to modify
by combining the use of itsthe
policy
Newon renewable
Institutional
energies, which
Economics (NIE)had involved
approach andunexpectedly
the qualitative rapid
evidenceexpansion.
derived Thefromeffects of the cancellation
the processing of data from of the a
feed‐in tariff population
longitudinal system were very significant.
sample AlthoughThis
of 5354 companies. PV combination
solar power generation
has allowedcontinued
an analysis to of
grow,the
from 2014ofonwards
evolution this growth slowed
key economic-financial variables down enormously,
to understand how with an annualchange
institutional growth hasrate between
affected the
0.15% and
Spanish 0.40%
private between
energy sector.2014Theand paper2018 [16]. This trend
is structured in fivein production,
sections. The secondtogether with analyses
section the few
companies
the institutionalthat change
enteredinthe the market,
Spanish leads PV sectorto the basedstagnation
on the New of the sector. InEconomics
Institutional fact, the direct(NIE)
consequences of
fundamentals. The institutional
third section change
explainshave thefallen on the business
methodology used forsector. This agent
the empirical haswhich
study, seen how treats it
has data
the gonederived
from a favourable
from the sample economic scenario, where
population of 5354the profitability
companies. of investment
The fourth section in photovoltaics
analyses the
was high, to a completely
economic-financial resultsunfavourable
derived fromscenario the empiricalas the study.
regulationsFinally,have
thechanged. As a presents
fifth section result of the the
change, the possibilities
conclusions of the paper.of return on the irreversible investments made are drastically reduced, to the
point that neither minimum returns nor capital amortisation are guaranteed [14,17,18].
The magnitude of the change in energy policy and its implications have been widely studied by
academia. Although there is a wide variety of economic studies that have analyzed this case
[7,8,14,17–24], this paper provides a novel approach by combining the use of the New Institutional
Economics (NIE) approach and the qualitative evidence derived from the processing of data from a
longitudinal population sample of 5354 companies. This combination has allowed an analysis of the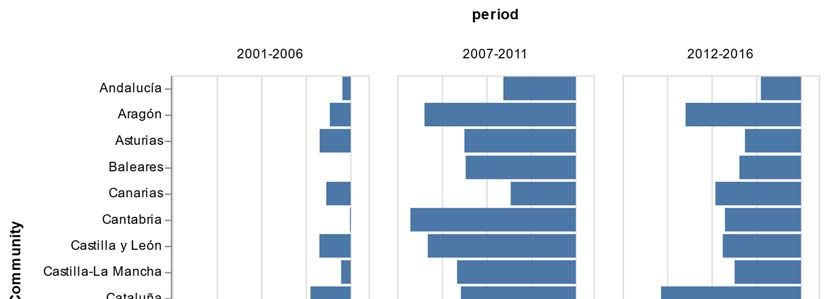
the Spanish private energy sector. The paper is structured in five sections. The second section
analyses the institutional change in the Spanish PV sector based on the New Institutional Economics
(NIE) fundamentals. The third section explains the methodology used for the empirical study, which
treats the data derived from the sample population of 5354 companies. The fourth section analyses
the economic‐financial
Sustainability 2020, 12, 1892 results derived from the empirical study. Finally, the fifth section presents
4 ofthe
18
conclusions of the paper.
2. Spanish Photovoltaic Sector
2. Spanish Photovoltaic Sector
The regulatory framework for renewable energies in Spain was developed in the 1980s through a
The regulatory framework for renewable energies in Spain was developed in the 1980s through
law promoting
a law promoting mini-hydro
mini‐hydro (Law
(Law 82/1980
82/1980 onon energy
energy conservation).
conservation).This Thislaw
lawwaswasdeveloped
developedin inorder
order
to address the oil crisis and improve energy efficiency. An important
to address the oil crisis and improve energy efficiency. An important milestone in the regulation ismilestone in the regulation
isset
setbybyRoyal
RoyalDecree
Decree(RD) (RD)2818/1998
2818/1998 on on the
the production
production of of electricity
electricity by
by installations
installations supplied
supplied by by
renewable energy resources or sources, waste, and cogeneration (repealed
renewable energy resources or sources, waste, and cogeneration (repealed by Royal Decree 436/2004 by Royal Decree 436/2004
and
andsubsequently
subsequentlyby byRD
RD661/2007),
661/2007),whichwhichestablishes
establishesthat thatthethepremiums
premiumsof ofthe
thespecial
specialregime
regimeshould
should
bebe updated annually and revised every 4 years. RD 661/2007 maintains sale at a regulated tariff
updated annually and revised every 4 years. RD 661/2007 maintains sale at a regulated tariff
(established in RD 436/2004), which is the fixed price that the producer
(established in RD 436/2004), which is the fixed price that the producer receives for the energyreceives for the energy dumped
into the system,
dumped into theorsystem,
directly or
into the market,
directly receiving
into the market,the price negotiated
receiving the pricein the systeminplus
negotiated a premium,
the system plus
with the total remuneration being cap and floor.
a premium, with the total remuneration being cap and floor.
RDRD1578/2008,
1578/2008,which whichreviewed
reviewedRD RD661/2007,
661/2007,modifies
modifiesthe theeconomic
economicregimeregimefor forthetheproduction
production
ofof electricity using photovoltaic solar technology for installations after the deadline formaintaining
electricity using photovoltaic solar technology for installations after the deadline for maintaining
remuneration
remunerationunder underRDRD 661/2007.
661/2007. TheThe remuneration
remuneration of these installations
of these is based
installations is on different
based annual
on different
calls with
annual power
calls withquotas
powerbyquotas
typology and is adjusted
by typology and is to the learning
adjusted to thecurve of the
learning technology
curve (the price
of the technology
and power quota is specified for each call), which results in a lower cost of
(the price and power quota is specified for each call), which results in a lower cost of electricity electricity in relation to the
in
previous model. Additionally, this RD 1578/2008 limits the application of
relation to the previous model. Additionally, this RD 1578/2008 limits the application of RD 661/2007.RD 661/2007. RD 222/2008
sets
RD the annualsets
222/2008 updates of the tariffs
the annual updates andofthe theupper
tariffsand andlowerthe limits
upperofand
the lower
speciallimits
system. of Due to the
the special
economic impact that renewable energies have on the tariff system, RD
system. Due to the economic impact that renewable energies have on the tariff system, RD Law 6/2009Law 6/2009 was approved in
order to establish
was approved inmechanisms for the mechanisms
order to establish remunerationfor system for special regime
the remuneration system installations
for special(exceptregime
for photovoltaic technology, which is already regulated in RD 1578/2008),
installations (except for photovoltaic technology, which is already regulated in RD 1578/2008), and thus guarantee the and
sustainability of the system, both from a technical and economic point
thus guarantee the sustainability of the system, both from a technical and economic point of view.of view. The need to limit the
accumulation
The need to limit of tariff deficits by theof
the accumulation Spanish electricity
tariff deficits by the system
Spanishled electricity
to a reduction in incentives
system for the
led to a reduction
photovoltaic system, as reflected in RD 1565/2010. Figure 3 shows the evolution
in incentives for the photovoltaic system, as reflected in RD 1565/2010. Figure 3 shows the evolution of the investment
made
of theininvestment
Spain [19].made in Spain [19].
RD 1565/2010
10 MW ≤ P ≤ 50 MW (afterwards)
10 MW ≤ P ≤ 50 MW (first 25 years)
RD 222/2008
100 kW ≤ P ≤ 10 MW (afterwards)
100 kW ≤ P ≤ 10 MW (first 25 years)
P ≤ 100 kW (afterwards)
RD 661/2007
P ≤ 100 kW (first 25 years)
15 20 25 30 35 40 45 50
Tariffs (c€/kWh)
Figure3.3.Tariffs
Figure Tariffsininthe
theSpanish
Spanishphotovoltaic
photovoltaic(PV)
(PV)regulatory
regulatoryframework.
framework.Own
Ownelaboration
elaborationwith
withthe
the
dataofof[19].
data [19].
Figure 4 (top figure) shows how the installed power increased significantly in 2008, and moderately
from 2008 to 2011, and between 2012 and 2016 it practically stagnated. In relation to the energy
generated (Figure 4, average), due to the large number of new installations, in the period 2007–2011
the power generated shot up. Until 2012, when the change in policies will stagnate the generation.
Additionally, Figure 4 (below) shows the ratio called Peak Sun Hours, which is an hour during which
the intensity of sunlight is 1000 watts per square meter). Its meaning is the number of hours of sunshine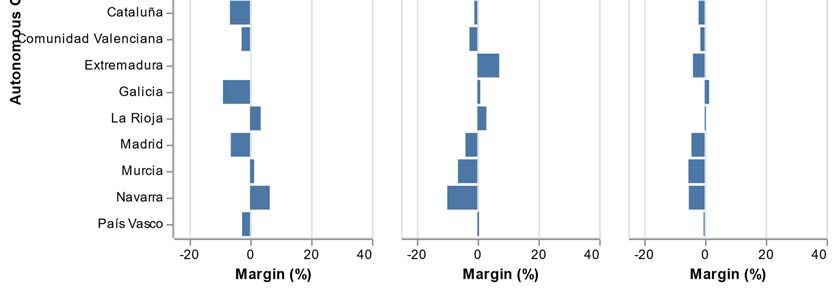
Figure 4 (top figure) shows how the installed power increased significantly in 2008, and
moderately from 2008 to 2011, and between 2012 and 2016 it practically stagnated. In relation to the
energy generated (Figure 4, average), due to the large number of new installations, in the period
2007–2011 the power generated shot up. Until 2012, when the change in policies will stagnate the
Sustainability 2020, 12, 1892                                                                                    5 of 18
generation. Additionally, Figure 4 (below) shows the ratio called Peak Sun Hours, which is an hour
during which the intensity of sunlight is 1000 watts per square meter). Its meaning is the number of
hours
at 1 kW/m     2 to obtain
        of sunshine       at 1a kW/m     to obtain aThe
                                given 2insolation.   given  insolation.
                                                         figure         The figure
                                                                stays around   1500 stays around
                                                                                    h. There        1500 h. Therewith
                                                                                               is a relationship    is a
relationship
the              with theTechnical
     map of Building          map of Building    Technical
                                         Code areas.         Code areas.
                                                      The Building        The Building
                                                                     Technical  Code in Technical    Code in
                                                                                         Spain is known     as Spain
                                                                                                               Código is
Técnico de la Edificación, CTE. If we transform the kWh/m /day to h of the figure, its values oscillate
known     as   Código     Técnico   de  la Edificación, CTE.  If we     2
                                                                    transform   the kWh/m    2/day to h of the figure,

its values1387
between       oscillate   between
                   and 1825          1387 and the
                                 h. Therefore,  1825  h. Therefore,
                                                    ratio obtained isthe
                                                                       anratio obtained
                                                                          expected      is [25].
                                                                                    value   an expected value [25].

     Figure 4. (Top) Power Installed, (Average) Energy Produced, and (Below) Peak Sun Hours in Spain.
     Figure 4. (Top) Power Installed, (Average) Energy Produced, and (Below) Peak Sun Hours in Spain.
     Own elaboration with data the of [25].
     Own elaboration with data the of [25].

     When analyzing the evolution of the installed power within the Spanish territory (by Autonomous
     When analyzing the evolution of the installed power within the Spanish territory (by
Communities (CCAA)), it can be seen that Castilla-La Mancha is the region with the most solar
Autonomous Communities (CCAA)), it can be seen that Castilla‐La Mancha is the region with the
photovoltaic power installed with almost 20% of all national power, followed closely by Andalusia
most solar photovoltaic power installed with almost 20% of all national power, followed closely by
and a little further away by Extremadura and Castilla y León [26]. These four communities represent
the 61% of the installed photovoltaic power in Spain. (Figure 5), as they are in the southern half of the
country where most radiation is received. Another factor to take into account is that in these regions the
surface available for installations is high. Solar power output has stabilized over the past three years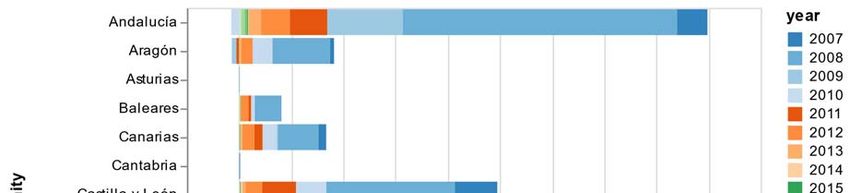
Sustainability 2020, 12, x FOR PEER REVIEW 6 of 18
Andalusia and a little further away by Extremadura and Castilla y León [26]. These four communities
represent the 61% of the installed photovoltaic power in Spain. (Figure 5), as they are in the southern
half of the country where most radiation is received. Another factor to take into account is that in
Sustainability 2020, 12, 1892 6 of 18
these regions the surface available for installations is high. Solar power output has stabilized over the
past three years after a long path of continuous growth. Photovoltaics began to take off in 2000 with
1after
GWa installed,
long pathreaching a record
of continuous growth
growth. figure in 2008
Photovoltaics beganwith to the
takeinstallation of 2733
off in 2000 with newinstalled,
1 GW MW of
power,
reachinggrowth
a recordthat continues
growth figureuntil 2013with
in 2008 withthe
more than 250of
installation MW2733 installed
new MW each
of year
power, ongrowth
average, to
that
remain
continues practically
until 2013 unchanged
with moresince
thanthen.
250 MW In 2018, photovoltaics
installed each yearrepresented
on average,3% of totalpractically
to remain electricity
generation
unchanged[25]. sinceInthen.
2017,In
photovoltaic solar energy
2018, photovoltaics increased
represented 3% itsofcontribution to the
total electricity national GDP
generation [25]. by
In
7.2%, maintaining solar
2017, photovoltaic the upward
energy trend that its
increased began in 2015 [27].
contribution The
to the reasonsGDP
national for the advance
by 7.2%, experienced
maintaining the
by this technology
upward trend that are the in
began activity associated
2015 [27]. with self‐consumption
The reasons for the advance and a greaterby
experienced investment by the
this technology
companies for the
are the activity implementation
associated of the new projects
with self-consumption awarded
and a greater in the auction
investment by theofcompanies
July 2018, for
wherethe
there were more of
implementation thanthe4000
new MW of new
projects photovoltaic
awarded solar power
in the auction of Julyto2018,
be installed before
where there 2020.
were Despite
more than
the
4000auctions
MW of that new were carried out,
photovoltaic solarthe Spanish
power photovoltaic
to be sector
installed before was Despite
2020. still in crisis in 2018 as
the auctions a result
that were
of the electricity
carried reform of
out, the Spanish 2012 and the
photovoltaic retroactive
sector was stillmeasures
in crisis inincluded
2018 as ainresult
the RD of Law 14/2010 and
the electricity RD
reform
413/2014.
of 2012 and the retroactive measures included in the RD Law 14/2010 and RD 413/2014.
Figure 5.
Figure Evolution of
5. Evolution of Photovoltaic
Photovoltaic Power
Power Installed
Installed in
in Spain
Spain by
by Autonomous
Autonomous Communities
Communities (CCAA).
(CCAA).
Own elaboration with the data of [26].
Own elaboration with the data of [26].
Until the
Until thenew
newself‐consumption
self-consumption registry
registry defined
defined in RD244/2019
in RD244/2019 is implemented,
is implemented, the
the only only
official
official reference
reference regardingregarding the territorial
the territorial implementation
implementation of self-consumption
of self‐consumption in our in country
our country is
is the
the Administrative Registry of Self-consumption of Electrical Energy”. This registry
Administrative Registry of Self‐consumption of Electrical Energy”. This registry consists of two consists of two
sections corresponding
sections corresponding to to the
the two
two types
types of
of self-consumption: without surplus
self‐consumption: without surplus (Section
(Section 1)1) and
and with
with
surplus (Section 2). Additionally, the installations are classified into types. Therefore, within
surplus (Section 2). Additionally, the installations are classified into types. Therefore, within the T1.1 the T1.1
(Type 1 and Section 1), the installations of self-consumption mode “Type 1” with a
(Type 1 and Section 1), the installations of self‐consumption mode ʺType 1ʺ with a contracted power contracted power
lower or
lower or equal
equal toto 10
10 kW
kW areare framed.
framed. Within
Within T1.2
T1.2 (Type
(Type 11 and
and Section
Section 2),
2), “Type
ʺType 1”
1ʺ self-consumption
self‐consumption
mode installations with a contracted power greater than 10 kW are framed,
mode installations with a contracted power greater than 10 kW are framed, and within and within T2 (Type 2 and
T2 (Type 2
Section 2) the installations of Type 2 are framed. Figure 6 shows registered data of photovoltaic
and Section 2) the installations of Type 2 are framed. Figure 6 shows registered data of photovoltaic power
for self-consumption
power installations
for self‐consumption untiluntil
installations 31 December
31 December2018.2018.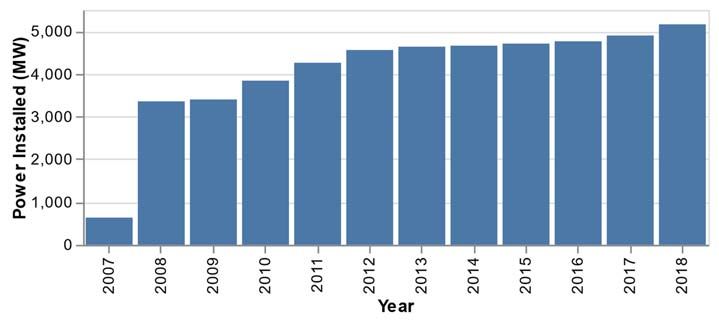
Type 1 installations corresponding to Section 1 stand out, while in Galicia, Type 1, Section 2
installations have a greater presence.
      These three communities are also the ones that group together the greatest capacity for self‐
consumption in terms of power. Catalonia is in first position with 6.3 MW, followed by Galicia with
5.9 MW, and
Sustainability    Andalusia
               2020, 12, 1892 with 4.8 MW. The three regions account for more than 62% of the installed
                                                                                                  7 of 18
power and 56% of the total number of installations [28].

     Figure 6.
     Figure     Installedphotovoltaic
            6. Installed  photovoltaicpower
                                       powerfor
                                              forself‐consumption
                                                  self-consumptionuntil
                                                                  until31
                                                                        31December
                                                                          December2018,
                                                                                   2018,by
                                                                                        bysection,
                                                                                           section,type,
                                                                                                    type,
     and region.  Own    elaboration with the data of [28].
     and region. Own elaboration with the data of [28].

      The most
      The         notable aspect
            employment             of these
                            footprint        data is
                                         groups   allthat  the numberdirectly
                                                        employment      of installations  grew by 80%
                                                                                  and indirectly         with respect
                                                                                                     associated   and
to 2017.  However,     the increase   in installed power     was only  40%,   which   clearly  indicates
induced with the productive activity of the photovoltaic sector. In 2018, there was an increase in the   that most   of
the  installations  commissioned     in  2018  were  small.  The number    of Type  1  installations with
number of direct and indirect jobs, which is expected to continue in 2019. Table 1 shows the evolution    outputs   up
to the
of  10 kW   increased
       national         by 143%
                  or domestic      in 2018,
                                direct        the number
                                        employment           of Type
                                                        footprint,    1 installations
                                                                   that is, the workers with  outputs
                                                                                           directly    above 10
                                                                                                    employed    in kW
                                                                                                                   the
increased   by  58%   and  the number     of Type  2  installations increased   by  only  30%.
different activities of the sector in Spain. This time series shows the effect of different regulations on
      As regards
the sector.  Around the40%
                        geographical      distribution,
                             of the employment           the largest
                                                      generated       number
                                                                  in Spain   by of
                                                                                theself-consumption     photovoltaic
                                                                                     sector is due to the  dragging
installations   are to be found   in the  autonomous      communities    of  Catalonia,
effect of the Production activity and 25% of the employment generated outside the SpanishAndalusia,   and  Galicia,
                                                                                                              bordersin
that order. However, in each of them, one type and section prevails: in Andalusia and Catalonia, Type
[25].
1 installations corresponding to Section 1 stand out, while in Galicia, Type 1, Section 2 installations
have a greater presence.
      These three communities are also the ones that group together the greatest capacity for
self-consumption in terms of power. Catalonia is in first position with 6.3 MW, followed by Galicia
with 5.9 MW, and Andalusia with 4.8 MW. The three regions account for more than 62% of the installed
power and 56% of the total number of installations [28].
      The employment footprint groups all employment directly and indirectly associated and induced
with the productive activity of the photovoltaic sector. In 2018, there was an increase in the number
of direct and indirect jobs, which is expected to continue in 2019. Table 1 shows the evolution of
the national or domestic direct employment footprint, that is, the workers directly employed in the
different activities of the sector in Spain. This time series shows the effect of different regulations on the
sector. Around 40% of the employment generated in Spain by the sector is due to the dragging effect of
the Production activity and 25% of the employment generated outside the Spanish borders [25].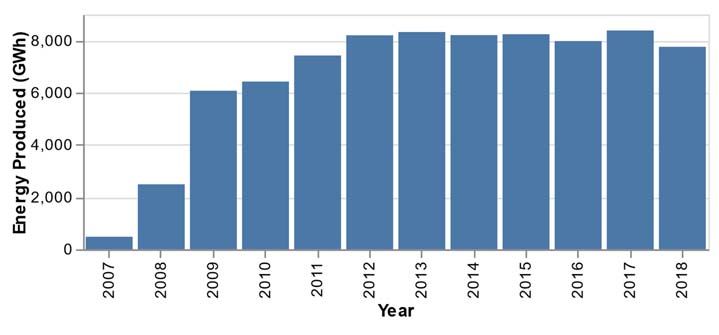
Sustainability 2020, 12, 1892                                                                                                        8 of 18

                  Table 1. Direct and induced employment of the solar photovoltaic sector [28–30].
     Employment     2005    2006   2007   2008     2009     2010     2011     2012     2013     2014   2015     2016     2017     2018
        Direct      5547    5778   6414   25,063   10,889   9952     10,013   9914     9302     8587   8818     8974     10,464   11,632
       Indirect     2932    2926   2911   2900     1615     1556     1670     1576     1446     1357   1392     1418     1845     2507
        Total       8479    8704   9325   27,963   12,504   11,508   11,683   11,490   10,748   9944   10,210   10,392   12,309   14,139

      This work has been oriented towards the impact that legislative changes have had on the financial
and business sectors in Spain, in which the specific performance of the facilities has little influence.
Although it is true that specific performance varies depending on the area, it is also true that it has not
changed substantially, but the economic performance has managed to reduce the price of Wp by 85%
(it has gone from 6 euros/Wp in 2006 to 0.8 euros/Wp in 2014). On the other hand, the upward trend of
BIPV installations is the result of the imperative need to seek solutions to the energy problem, it is a
priority to achieve buildings with zero consumption and self-sufficiency, in this field the PV plays a
fundamental role, so there is a tendency to take advantage of solar energy in building. The problem
outside Spain is incomparable since the legislation has suffered notable changes in Spain, while in the
rest of the countries the energy policy has not varied so deeply, so the effect is not comparable [29–32].

3. Institutional Framework of the Spanish Solar Photovoltaic Sector
      The New Institutional Economics (NIE) has established theoretical foundations that have allowed
for significant advancement in the institutional analysis of resource management, including energy
resources. The innovative nature of the NIE has led to the adoption of a multidisciplinary approach
to the study of energy resources. Furthermore, it is important to point out that, in order to create a
solid framework of study that is capable of providing solutions to the problems of the sector, case
studies are an essential part, such as the one analysed in this paper. In a reality as complex as that
presented by today’s developed economies, the study of the various governance structures must be
approached with tools that embrace complexity and incorporate it into the analysis. This is the case of
the NIE. In this way, the NIE approach will help to draw solid conclusions adapted to the complexity
demonstrated by the Spanish energy sector.
      According to the New Institutional Economics, institutions are understood as the rules of the
game of society [33] because they determine the structure of the economy, establish incentives for the
economic behavior of agents and affect social interaction, and can promote or contract exchanges in
an economy [34–36]. This happens, among other factors, because institutions redefine the level of
uncertainty to which individuals are subject, stimulating or discouraging transactions by providing
more or less certainty about what the actions of economic agents will be [37,38]. In this sense, it
is important for an economy that the institutional structure reduces existing uncertainty and that
regulatory stability is a fact, ensuring that institutional changes are balanced [39–41].
      The process of institutional change described in this paper corresponds to the political action of
the government and the legislative action of the parliament. Thus, although this work is eminently
empirical, the theoretical framework for studying the problem is based on the New Institutional
Economics. Under this research program we can study the transactional issues and governance
structures of the third level of social analysis indicated by [42].
      Before delving deeper into the institutional foundations, a brief description of the case is required.
With the arrival of the economic crisis in Spain, and later, with the change of the government of the
country in 2011, there was a brake in the energy policy that financially supported the installation of
photovoltaic plants in plots of Spanish territory. In this case, the entrepreneurs who invested ex-ante
in photovoltaic plants driven by the expected yields based on the high premiums offered by the
government, see ex-post how the government changes policy, reduces the premiums, and eliminates
the profitability of such investments already made, making it impossible for investors to recover
what has already been invested. This change implied a massive reduction in the bonus attributed to
entrepreneurs who produce solar energy in the “solar farms” [18,43].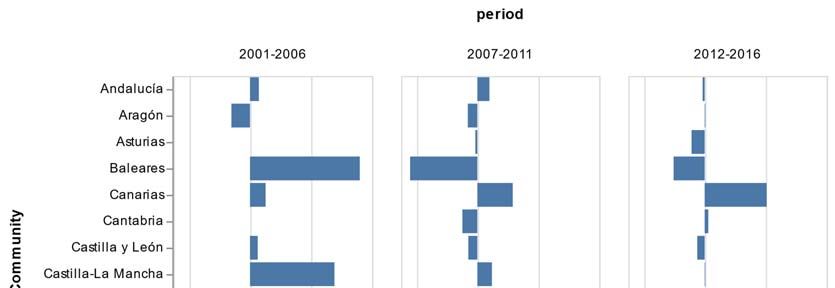
Sustainability 2020, 12, 1892                                                                        9 of 18

     The purpose of the study, in this case, is to analyze how the change of incentive policies to a
sector reduces the return on investments in it, and how these investments once made cannot have any
other purpose than the generation of photovoltaic energy, constituting a “hold-up” problem analogous
to that defined for the transactional economic theory of the company [14]. Within the economy of
transaction costs, “the hold-up problem” is defined as the risk derived from the change in the formal
contractual rules, which would suppose an “expropriation” or “robbery” of the irreversible investment
made by the company [44]. It is precisely in this last type of relationship that the case study in this
chapter is situated. Incomplete contracts and the risk of “robbery” of irreversible investments is even
greater in political or political-private relations [45], because, in the world of politics, contracts are
particularly complex, incomplete, difficult to guarantee their execution, and affect multiple agents. It
follows that legislators can pass laws at any given time but that those laws can be changed later by
those same legislators or by others. The inter-temporal component of public policy is vital in policy
making [46].
     At the same time, it should be noted that, in the existing distributive game in the electricity sector,
each decision by the State implies the existence of winners and losers, especially since this is a sector in
which there is room for different types of regulations and the application of laws. Well, it is true that
the large electricity companies criticized the policy of premiums for solar farms, highlighting their
very high cost, and demanded the elimination of them. Even when the rectification of the premium
policy began with the new measures adopted for the solar energy sector in 2010, the large electricity
companies continued to call for further adjustments in the premiums for renewable energies in order
to limit the tariff deficit.
     The time evolution of the case study reflects that the Spanish government underestimated the cost
of the incentives to the public treasury (at an aggregate level, the special regime in energy received
public funds for an amount exceeding 6 billion euros, which is two billion more than initially estimated).
Moreover, when the first major law on the feed-in tariff system was passed, Royal Decree 661/2007, the
economic crisis was already a reality in Spain [47]. Moreover, in view of this macroeconomic scenario
of losses, the same government that implemented such high remuneration for solar energy had to
gradually eliminate the tariff system. The elimination of the incentive system in 2012 diminished the
attractiveness of the sector for investors, slowing down the growth of the sector until now [14].
     From a transactional perspective, the incentive policy of solar fields can be analyzed as a contract
in which the state promises incentives and aid that guarantee a high return while investors make an
investment. The problem arises because the contract is incomplete and does not cover all contingencies,
and furthermore these political contracts are not enforceable against a third party, as the political
analysis of transaction costs has highlighted. This is why, in this analysis, the time horizon is a very
relevant factor [14,48]. Between 2007 and 2010, the regulations applied by the government encouraged
investment in solar energy. But from 2010, expected returns on investment began to plummet as laws
approving public incentives were repealed. Due to this chain of events, it has been considered relevant
to carry out an empirical study to quantify the economic losses of companies in the sector, as will be
done in the following sections.

4. Methodology
     To carry out the empirical sectorial analysis, we have used the SABI (Iberian Balance Sheet
Analysis System) database. This database, for Spain and Portugal, contains the annual accounts of the
companies included in the Mercantile register in the Iberian Peninsula. SABI is the Spanish extension
of the Bureau van Dijk’s Amadeus database. In order to delimit the population sample, four criteria
were followed:

•     Country: Spain;
•     Tax on commercial and professional activities (IAE (All codes): 1514—Sun water and other form
      of energy;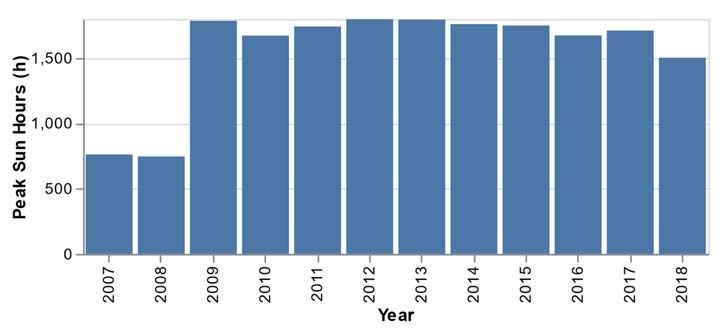
Sustainability 2020, 12, 1892                                                                          10 of 18

•     National Classification of Economic Activities (CNAE) 2009. (Primary codes only): 3519—Other
      types of electric power production;
•     Trade description: the words “photovoltaic” or “solar”.
•     Once these filters had been applied, we obtained a sample of 5354 companies.
•     To characterize the evolution of the sector we have supported our analysis in four main variables
      collected in the economic balances of the companies in SABIs such as:
•     The number of photovoltaic companies by date of creation in each Spanish Regional government
      segmented by period.
•     The mean of Sales for each Spanish Regional government segmented by period.
•     The mean of Operating Margin for each Spanish Regional government segmented by period.
•     The mean of Financial Result for each Spanish Regional government segmented by period.
•     For this analysis, it is considered that it would be necessary to complete it with a variable related to
      the sector’s workforce. However, this has not been possible due to the lack of data on the number
      of employees in each company, since, in the fiscal accounts provided by SABI, this variable did
      not have a large number of records.

5. Results
     The results of the financial analysis carried out with the sample collected from SABI reflect a sector
with a wide expansion in a short period of time 2005–2009 thanks to institutional incentives (Figure 3),
stopping one year before the approval of the Royal Decree 1565/2010 where the first reductions in
photovoltaic energy production bonuses appeared. In addition, as previously shown, photovoltaic
solar energy production has experienced generalized growth at the stage of approval of photovoltaic
premiums, with a generalized reduction, from 2010 onwards, for all the climatic zones in Spain with
the cancellation of premiums. The behavior of this variable is a concrete but representative example of
what has happened in the sector, as other variables in the sample follow this pattern.
     During the stage in which the variables are studied, 2001–2016, the world market for photovoltaic
energy presented strong variations. At the beginning of the 21st century, Europe was the leading
region for photovoltaic energy. In fact, it had the first and second largest Solar PV electricity generation
in the world in 2011: Germany with 19,599 GWh generated and Italy with 10,796 GWh generated [49].
However, since 2012 it has been observed that the demand for photovoltaic solar energy production,
clearly focused on the European market in recent decades, was being diverted to countries such as
China, Japan, or India. Europe was already a mature market. In 2016, the push from China, the
United States, and Japan had relegated Europe to second place, with Asia being the continent with
the highest production, more than 50% of the total [50]. Through the different variables we will be
able to carry out a more detailed analysis of the consequences and the factors of the institutional
change that has occurred since 2008. Figure 7 shows, by periods, the number of companies per year of
creation classified by regions. In the period 2001–2006, the most influential law, which would mark the
beginning of premiums in the photovoltaic sector, was Law 54/1997 [14,22]. It stipulated premiums for
those plants under 10 MW. With this law, the photovoltaic energy sector was promoted as a growing
market with guaranteed profitability, although not very high, by the public sector itself. In 2004, Royal
Decree 436/2004 was approved, which aimed to unify the different existing regulations to achieve a
reference rate. This law extended the premiums for photovoltaics to installations of up to 100 kW,
establishing a system of sections that would set the guidelines for the following pieces of legislation
within the sector. This first period experienced a continuous but moderate growth, since the investment
in the photovoltaic installations was still sensibly expensive and the premiums of these first pieces of
legislation were not as attractive as they would be in the following ones [51].
In Figure 7, we must pay attention to Madrid. We must clarify that in this figure the region of
destination is attributed according to its fiscal domicile, not where the solar panels are located.
Madrid, in addition to having better infrastructures that promote the industry, has a higher
percentage of companies related to the photovoltaic sector but that are not direct energy producers.
That is why,
Sustainability this
2020, 12,region
1892 has a higher percentage of companies than other Spanish regions with11
more
of 18
hours of sunlight per year [14,49].
Photovoltaic companies
Figure 7. Photovoltaic companies count
count by
by the
the date
date of
of creation in each Spanish regional government
segmented by period.
In the period 2007–2011, the great boom of the photovoltaic sector takes place. It is significant
that before 2007 the photovoltaic power accumulated in Spain was 152 MW, while in 2010 it exceeded
3000 MW [20]. This exponential growth was marked by Royal Decree 661/2007, which established
a fixed initial rate that would be updated with the level of inflation but also a maximum number
of hours in which one could receive the incentives. Other contributions were as follows: a) the
incentives would have a partial reduction at 25 years and b) the implementation of a ceiling of 371
MW of installed power in the Spanish territory where, once reached, the rates would be revised. The
legislative framework implemented with this decree provided long-term stability and profitability,
which attracted investment in this sector. However, in addition, there were other socio-economic
factors that drove the great growth of photovoltaic energy [52]: (a) The global economic crisis affected
Spain considerably. Sectors to which investment had traditionally been directed, such as construction,
were no longer a safe business. Therefore, a business legally pursued by the public administration
and with juicy premiums, such as solar energy, attracted the attention of investors. (b) The Spanish
financial system, led by savings banks and banks, publicized this type of investment, making it reach
different types of investors. Of the 20,000 million euros invested in this business, 75% of them came
from national or foreign banks. (c) “Project finance” was created to facilitate the investment. Financial
institutions founded them as micro-enterprises. These sought to pay the debt acquired for training with
the returns on the investment, since the minimum profitability was guaranteed by law in the actual
Decrees approved. (d) The characteristics of the solar modules favoured that they could be grouped
in small photovoltaic parks and were more accessible to small investors, even individually. (e) The
extra-official information about the hardening of the conditions for the installation of the photovoltaic
panels after 2008 accelerated their installation with a date before this horizon. (f) The technology of the
solar panels had improved and decreased in price and, consequently, energy production increased.
In addition, the lower euro–dollar differential in 2006, 2007, and 2008 meant that imports were cheaper,
which encouraged the purchase of photovoltaic panels. [23,52].
In Figure 7, we must pay attention to Madrid. We must clarify that in this figure the region of
destination is attributed according to its fiscal domicile, not where the solar panels are located. Madrid,Sustainability 2020, 12, 1892 12 of 18
in addition to having better infrastructures that promote the industry, has a higher percentage of
companies related to the photovoltaic sector but that are not direct energy producers. That is why, this
region has a higher percentage of companies than other Spanish regions with more hours of sunlight
per year [14,49].
Until 2011, leaving aside the community of Madrid, a large number of companies were created
related to this sector, in the regions with more hours of sunshine, highlighting Andalucia and Valencia.
In the north of the country, the appearance of new companies was very small.
It is notable that the creation of new companies in the 2012–2016 period is much lower compared
to previous periods. In fact, in that period, a considerable number of companies in the sector closed
with the corresponding loss of jobs that this entails. This sharp interruption in the growth of the
photovoltaic sector is intrinsically related to the institutional change that occurred in Spain since 2010.
The prelude to the change in premium policies began with the approval of Royal Decree 1578/2008 [53].
This decree established a quarterly call procedure that established the price of kWh. In this way, the
Pre-Assignment of Retribution Registry (RPR) was created to control the installed power. Given the
small quotas that were legislated and the delay in their allocation, a large number of projects were
delayed in their implementation. However, the definitive change of rules occurred with Royal Decree
1003/2010, Royal Decree 1565/2010, and Royal Decree-Law 14/2010 [14,19]. With this new legal scenario,
the owners of solar parks had to certify the date on which their plant began to operate, and according to
this date, they would be entitled to charge one or another bonus. In addition, certain aspects of Royal
Decree 661/2007 were revised, such as long-term bonuses, and technical innovations were required for
the plants [18]. According to the calculations of the Spanish Government, these measures represented
a saving of 740 million euros from 2011 to 2013. Consequently, the loss of profitability of some plants
reached up to 40% [23].
In addition, the profitability of the sector worsened in 2013. When Royal Decree Law 2/2013 was
approved, companies were forced to choose between the two existing mechanisms of retribution: go to
the market or, in the case that the price does not cover generation costs, receive a compensatory bonus.
However, the situation of the sector became critical when Royal Decree Law 9/2013 was approved,
which completely eliminated the premiums for the generation of photovoltaic energy [22].
Another key variable when analysing the great growth of the photovoltaic sector in Spain is the
amount of electrical energy produced under special regime sold (sales). Figure 8 shows a large increase
in sales in the sector. From 2001 to 2008, the amount of sales tripled. In the later period, with an
economic and institutional scenario not so favourable, sales stagnated.
To compare the affinity between the 2007–2011 and 2012–2016 periods, we must take into account
that Royal Decree 661/2007 introduces the “floor and ceiling” system and, in the event that sales exceed
the “ceiling” figure, it would only be perceived the roof support level (the roof level was reached at
100 Kw). That is why the variation of sales between the period 2007–2011 and 2012–2016 is minimal,
since the photovoltaic plants, from its massive installation, decided to produce up to the limit “ceiling”
and have maintained that level for the last two analysed periods [22]. As can be seen in Figure 8, the
variation of the sales of the sector for the period 2007–2011 and 2012–2016 has been very small, even
in aggregate terms it has decreased by several percentage points its aggregate variation rate for all
of Spain [24]. This fact is due to the maintenance of the ceiling production figure (analysed above)
and the brake on the creation of companies in the sector. Although the net change in the creation of
companies has been positive in the 2012–2016 period, compared to the previous period, their figures
are much lower.
Another variable analyzed is the operating margin (operating earnings/revenue), which obtained
its worst results in the 2007–2011 period (Figure 9). The communities in the south and in the Canary
Islands are among those that have suffered the least impact during these periods. The causes of its
worrying development in this stage are due to the change in trend towards the photovoltaic sector of
Spanish legislation. After the approval of Royal Decree 1565/2010, the sector reacted negatively to the
change in rates and the negative outlook regarding its future. That is why the average operating profitSustainability 2020, 12, 1892 13 of 18
decreased by five percentage points between 2009 and 2010. Following this trajectory, the inter-annual
variation
Sustainabilityfrom
2020, 2012 to 2013
12, x FOR PEERwas minus 10 points [19,22].
REVIEW 13 of 18
Figure 8. Mean of sales for each Spanish regional government segmented by period.
Another variable analyzed is the operating margin (operating earnings/revenue), which
obtained its worst results in the 2007–2011 period (Figure 9). The communities in the south and in the
Canary Islands are among those that have suffered the least impact during these periods. The causes
of its worrying development in this stage are due to the change in trend towards the photovoltaic
sector of Spanish legislation. After the approval of Royal Decree 1565/2010, the sector reacted
negatively to the change in rates and the negative outlook regarding its future. That is why the
average operating profit decreased by five percentage points between 2009 and 2010. Following this
trajectory, the inter‐annual variation from 2012 to 2013 was minus 10 points [19,22].
Figure 8. Mean of sales for each Spanish regional government segmented by period.
Figure 8. Mean of sales for each Spanish regional government segmented by period.
Another variable analyzed is the operating margin (operating earnings/revenue), which
obtained its worst results in the 2007–2011 period (Figure 9). The communities in the south and in the
Canary Islands are among those that have suffered the least impact during these periods. The causes
of its worrying development in this stage are due to the change in trend towards the photovoltaic
sector of Spanish legislation. After the approval of Royal Decree 1565/2010, the sector reacted
negatively to the change in rates and the negative outlook regarding its future. That is why the
average operating profit decreased by five percentage points between 2009 and 2010. Following this
trajectory, the inter‐annual variation from 2012 to 2013 was minus 10 points [19,22].
Figure 9. Mean of the operating margin for each Spanish regional government segmented by period.
In terms of financial results, the worst results are focused on the 2007–2011 period (Figure 10).
The financial results ratio was calculated taking into account the financial result and the EBIT (Earnings
Before Interest and Taxes). Financial expenses in this period increased as the number and amount ofSustainability 2020, 12, x FOR PEER REVIEW 14 of 18
Figure 9. Mean of the operating margin for each Spanish regional government segmented by period.
In terms of financial results, the worst results are focused on the 2007–2011 period (Figure
Sustainability 2020, 12, 1892
10).
14 of 18
The financial results ratio was calculated taking into account the financial result and the EBIT
(Earnings Before Interest and Taxes). Financial expenses in this period increased as the number and
bank loans
amount granted
of bank loansto the sectortogrew
granted substantially.
the sector As mentioned
grew substantially. As above,
mentionedgivenabove,
the high
givenprofitability
the high
of the policies approved by the executive branch, the Spanish financial system
profitability of the policies approved by the executive branch, the Spanish financial system promoted promoted an aggressive
investment
an aggressive policy in the solar
investment sector.
policy in This strategy
the solar attracted
sector. This astrategy
large number of investors—remember
attracted a large number of
that 75% of them werethat
investors—remember foreign—and
75% of them created
werenew products, such
foreign—and createdas "project finance",such
new products, to increase the
as ʺproject
attractiveness of the sector. These loans were financed at an average interest rate
financeʺ, to increase the attractiveness of the sector. These loans were financed at an average interest of 16% [19]. In addition
to this
rate high[19].
of 16% levelInofaddition
indebtedness
to thisthat
highwould
level ofbegin in 2006, the
indebtedness thatfinancial resultinwas
would begin affected
2006, by the
the financial
“hold-up”
result was process
affectedthat took
by the place in 2008,
ʺhold‐upʺ process bythat
which investors
took place inwho 2008,had
by opted
whichfor the photovoltaic
investors who had
sector—for
opted for thehaving a high profitability
photovoltaic sector—for havingand its ainsured premiums and
high profitability through Law Decrees—found
its insured premiums through that
this situation
Law became that
Decrees—found reversible, eliminating
this situation became by reversible,
law all those subsidiesby
eliminating to law
the sector [14].
all those When the
subsidies to
regulations contained in the decrees law decreased the profitability and
the sector [14]. When the regulations contained in the decrees law decreased the profitability and the large premiums, the
relative
large increase inthe
premiums, therelative
financialincrease
result wasin high. Recall that,
the financial following
result the reductionist
was high. Recall that, trend, the rates
following the
approved in trend,
reductionist Royal Decree
the rates 1578/2008
approved forineach
Royalsubgroup
Decree of solar energy
1578/2008 decreased
for each subgroup in comparison
of solar energywith
the Royal in
decreased Decree of 2004.with
comparison Facilities withDecree
the Royal a power equalFacilities
of 2004. to or lesswith
thana 20
powerkW equal
are assigned
to or less a tariff
than
of €kW
20 0.32/kWh;
are assignedwhilea the facilities
tariff with a higher
of € 0.32/kWh; while thepower were with
facilities givena ahigher
price of € 0.34/kWh
power were given(remember
a price
that
of € in 2004, most
0.34/kWh of the installations
(remember that in 2004,received
most aoftariff
the higher than € received
installations 0.40/kWh). That is
a tariff why in
higher 2009,
than €
the creationThat
0.40/kWh). of newis whycompanies
in 2009, decreased
the creation andof installed photovoltaic
new companies capacity
decreased stagnatedphotovoltaic
and installed for the first
time in four
capacity years. Likewise,
stagnated for the firstthistime
process had an
in four impact
years. on the coverage
Likewise, index,
this process had which increased
an impact on two
the
inter-annual points from 2008 to 2009 [19].
coverage index, which increased two inter‐annual points from 2008 to 2009 [19].
Figure 10.
Figure Mean of
10. Mean of the
the Financial
Financial Result
Result for
for each
each Spanish
Spanish regional
regional government
government segmented by period.
In addition,
In addition, as as of
of 2008,
2008, private
privatefinancing
financing began
began totosuffer,
suffer, which
which worsened
worsened thethe aggregate
aggregate financial
financial
result of
result of the
the sector.
sector. The
Thesovereign
sovereigndebtdebtcrisis
crisisand
andthe
theeuro
euro crisis
crisis caused
caused thethe private
private financial
financial sector
sector to
to tighten the conditions for access to credit. This circumstance had a negative effect
tighten the conditions for access to credit. This circumstance had a negative effect on the financial on the financial
results of
results of the
the companies,
companies, which
which increased
increased their
their negative
negative trend
trend from
from 2008
2008 to
to 2012
2012 [19]. For its
[19]. For its part,
part, the
the
Spanish State,
Spanish State,faced
facedwith thisthis
with knotknot
in private financing,
in private decideddecided
financing, to undertake compensatory
to undertake measures.
compensatory
However, although a credit line of the Official State Credit Institute was launched in July 2011, with a
variable interest rate and a repayment term of seven years maximum, this initiative was not enough to
replace the now-defunct private financing [14].You can also read