WP/20/16 - International ...

Page created by James Delgado
 
CONTINUE READING
WP/20/16 - International ...
WP/20/16

               Effectiveness and Equity in Social Spending:
                                         The Case of Spain

                                                              by Svetlana Vtyurina

IMF Working Papers describe research in progress by the author(s) and are published
to elicit comments and to encourage debate. The views expressed in IMF Working Papers
are those of the author(s) and do not necessarily represent the views of the IMF, its
Executive Board, or IMF management.
WP/20/16 - International ...
1

© 2020 International Monetary Fund                                                               WP/20/16

                                         IMF Working Paper

                                         European Department

                Effectiveness and Equity in Social Spending: The Case of Spain

                                  Prepared by Svetlana Vtyurina 1

                         Authorized for distribution by Andrea Schaechter

                                              January 2020

    IMF Working Papers describe research in progress by the author(s) and are published to
    elicit comments and to encourage debate. The views expressed in IMF Working Papers are
    those of the author(s) and do not necessarily represent the views of the IMF, its Executive Board,
    or IMF management.

                                                Abstract

Spain is experiencing sustained economic and social disparities in several areas. Social
spending policies have a heightened responsibility to respond but are challenged by high
public debt and pressures from an aging society. This study takes stock of the level and
effectiveness of public social expenditure from a cross-country and macroeconomic view,
complementing recent targeted spending reviews. The results suggest that social
protection spending should aim to improve redistribution through better targeting the most
vulnerable while more effective education and active labor market policies should aim to
create more equal opportunities and income prospects. In some areas more fiscal resources
are needed. But social spending alone cannot reduce inequality, and efforts also should be
directed toward making the labor market more inclusive.

JEL Classification Numbers: E62, H2, H75, I1, I2, I3, J62, J65

Keywords: Social Protection Expenditure, Redistribution, Spending Efficiency, Spain
Author’s E-Mail Address: svtyurina@imf.org

1
 The author would like to thank the Banco de España, Ministerio de Economía y Empresa, Ministerio de
Sanidad, Consumo y Bienestar Social, Ministerio de Trabajo, Migraciones y Seguridad Social, Andrea
Schaechter, Maura Francese, and IMF seminar participants for helpful comments and suggestions. Jenny Lee’s
data assistance was invaluable. All remaining errors are my own.
2

                                 TABLE OF CONTENTS

ABSTRACT _________________________________________________________________1

I. INTRODUCTION ___________________________________________________________3

II. OVERVIEW OF SOCIAL SPENDING____________________________________________4

III. SUSTAINABILITY, ADEQUACY, REDISTRIBUTION AND SUSTAINABILITY OF SOCIAL
PROTECTION SPENDING ______________________________________________________5
A. Pensions ________________________________________________________________5
B. Unemployment Protection __________________________________________________7
C. Other Social Assistance ____________________________________________________8
D. Redistribution Impact on Inequality _________________________________________12

IV. EFFICIENCY OF SPENDING ON HEALTH, EDUCATION AND ACTIVE LABOR MARKET
POLICIES _________________________________________________________________15
A. Healthcare _____________________________________________________________15
B. Education and Training ___________________________________________________18

V. TAKEAWAYS AND POLICY RECOMMENDATIONS _______________________________21

REFERENCES ______________________________________________________________24

BOXES
1. What is Social Spending? ___________________________________________________5
2. Minimum Income Schemes ________________________________________________11
3. Recent Reforms and Savings in the Healthcare Sector ____________________________16

FIGURES
1. Social Protection Expenditure, 2017___________________________________________4
2. Pension Expenditure and Benefits ____________________________________________7
3. Unemployment Protection __________________________________________________8
4. Family Benefits and Minimum Income Support _________________________________9
5. At Risk-of-Poverty _______________________________________________________10
6. Gini Coefficient _________________________________________________________12
7. Indicators of Redistribution ________________________________________________13
8. Intergenerational Inequity __________________________________________________14
9. Means-Testing of Social Spending ___________________________________________14
10. Selected Indicators in the Healthcare Sector __________________________________17
11. Income Mobility across___________________________________________________18
12. Selected Education and Active Labor Market Policy Indicators ___________________20

TABLES
1. Selected Countries: Social Protection and Health Expenditure, 2017 _________________6
2. Public Finances and Social Protection Spending, 2007–18 _________________________6
3

                                            I. INTRODUCTION

A harsh social fallout from the global financial crisis brought to the fore income
inequalities in many countries and led to calls for increases in social spending. This
came at a time when the fiscal space was generally limited due to high debt levels (Chen and
others; IMF 2014). Over the last decade, Spain acted on the social front by raising
allowances to poor families with children, long-term unemployment benefits, student
stipends, and the minimum wage. Pensions continued to rise in real terms against adverse
population dynamics, which implies significant spending pressures over the medium to long
term. In 2019, Spain’s public debt level is still close to 100 percent of GDP, nearly three
times as high as in 2007.

In this context, there is merit to assessing the delivery, adequacy, and effectiveness of
social spending. International experience shows that a more efficient provision of public
expenditure could yield better outcomes for a given cost or create additional resources to
raise outcomes where social indicators fare particularly weakly (see Box 1 for a definition of
“social spending”). The Spanish government is committed to “efficient management of
public resources [that] translates into allocation to those areas of expenditure with the highest
priority or with the greatest potential for impact on society and the economy” (Stability
Program Update 2019–22). The Independent Authority for Fiscal Responsibility (AIReF)
was commissioned to carry out granular reviews in selected expenditure areas: healthcare
spending (prescription drugs, hospital spending) at the regional level, a proposed minimum
income scheme at the state level, subsidies and grants (e.g. university scholarships and
housing), and active labor market policies (in particular, hiring incentives), which is one of
the largest budget items in the area of subsidies. 2

This study takes stock of the level and effectiveness of overall public social expenditure.
By taking a cross-country and macroeconomic view, it sets a broad framework that builds on
the advice of other stakeholders and recent studies by AIReF (2019) and Funcas (2019) on
how to improve social outcomes more generally and lower the gaps across regions.
Chapter II provides an overview of the social protection system and spending trends.
Chapter III discusses the main categories of social protection spending (pension,
unemployment, social assistance), their sustainability, adequacy and efficiency in relation to
social outcomes. Chapter IV examines on spending for health, education and training (active
labor market policies) and its efficiency. Chapter V concludes with some policy
recommendations. This paper does not analyze the new government’s coalition agreement on
social reform agenda in full, but a few proposals are mentioned in selected areas.

2
    Completed reviews can be found on http://www.airef.es/en/spending-review.
4

                                II. OVERVIEW OF SOCIAL SPENDING

Responsibility for social spending in Spain is shared across all levels of government.
Social spending is generally defined across three main categories (Box 1). While pensions
and contributory unemployment systems remain centralized, the rest of the social protection
has become a complex mosaic of support networks at different levels due to its mostly
decentralized structure (Cavanillas, 2015; EC, 2015a). Both the national government and
regional authorities have the power to legislate over benefits and to oversee their delivery.
Generally, only pensions and contributory unemployment systems remain centralized
whereas social services are largely managed and delivered at the regional and local levels.
Legislative and tax practices vary by local authority. The social protection system covers
sickness, retirement, unemployment, survival, disability, and family spending
(maternity/paternity and transfers), and transfers for housing and to reduce exclusion. For
education, a state ministry carries an overall mandate, but the Autonomous Communities
make most of the decisions regarding their own education systems. The provision of active
labor market policies is decentralized to the regional level.

Social protection outlays in Spain are      Figure 1. Social Protection Expenditure, 2017
about half of total public
                                               35
                                                                         FRA
expenditures (Table 1). Spain spends
                                                                              DNK
less than the EU-average when                  30                         FIN
                                                                     ITA     AUT
                                                                               NLD
                                                                        BELDEU     CHE
measured relative to GDP (Figure 1).                                           SWE
                                                   Percent of GDP

                                               25            GRC
The administrative cost of Spain’s social                      PRT
                                                                      ESP      ISL
protection system is below the                                  SVN                                   LUX
                                                           HRVPOL
                                               20
                                                                  CZE
EU average. Most of Spanish social                       HUNSVK     CYP
                                                          BGR
                                                                EST     MLT
spending is public unlike in other EU          15
                                                            LVA
                                                                LTU                    IRL
                                                         ROU
countries which have greater private
                                               10
mandatory and voluntary outlays, in               10          30              50        70         90     110
particular on pension and health                                 GDP per capita (thousands of USD)
                                                  Source: Eurostat.
spending. Social protection spending
has followed a strongly countercyclical
pattern over the past decade and acted as an automatic stabilizer during the crisis (Table 2).
When output contracted sharply, social benefits in percent of GDP increased, mostly
reflecting more outlays for unemployment benefits. The reverse pattern was observed with
the recovery of the economy since 2014. In nominal and real terms, most social benefits—
except subsidies for some years—continued to rise during the past decade but at much more
moderate levels than pre-crisis.
5

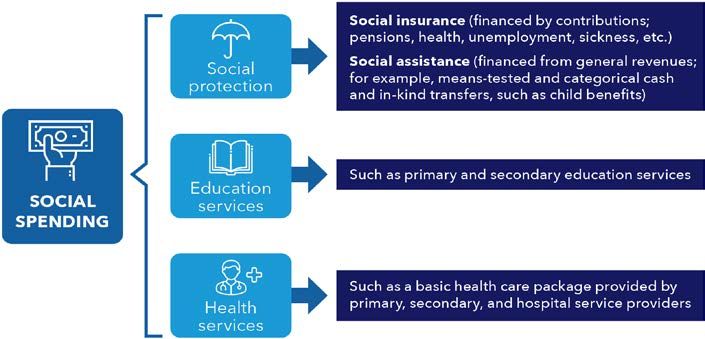
                                          Box 1. What is Social Spending?
    Social spending is defined as spending on social protection, education, and health following IMF
    (2019).1 Social protection is defined to comprise social insurance and social assistance programs. Social
    insurance (e.g., unemployment insurance, pensions and healthcare) aims at protecting households from
    shocks that can adversely impact their incomes and welfare and is typically financed by contributions or
    payroll taxes.2 Social assistance (e.g., universal and targeted transfers) aims at protecting households
    from poverty and is financed by general government revenue.
    For the analysis in this paper, we deviate in one aspect from the coverage of the chart below. We discuss
    active labor market and training policies under “education spending.” Healthcare is discussed jointly
    with education spending in Chapter III since it is not contribution but tax-funded in Spain.

    Source: A Strategy for IMF Engagement on Social Spending, IMF (2019).
    __________________________
    1
      Basic healthcare not covered by health insurance which is of relevance mostly in countries with little health
    insurance coverage.
    2
      Healthcare is not part of social protection definition in Spain since it is tax-funded and universal. But Eurostat
    includes it in its statistics and it is also part of the framework provided in IMF (2019) if it is contribution-funded
    which is the case for many European countries.

        III. SUSTAINABILITY, ADEQUACY, REDISTRIBUTION AND SUSTAINABILITY OF SOCIAL
                                  PROTECTION SPENDING

                                                       A. Pensions

Contributory pensions constitute the largest part of social protection and are
considered fairly generous in the regional comparison. They comprise long-term
disability, old age and early retirement, and survivor pensions (Table 1). 3 There is also a
(small) non-contributory pension scheme, aimed at people who are unable join the labor
market. Spain’s pension spending in percent of GDP is at par with peers and the EU average
but the replacement rate of Spanish public pensions, or the average initial benefit as a share
of average wage, is considerably higher than the EU28 average (Figure 2). Survival benefits
are also much above average. As a result, old-age poverty in Spain is relatively low and
pensioners have been well protected from the global financial crisis (IMF, 2017).
3
    For the description of pension system’s fundamentals see for example IMF, 2017a and EC, 2015b.
6

           Table 1. Selected Countries: Social Protection and Health Expenditure , 2017
                                                                            By type of
                                                                        expenditure/percent
                       Per capita                                            of total                         In percent of GDP
                                    In
                               purchasing Total social of which                                                         Sickness/
                              power parity protection/ pensions/ %                                                      healthcare/
                 In euros         (PPP)    % of GDP /1 of GDP benefits Admin. Other Exclusion Family Housing Disability invalidity Unempl. Surviving Old age
 France              11,160         10,915         34.1          15.0     93.1     3.8     3.1       1.1    2.6       0.9       2.2          9.8      2.1       1.8     13.7
 Austria             10,752         10,964         29.4          14.1     96.3     1.8     1.8       0.6    2.8       0.1       2.1          8.8      2.0       1.6     12.8
 Belgium             10,158         10,043         28.8          12.6     94.5     3.7     1.9       0.7    2.2       0.3       2.5          7.7      2.0       1.9     11.5
 Italy                7758*          8,206         29.1         15.9*     96.0    2.0*     2*        0.3    1.8       0.0       1.7          6.7      1.7       2.6     14.2
 Netherlands         11,753         11,014         29.3          12.6     94.0     5.0     1.0       1.5    1.2       0.5       2.7          9.9      1.2       1.1     11.2
 Spain*               5,627         6,349          23.4          12.6     98.2     1.7    0.0        0.2    1.3       0.1       1.7          6.5      1.9       2.3      9.5
 EU28*                7,657          8,231         27.9          12.6     96.3     2.7     1.0       0.6    2.4       0.6       1.7          8.2      1.3       1.5     11.2
 * 2016, except for PPP and Total social protection as % of GDP.
 1/ Eurostat includes the following items: social protection (https://ec.europa.eu/eurostat/statistics-explained/index.php?title=Glossary:Social_protection); administration
 costs, which represent the costs charged to the scheme for its management and administration; other expenditure, which consists of miscellaneous expenditure by social
 protection schemes (payment of property income and other).
 Source: Eurostat; and IMF staff calculations.

               Table 2. Spain: Public Finances and Social Protection Spending, 2007–18
                                                     2007     2008      2009     2010      2011      2012         2013      2014      2015         2016     2017       2018
                                                  (Percent of GDP, unless otherwise noted)
   Revenue                                  41.1   36.9   35.0     36.5   36.4     37.9   38.8     39.2     38.7    38.1                                     38.2       39.2
    Taxes                                   24.6   20.2   18.0     19.6   19.5     20.8   21.8     22.3     22.3    22.1                                     22.2       22.9
   Expenditure                              39.3   41.4   46.2     46.0   46.2     48.7   45.8     45.1     43.9    42.4                                     41.2       41.7
       Social protection 1/                 13.9   14.9   17.4     18.0   18.2     19.1   19.5     19.2     18.4    18.2                                     17.9       18.0
        Subsidies                            1.1    1.1     1.2     1.1    1.1      1.0     1.1     1.1       1.1     1.0                                     1.0        1.0
                                                           (y-o-y change, nominal)
   Revenue                                   8.7   -7.5    -8.6     4.8   -1.1      0.9     1.2     2.2       3.1     1.8                                     4.4        6.2
    Taxes                                    8.9 -15.2 -14.4        9.8   -1.8      3.6     3.6     3.6       4.6     2.4                                     4.8        6.4
    Expenditure                              9.4    8.9     7.5    -0.1   -0.6      2.2    -6.8    -0.4       1.6     0.0                                     1.3        4.8
       Social protection 1/                  7.0   10.8   12.6      4.0   -0.1      1.7     1.1    -0.1       0.0     2.2                                     2.2        4.3
        Subsidies                           13.9    3.9     0.8    -1.3   -1.1    -18.3     8.6     5.3       8.4   -8.5                                      8.0       -0.2
                                                             (y-o-y change, real)
   Revenue                                   6.3   -7.7    -8.8     4.8   -1.0      0.5     1.5     1.7       2.8     0.4                                     3.3        5.0
    Taxes                                    6.5 -15.3 -14.5        9.8   -1.7      3.2     3.8     3.0       4.3     1.0                                     3.7        5.2
    Expenditure                              5.8    6.5     7.3    -0.3   -0.6      2.3    -7.2    -0.2       1.0   -0.4                                     -0.1        3.6
       Social protection 1/                  3.4    8.3   12.5      3.8    0.0      1.8     0.7     0.1      -0.5     1.9                                     0.8        3.2
        Subsidies                           10.1    1.6     0.6    -1.5   -1.1    -18.2     8.2     5.5       7.8   -8.8                                      6.5       -1.3
   1/ In-kind and cash (cash transfers, unemployment benefits, pensions and other). Does not include health spending.
   Sources: Ministry of Finance; Eurostat.

The sustainability of the pension system is at risk unless additional measures are taken.
In principle, full implementation of the 2011 and 2013 reforms would keep pension spending
broadly in check in response to unfavorable demographics. The 2018 Aging Report, which
assumes a full implementation of the reforms, estimates public pension outlays to rise by
1.7 percentage points of GDP by 2050 and fall by 1.5 points through 2070 compared to 2016.
But the 2011/13 reforms would imply a significant reduction in the benefit ratio (that means
the average benefit payment in relation to the average wage), which has so far not proven to
be socially acceptable. Even though the benefit ratio would stay above the ratio in most other
EU countries, social pressure has led to a relinking of pension increases to inflation since
2018 and a delay in implementing a discount (“sustainability”) factor for changes in life
expectancy. These deviations from the past reforms, if pursued permanently, are estimated to
7

result in additional pension spending of about 3–4 percent of GDP by 2050 under current
macroeconomic and demographic projections (IMF, 2018; Bank of Spain, 2018). To ensure
the sustainability of the pension system, a comprehensive reform package is needed. Specific
measures could include: (i) incentivizing longer work lives; (ii) raising revenues without
raising the already high contribution rates; and (iii) encouraging supplementary savings
(IMF, 2018).

                                                              Figure 2. Pension Expenditure and Benefits
Pension Expenditure, 2017                                                                                    Pension benefits
                                                                                                             (Percent of average wage)
             19
                                                                                                        90                                                                90
                                                                                                                                                  EU-28 - average
             17                              GRC                                                                                                  replacement rate
                                                        ITA                                             80                                                                80
                                                               FRA                                                                                ESP - benefit ratio
             15                                PRT                   AUT                                70                                                                70
Percent of GDP

                                                               FIN
                                                                                                                                                  ESP - replacement
             13                                         ESP      BEL      NLD CHE                       60                                                                60
                                                                                                                                                  rate
                                                                       DNK
                                                                         DEU
                                               POL                                       NOR                                                      EU-28 - benefit ratio
             11                   SRB    HRV                                                            50
                                                     SVN                SWE                                                                                               50
                                                           CYP
                 9                        ROUHUNSVK
                                        BGR                                                             40                                                                40
                                                              MLT
                 7                           LVA EST CZE                                                30                                                                30
                                                 LTU                                     IRL                  2016    2020     2030     2040   2050   2060      2070
                 5
                     0       10         20         30          40          50       60         70            Benefit ratio = Average benefit payment/ average wage
                                   GDP per capita (thousands of USD)                                         Replacement rate = Average initial benefit / average wage
                     Source: Eurostat.
                                                                                                             Source: EC 2018 Agei ng Report.

                                                                                B. Unemployment Protection

Spending on unemployment in Spain has been consistently elevated given the high level
of structural unemployment. The main category is the contributory unemployment benefit
(prestación por desempleo). In 2017 it was higher in Spain compared to some advanced
economy peers and the EU average, including as a percent of GDP (Table 1). This is largely
explained by Spain’s still high level of unemployment, which has been the case historically
and linked to high structural unemployment (Figure 3). Spending per inhabitant is also above
the EU average.

Unemployment protection is viewed as broadly adequate. Levels and duration are
considered by some estimates fairly generous (Figure 3; Tatsiramos, 2014; Glassdoor
Research, 2016). To receive the contributory unemployment benefit in Spain, a claimant must
have contributed to Social Security for a minimum of one year. This contributory period
gives the right to receive benefits for 120 days (4 months; maximum 24 months), given that a
claimant is actively seeking employment. The 2012 reform reduced the amounts drawn after
6 months. Regarding non-contributory benefits, the system consists of several subsidies that
cover different situations and have different requirements. Recipients must agree to work
with public employment offices to design a personalized job plan to help them find work.
Those without access to any of the existent unemployment benefits can apply for the Active
Insertion Scheme (renta activa de inserción) and extraordinary unemployment benefits
(SED). The latter benefit was introduced in 2018 for long-term unemployed given that
displacement is still at a high level in this category. The impact of this program relies on the
capacity of the regional public employment services to provide individualized assistance for
8

jobseekers, which so far has been uneven by region and statistics are difficult to collect (ILO,
2015; EC, 2017).

                                                      Figure 3. Unemployment Protection
    Unemployment Benefits, 2017                                                   Unemployment Benefit Expediture
    (In PPS per inhabitant)                                                       (In percent of GDP)
                                                                                   16
     700
                                                                                   14
     600
                                                                                   12                                                                  ESP
     500
                                                                                   10
     400
                                                                                    8
     300
                                                                                    6
     200                                                                                                                                           Euro Area 1/
                                                                                    4
     100
                                                                                    2

       0                                                                            0
             CZE

            HUN
             POL
            GEU

               LIT
            NDL
              IRL

             LUX

            DNK

             PRT

            GRC
             BEL

             ESP

             EST
            MLT
            AUT

              ITA

             SLV

             SLK
              FIN
             FRA

           EU 18

           EU 28

             CYP
            SWE

             LVA

             BUL

            GBR
            HRV

            ROU
                                                                                         2005 2006 2007 2008 2009 2010 2011 2012 2013 2014 2015 2016

                                                                                  1/ Projections 2014-16 for several countries.
            Source: Eurostat.                                                     Sources: Eurostat; and Fund staff calculations.

           Replacement Rate for Low-Wage Workers, 2018                            Maximum Duration of Unemployment Benefits, 2018 1/
           (Percent; Net benefit as percent of pre-layoff net earnings 1/)        (Months)
     90
                                                                                    30
     80
                                                                                    25
     70

     60                                                                             20
     50
                                                                                    15
     40

     30                                                                             10
     20
                                                                                     5
     10

      0                                                                              0
              ESP       ITA       DEU       SWE       NLD        FRA    GBR                   GBR                DEU                ITA               FRA                ESP              NLD
                                                                                          1/ Maximum benefit duration for a 40-year old displaced worker with 22 years of contributions
                                                                                          (continuous employment since age 18).
           1/ Previous earnings are 67 percent of the average wage.                       Source: OECD.
           Source: OECD.

                                                               C. Other Social Assistance

Other social assistance spending is below the EU average. Spending on social exclusion,
family (including child benefits), and housing stands at about 1.6 percent of GDP, which is
quite below the peer average, with spending on housing especially small (Table 1). Family
benefits are the main spending item in this category in Spain. 4 These have trailed advanced
peers for quite some time (Figure 4).

Minimum Income Schemes are the main instrument of social assistance aimed at
reducing social exclusion. These are set up as non-contributory cash safety nets supporting
people of working age who are not eligible for unemployment benefits, or those whose
entitlement to these payments has expired. These include: (i) the non-contributory
unemployment support (subsidio de desempleo), at the national level; and (ii) the minimum
income benefit, renta mínima de inserción (RMI), at the regional level (Box 2). These

4
 Maternity (contributory and non-contributory) and paternity (contributory) leave, benefits for dependent
children or foster children, benefits for large families or one-parent or mothers with a disability, and benefits for
multiple birth or adoption (EC, 2018c). Assistance is in cash and in-kind.
9

benefits are means tested and are adjusted to a basic amount defined for a single-person
household, supplemented according to the additional household members. 5 There is
considerable variation in both the basic amount and the supplements. Since 2011, pressure
from fiscal consolidation as well as from increased demand has led to a series of wide-
ranging adjustments to the minimum income schemes. These initiatives seem to have focused
on reducing demand (as well as the number of beneficiaries), while social inclusion
objectives appear to have been relegated to the second level of priority (EC, 2015a).

                                           Figure 4. Family Benefits and Minimum Income Support
                                                                                                                          Social Spending on Families and Child Poverty Rate, 2015
Family Benefits 1/
                                                                                                                          (or latest available)
(In percent of GDP)
    3.5                                                                                                                                                  0.25
                                                                                                                                                                                                                ESP

                                                                                                                         Child povery rate (disposable
      3                                                                                                                                                  0.20                                                                                      LTUITA
                                                                                                                                                                                                    GRC
                                                                                                                                                                                                      PRT                                                   SVK

                                                                                                                                  income) 1/
    2.5                                                                                                                                                  0.15                                                                      POL               LUX
                                                                                                                                                                                                                                        OECDESTHUN
                                                                                                                                                                                                                              NLD  LVA DEU             GBR
      2                                                                                                                                                                                                                                          FRA
                                                                                                                                                         0.10                                                                       CZEIRLAUT BEL ISL SWE
                                                                                                                                                                                                                               SVN
    1.5                                                                                                                                                  0.05                                                                                   FIN DNK
      1
                                                                                                                                                         0.00
                     OECD Eurozone avg.                 FRA          DEU           ITA        NDL           ESP                                                   0.0          1.0          2.0          3.0         4.0
    0.5
                                                                                                                                                                    Public social spending on families, percent of GDP
      0
                                                                                                                          1/ The child relative income poverty rate, defined as the percentage of children
              2000      2002         2004         2006          2008        2010          2012         2014                (0-17 year-olds) with an equivalized household disposable income (i.e. an income after
    1/ Child-related cash transfers to families with children, including child allowances; spending on services
                                                                                                                          taxes and transfers adjusted for household size) below the poverty threshold.
                                                                                                                          The poverty threshold is set here at 50% of the median disposable income in each country.
    for families (benefits in kind) with children; and financial support for families provided through the tax system.
                                                                                                                          Sources: OECD Social Expenditure (SOCX) and Income Distribution Databases.

    Adequacy of Minimum Income Benefits, 2018                                                                            Adequacy of Minimum Income Schemes
    (Percent of median disposable income)                                                                                (In percent)
                                                                                                                          100
      70
                                                                                                                                                         Single person                 Couple with two children                                                  Single parent with chidren
                     Single, no child          Couple, 2 children
      60                                                                                                                        80

      50                                                                                                                        60

      40                                                                                                                        40

      30                                                                                                                        20

      20
                                                                                                                                     0
                                                                                                                                                                                                                                                                                                                  Navarra
                                                                                                                                                                                                                                                                                                                            País Vasco
                                                                                                                                                   Andalucía

                                                                                                                                                                        Asturias

                                                                                                                                                                                                                     Castilla-La Mancha

                                                                                                                                                                                                                                                                                                Madrid
                                                                                                                                                                                                                                                                        Extremadura

                                                                                                                                                                                                                                                                                                                                                    Com. Valenciana
                                                                                                                                                               Aragón

                                                                                                                                                                                                                                                                                      Galicia
                                                                                                                                                                                                         Cantabria

                                                                                                                                                                                                                                          Castilla Y León

                                                                                                                                                                                                                                                                                                         Murcia

      10
                                                                                                                                                                                                                                                                                                                                         La Rioja
                                                                                                                                                                                                                                                            Cataluñia
                                                                                                                                                                                              Canarias
                                                                                                                                                                                   Baleares

          0
                                                         EU28
                 SVK

                                               SVN

                                                                                                          IRL
                           PRT

                                                                        LUX
                                     GRC

                                                                                                     DNK
                       LTU

                                          EST

                                                    ESP
              ITA

                                                                   AUT

                                                                             DEU
                                                              FRA

                                                                                  FIN
                                                                                      ISL
                                LVA

                                                                                           GBR
                                                                                                NLD

          Source: OECD.
                                                                                                                                               Source: AIReF's (2019a) elaboration based on the Minimum Income Schemes database.

5
 Supplements (defined as a percentage of that basic amount) are added for each additional household member.
In general terms, these supplements do not take into consideration the specific characteristics of each additional
household member (whether they are adults, minors, or disabled). In some regions, supplements are added
according to household needs.
10

Social assistance has not been fully                                      Figure 5. At Risk-of-Poverty Rate 1/
effective in alleviating poverty. As of 2017,                                    (Percent of population)
over one-quarter of the Spanish population
was still at risk of poverty or social exclusion                          36
                                                                          35
(Figure 5). 6 Spain has the highest child (0 to                           34
                                                                          33
17-year-olds) poverty rate in Western Europe,                             32
at 22.1 percent, ahead of Portugal, Italy, and                            31
                                                                          30
Greece. 7, 8 The majority of the less educated,                           29
                                                                          28
impoverished and unemployed are                                           27
                                                                                                 Spain                      EU-15
concentrated in southern Spain (IMF, 2018a).                              26
                                                                                2008   2009    2010   2011    2012   2013    2014   2015    2016   2017
                                                                          1/Persons at risk of poverty are those living in a household with an equivalised
Low adequacy and coverage appear to                                       disposable income below therisk-of-poverty threshold, which is set at 60 percent
                                                                          of the national median equivalised disposable income (after social transfers).
contribute to these subpar outcomes, not              EU-15: AUT, BEL, DEU, DNK, FRA, ESP, FIN, GBR, GRC, IRE, ITA, LUX, NLD, PRT, SWE.
                                                      Sources: Eurostat, and IMF staff calculations.
least due to a range of policy weaknesses
(Cantó and Ayala, 2014, EC, 2018d). The
adequacy of minimum income benefits, in particular, indicates shortfalls. It measures the
income of jobless relying on guaranteed minimum income benefits relative to the median
disposable income in the country. Housing supplements are included, subject to relevant
eligibility conditions. In Spain, single (no child) and couple (with two children) households
receive minimum assistance that bridges their income to only about 30 percent of the median
disposable income (Figure 4). Some other estimates put the b asic minimum income amounts
below 40 percent of the national median income, especially for families, with the exceptions
of a few autonomous communities (Figure 4). This situation implies that a gap remains
between the poverty line and the income levels guaranteed by the minimum income support
benefits. While the minimum income schemes target all households in poverty, the actual
coverage is much lower than the households in need (EC, 2018d). For example, as of 2014,
most of the communities covered only between 1 and 3 percent eligible households (EC,
2015a).

The weaknesses of support schemes in adequacy and coverage could be traced to
several reasons. The main issue seems differing levels of sensitivity of minimum income
scheme to the size and needs of the household, including different additional benefits for
situations of special need (single parenthood, children, disabilities or housing needs) across
most regional minimum income schemes. This mainly stems from gaps in coverage by
design, including weak benefits for children in need 9, or inadequate assessment of the
support needed to ensure that income is above 40–60 percent of the medium disposable

6
    The authorities estimate that the ratio drops to 21.6 percent as of 2017 when including social assistance.

7
  OECD utilizes a threshold of 50 percent of median income, while Eurostat utilized 60 percent which creates
discrepancies across countries.
8
  To address child poverty, the amounts of family benefits per child were increased in 2019 (from 341 per year
to 588 euros) for families in severe poverty.
9
  Some individuals and households are excluded from benefits because they fail to meet eligibility conditions,
even though they may be in need of support.
11

income. In some instances, households are reluctant to apply for support due to stigma or
complex rules (a lack of precision in the definition of the mechanisms and eligibility
requirements and complicated administration). Finally, there also could be difficulties with
the measurement of income data as it fails to reflect the true amount of resources that
households have available to spend (EC, 2013; EC 2015a; AIReF 2019; Funcas 2019). 10

                                           Box 2. Minimum Income Schemes
 The subsidio de desempleo is received by claimants based on the proportion of hours worked. The
 underlying requirement is to have some working history, and to be signed up as a job seeker, or working
 part time. For the latter requirement, there is also some flexibility as beneficiaries can receive the
 subsidio in the amount of support being reduced proportionally to the number of hours worked or stop
 receiving it till the job contract ends.
                                                                   Spain: Parameters of RMIs 1/
 Means-testing of these benefits also
                                            Autonomos Communities   Basic 2/                    Duration
 seem to account for the number of                                   euros                      months
 children in the household.                 Andalucía             419.5                                  6
                                                        Aragón                    491.0                                                  12
  The renta mínima de inserción (RMI) Asturias                           443.0                                                     no limit
 is specifically aimed at those with a     Baleares                      431.5                                      12/extention possible
 weak or non-existent employment           Canarias                      478.8                                                     max 24
 background, and who are also on low       Cantabria                     430.3
                                                                                             indefinite as long as conditions are fullfilled
 incomes, but there is a large
                                           Castilla-La Mancha            446.5                                                     24 max
 divergence in payouts by region.1         Castilla y León               430.3
 Access to RMI varies significantly on                                                       indefinite as long as conditions are fullfilled
 a regional level as Autonomous            Cataluña 2/                   604.0
 Communities are free to set their own                                                       indefinite as long as conditions are fullfilled
                                           Ceuta                         300.0                                                  12/60 max
 income thresholds, which has resulted
                                           Extremadura                   430.3                                                            12
 in large coverage discrepancies           Galicia                       403.8                                                            12
 (Cavanillas, 2015; EC, 2014; EC,          Madrid                        400.0
 2015a; EC, 2019; AIReF, 2019). The                                                          indefinite as long as conditions are fullfilled

 differences reflect in part varying       Melilla                       328                                                    12/24 max
                                           Murcia                        430.3                                                            12
 costs of living—which are higher in
                                           Navarra                       610.8                                      12, extention possible
 northern regions than in the southern     País Vasco                    693                                           24, with exceptions
 and central ones—and in part political La Rioja                         430.27                           duration depends on evaluation
 choices on the level of income support Comunidad Valenciana 2/ 257.8/515.1
                                                                                             indefinite as long as conditions are fullfilled
 (Table). The Autonomous
                                           1/ Schemes and names vary by region.
 Communities also operate a series of      2/ Includes several schemes/varies by individual or household.
 means-tested emergency schemes for        Source: Report on Minimum Income Schemes, 2018.
 people with urgent non-periodical
 economic needs (e.g. utility bills, mortgage or other type of loan payments, etc.) that cannot be covered
 by the Minimum Income scheme (e.g. due to insufficient time of residency in the Autonomous
 Communities).
 __________________
 1
   In order to establish a connection between RMIs and state unemployment benefits, the 2018 Budget Law
 established that common criteria for activation should apply to all non-contributory unemployment benefits and
 clarified that unemployment benefits can be topped up by minimum income schemes (EC, 2019).

10
   In addition to means-tested criteria, eligibility conditions for regional minimum income support include age
requirements, how long the household has been together, as well as conditions of residency and how long the
household has been registered in the municipality. In general terms, these conditions refer to the individual who
applies for the benefits, but in certain cases they extend to the household unit (EC 2015a).
12

                                   D. Redistribution Impact on Inequality

Inequality is Spain is higher than in EU peers. The less equal income distribution in Spain
is a longer-term phenomenon that was exacerbated during the global financial crisis due to the
large job losses (Figures 6 and 7). A job-rich recovery, catalyzed by the 2012 labor market
reforms, has reversed some of the negative social economic effects of the crisis, including
income distribution (see Stepanyan and Salas, forthcoming) but a significant gap remains
compared to other EU countries when measured in terms of the Gini coefficient. 11

There is less income redistribution in                        Figure 6. Disposable Income
Spain, including via social spending,                                       Gini Coefficient
against the EU average. The market Gini             36
                                                    35
coefficient is reduced by only 0.18 points          34
once social transfers, taxes, and pensions are      33
                                                    32
considered (which is the disposable income
                                                    31
                               12
Gini coefficient), (Figure 7). Taxes and            30

pensions rather than means-tested or non-           29
                                                    28
tested transfers (like in Ireland and the United    27                      Spain                     EU-15

Kingdom) are responsible for about                  26
                                                          2008 2009 2010 2011 2012 2013 2014 2015 2016 2017
60 percent of the that reduction. Middleclass      EU-15: AUT, BEL, DEU, DNK, FRA, ESP, FIN, GBR, GRC, IRE, ITA, LUX, NLD, PRT, SWE.
                                                   Sources: Eurostat, and IMF staff calculations.
households tend to gain in equal proportion or
more from redistribution than low income households (Oderkirk, 2017). 13 The reduction in
inequality can also be measured by examining the ratio of the amount of budget resources (as
approximated by the ratio of social protection spending-to-GDP) used to achieve one unit of
inequality reduction. The index (“Bang for the Buck”) shows that Spain is below the EU
average redistributive power of social spending by about 15 percent (Figure 7). After fiscal
redistribution, disposable income inequality remains high. 14

11
   The market income Gini index puts the index at one if there is maximum concentration of income; absolute
income equality implies an index of zero.
12
  It should be mentioned that not every social spending item has redistributive purposes. In particular, earnings-
related pensions have the aim to maintain the income of the beneficiary.
13
  This said, taxes and transfers were relatively effective at reducing market-driven inequalities in those
countries hard-hit by the crisis especially in the first phase of the crisis, that is, before the move towards fiscal
consolidation measures (OECDb, 2017).
14
  Calculated as the ratio of the Gini index reduction to the share of social protection expenditure in GDP, i.e.
the amount of income inequality reduction achieved by 1 percent of GDP of social spending. This “Bang for
Buck” concept is also used, for example in IMF (2016) for Ireland. See Herrmann et al. (2008) for assessing the
efficiency of state expenditures in reducing poverty rates in EU countries.
13

                                                                                        Figure 7. Indicators of Redistribution1
                                                                   Taxation and Spending
                                                                   Contributions to the Reduction in the Gini, 2018
                                                                          0.3                                          Pensions                                                 Non-means-tested social spending
                                                                                                                       Means-tested social spending                             Direct taxes
                                                                                                                       Social contributions                                     Average total impact
                                                                        0.25                                           Average from transfers                                   Average from taxes

                                                                                                                                                                                                       Average total impact = 0.207
                                                                          0.2
                                                                                                                                                                                                   Average from transfers= 0.164

                                                                        0.15

                                                                          0.1

                                                                        0.05
                                                                                                                                                                                                         Average from taxes= 0.050

                                                                            0

                                                                                                                                                                                                                    NLD
                                                                                                    GRC

                                                                                                                LUX

                                                                                                                                     PRT

                                                                                                                                                                               ESP

                                                                                                                                                                                                                           EST
                                                                                                                                  ROU

                                                                                                                                              ITA

                                                                                                                                                                                                                                     CYP
                                                                                          IRL

                                                                                                                                                                                                             MLT
                                                                                                                                                            HRV

                                                                                                                                                                                                   LTU
                                                                                                                                                                                            SLK
                                                                                      FIN

                                                                                                                     SLV

                                                                                                                                                CZE

                                                                                                                                                                                      POL
                                                                                                                                                     EU-28
                                                                                                                                          DNK

                                                                                                                                                                     GBR

                                                                                                                                                                                                                                           BUL
                                                                                  BEL

                                                                                               AUT

                                                                                                          DEU

                                                                                                                                                              HUN
                                                                                                                       FRA
                                                                                                                            SWE

                                                                                                                                                                                                                                                  LVA
                                                                       -0.05

                                                                                  Source: EuroMOD.

                     Market vs Disposable Income Gini Coefficient, 2018 /2                                                                          "Bang for the Buck" of Social Spending, 2016
                                 0.6                                                                                                    0.6         Gini coefficient reduction achieved by 1 percent of GDP of social spending
                                                                                                                                                      3.0
     Disposable Income Gini 1/

                                                                                                                        Low fiscal
                                 0.5                                                                             redistribution 3/      0.5           2.5

                                                                                                                                                      2.0
                                 0.4                                                                                                    0.4
                                                                                                                                                      1.5                                                                                                                      average impact = 1.29
                                                                                                          ESP
                                                                                                               ITA                                    1.0
                                 0.3                                                                                                    0.3
                                                                                                           FRA     IRL
                                                                                                            DEU
                                                                                NDL                 SWE                                               0.5
                                                                                                                      High fiscal
                                                                                                     BEL
                                                                                                                redistribution 3/
                                 0.2                                                                                                    0.2
                                                                                                                                                      0.0
                                       0.2                 0.3                  0.4                       0.5                     0.6
                                                                                                                                                                                                                   LUX

                                                                                                                                                                                                                                                             PRT

                                                                                                                                                                                                                                                                                                             NLD
                                                                                                                                                                                                                         EST

                                                                                                                                                                                                                                                                         GRC
                                                                                                                                                                   ROU

                                                                                                                                                                                                                                                                                     ESP

                                                                                                                                                                                                                                                                                                                   ITA
                                                                                                                                                                                                                                           CYP
                                                                                                                                                             IRL

                                                                                                                                                                               LTU
                                                                                                                                                                                     MLT

                                                                                                                                                                                                       HRV
                                                                                                                                                                         CZE

                                                                                                                                                                                                             SLV

                                                                                                                                                                                                                                                 SLK

                                                                                                                                                                                                                                                                                           POL

                                                                                                                                                                                                                                                                                                       FIN
                                                                                                                                                                                                                               GBR

                                                                                                                                                                                                                                                                               BUL

                                                                                                                                                                                                                                                                                                                         DNK
                                                                                                                                                                                           BEL

                                                                                                                                                                                                                                                                   AUT
                                                                                                                                                                                                 HUN

                                                                                                                                                                                                                                     DEU

                                                                                                                                                                                                                                                                                                                               FRA
                                                                                                                                                                                                                                                       LVA

                                                                                                                                                                                                                                                                                                 SWE
                                                                       Market Income Gini
              Source: EuroMOD.                                                                                                                               Sources: EuroMOD; and Eurostat.

        Risk of Poverty Rate after Social Transfers and Pensions,                                                                                   Change in Relative Poverty Rates via Taxes and Transfers
        2017                                                                                                                                        by Age Group, 2016
                                 50
                                                                                                                      BLG                           (Percentage point changes)
                                                                                                                                                     50
                                 45                                                                                                                                                                                                                     Age group 76+: Poverty rate
                                                                                LVA
                                                                 EST                                                                                                                                                                                    after taxes and transfers
Percentage of population 65+

                                 40                                                     LTU                                                          40
                                                                                                                                                                                                                                                        Age group 18-25: Poverty rate
                                 35                                                                                                                                                                                                                     after taxes and transfers
                                                                                HRV                                   ROU                            30                                                                                                 Age group 0-17: Poverty rate
                                 30                                                                                                                                                                                                                     after taxes and transfers
                                 25                          MLT                                                                                     20
                                                                                  CYP
                                                                                                    ITA
                                 20                                  PRT                                                   GRC
                                                         SVNDEUPOL GBR                HUN                                                            10
                                 15                        SWE BEL IRL                        ESP
                                                       FIN   AUT
                                                         SVK
                                                           NLDDNK  LUX                                                                                0
                                 10
                                                              FRA
                                  5                                                                                                                  -10
                                       10         15             20          25               30                35           40
                                                                                                                                                                         CZE

                                                                                                                                                                                                                                                               POL

                                                                                                                                                                                                                                                                                SVK
                                                                                                                                                                                                                                                                                       SVN
                                                                                                                                                                                                        GRC

                                                                                                                                                                                                                                                                         PRT
                                                                                                                                                                  BEL

                                                                                                                                                                                EST

                                                                                                                                                                                                                                       LTU

                                                                                                                                                                                                                                                                                                 ESP
                                                                                                                                                             AUT

                                                                                                                                                                                                                         ITA

                                                                                                                                                                                                                                                        NOR
                                                                                                                                                                                       FIN
                                                                                                                                                                                                 FRA

                                                                                                                                                                                                               ISR

                                                                                                                                                                                                                                                                                                       SWE
                                                                                                                                                                                                                                LVA

                                                                                                                                                                                                                                                 NLD

                                                                                                                                                                                                                                                                                                              GBR
                                                                                                                                                                                                                                                                                                                     CRI

                                                            Percentage of population under 65
                                       Source: Eurostat.                                                                                                     Sources: OECD.

            1 Redistribution is measured by the difference between the Gini coefficient before personal income taxes and
            transfers (market incomes) and the Gini coefficient after taxes and transfers (disposable incomes) in percent of
            the Gini coefficient before taxes and transfers. Gini coefficient of zero expresses perfect equality. Calculated by
            Eurostat using EUROMOD.
            2 Disposableincome is the total income of a household, after tax and other deductions, that is available for
            spending or saving (Eurostat).
            3 Low (high) fiscal redistribution refers to the difference between market and disposable income Gini being less
            (greater) than 0.2.
14
While the redistributive outcomes for the elderly are better, they create intergenerational
issues. As market inequality is stronger among the seniors, this implies that fiscal redistribution
focuses on the elderly (Figures 8). This is mainly achieved through public pension spending,
which has a larger redistributive impact than non-pension transfers, and also helped the elderly
weather the crisis better. The young cohort, on the other hand, is left particularly disadvantaged.
As of August 2019, while continuing to improve, 32.2 percent of Spain’s youth labor force
(16–24 years) was still unemployed, comparing to a 15.4 percent in the Euro Area. While they
are eligible for unemployment benefits or minimal social assistance, the system has not been
sufficient to prevent wide-spread youth poverty (see section IV).

                                                           Figure 8. Intergenerational Inequity 1/
Spain: Impact of Fiscal Redistribution on Income                                                                                Spain: At-Risk-of-Poverty Rate 1/
Inequality by Age Group, 2016                                                                                    35
                                                                                                                   (Percent of total)
                                                                                                                                                                                                                                35
     0.8
                                                                                                                                                       18-24 yrs.         25-54 yrs.              55-64 yrs.       65+ yrs.
     0.7                                                                  All population                         30                                                                                                             30
     0.6                                                                  18-65
                                                                                                                 25                                                                                                             25
     0.5
                                                                          65+
     0.4                                                                                                         20                                                                                                             20

     0.3
                                                                                                                 15                                                                                                             15
     0.2

     0.1                                                                                                         10                                                                                                             10
                                                                                                                                              2008

                                                                                                                                                         2009

                                                                                                                                                                2010

                                                                                                                                                                         2011

                                                                                                                                                                                2012

                                                                                                                                                                                           2013

                                                                                                                                                                                                   2014

                                                                                                                                                                                                           2015

                                                                                                                                                                                                                  2016

                                                                                                                                                                                                                         2017
      0
            Gini before taxes and transfers              Gini after taxes and transfers             Source: Eurostat.
                                                                                                    1/ Persons at risk of poverty are those living in a household with an equivalised disposable income below the
                                                                                                    risk-of-poverty threshold, which is set at 60 percent of the national median equivalised disposable income
           Source: OECD.
                                                                                                    (after social transfers).

Low means-testing of some benefits seems to contribute to high poverty-at-risk (EC, 2014;
OECD 2017b; EC, 2019). 15 The share of cash family benefits going to the bottom 40 percent of
the working age population in Spain is quite low at just over 30 percent, which is significantly
below the EU average. It implies that more well-off households receive a substantial portion of
the benefits. The gap in targeting reflects the limited use of means-testing of family benefits, in
combination with shortcomings in adequacy and coverage (Figure 9).

                                                       Figure 9. Means-Testing of Social Assistance
                                                                                            Means-Tested Family and Cash Benefits to the Neediest, 2015
     Social Assistance, 2016
     (means-tested spending percent of total assistance)                                    or latest available
                                                                                                                                              80
 120
                                   Non-means tested      Means-tested                                                                                                                      GRC
                                                                                                                                                                                                  GBR
                                                                                                Share of cash family benefits to the bottom

                                                                                                                                              70
 100
                                                                                                   40 percent (working age population)

                                                                                                                                                                                                  PRT
     80                                                                                                                                       60                            NLD
                                                                                                                                                                              IRL                         ITA
                                                                                                                                                   SVK                    FRA
                                                                                                                                                 LUX
                                                                                                                                                                                         SVN
     60                                                                                                                                       50 FIN CZE
                                                                                                                                                  HUN
                                                                                                                                                                                POL
                                                                                                                                                     SWE
                                                                                                                                                        AUT
     40                                                                                                                                       40
                                                                                                                                                 DNK
                                                                                                                                                    BEL

                                                                                                                                                           ESP
     20                                                                                                                                       30
                                                                                                                                                   EST
                                                                                                                                                   LVA

      0                                                                                                                                       20
                                                                        Exlusion
                    Family, kids

                                                                                                                                                   0       10       20    30        40     50       60     70     80
                                             Housing

                                                                                                                                                       Share of means-tested benefits among cash family benefits,
                                                                                                                                                                               percent

                                                                                            Sources: OECS Social Expendityre (SOCX) and Income Distribution Databases.
     Sources: Spanish authorities.

15
  Means-tested social benefits refer to benefits where entitlement is explicitly or implicitly conditional on the
beneficiary's income/wealth.
15

                    IV. EFFICIENCY OF SPENDING ON HEALTH, EDUCATION AND
                               ACTIVE LABOR MARKET POLICIES

                                                A. Healthcare

The National Healthcare System in general is equitable and delivers favorable health
outcomes. It is highly equitable, as recognized by WHO, in particular for its primary health
care network, distributed throughout the territory with easy and universal access, including
for obtaining high-cost services. The Spanish health system is generally comparable to most
advanced economies providing universal coverage in the following dimensions: population
coverage, access equity, technical quality, and economic efficiency (Avanzas et al., 2017;
Spain’s Health Barometer, 2019). 16,17 Spain has a high accessibility of primary care as well
as high levels of continuity and coordination (EC, 2016).

The healthcare spending is broadly sustainable and spending efficiency is considered to
be quite high (Afonso and Kazemi, 2016; IMF, 2016; EC, 2016, 2018). Spain leads Europe
in health adjusted life expectancy indicators (74 years) and spends less than its peers
(Figure 10). Healthcare spending, which is mostly public and managed at a regional level,
represents about 6 percent of GDP, which is below the average of about 8 percent in 2017.
According to the European Commission’s 2018 Aging Report, health care spending is
expected to face some spending pressure projected at around 0.5 percent of GDP increase by
2070, but this would keep Spain’s health care spending still significantly below the EU
average. Spain spends a higher share on outpatient than inpatient services than its several
European peers, which is often considered to contribute to cost effectiveness and better
health outcomes (EC, 2016). Measures taken since 2010 with the objective to reduce costs
and raise efficiency are described in Box 3.

Challenges for the healthcare system derive primarily from remaining regional
disparities and new issues arising in the provision of health services. Spain performs
better than the EU28 in providing access to healthcare services. Nevertheless, shortages of
nurses and general physicians in primary care and long-term care services, especially in some
regions, are increasing and further pressures are expected, as almost one third of the doctors
are to retire within the next 10 to 15 years (EC, 2019). Growing long-standing disability and
chronic conditions because of rapid population ageing also challenge current healthcare
delivery (EC, 2016). 18 Waiting times for surgery, diagnostic procedures and specialized visits
remain high, while access to dental care depends in part on families’ welfare (Bernal-
Delgado et al., 2018). Public spending on hospitals represents an increasing share of total
public spending at the expense of primary care (OECD, 2018a; EC, 2018). The lack of
cohesion in electronic systems limits the use of e-health solutions, as well as the coordination
and continuity of care, and this greatly varies by region (Causa and Hermansen, 2017). The
AIReF review of spending on prescription drugs concluded that there was much room to

16
  In July 2018, a Royal Decree-Law was adopted extending health care coverage to undocumented and illegal
immigrants.
17
     Almost 70 percent of surveyed believe that the system is adequate but necessitates some changes.
18
     For Spain, more than a doubling of the number of long-term care recipients is projected.
16

improve governance, procedural aspects related to pricing of medicines, efficiency and
equity. In terms of the equity of the system, it was observed that the current medicines co-
payment model penalizes active low-income workers, in comparison to pensioners with
similar incomes and is unequal in its treatment of particularly vulnerable people, such as
recipients of minimum income benefits. AIReF’s proposals could generate significant
savings and efficiency improvements for the system. 19

                         Box 3. Recent Measures in the Healthcare Sector
 The reform agenda in the National Health System in recent years has been strongly influenced by the
 general fiscal constraints that arose during the crisis. Actions since 2010 were targeted at tackling the
 governance of the system, the breadth of coverage (regulating entitlement conditions), the depth of
 coverage (categorizing the benefits package), cost-sharing (reformulating the financial participation of
 patients), drug pricing procedures and the reduction of production costs (for example, decreasing health
 workforce salaries or prices, reductions in health workforce numbers, centralizing purchasing).
 In particular, a Royal Decree Law 20/2012 introduced a series of measures targeting the long-term care
 system; and a Royal Decree-Law 16/2012, introduced “urgent measures to guarantee the sustainability
 of the National Health System and improve the quality and security of its benefits”. Among others,
 these measures included an income-based co-payment for pensioners. The new coalition government
 intends to repeal the Royal Decree-Law 16/2012, especially the provision related to co-payments by
 vulnerable groups. The implementation of the measures led to the estimated reduction in spending of
 11 billion euros over 2012–16 (or about 15 percent of total health spending in 2016), half of which
 corresponded to excluded pharmaceutical products (2017-2020 Stability Program Update; Figure 3).1
 Another measure that reduced costs has been the implementation of the Centralized Purchase Platform
 in 2012.
 With the objective of achieving greater effectiveness and efficiency, over the years, steps have been
 taken both in the training of healthcare professionals and in the management of the human resources
 needs in the health sector in the medium and long term, such as the employment stability in the sector.
 There are ongoing efforts to consolidate the monitoring process of expenditure on healthcare and
 pharmaceutical products.2 It is expected that the data exchange between the Ministry of Finance and
 Civil Service and Ministry of Health databases will facilitate better analysis and improve efficiency,
 together with the active participation of the regional governments. In its 2018 review of prescription
 medicines, the AIReF estimated that savings could be achieved through the revision of the structure of
 the Inter-Ministerial Commission for Medicine Prices and a centralized purchase criterion that would
 allow the public sector to benefit from the discounts currently available to pharmacies. On the demand
 side, it recommended to follow the best prescription practices found in stewardship and control
 protocols to maximize savings across the regional governments.
 ________________________________________________
 1
   The government signed agreements with Farmaindustria to limit the growth of pharmaceutical expenditure, which
 was extended in 2019 (2019–22 Stability Report).
 2
  The 2019 AIReF review concentrated on hospital-related expenditure, in particular pharmaceuticals, within the
 national health system.
 Sources: Bernal-Delgado et al. (2018); EC 2017; 2019–2022 Stability Program Update, Coalition agreement
 (2020).

19
  When the impact of each proposal is evaluated in isolation, the total estimated savings sum up to 1.9 billion
euros by 2022. But as some of the proposals would reduce the same aspects of inefficiency; their joint
application would result in more modest savings.
17

                                                       Figure 10. Selected Indicators in the Healthcare Sector
                      Health Expenditure, 2017                                                                                           Current Expenditure on Healthcare, 2016
                  9
                      (Percent of GDP)                                                                                                   (Share ot total spent per inhabitant)
                                                                                                                                           50
                                                        DNK                                                                                                                 France         Germany          Belgium           Norway         Spain
                  8                                FRA
                                                       AUT                                                                                 45
                                                     BEL NLD                                                                               40
                                             CZE   GBR      ISL
                  7                        SVK     FIN DEU                                                                                 35
                                               ITA        SWE
                                            SVN                                                                                            30
     Percent of GDP

                                HRV
                  6                    PRT ESP                                                                                             25
                                        LTU
                                              MLT                                                                                          20
                                  GRC                                               IRL
                  5           BGR    EST
                                    HUN                                                                 LUX                                15
                                ROU
                                   POL                                                                                                     10
                  4                                                                                                                         5
                                     LVA                                                                                                    0
                  3
                                                                                                                                                                      In-patient Services of Out-patient          Medical Prevention Health
                                                 CYP
                                                                                                                                                                         care     day care      care               goods     and public admin. and
                  2
                                                                                                                                                                                                                 despenced     health     health
                       15       25          35           45         55         65         75    85     95
                                                                                                                                                                                                                     to       services insurance
                      Source: Eurostat.            GDP per capita (thousands of USD)
                                                                                                                                                                                                                 outpatients

                                                                                                                                                             Sources: Eurostat; and IMF staff calculations.

     Life Expectancy at Age 65
     (Years)                                                                                                        Health-Adjusted Life Expectancy and Public Health Spending,
26                                                                                                      26          2016 1/
                             2050                      2015                                                                                                       9
                                                                                                                                                                                                                               DNK

                                                                                                                  Public spending on health (in percent of GDP)
                                                                                                                                                                                                                                  AUT
24                                                                                                      24                                                        8                                                     BEL  GBR
                                                                                                                                                                                                                                         FRA
                                                                                                                                                                                                   SVK     CZE                 NLD    ISL
                                                                                                                                                                  7                                                        FIN         ITA
                                                                                                                                                                                                                     SVN DEU     SWE
                                                                                                                                                                                                         HRV
22                                                                                                      22                                                        6            LTU                                            PRT           ESP
                                                                                                                                                                                                                                MLT
                                                                                                                                                                  5              BGR           EST                             IRL
                                                                                                                                                                                       HUN       POL                       GRC     LUX
20                                                                                                      20                                                        4                  ROU
                                                                                                                                                                               LVA
                                                                                                                                                                  3
                                                                                                                                                                                                                                             CYP
18                                                                                                      18                                                        2
                                                                                                                                                                  1
16                                                                                                      16                                                           65            67             69             71            73           75
                                                                                                                                                                                                     HALE, years
                                                                                                                                                                  1/ Health-Adjusted Life Expectancy at birth is the average number of years a
14                                                                                                      14                                                        person can expect to live in good health or free of disease and injury.
                                                                                                                                                                  Sources: Eurostat; and WHO.
     HUN

       CZE
      POL
     EU28
      SVK

      SVN

        IRL
     DNK

       PRT
      LUX
       LTU

      MLT

      GRC
       EST

       BEL

       ESP
      DEU

      AUT

        ITA
       FIN

      FRA
      SWE
      BGR

      LVA

      GBR
      NLD
      HRV
     ROU

 Sources: UN Population Projections (2015) and IMF staff calculations.

     Waiting Times for Specialist Treatments, 2017                                                                                          Expenditure on Pharmaceuticals, 2015 or nearest year
                                                                                                                                            (USD PPP per capita)
     (Percent of patients waiting for more than 3 months)                                                                                   900
                                                                                                                                                                                                                         Prescribed medicines
                                                                                                                                            800
     80
                                                                                                                                            700                                                                          Over-the-counter
                                                                                                                                            600                                                                          medicines
     60                                                                                                                                                                                                                  Total (no breakdown)
                                                                                                                                            500

                                                                                                                                            400
     40
                                                                                                                                            300

                                                                                                                                            200
     20                                                                                                                                     100

                                                                                                                                                                  0
                                                                                                                                                                                                     HUN

                                                                                                                                                                                                                                       CZE

                                                                                                                                                                                                                                              POL
                                                                                                                                                                                                                      SVN
                                                                                                                                                                         IRL

                                                                                                                                                                                             GRC

                                                                                                                                                                                                         LUX

                                                                                                                                                                                                                                 PRT

                                                                                                                                                                                                                                                     DNK
                                                                                                                                                                            BEL

                                                                                                                                                                                               ESP

                                                                                                                                                                                                                                                   EST
                                                                                                                                                                      DEU

                                                                                                                                                                                     AUT
                                                                                                                                                                                        ITA
                                                                                                                                                                                FRA

                                                                                                                                                                                                                  FIN

                                                                                                                                                                                                                         SWE
                                                                                                                                                                                                               GBR

                                                                                                                                                                                                                                         LVA
                                                                                                                                                                                                                              NLD

        0
                       EST     POL         FIN     PRT        ESP        GBR   DNK        ITA   SWE   HUN                                                             Source: OECD.

      Source: OECD.
18

                                           B. Education and Training

Education and training are arguably the most important factors to ensure equality of
opportunities as they deliver clear returns in terms of income. For individuals, education
promotes employment, earnings, health, and poverty reduction, while for the society as
whole it drives long-term economic growth, spurs innovation, strengthens institutions, and
fosters social cohesion (World Bank, 2018). Debates on education commonly focus on the
need for more spending, but, as in other areas of social spending, efficiency and targeting
(in case of active labor market policies) are an important part to achieving better outcomes.

Education spending in Spain is relatively low. Total public expenditure on education is
less than the EU average, and it declined from 4.4 to 3.9 percent of GDP over 2011–2017,
against the EU’s 4.6 percent (despite a broadly stable share of spending for those below
25 years of age). 20 Cumulative public spending per student as of 2015 was below most of the
advanced EU economies. According to the 2018 Aging Report, education spending is
projected to rise by 0.4 percent of GDP by 2050 and then decline by 0.2 percentage points to
3.9 percent by 2070.

Education outcomes have generally                       Figure 11. Income Mobility across
lagged EU peers. While after years of                               Generations, 2018 1/
underperformance PISA scores improved             7

in 2015, reaching OECD averages in all            6

three core areas, they fell or stagnated in       5

2018 testing, especially in sciences              4

(Figure 12). 21 Barriers to intergenerational     3
mobility are high (Figure 11). There has          2
been no upward intergenerational mobility         1
in educational attainment for 55 percent of
                                                  0
the children of low educated parents who              DNM FIN SWE BEL ESP GRC NLD IRL PRT GBR ITA FRA DEU

also have not attained an upper secondary           1/ Number of generations it would take for those born in low-income families
education (OECD, 2018d and 2018e). This             to approach the mean income in their society.
                                                    Source: OECD.
is also reflected in the large percentage of
young adults without an upper secondary education. This accounts for 34 percent in Spain
compared to 15 percent on average across OECD countries, in spite of a significant increase
by 25 percentage points in upper secondary first-time graduation rate between 2005 and
2016. Despite significant improvements over the past years, the early school leaving rate
remains among the highest in the OECD, at 18.3 percent in 2017. New tertiary graduates still
face challenges finding suitable work. The gap between the unemployment rate of those with
tertiary education (where attainment targets are being met) and less than upper secondary
education, at around 14 percent, is higher than the EU average of 10 percent (OECD, 2018a).
The share of young people neither in employment nor in education or training (NEET) was at

20
  In 2012, the central government also approved the Decree-law 14/2012 on urgent measures to rationalize
education spending.
21
   See Afonso, A. and M. Kazemi, 2016; IMF, 2015/2016 for Data Envelopment Analysis for benchmarking
education outcomes.
19

around 15 percent in 2017 (Figure 12). Participation rates in education and training are low,
also resulting in subpar basic and advanced digital skills levels. Regional disparities in
educational outcomes persist, for instance, in PISA scores, early school leaving rates, grade
repetition, and performance (EC, 2018d and 2019). One positive indicator is Spain’s very
high early childhood education enrolment rate: 96 percent of children aged 3 to 6 years were
in education in 2015 compared to 76 percent on average across OECD countries (OECD,
2018c).

The expenditure on active labor market policies in Spain is also relatively low and not
particularly effective (Figure 12). In Spain, the active labor market policies (ALMPs)
include programs for labor integration, training, job rotation and job sharing, employment
incentives, supported employment and rehabilitation, direct job creation and start-up
incentives. In terms of participation, the main component of ALMPs are training programs
(ILO, 2015). The evidence so far indicates that spending on ALMP measures and labor
market services is low relative to the number of unemployed persons and is diversified across
a large number of programs. In general, the programs are not considered to be effective in
matching cohorts with necessary skills, especially the long-term unemployed, low-skilled and
youth, and are not well coordinated or designed to foster employability, although there are
some few positive experiences (ILO, 2015; IMF, 2017b and 2018b; EC, 2019). Moreover,
ALMPs have limited participation rates, the Public Employment Services face capacity
constraints to offer individualized support, several policies are not appropriately targeted, and
evaluation mechanisms are uncommon.

Education reforms, which have been piecemeal, have been paused altogether since 2016.
While a state ministry carries an overall mandate, the 17 Autonomous Communities make
most of the decisions regarding their own education systems, making coordination
challenging. Political disagreements, including on the level of spending, stalled the
negotiations on a needed broad-ranging education reform. Some recent initiatives do seek to
improve the matching between initial vocational education and training and labor market
needs through a higher involvement of the business sector and a review of the qualifications
framework (OECD, 2018c). The government also approved measures in coordination with
the regions, social partners and other stakeholders to further develop and upgrade the dual
vocational education and training system, promote work-based learning and raise the
attractiveness of the system. One important issue that is yet to be addressed is improving the
quality of teaching (OECD, 2014). 22, 23

22
  The 2013 Organic Law on the Improvement of the Quality of Education (LOMCE) did not address the issue
of teachers' quality. According to OECD (2014), 36 percent of teachers never received formal appraisal.
23
  Teachers in Spain are paid at or slightly above the OECD average depending on the years of experience
(2017). The average class size is slightly below the OECD average (2016).
20

                 Figure 12. Selected Education and Active Labor Market Policy Indicators

   Public Education Spending, 2017                                                                         Annual Spending on Primary and Secondary Education per
   (Percent of GDP)                                                                                        Student (2016 or latest year) and Average PISA scores (2018)
  8                                                                                                        (Spending in PPP US dollars) /1
                                                                                                            550
                                                     ISL
  7
                                                 SWE                                                                                          SVK
                                                                                                                                                      LVA
                                                 DNK
                                               BEL                                                                                            USA LUX
  6                          LVA EST                                                                        500                                   CZE                    ISL
                               CYP FIN                                                                                                     GRC NOR     SWE
                        HUN SVN FRA                                                                                                            FIN POL
                   PRT                  NLD                                                                                           PRT                                                              AUS
  5                         LTU MLT                                                                                                                                NZL
                 POL     HRV CZE GBRAUT
                                                                                                                                                     IRL
                                                                                     LUX                                               ​
                                                                                                            450                          ESP
  4                     GRC    ESP     DEU
                               ITA                                                                                                           HUN
                       BGR SVK
                                                                    IRL
  3                                                                                                                                 GBR
                              ROU
                                                                                                            400
  2                                                                                                                  0                50000               100000            150000           200000            250000
       0                20                40               60               80                100                    1/ Cumulative expenditure on private and private educational institutions per
                              GDP per capita (thousands of USD)                                                      full-time student between age 6 and 15).
      Source: Eurostat.                                                                                              Source: OECD.

NEET Rates, 2017
                                                                                                           Participation Rate in Education and Training, 2018 1/
                                                                                                           (Percent, 25-64 years)
(Percent of total 15-24 population neither in employment, nor in education
or training)                                                                                                 35
 25
               Inactive                                                                                      30

 20            Unemployed                                                                                    25

                                                                                                             20
 15
                                                                                                             15
 10
                                                                                                             10

   5                                                                                                             5

                                                                                                                 0
   0
                                                                                                                      EU28

                                                                                                                        CZE

                                                                                                                      HUN
                                                                                                                       POL
                                                                                                                       SVN

                                                                                                                       SVK
                                                                                                                      DNK

                                                                                                                       LUX

                                                                                                                        PRT
                                                                                                                       MLT
                                                                                                                        ESP

                                                                                                                        BEL

                                                                                                                        LTU
                                                                                                                       AUT

                                                                                                                       DEU
                                                                                                                         ITA
                                                                                                                        FIN

                                                                                                                       FRA
                                                                                                                       SWE

                                                                                                                          ISL

                                                                                                                       CYP

                                                                                                                       SRB
                                                                                                                       LVA
                                                                                                                       NLD

                                                                                                                       BGR
                                                                                                                       HRV

                                                                                                                      ROU
        CZE

        POL

       HUN
       SVN

        SVK
         IRL
        LUX

       DNK

        PRT

       GRC
        BEL
        LTU
        EST

        ESP
       DEU

       AUT

         ITA
          ISL

         FIN

        FRA
       SWE
       NLD

       GBR

        LVA

                                                                                                                      1/ Projection.
        Source: OECD.                                                                                                 Sources: Eurostat.

Active Labor Market Policies: Expenditure on Training, 2016                                                Expenditure on Labor Market Policies and Unemployment Rate, 2015 1/
(PPS per person wanting to work)                                                                           (Percent of GDP)
                                                                                                           4.0                                                                 30
2000                                                                                                                              Labor market services                     Active measures
                                                                                                           3.5                    Passive measures                          Unemployment rate (Percent, RHS)
1800                                                                                                                                                                                                               25
                                                                                                           3.0
1600                                                                                                                                                                                                               20
                                                                                                           2.5
1400
                                                                                                           2.0                                                                                                     15
1200
                                                                                                           1.5
1000                                                                                                                                                                                                               10
                                                                                                           1.0
800                                                                                                                                                                                                                5
                                                                                                           0.5
600
                                                                                                           0.0                                                                                                     0
400
                                                                                                                                                             IRL 2/
                                                                                                                                           SVK

                                                                                                                                                                   SVN
                                                                                                                                   PRT

                                                                                                                                                                                  LUX
                                                                                                                                                                                      DNK
                                                                                                                     GRC
                                                                                                                         ESP 2/

                                                                                                                                                                      BEL
                                                                                                                                       ITA

                                                                                                                                                                                                   MLT 2/
                                                                                                                                                                                          EST 2/
                                                                                                                                                                                               AUT

                                                                                                                                                                                                        DEU
                                                                                                                                               FRA

                                                                                                                                                                                                             NOR
                                                                                                                              CYP

                                                                                                                                                          FIN

                                                                                                                                                                         SWE
                                                                                                                                                   LVA

                                                                                                                                                                               NLD

200
                                                                                                            Sources: Eurostat and IMF staff calculations.
   0
                                                                                                            1/ Labor market services refer to LMP category 1, active measures to categories
               IRL 1/

                                                                                           SVN
                                                                                                SVK
                             LUX
                                DNK

                                                       PRT

                                                                          ESP 1/
                                               BEL

                                                                     EST
        AUT

                                    DEU

                                                           ITA 1/
                    FRA 1/

                                       NOR
           FIN

                                                                                   CYP
                                                 SWE

                                                                               LVA

                                                                                     GRC 1/
                                                                NLD

                                                                                                            2-7 and passive measures to categories 8-9 (Out-of-work income maintenance
                                                                                                            and support, early retirement).
Source: Eurostat.                                                                                           2/ 2014 value is used.
1/ 2015 value is used.
You can also read