Eurobodalla Shire Housing Needs Study - EUROBODALLA HOUSING NEEDS, SUPPLY AND MARKET ISSUES PAPER Final Paper
←
→
Page content transcription
If your browser does not render page correctly, please read the page content below
Eurobodalla Shire Housing Needs Study

EUROBODALLA HOUSING NEEDS, SUPPLY AND
MARKET ISSUES PAPER

Final Paper

Prepared by Kim Houghton and George Porter

For

Eurobodalla Shire Council

30 April2014

Housing Issues Paper, 30 April 2014
CONTENTS

Introduction

1.      The area and its population ............................................................................................................ 1
     Recent population trends ................................................................................................................... 1
     Age structure....................................................................................................................................... 2
     Households ......................................................................................................................................... 2
     Source: ABS Census 2011 .................................................................................................................... 3
     Migration trends ................................................................................................................................. 3
     Incomes ............................................................................................................................................... 4
     Key conclusions ................................................................................................................................... 6
2.      The current housing market and dwelling stock............................................................................. 7
     Housing profile .................................................................................................................................... 7
     Purpose-built housing for older people .............................................................................................. 9
     Vacant dwellings ............................................................................................................................... 10
     House prices ...................................................................................................................................... 11
     Housing market segments ................................................................................................................ 15
     Key conclusions ................................................................................................................................. 16
3.      Recent housing market trends ...................................................................................................... 17
     Residential Construction ................................................................................................................... 17
     Dwelling types ................................................................................................................................... 19
     Price Trends ...................................................................................................................................... 19
     House purchase affordability ............................................................................................................ 20
     Rental affordability ........................................................................................................................... 26
     Key conclusions ................................................................................................................................. 27
4.      Population projections .................................................................................................................. 28
     Projected population growth ............................................................................................................ 28
     Factors affecting population growth ................................................................................................ 29
     Age structure of the future population ............................................................................................ 30
     Household types ............................................................................................................................... 32
     Demand for dwellings ....................................................................................................................... 32
     Key conclusions ................................................................................................................................. 33
5.      Parameters and Drivers of Change ............................................................................................... 34
     The Policy context ............................................................................................................................. 34
     Local planning and land supply ......................................................................................................... 36
     The economic and employment context .......................................................................................... 39
     Drivers within the housing market ................................................................................................... 40

Housing Issues Paper, 30 April 2014
6. Key issues ...................................................................................................................................... 45
Market sectors and their needs ........................................................................................................ 45
Potential gaps in future dwelling supply........................................................................................... 46
Land supply and associated zoning controls..................................................................................... 46
Economics of development .............................................................................................................. 47
Local development/ construction industry ....................................................................................... 47
Impact of the wider economy ........................................................................................................... 47
Housing Issues Paper, 30 April 2014Housing Issues Paper, 30 April 2014
1. The area and its population

Recent population trends
The estimated resident population of Eurobodalla Shire, according to the ABS, was 37,048 at June
2012. This represents a population decline of 38 people over the previous 12 months, the first time
the Shire’s population has declined in recent times.

As the table shows, there has been a slowing rate of population growth since 2001, despite a slight
revival in 2010.

Table 1: Change in resident population, year on year, Eurobodalla

Year (ending June 30)                             Change in                 Change in
                                                  number                    percent
2002                                              +600                      +1.8
2003                                              +616                      +1.8
2004                                              +471                      +1.4
2005                                              +336                      +1.0
2006                                              +193                      +0.5
2007                                              +248                      +0.7
2008                                              +198                      +0.5
2009                                              +161                      +0.4
2010                                              +345                      +0.9
2011                                              +275                      +0.7
2012                                              -34                       -0.1
Source: Based on ABS data, presented in Profile.id by .id, the population

Between the 2006 and 2011 Census this ‘usual resident’ population grew by a net 816. But there
was a lot of churn in the population, with some 6,000 people moving into the Shire in that period,
and 5,000 moving out. The newcomers are described further below.

Temporary residents
Temporary residents are non-resident ratepayers and other visitors. Eurobodalla had 31% of its
homes unoccupied on Census night 2011 – one of the highest percentages in areas researched by
the National Sea Change Task Force in its 2013 report1.

A typical daily average of 7,175 people are in Eurobodalla on any given day who do not describe
themselves as ‘usual residents’ of the Shire. And in addition, it was estimated that another 4,121 are
in full-time tourist accommodation on any given day. These averages add another 13,000 people to
the Shire’s resident population.

1
 Time and tide: moving towards an understanding of temporal population changes in coastal Australia;
National Sea Change Task Force, April 2013

Housing Issues Paper, 30 April 2014                                                                    1
Age structure
Eurobodalla’s population is significantly older than that in most other parts of NSW, with the
exception of certain coastal areas such as Lake Macquarie. In 2011, 25.9% of residents were aged 65
and over, representing growth in this age group of nearly 2 percentage points since 2006. As the
charts shows, the Shire has a larger proportion of residents in the 50 and upwards age groups than
the average for Regional NSW, and a lower proportion in all the younger age groups.
Figure 1: Service age groups 2011
25.0
Eurobodalla
20.0 Regional NSW %
15.0
Percent
10.0
5.0
0.0
0 to 4 5 to 11 12 to 18 to 25 to 35 to 50 to 60 to 70 to 85 +
17 24 34 49 59 69 84
Source: Based on ABS data, presented in Profile.id by .id, the population experts
Households
In the 2011 census there were approximately 15,000 households in the Eurobodalla Shire of which
9,846 were occupied by families and, 4,973 by either single persons, group or visitor only
households.
Figure 2: Household Structure
2%
couple family, no children
couple family, with children
29% 36%
one parent family
other family
1% 11% lone person households
21% group households
Housing Issues Paper, 30 April 2014 2Source: ABS Census 2011 The most notable aspect of the household structure is that it is dominated by one and two person households, who make up well over half of all households. This is in large part a result of the large number of older households, almost all of which comprise one or two people. Migration trends In the 5 years to 2011 while the total population of Eurobodalla Shire rose by only 816 people, almost 6,000 people moved into the Shire. The great majority came from elsewhere in NSW (especially Sydney) and the ACT. More details on where they came from are shown below. Table 2 Migration between Eurobodalla Shire and other States/Territories State / Territory In migration Out migration Net migration New South Wales 3,505 2,899 606 Sydney 1,237 700 537 Victoria 481 463 18 Queensland 416 651 -235 South Australia 92 74 18 Western Australia 129 97 32 Tasmania 91 76 15 Northern Territory 57 51 6 Australian Capital Territory 1,218 859 359 Total 5,989 5,170 % of resident population 17% 15% Source: ABS. Compiled and presented in profile.id by .id, the population experts. Almost matching this in-migration, some 5,170 people (15% of the population) left the Shire to live elsewhere. These people mostly went to NSW (Sydney, Capital Region), the ACT and Queensland. In net terms, there was a sizeable net loss of 18-24 year olds, and a net gain of pre-retirees (55-64 year old). However, as analysis later in this report shows (see Figure 33), there is substantial outward migration of older seniors (aged 70 or more). Figure 3 Net migration by age group Source: ABS, compiled and presented in Profile.id by .id, the population experts Housing Issues Paper, 30 April 2014 3
Incomes
Most households in Eurobodalla had incomes between $300 and $1000 per week in 2011, although
7% had an income below $300 and 32% had an income of $1000 or more per week. On average,
households in the Shire have lower incomes than those found across Regional NSW - the proportion
of very low income households is higher and the proportion of high income households is much
lower than most other Regional LGAs. Incomes are significantly lower incomes than those across
NSW as a whole.
At the time of the Census in 2011, the median weekly household income for Eurobodalla was $784.
This is considerably less than the average for Regional NSW which was $961.

Figure 4: Weekly Household Income, 2011

              18.0
              16.0
              14.0
              12.0
    Percent

              10.0
               8.0
               6.0
               4.0
               2.0
               0.0

Source: ABS, based on data from Profile .id by .id, the population experts

The proportion of middle income households is similar across all the small areas under
consideration, although there is more significant variation in the proportion of higher income
households as the next chart shows. The areas with the largest numbers of higher income residents
are along the Central parts of the coast, from the Malua Bay are to the Broulee area.

Housing Issues Paper, 30 April 2014                                                                 4
Figure 5: Weekly household income by small areas, 2011
Percent
0.0 10.0 20.0 30.0 40.0 50.0
Surfside - Long Beach - Maloneys Beach
- North Batemans Bay
Batemans Bay - Catalina
Surf Beach - Batehaven - Sunshine Bay
- Denhams Beach
Malua Bay - Lilli Pilli - Rosedale Up to $599
- Guerilla Bay
$600-1499
Broulee - Tomakin - Mossy Point
$1499+
Urban Moruya - Moruya Heads
Tuross Head
Dalmeny
Narooma - North Narooma - Kianga
Source: ABS, based on data from Profile .id by .id, the population experts
Change in Household Income 2001-2011
Eurobodalla’s population is becoming wealthier at a faster rate for incomes up to $2,500 per week
($130,000pa) per household. The graph below shows the change in weekly household income in
Eurobodalla and the rest of NSW (excluding Sydney) between 2001 and 2011. The rest of NSW has
had larger increases in the two highest income brackets, but Eurobodalla shire has had larger
percent increases in those households with incomes between $600 and $2,500. Both Eurobodalla
Shire and the rest of NSW have had losses in the number of households with lower incomes.
Figure 6 Change in weekly household income 2001-11
$3,000 or more
$2,500-$2,999
$2,000-$2,499
Weekly household income
$1,500-$1,999
$1,250-$1,499
$1,000-$1,249
Rest of NSW (exc.
$800-$999
Sydney)
$600-$799
Eurobodalla
$400-$599
$300-$399
$200-$299
$1-$199
Negative/Nil income
-500% 0% 500% 1000% 1500%
Change between 2001 and 2011
Source: ABS Census 2011
Housing Issues Paper, 30 April 2014 5Key conclusions
Population growth in the Shire had slowed considerably by 2013. This is due to the Shire’s
reliance on inbound migration to maintain its population. (Migration trends are reviewed in
the next chapter.)
The Shire’s households are characterised by three main features: a large proportion of older
people, a small proportion of children, and a predominance of 1 and 2 person households.
The Shire’s households have a very low median income. Certain suburbs have a slightly
higher proportion of higher income households, but even these have a lower median than
the average across regional NSW.
Housing Issues Paper, 30 April 2014 62. The current housing market and dwelling stock
Housing profile
In the 2011 census there were 14,819 recorded households but there were 22,350 recorded
dwellings of which 15,337 were occupied on Census night. This ratio fits with the estimate from the
Temporary Populations report2 that 31% of dwellings in Eurobodalla were unoccupied on Census
night. The great majority of vacant houses are owned by non-residents. Typically they are used part
time as holiday homes although a significant proportion of owners (27%)3 intend to move in
eventually (generally in two to ten years time), most likely when they retire.
There was an average of 2.3 people per household and 1.6 motor vehicles per occupied dwelling
The majority of the occupied dwellings were separate houses - 12, 720 (Figure 7). The proportion of
units and attached homes is low compared to many parts of NSW, and these higher density homes
are concentrated around the urban centres, particularly Batemans Bay.
Figure 7: Percentage of occupied dwelling types
3.27% 0.13%
6.44% Separate house
7.22%
Joined housing
Flat, unit or apartment
Other dwellings
82.94%
Dwelling structure not
stated
Source: ABS Census 2011
The largest number of dwellings were owned outright at 6,839 (44.6% compared with 31%
nationally) but significant numbers were also owned with a mortgage outstanding or rented - see
Figure 8.
2
Time and tide: moving towards an understanding of temporal population changes in coastal
Australia; National Sea Change Task Force, April 2013
3
Ibid, p92
Housing Issues Paper, 30 April 2014 7Figure 8: Percentage of tenure types of occupied dwellings
1.1%
6.8%
Owned outright
Owned with a mortgage
24.9% 44.6%
Rented
Other tenure type
Tenure type not stated
22.6%
Source: ABS Census 2011
There was a marked difference in proportions of the types of tenure between the top 68% and
bottom 32% of the household incomes. The majority of the property being purchased through a
mortgage was by households in the upper income bands. A larger proportion of the lower income
group rented. In the lower income group nearly 60% of the dwellings were owned fully compared to
about 45% in the higher household income group (Figure 9). This is consistent with the owners
either being retired or having acquired and paid for the property as a 2 or more income household,
but now reduced to a single income.
Figure 9 Percentage tenure type for each income group
100%
90%
80%
70%
60% Rented
50%
Being purchased
40%
Owned outright
30%
20%
10%
0%
Lowest 32% Upper 68%
Source: ABS Census 2011
The proportions of ownership fully paid and paid off varied across the suburbs from about 60% at
Surfside, Moruya Heads and Moruya to above 75% at North Narooma, Denham’s Beach, Kianga and
Batehaven.
Housing Issues Paper, 30 April 2014 8Figure 10 Proportion of household owning a dwelling or paying off a mortgage, by suburb
Batehaven
Kianga
Denhams Beach
North Narooma
Tuross Head
Tomakin
Batemans Bay
Dalmeny Owned outright
Maloneys Beach
Narooma
Sunshine Bay
Owned with a
Rosedale
mortgage
Lilli Pilli
Surf Beach
Broulee
North Batemans Bay
Malua Bay
Catalina
Mossy Point
Long Beach
Moruya
Moruya Heads
Surfside
0% 50% 100%
Source: ABS Census 2011
Purpose-built housing for older people
The vast majority of older people live in “mainstream” housing that was designed and built for the
general market. The match between the preferences of older people and the existing stock is
discussed in the next chapter.
However, a minority of older people want or need housing specifically designed for seniors. This age-
specific housing falls into three categories:
Accessible housing
Accessible housing meets the needs of people with disabilities and older people experiencing
declining mobility. In some cases it is purpose built (usually under the provision of the SEPP (Housing
for Older People and People with a Disability) and more often, facilities are retrofitted (eg. ramps,
grab-rails, accessible showers). There is no data on the supply of such housing, which community
housing stakeholders interviewed indicated was limited in the Shire.
Retirement village accommodation
Retirement villages are a popular option among older seniors, especially those aged over 75, and a
large proportion of those who relocate at this stage in life move into retirement villages. They are
attracted by the access to emergency care, the community of like- minded people, and the easy-to-
manage accommodation.
Housing Issues Paper, 30 April 2014 9The 2011 Census reported 211 retirement village dwellings in Eurobodalla. The following villages
have been identified:
IRT The Clyde, Retirement Village, Batemans Bay
Cooinda Retirement Village, Retirement Village, Batemans Bay
Principal Edgewood Park , Denhams Beach
The Manor Batemans Bay Retirement Village, Batemans Bay
Banksia Village, Broulee
IRT Moruya, Moruya
IRT Dalmeny
IRT Coastwatch, Dalmeny
Retirement villages accommodate only about 3% of over 65s in the Shire, a figure that is below the
NSW average and well below that found in many coastal areas of NSW, where up to 10% live in
villages.
Residential aged care
Only a small proportion of older people will ever enter residential care, and in almost all cases this
will occur only when their health has seriously deteriorated and round-the-clock support or medical
oversight is required. Eight residential aged care facilities have been identified in Eurobodalla,
providing 323 High Level Care places and 298 Low Level Care.
High Low
Banksia Village BROULEE 0 50
Edgewood Park Res Aged Care Facility DENHAMS BEACH 77 32
IRT - Crown Gardens BATEMANS BAY 0 40
IRT - Lakeview DALMENY 55 35
IRT - Moruya Village MORUYA 0 30
Maranatha Lodge BATEHAVEN 60 34
Sir James at Dalmeny Aged Care Facility DALMENY 66 50
The Glen Residential Care Centre CATALINA 65 27
TOTAL 621 323 298
Care facilities are funded and regulated by the Commonwealth Government, which subsidises care
places on the basis of a population ratio (88 places per 1000 people aged 70 or more).
Vacant dwellings
The proportion of vacant dwellings in Eurobodalla is very high – indeed, the ABS Census in 2011
found that, at 31.4%, it was the highest for any LGA in NSW.
The proportion of vacant dwellings varies greatly across the Shire. In the main urban centres about
one in five homes are vacant, but in the Malua Bay - Lilli Pilli – Rosedale - Guerilla Bay precinct it was
exceptionally high at 49.4%.
Housing Issues Paper, 30 April 2014 10Figure 11: Percentage of vacant dwellings 2011
Source: ABS Census 2011
The high rate of vacancy is predominantly due to the purchase of holiday homes by non-residents
who live in them only for short periods, although it is understood that in many cases the owners
intend to retire there eventually. This high level of holiday home ownership has a profound impact
on the local housing market, in particular making it vulnerable to changes in the external economy
which can lead to large variations in the propensity of outsiders to invest in a second home.
House prices
Dwelling prices were obtained from the Allhomes.com website on 17/12/2013. These are by their
nature asking prices and therefore in most cases marginally higher than any purchase price but some
prices indicated a range and the lower value was recorded, in these cases the value is most likely an
underestimate. The summary of the data for houses (not rural properties, units, apartments or
town houses) is shown in Table 3 while the distribution of house prices for the Eurobodalla Shire is
shown in
Figure 12.
Table 3 Asking price for houses Allhomes.com on 17/12/2013
Count 789
Mean $512,578
Mode $399,000
Median $450,000
Minimum $90,000
Maximum $4,100,000
Housing Issues Paper, 30 April 2014 11Figure 12 Distribution of house prices in the Allhomes data
250
200
Nuber of houses
150
100
50
0
Asking price (thousand $)
Twenty four percent of dwellings on offer were units, apartments and town houses, a figure
significantly higher than the census figure of 13.6% of dwelling being of this type. These were
generally about 50% of the price of separate houses (see Table 2 and Figure 13).
Table 4 Asking price for units, apartments and town houses Allhomes.com on 17/12/2013
Count 194
Mean $300,219
Mode $250,000
Median $255,000
Minimum $119,000
Maximum $1,100,000
Figure 13 Distribution for units, apartments and town houses prices in the Allhomes data
120
100
Nuber of units
80
60
40
20
0
Asking price (thousand $)
Housing Issues Paper, 30 April 2014 12House prices, and therefore affordability, varied significantly over the various localities within the
Eurobodalla Shire (Figure 14).
Figure 14 Percent of house prices in price bands by suburban area. Arranged in ascending order of
prices below $400,000
Thousand $
Urban Moruya, Moruya Heads
100-199
Batemans Bay, Catalina 200-299
Surfbeach, Batehaven, Sunshine Beach, 300-399
Denhams Beach
400-499
Tuross Head
500-599
Dalmeny 600-699
700-799
Narooma North, Narooma Kianga
800-899
Surfside, Long Beach, Maloneys Beach,
North Batemans Bay 900-999
1000-1099
Broulee, Tomakin, Mossy Point
1100-1199
Malua Bay, Lilli Pilli, Rosedale, Guerilla
Bay 1200+
0% 20% 40% 60% 80% 100%
There were too few units, apartments and town houses on offer for a similar disaggregated analysis
of price to be meaningful. The 2011 census give a good estimate of the prevalence of unit type
dwellings in each suburb however it is not a full count because unoccupied dwellings are not
separated into dwelling types (Figure 16).
Housing Issues Paper, 30 April 2014 13Figure 15 Total numbers of houses and units on offer by suburban groupings, Allhomes data
Narooma North, Narooma Kianga
units,
appartments
Dalmeny
and townhouses
Tuross Head
houses
Urban Moruya, Moruya Heads
Broulee, Tomakin, Mossy Point
Malua Bay, Lilli Pilli, Rosedale, Guerilla Bay
Surfbeach, Batehaven, Sunshine Beach,
Denhams Beach
Surfside, Long Beach, Maloneys Beach, North
Batemans Bay
Batemans Bay, Catalina
0 50 100 150 200
Figure 16 Number of dwellings by type in suburb groupings, 2011 census
Narooma North, Narooma, Kianga
"Units"
Dalmeny Houses
Other
Tuross Head
Unoccupied
Urban Moruya, Moruya Heads
Broulee, Tomakin, Mossy Point
Malua Bay, Lilli Pilli, Rosedale, Guerilla Bay
Surfbeach, Batehaven, Sunshine Beach, Denhams Beach
Surfside, Long Beach, Maloneys Beach, North Batemans
Bay
Batemans Bay, Catalina
0 500 1000 1500 2000 2500 3000 3500 4000
Source: ABS Census 2011
The percentage of units varied widely by suburb from zero at Rosedale, Kianga and Mossy Point to
33.4% in Batemans Bay. Table 5 shows the suburbs where more than 10% of the occupied premises
were units. A problem with grouping suburbs becomes obvious when the grouped data in Figure 16
is compared to the suburb-level data in Table 5. For example the high percentage of units in
Batemans Bay shown in Table 5 becomes lost when grouped with the data from Catalina in Figure
16.
Housing Issues Paper, 30 April 2014 14Table 5 Individual suburbs with "units" constituting more than 10% of occupied dwellings
Suburb % occupied
dwellings
Batemans Bay 33.4
North Batemans Bay 23.1
Surf Beach 15.0
Narooma 14.3
Batehaven 12.0
Denhams Beach 11.2
Source: ABS Census 2011
Housing market segments
The most significant aspect of the local housing market is that it has two discrete components:
Local residents.
Non-residents.
Non-residents are typically older households (45% 45-64 years old compared with 31% 45-64 years
old in the general Shire population) who buy a home either intending to move to the Shire (just over
a quarter) or using their property as a holiday home for some time (21%)4. At the time of writing,
real estate agents report that non-residents comprise the great majority of home buyers, despite the
decline in inward migration to the LGA. A reliance on non-resident buyers, although common in
coastal areas, is particularly marked in smaller settlements along the South Coast of NSW.
Drawing on stakeholder feedback, including the experience of real estate agents in Eurobodalla
(from this study) and other NSW coastal areas (from previous studies), as well as from review of the
population's composition and review of real estate advertising in Eurobodalla, five sub-markets have
been identified:
1. Sea change baby boomers. Typically looking to buy a 2 or 3 bedroom detached home in an
attractive coastal location, most members of this group can afford a house at or above the
local median price, based on their housing assets built up in Sydney or Canberra. In the past,
the typical buyer would be a couple in their 50s with grown up children, buying a holiday
home with a view to retiring into it when their children leave home. Despite current market
conditions, this group is estimated to represent over half the buyers in Eurobodalla, and
possibly over three quarters in some areas.
2. Downsizing retirees. Many older people want to move to somewhere smaller and more
manageable when they feel their health or mobility is declining. They may also want to move
somewhere with shops and doctors close by, because they no longer wish to drive so much.
A substantial minority move into a retirement village at this stage. It appears that this
market is not well served in Eurobodalla, so this group represents a small section of the
market. A large number of people leave the Shire after the age of 70.
3. Families with children. Home buying families with children generally want to live in detached
housing that is accessible to their workplace. Depending on income they may be looking to
buy a cheap, older-style house or a luxury home, and they trade up when they can, often to
4
Sea Change Task Force, op cit p50 and p38.
Housing Issues Paper, 30 April 2014 15a modern home with up to five bedrooms. Buyers from this market segment make up most
of the “resident” buyers in Eurobodalla.
4. Small local households. There are many local resident households with only one or two
members. Despite the small household size, the available evidence is that this group prefers
detached housing or two-to-three bedroom attached housing (eg townhouses). However
some have a strong preference for a particular location that offers good facilities and
recreational options, and some want to be close to their workplace, so there is some
localised demand for smaller one and two bedroom units, especially if these are very
affordable.
5. Low income renters. Many households cannot buy a home, because their income is too low
or they are reliant on employment benefits, disability pension or casual work. A quarter of
households in the Shire are renters, but much of the Shire’s housing stock is not affordable
to those on low incomes, despite rents in the Shire being comparatively low – and social
housing supply in the area is very limited. The most affordable options are typically older-
style units, which are concentrated in the northern part of the Shire, particularly around
Batemans Bay. This sub-market does not include middle and higher income renters,
typically working age locals who can afford a suitable home in a suitable location.
Key conclusions
1. The great majority of homes in Eurobodalla are detached.
2. Incoming migrants and second home buyers comprise a very large proportion of the Shire’s
housing market, and a slowdown in these sectors has weakened the local housing market.
3. The Shire has an exceptionally high proportion of vacant homes, as a result of holiday home
investment. This market sector sometimes has a de-stabilising effect on the local housing
market.
4. High value housing is concentrated in certain suburbs, mainly in the central section of the
coast from Lilli Pilli south to Broulee.
5. There is limited housing stock specifically built to address demand from older people. This is
probably not a major issue for people in their 50s or 60s, but the poor supply of options for
downsizing to a small block or a unit, or to a retirement village, and limits on specialist
medical services available in the Shire may help explain some of the exodus of people aged
70 or more.
Housing Issues Paper, 30 April 2014 163. Recent housing market trends
An important issue for residential demand and supply is the extent to which construction activity is
tied to ongoing population growth. This is particularly important given the slowdown in the Shire’s
actual population growth this last decade.
The rate of growth in the Shire’s population fell from 1.6%pa between 2001 and 2005 to 0% pa in
2012. It is not yet clear if this is a temporary slow-down or whether it is a sign of the ‘sea-change’
phenomenon has faded? In either case, the implications for the Shire’s economy and housing market
are significant.
Residential Construction
The chart below shows that the value of residential development in recent years in Eurobodalla has
been between $80 and $120 million per annum and has been trending down since 2008-09.
Figure 17 Value of DAs determined 2007-08 to 2012-13
140,000,000
120,000,000
Value of DAs determined ($)
100,000,000
80,000,000
60,000,000
40,000,000
20,000,000
0
2007-08 2008-09 2009-10 2010-11 2011-12 2012-13
Source: DOP Local Development Performance Monitoring Reports (2007 to 2013) from
www.planning.nsw.gov.au/en-us/developmentproposals/performancemonitoring
A longer term perspective shows that the value of activity peaked in 2002, early in the housing
boom, at over $230 million pa (in 2002 dollars), and the total value has been around the level of
recent years ($100 million pa plus or minus $20 million) since 2006.
According to ABS Census data, the housing stock in Eurobodalla increased by 2,841 dwellings
between 2001 and 2011, or approximately 15%. This is an annual increase of around 280 new
dwellings each year, and the chart below shows that most of these were new single dwellings.
Housing Issues Paper, 30 April 2014 17Figure 18 DAs determined by dwelling type 2007-8 to 2012-13
300
250
200
150 Single new dwellings -
number of DA determined
100 New second occupancy -
number of DA determined
50
0
Source: Local Development Performance Monitoring Reports (2007 to 2013)
The chart below shows that most of the construction activity was valued at under $500,000, with the
$0-$100,000 category accounting for the largest number of DAs. The chart shows that there is some
consistency to this pattern over recent years, though there were signs of a slight increase in the
number of DAs over $500,000 up until 2011.
Figure 19 Number of DAs determined by value, 2007-08 to 2012-13
600
548 539
500 468 467
2007-08 2008-09
421
400 362
2009-10 2010-11
315
300 256 261248
242 2011-12 2012-13
189
200
127
125
9692
100 78
39 20
14 15 21 16 12 7 6 4 7 6 3 1 2 1 1 0 2
0
Number of DA Number of DA Number of DA Number of DA Number of DA Number of DA
determined of determined of determined of determined of determined of determined of
value $0 value $0-$100k value $100k- value $500k-$1m value $1M-$5M value $5M-$20M
$500k
Source: Local Development Performance Monitoring Reports (2007 to 2013)
Housing Issues Paper, 30 April 2014 18Dwelling types
As noted in the previous chapter, 83% of dwellings in the Shire are separate houses. In order to
diversify housing choice in response to growth in the number of small households, as well as to
make better use of urban land and infrastructure, the State Government and Eurobodalla Council
have sought to promote higher levels of medium density development in the Shire.
During the decade 2001 to 2011, 23.6% of the additional homes constructed in Eurobodalla were
medium density in format. The great majority of these were attached housing, with a smaller
number of apartments.
The following table shows the change in the housing stock in each of the urban precincts. It shows
that, over the decade, development activity has been distributed across the Shire. There has been
some medium density development in all the precincts. In the area from Batemans Bay south to Surf
Beach, around a third of new construction was medium density housing. In the remaining areas, the
proportion was around one fifth.
Figure 20: Additions to housing stock, small areas, 2001-2011
Additional dwellings
0 200 400
Surfside - Long Beach - Maloneys Beach…
Batemans Bay - Catalina
Surf Beach - Batehaven - Sunshine Bay…
Malua Bay - Lilli Pilli - Rosedale…
Broulee - Tomakin - Mossy Point
Urban Moruya - Moruya Heads
Tuross Head Separate house
Dalmeny
Medium
Narooma - North Narooma - Kianga density
Source: ABS, based on data from Profile.id, by .id, the population experts
Price Trends
In November 2013, the median house price in Eurobodalla LGA was reported to be $347,000 and the
median unit price was $256,000. Ten years earlier, at the end of 2003, median prices were
approximately $330,000 for houses and $260,000 for units, so over the last decade houses have
risen in value less than inflation and units have registered no rise. During this period, prices have
been very volatile, as the next chart shows. However, agents report some pick-up in the housing
market over recent months, particularly for houses at the lower end of the price spectrum (under
$300,000 for detached houses).
Housing Issues Paper, 30 April 2014 19Figure 21 Annual change in median price, Eurobodalla LGA
Houses Units
Source: domain.com.au
Prices vary significantly across the region. The next section of this report looks at affordability, and is
based on suburb level data showing that the most expensive suburbs (highest median prices) are
Maloneys Beach, Mossy Point, Rosedale and Lilli Pilli, closely followed by Malua Bay, Broulee, North
Narooma and Moruya Heads. The lowest prices are in North Batemans Bay and Tomakin.
House purchase affordability
Housing affordability has two components: the cost of housing (rent or mortgage repayments) and
household income. A commonly used measures used for ‘housing stress’ is housing expenditure
(rent or mortgage repayments) of less than 30% of household income (HIA5). A second empirical
measure for the purchase of a dwelling is that the purchase price should be less than 5 times the
annual household income (Bank West6).
The NSW Centre for Affordable Housing specifically monitors affordability for lower income groups
and in particular those at the lower margins of affordability. Its most recent summary found that in
2013, 46% of the dwellings sold in Eurobodalla were at a price that was affordable to a “moderate
income household” (ie. a household with gross income that is 80-120% of the Shire median). That
assessment is consistent with the findings in this report presented below and represents a dramatic
increase in affordability since 2010, when only 26% of dwellings were affordable to this group.
House Prices and Incomes
The relationship between the price of houses or units on offer and the ability of residents of the
Eurobodalla Shire to afford them is shown in Figure 22 and Figure 23. The analysis found that around
50% of houses on the market are affordable for about 25% of Eurobodalla households while units
are more affordable with 50% affordable for about 45% of households.
Figure 22 shows the distribution of incomes in Eurobodalla and the relative affordability of homes
for sale in Eurobodalla. The distribution of incomes (blue column) shows that 50% of households
have incomes up to $799 (all weekly income figures here are gross household incomes) per week,
and that almost 75% of households have incomes up to $1,249 per week. The relative affordability
of houses (red column) shows that to be able to afford half the houses on offer, households need a
5
HIA-Commonwealth Bank Housing Affordability Reports available from
http://economics.hia.com.au/publications/hia_cba_affordability_report.aspx
6
Bank West Key Worker Housing Affordability Report 2011
Housing Issues Paper, 30 April 2014 20weekly income of $1,250 - $1,499 ($65,000 - $78,000 pa). Households with incomes in the $1,000 -
$1,249 pw range can afford 25% of the houses on offer, and a household income of less than $1,000
pw enables purchasing of only the cheapest homes on offer.
Figure 22 Household income and detached housing affordability
100
90 household
80 incomes
70
60
50
%
affordable
40 houses
30
20
10
0
weekly household income
Source: ABS Census 2011, SES calculations
Figure 23 applies the same analysis to units rather than freestanding houses, and shows that
affordability is much improved. The blue columns have the same pattern as the previous figure as
they show the same data – the distribution of household incomes in Eurobodalla. The red columns
again show affordability, and indicate that the lower prices of most units mean that a household
income of $800-$999 pw would enable purchase of over 65% of the units on offer. Household
incomes of $600-$799 pw would enable purchase of some 30% of the units on offer.
Housing Issues Paper, 30 April 2014 21Figure 23 Household income and unit affordability
100
90
80 household
70 incomes
60
50
%
40 affordable
30 units
20
10
0
weekly household income
Source: ABS Census 2011, SES calculations
Another aspect of affordability across the suburbs can be obtained by comparing, on a suburb by
suburb basis, the Allhomes.com list of asking prices with the household income profile. From this
data it is possible to estimate what proportion of houses on offer is affordable (less than 5 times
annual income) to defined proportions of local households.
The first calculation estimates the proportion of households that cannot afford anything other than a
negligible proportion (0.1%) of the houses on offer (Figure 24). The biggest influence on these
estimates is the presence or absence of low priced houses (Figure 24 Estimate of the percentage of households that can only afford 0.1% of houses on offer
Basis of calculation
asking price in
suburb and
household income
in Eurobodalla
asking price in
suburb and
household income
in suburb
0 50 100
% of households with an income that can afford only 0.1% of
houses on offer
Source: ABS Census 2011, SES calculations
The second set of calculations presents two estimates of affordability for those with adequate
income for house purchase: the percentage of houses on offer that are affordable to 65% and 95%
of households in each suburb (Figure 25 and Figure 26). The calculations combine the varying
income of suburb residents with the varying house prices in their suburb to look for suburbs of high
income/high house prices and low incomes/low house prices. The data for 65% is the most sensitive
measure as it is closer to the point at which houses become unaffordable to those on lower incomes.
The 95% data is a less sensitive measure but a better representation of the suburb as a whole.
The charts show, for each suburb, the proportion of houses that can be afforded by locals from the
suburb (reflecting the income range in that suburb) and also the proportion affordable to the wider
Shire population. The difference in affordability is a result of different income levels and different
property values. The charts show that
Some high-income suburbs (such as Denham’s Beach, Mossy Point and Rosedale) have high
levels of local affordability because their residents have higher incomes than the Shire
average, and can therefore afford a more expensive house; and
Low income suburbs such as Batehaven and Surf Beach show the opposite – being more
affordable to average Eurobodalla residents than to local residents in these suburbs.
Housing Issues Paper, 30 April 2014 23Figure 25 Estimate of the percentage of listed houses that can be afforded by 65% of households
Basis of calculation
asking price in
suburb and
household income
in Eurobodalla
asking price in
suburb and
household income
in suburb
0 5 10 15 20
% of houses on offer affordable to 65% of households
Source: ABS Census 2011, SES calculations
Housing Issues Paper, 30 April 2014 24Figure 26 Estimate of the percentage of listed houses that can be afforded by 95% of households
Basis of calculation
asking price in
suburb and
household income
in Eurobodalla
asking price in
suburb and
household income
in suburb
0 20 40 60 80
% of houses on offer affordable to 95% of households
Source: ABS Census 2011, SES calculations
The 2011 Census also gives another view of the affordability of purchasing dwellings by estimating
the incidence of ‘mortgage stress’ where mortgage payments exceed 30% of household incomes.
Using the freely available ABS data it is possible to compare the pattern of mortgage repayments
with the pattern of household incomes of those paying a mortgage (Figure 27).
The chart shows that mortgage stress (red columns) is more common amongst mortgagees on lower
incomes (under $1,000-1,249pw). This is expected in most areas as most low income households
are either younger or post retirement, and housing stress is common amongst people entering the
housing market while on moderate incomes. But it is somewhat surprising in the context of
Eurobodalla’s older age profile, and the related higher proportion of households owning their homes
already. In an older community like Eurobodalla it might be expected that there are many old
mortgages with low levels of monthly repayments which might be manageable even on a low
monthly income. But it seems that if there are old mortgages in Eurobodalla, the incomes of these
homebuyers are very low indeed, making the mortgage payment over 30% of income.
Overall, the incidence of mortgage stress falls once incomes exceed $1,500pw, though there are still
a few households with high incomes and very large mortgages.
Housing Issues Paper, 30 April 2014 25Figure 27 Mortgage stress
Comparison between mortgage repayments and income of those making the repayments, based
on 2011 census data.
600
500
Mortgage
400 more than
30% of
Number
income
300
Mortgage
200 less than
30% of
100 income
0
Household income per week
Source: ABS Census 2011, SES calculations
Rental affordability
The 2011 Census has cross tabulated individual data on rents paid and household income.
Figure 28 Rent paid and income, 2011 census figures
800
rent more
700 than 30%
600 household
500 income
Number
400
rent less than
300
30%
200 household
100 income
0
household income/week
Source: ABS Census 2011, SES calculations
Housing Issues Paper, 30 April 2014 26Rental payments were more than 30% of the income for the vast majority (about 80%) of those with
household incomes of less than $1000 per week (
Figure 28, red columns). Rental costs were much less of an impost on those with an income of
$1000pw or more with just 4% of them paying more than 30% of income.
There were too few rental residential properties advertised (2-5 per suburb) to make any valid
comments about the distribution of current rental prices and affordability. However, across the Shire
as a whole, rents have not kept pace with inflation in recent years, and have fallen over the last two
years, particularly for units7. Current median rents are $200 per week for a 2 bedroom unit, and for a
3 bedroom house $300.
Key conclusions
1. The Shire’s housing stock increased by 15% in the decade to 2011. However, at $84.3
$million for 2012-13 the value of DA approvals is currently low compared to the level of
$100 -120 million for 2008-11, and well below the peak of $230 million for 2002.
2. While building activity levels have remained vibrant, most of the activity is of moderate
value.
3. Most existing housing is detached and only 14% is medium density. However, 24.6% of
dwellings constructed in the decade to 2011 were medium density.
4. Despite pronounced volatility from year to year, median housing prices in the LGA have
barely risen during the last decade and have failed to keep up with inflation.
5. Despite housing prices which are low compared to many parts of NSW, home ownership is
not affordable to at least half the households in the Shire.
6. Housing is most affordable in Batehaven and Surf Beach.
7. The great majority of renting households with an income of under $1000 a week are in
housing stress.
7
Data from NSW Centre for Affordable Housing
Housing Issues Paper, 30 April 2014 274. Population projections
Projected population growth
Population projections 2011- 2031: Eurobodalla Shire
The estimated resident population of Eurobodalla Shire in 2011 was approximately 37,000 people.
Projections for Council prepared by demographic consultants ID8 suggest that
By 2021 the population will be about 39,500.
By 2031 the population will be about 42,600.
This represents population growth of around 5,600 people over 20 years.
Projections independently prepared by the NSW Department of Planning reach similar conclusions,
with slightly greater growth of 6450 people by 2031.
Small area projected population 2011 to 2031
It is expected that population growth will not be evenly distributed, as Figure 29 shows
Figure 29: Projected population growth to 2031 by small areas.
Surfside - Long Beach - Maloneys Beach - North Batemans Bay
Batemans Bay - Catalina
Surf Beach - Batehaven - Sunshine Bay - Denhams Beach
Malua Bay - Lilli Pilli - Rosedale - Guerilla Bay
Broulee - Tomakin - Mossy Point 2011
Urban Moruya - Moruya Heads 2031
Tuross Head
Dalmeny
Narooma - North Narooma - Kianga
5000
1000
2000
3000
4000
6000
7000
0
Source: Based on data from Forecast.id, by .id the population experts
8
Note that all the data in this chapter is drawn from IDs projections prepared for Council, except where
referenced otherwise.
Housing Issues Paper, 30 April 2014 28Among the small areas, particularly strong growth is anticipated along the central section of the
coast, from Tomakin to Moruya and Moruya Heads:
Northern precincts (Long Beach/Batemans Bay/Malua Bay): 1447 additional residents
Central precincts (Tomakin/Broulee /Moruya) 2623 additional residents
Southern precincts: 913 additional residents.
Significantly, very limited population growth is expected in the existing urban centre of Batemans
Bay, with growth focussed on areas to the north and south of the town.
It is useful to consider the growth in population in percentage terms, because a small increase in the
population can have a significant impact in a small settlement. From this perspective, the most
substantial population growth is projected for the Malua Bay area and the Moruya area.
Figure 30 Percentage population growth 2011-2031
Surfside - Long Beach - Maloneys Beach - North Batemans Bay
Batemans Bay - Catalina
Surf Beach - Batehaven - Sunshine Bay - Denhams Beach
Malua Bay - Lilli Pilli - Rosedale - Guerilla Bay
Broulee - Tomakin - Mossy Point
Urban Moruya - Moruya Heads
Tuross Head
Dalmeny
Narooma - North Narooma - Kianga
0 10 20 30 40
Source: Based on data from Forecast.id, by .id the population experts
Factors affecting population growth
Population projections are based on predictions about “natural” population growth (births minus
deaths) plus net migration (inward migration less outward migration). The projections described
here make the following estimates for Eurobodalla Shire over the period 2012 to 2031.
Births +6513
Deaths -9021
Net migration +8067
These figures illustrate the crucial point that population growth in the Shire will be entirely
dependent on inbound migration. Without this, the population would decline.
Changing expectations about levels of migration have led to major revisions of population
projections for the Shire. The projections used in this report were prepared in 2012. Earlier
Housing Issues Paper, 30 April 2014 29projections for the 2007 South Coast Regional Strategy suggested that the population would grow
more than four times as much as currently expected. This was based on an assumed continuation of
the high levels of inward migration experienced in the period from the mid 1990s up to the Global
Financial Crisis.
Consequently, future changes in economic conditions and price trends in housing markets can be
expected to affect population growth in the Shire quite strongly, leading to increases or decreases in
the rates of migration.
Age structure of the future population
Eurobodalla’s population structure is weighted towards older age groups, and this will become
accentuated over the next 20 years as a result of inward migration of older people and the ageing of
the existing population.
Despite the expected growth in the overall population, very little growth is predicted for all the age
groups from 0 to 65 years old. On the other hand, strong growth is predicted for the age groups 65-
80 years old, particularly over the decade to 2021.
Figure 31 Population projections Eurobodalla Shire
4000
3500
3000
2500
Population
2000
2011
1500
2021
1000
2031
500
0
85 and over
10 to 14
15 to 19
20 to 24
25 to 29
30 to 34
35 to 39
40 to 44
45 to 49
50 to 54
55 to 59
60 to 64
65 to 69
70 to 74
75 to 79
80 to 84
0 to 4
5 to 9
Age Group
Source: Based on data from Forecast .id, prepared by .id, the population experts
The next chart shows the projected change in numbers in each age group over the period.
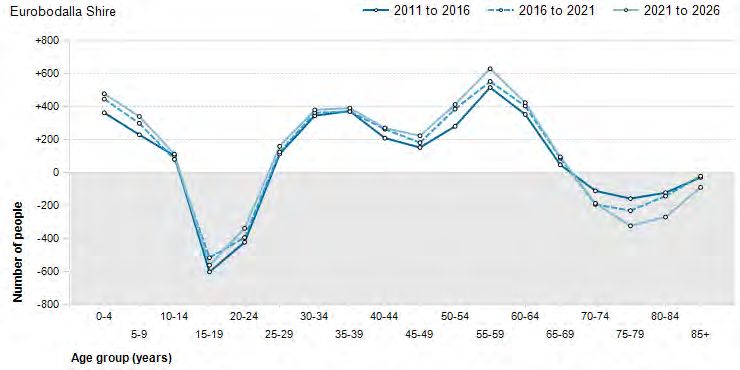
Housing Issues Paper, 30 April 2014 30Figure 32: Change in age structure 2011-2031 Source: Based on data from Forecast.id, by .id the population experts Underlying these changes is a continuing trend for inward migration by older people, particularly those in their 60s. At the same time, large numbers of younger people, particularly those in their 20s, are expected to leave the Shire, continuing an existing trend. Figure 33: Projected net migration by age group 2011-2031 Source: Based on data from Forecast.id, by .id the population experts Projected rates of net migration reflect current trends, which include substantial numbers of departures by young people, particularly those in their twenties; modest net inward movement by younger families with children; and high levels of net inward migration among early retirees, with a peak at age 60. Housing Issues Paper, 30 April 2014 31
Perhaps surprisingly, the forecasts suggest significant net outward migration from the Shire of
people aged 70 and over, particularly around age 75. On a small area basis, this outward migration
trend is most marked in the Batemans Bay and Moruya urban areas. Reasons may include a desire to
move closer to family members, a desire to be close to facilities, or a desire for forms of
accommodation (particularly retirement villages or small homes on small lots) that are not available
in their existing location.

Household types
Figure 34: Forecast household types 2011-2031.

Source: Based on data from Forecast.id, by .id the population experts

The Shire’s household mix currently includes a larger proportion of lone person households and a
smaller proportion of families with children than the average for the State. It is projected that these
trends will continue, although the growth of the overall population should lead to an increase in
absolute numbers for all households except group households. Consequently, the composition of
housing demand is not expected to change greatly, at least in terms of the balance between key
market segments, with over two thirds of households comprising only one or two persons (lone
persons 40% of households, couples 30%).

Demand for dwellings
Projected demand for additional dwellings has been revised downwards as a result of the recent
slowdown in population growth. Council’s Residential and Rural Residential Land Supply Report
2012-13 estimates a demand for approximately 3,000 new dwellings in residential areas by 2013.
These estimates are broadly in line with the NSW Department of Planning’s latest estimates.

Future housing growth to meet this demand is spread across the urban precincts, according to ID, as
shown in the next table. It shows the highest projected growth will be found in areas south of
Batemans Bay and down the coast to Moruya.

Housing Issues Paper, 30 April 2014                                                                  32
Table 6: Estimated distribution of potential additional dwellings to 2031
Surfside - Long Beach - Maloneys Beach - North Batemans Bay- 492
Batemans Bay – Catalina 144
Surf Beach - Batehaven - Sunshine Bay - Denhams Beach 275
Malua Bay - Lilli Pilli - Rosedale - Guerilla Bay 739
Broulee - Tomakin - Mossy Point 547
Urban Moruya - Moruya Heads 567
Tuross Head 175
Dalmeny 260
Narooma - North Narooma - Kianga 177
Total Urban Precincts 3376
Shire Total inc Rural 4076
The types of housing that will be built to address these future needs will be determined by the
market. There has been significant policy discussion about the limited diversity of housing in the
Shire and in particular about the need to promote medium density development. The settlement
strategies outlined in the next chapter suggest that a large part of future need can and should be
met by smaller homes, particularly medium density housing, and a previous report to Council9
suggested that the predominance of small households means that there will be strong demand for
medium density homes in future. However, in reality the link between household size and dwelling
preference is a complex one, and the factors that may influence future demand are discussed in the
next chapter.
Key conclusions
Modest population growth – less than 1% a year – is predicted for the urban precincts.
Population growth will entirely depend on inbound migration to Eurobodalla. Consequently,
any rise or fall in the number of migrants will have a substantial impact on the Shire’s
population. Indeed, a significant reduction in inbound migration could result in a decline in
the Shire’s population.
The majority of inbound migrants are empty nesters and younger retirees. This group
already makes up a very large proportion of the population, and this will increase over the
next 20 years.
Demand for additional housing in Eurobodalla will come primarily from incoming migrants
(and probably also from holiday home buyers). Most of the additional households will
comprise only one or two persons.
On current estimates, around 4000 additional homes will be required in Eurobodalla over
the next 20 years, about 85% of them within the urban precincts.
Current projections suggest that the highest level of housing construction will occur in the
Malua Bay to Guerilla Bay precinct, in the Broulee to Mossy Point precinct, and in and
around Moruya. Note, however, that estimates of the distribution of new development are
based to a significant extent on the availability of residential land in each precinct rather
than on estimates of demand.
9
Judith Stubbs and Associates, Draft Eurobodalla Housing Strategy, 2008
Housing Issues Paper, 30 April 2014 33You can also read