This is Wirral Vulnerable Adults - Wirral Intelligence Service (January 2020)
←
→
Page content transcription
If your browser does not render page correctly, please read the page content below
This is Wirral

                                              Vulnerable Adults

                                              Wirral Intelligence Service
                                              (January 2020)

Wirral Intelligence Service: This is Wirral                                 January 2020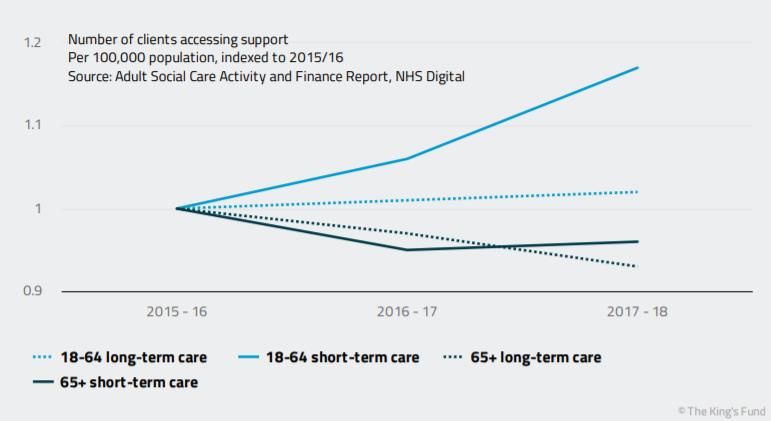
This is Wirral

For further information please contact:
Author: John Highton, JSNA Programme Lead and Alexandra Davidson, Scrutiny Officer,

Wirral Intelligence Service
Email: wirralintelligenceservice@wirral.gov.uk

 Background to This is Wirral
 This is Wirral is a collected set of evidence about Wirral.
 It includes information about the Wirral population including their current and future health and
 wellbeing needs and the borough including information about the economy, housing,
 environment and transport.
 The insight is collected into a number of sections to allow ease of access for the reader.
 Each section contains detailed content including the key messages from the analysis and insight
 on main issues and is underpinned by detailed information.
 The information forms our Joint Strategic Needs Assessment (JSNA) providing a detailed picture
 of the borough.
 It is used to enable effective strategic planning to determine what actions local authorities and
 other partners need to take to meet resident needs and to address the wider determinants that
 impact on health and wellbeing.
 How can you help?
 If you have ideas or any suggestions about these issues or topics then please email us at
 wirralintelligenceservice@wirral.gov.uk or go to https://www.wirralintelligenceservice.org/

 Version Number                      Date                           Authors
       1.0                       January 2020         John Highton and Alexandra Davidson
                                                                for Wirral Council

 Acknowledgements
 We would like to thank the following people and organisations for their contribution to the content
 contained in this document:
  • Alexandra Davidson, alexandradavidson@wirral.gov.uk Scrutiny Officer
  • Nancy Clarkson, nancyclarkson@wirral.gov.uk Head of Intelligence
  • Carl Gurnell carlgurnell@wirral.gov.uk Business Intelligence Manager
  • Jason Oxley, jasonoxley@wirral.gov.uk Assistant Director - Health and Care Outcomes
  • Rob Davis, robertdavis@wirral.gov.uk Senior Health & Social Care Intelligence Manager
  • John Highton johnhighton@wirral.gov.uk JSNA Programme Manager

 Wirral Intelligence Service: This is Wirral            January 2020                           2 of 48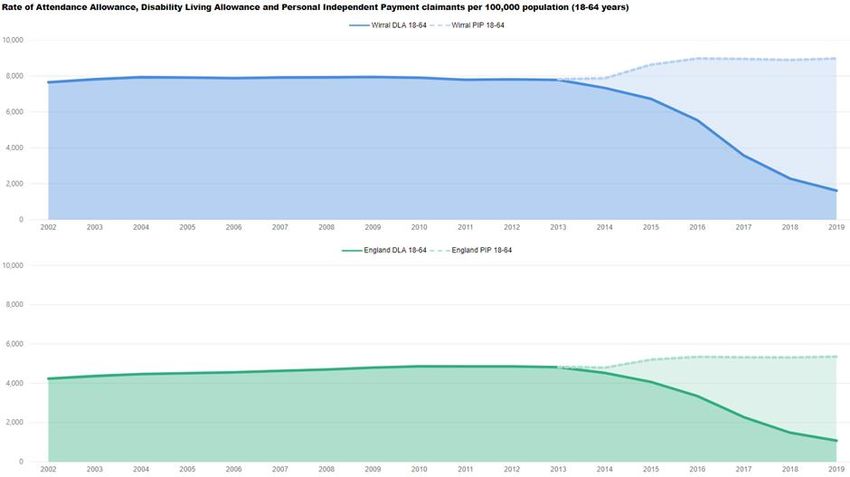
This is Wirral: Vulnerable Adults
Contents
Background to This is Wirral ...................................................................................................................2
Acknowledgements ..................................................................................................................................2
Key Messages ...........................................................................................................................................4
Infographics ..............................................................................................................................................6
What do we know? ...................................................................................................................................7
   Introduction .............................................................................................................................................7
   Emerging themes for Social Care and Vulnerable Adults ........................................................................7
       Comparing identified national issues to local situation.........................................................................9
   Vulnerable Adults in Wirral: Market Position Statement Evidence Base ................................................36
What are we doing and why? .................................................................................................................38
   Care and Support at Home ...................................................................................................................38
       Assistive Technology in Care and Support at Home..........................................................................38
   Supported Living ...................................................................................................................................39
   Extra Care ............................................................................................................................................39
   Carers and Respite Services ................................................................................................................40
       Respite..............................................................................................................................................40
   Residential and Nursing Care ...............................................................................................................41
       Specialist Residential and Nursing ....................................................................................................41
   Mental Health Services .........................................................................................................................41
   Urgent Care ..........................................................................................................................................42
   Wirral Independence Service and Shared Lives....................................................................................43
   Transfer to Assess ................................................................................................................................43
   Day Services and Employment ..........................................................................................................44
       Learning Disabilities and Mental Health ............................................................................................44
       Older People .....................................................................................................................................44
   Neighbourhood Working, Early Intervention and Prevention .................................................................44
Local View ...............................................................................................................................................45
   Adult Social Care Survey (ASCS) 2018-19 ...........................................................................................45
   Survey of Adult Carers in England (SACE) 2018-19 .............................................................................45
   Wirral Residents Survey 2017 ...............................................................................................................46
   Wirral Mental Health Survey 2017.........................................................................................................46
   Urgent Care ..........................................................................................................................................47
   Integrated Health and Social Care ........................................................................................................47
   Learning Disabilities ..............................................................................................................................48
Underpinning and supporting evidence................................................................................................48
Contact details ........................................................................................................................................48

  Wirral Intelligence Service: This is Wirral                                         January 2020                                                3 of 48
Key Messages
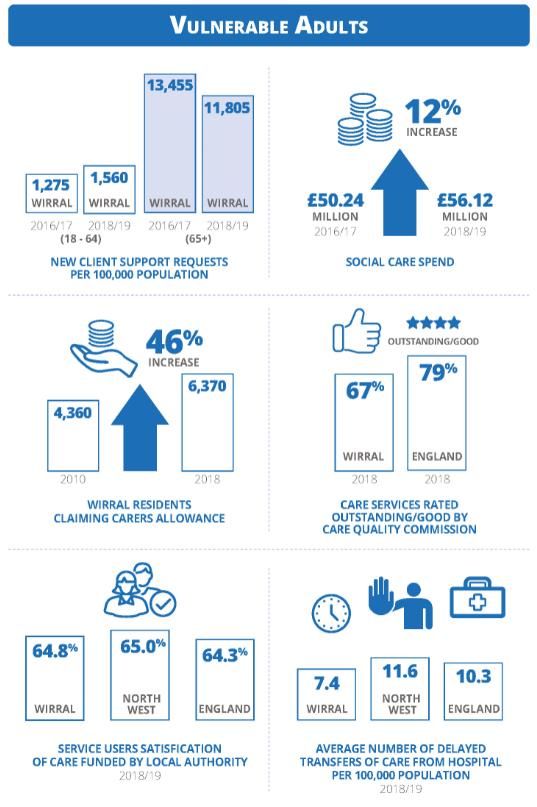
• Wirral, like North West and England, has seen an increase in new client support requests for
working age adults (18–64 years) increasing from 1,275 per 100,000 population in 2016/17 to 1,560
in 2018/19 (Page 9)
• While new client support requests for those over 65 years in Wirral have fallen from 13,455 in
2016/17 to 11,805 per 100,000 population, while North West and England have remained relatively
static. It should be noted that local data suggests for 2018/19 Wirral had lower rates of requests for
support than both North West Local Authorities and England (Page 9)
• Data suggests that between 2016/17 and 2018/19 the long-term care numbers at a Wirral and North
West, for both working age adults and aged over 65 years, level remained static or fell slightly. This
is equally true for short term care at a North West regional level but not for short term care on a
Wirral footprint. This has seen the number of clients accessing support, as a rate per 100,000
population, falling from 17% (2016/17) to 11% (2018/19) for those aged 18 to 64 years and from
37% (2016/17) to 27% (2018/19) for those aged over 65 years (Page 10)
• Since 2010/11, these means test thresholds for the social care financial assessment have not been
increased in line with inflation; if they had, the Kings Fund estimate the upper threshold would now
be £2,811 higher at £26,061. This also implies that people whose assets today are between
£23,250 and £26,061 have effectively lost their eligibility for publicly funded social care support. At
this moment Wirral charges 100% of expendable income after all the required deductions and
discretionary allowances have been made. (Page 11)
• Kings Fund research points to the fact that publicly funded social care is available only to people
with high enough needs. But identifying the incidence of need, such as numbers and levels of
disability, in the population is far from straightforward (Page 12)
• For Wirral, using Family Resources Survey and Office for National Statistics population data as
Kings Fund used it is estimated that 67,739 people in Wirral had some form of a disability in 2018.
This figure consists of 4,730 children, 31,594 working-age adults and 31,415 state pension age
adults. This is an increase of almost 9,000 people since 2011, when there was estimated to be
59,028 people having a disability. Though understanding the needs and supporting these estimated
populations is complex (Page 13)
• Data suggests that Wirral has followed a similar pattern to England with increasing numbers of
working age claimants receiving disability benefits since Personal Independence Payments (PiP)
replaced Disability Living Allowance (DLA) and PIP numbers increasing since 2014. Although there
is a less pronounced fall for Wirral, it has still followed England, and seen a reduction in DLA and
Attendance Allowance (AA) claimants aged over 65 (page 15)
• Kings Fund suggest that has risen since 2014/15, when local authorities have sought to protect
adult social care budgets, but in real terms, the level of expenditure nationally in 2017/18 was still
£700 million below the level of 2010/11, with increasing demand for services (Page 16)
• For Wirral, the social care income sources, show an almost 12% increase (from £50.24 million to
£56.12 million) between 2016/17 and 2018/19 whilst other North West Local Authorities show an
increase of 6% increase over those three financial years (Page 16)
• Nationally, local authorities have increased spending on adult social care in the past two years, but
the cost to them of providing residential and nursing care and home care has risen at more than the
rate of inflation. At the same time, the cost of providing care for older residents has grown faster
than that for working-age adults (Page 17)
• For Wirral there have been significant increased average weekly unit costs between 2016/17 and
2018/19 for the provision of both long-term residential and long-term nursing care to support both
working age adults and those aged 65+, and greater increased costs than both North West and
England as comparator areas (Page 19)
Wirral Intelligence Service: This is Wirral January 2020 4 of 48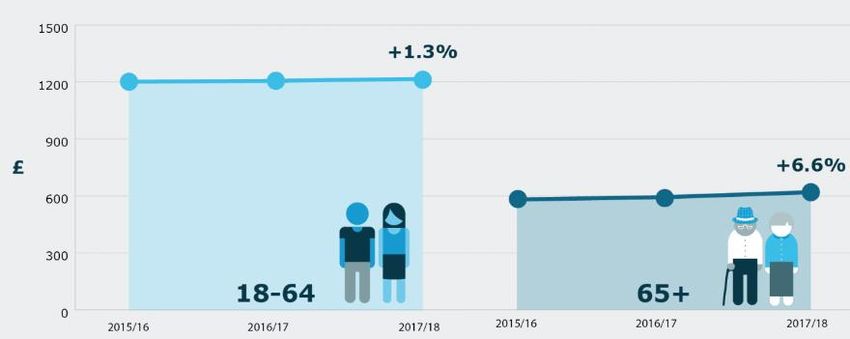
•      The number of care home and residential beds available for people aged over 75, as the main
       users, has declined consistently in the past few years and compared to population the number of
       nursing home beds has remained flat while the number of care home beds has fallen. For Wirral it is
       a similar picture with the number of care home beds and nursing home beds generally following a
       similar national trend as reducing over time but higher relative numbers than England (Page 21)

•      Both vacancy and turnover rate in Social Care and the NHS jobs has been increasing nationally
       since 2012/13 though, in most situations, both vacancy and turnover rates are lower in Wirral than
       nationally (Page 23)

•      Nationally more carers are receiving ‘information, advice and other universal services/signposting’
       from local authorities, but other types of support have not increased. Data for Wirral between
       2016/17 and 2018/19 suggests that in many cases there has been a reduction across all types of
       support from the local authority (Page 24)

•      Nationally, more carers are receiving Carer’s Allowance, and this is the case for Wirral too with a
       steady increase in residents in receipt of this payment since 2010 from 4,360 to 6,370 in November
       2018 (latest published data), or 46% increase in 8 years (Page 25)

•      For Wirral just above two-thirds of care services are rated by Care Quality Commission as good
       (64.7%) and outstanding (2.4%) and this is below the national result (79% in 2018) with those
       providers and venues requiring improvement locally at 18.2% and above the national figure of 17%
       in 2018 (Page 26)

•      Service users' satisfaction with the care funded by local authorities appears to have remained
       consistently high over the past four years, and in 2018/19 those saying they were either extremely
       or very satisfied for Wirral at 64.8%, then at 65.0% for North West Local Authorities and 64.3% for
       England (Page 28)

•      The proportion of Wirral service users using direct payments jumped substantially in 2018/19 to
       26.3% from 21.9% in 2017/18 and closer to England (28.3%) and above North West region
       comparators (25.4%) (Page 30)

•      The overall number of Wirral residents entering residential or nursing care homes has increased in
       recent years for working age adults (aged 18 – 64) unlike nationally where this is a static figure with
       reductions for those aged over 65 years, which are similar to national outcomes though a much
       greater fall in the same three year period, albeit from a higher starting figure (Page 31)

•      For Wirral, 2018/19 data for delayed transfers from hospital due to social care (all three measures)
       suggests a positive picture for Wirral when ranking better (lower) or equal to both North West and
       England figures (Page 33)

•      In 2018/19 Wirral was similar to both North West and England in proportion of older people (65+)
       accessing reablement service on discharge from acute or community hospitals, but whilst this has
       remained steady over three years for England and North West then this has been falling for Wirral
       since 2015/16 (Page 34)

•      Wirral has slightly higher rates for Continuing Health Care (CHC) and NHS Funded Nursing Care
       (FNC) when compared to NHS England North (Cheshire and Merseyside) Commissioning
       organisations but higher again than England for both CHC and FNC. Between 2017/18 and 2018/19
       reduced its rates for FNC (202.84 to 188.50) but with an increase in CHC (Page 35)

•      The number of Disabled Facilities Grants nationally increased in 2016/17 to recover to 2010/11
       levels with Wirral, between 2016/17/ to 2018/19, significantly higher than national figures (Page 36)

    Wirral Intelligence Service: This is Wirral               January 2020                              5 of 48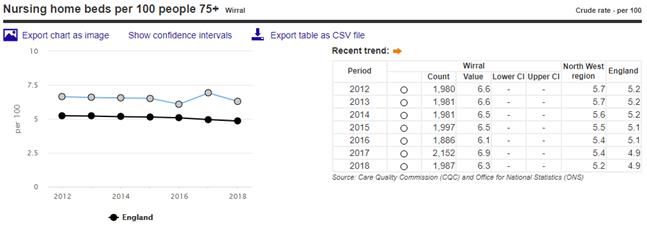
Infographics

 Wirral Intelligence Service: This is Wirral   January 2020   6 of 48
What do we know?

Introduction

Many people think of adults as being vulnerable if they’re permanently or temporarily unable to
care for themselves and their interests, either through a mental or physical cause.
Vulnerable adults are open to risks of psychological and physical harm or being exploited for
other people’s benefit.

Definition
The following groups of people could be considered as ‘vulnerable adults’:
 • older people who are physically or mentally frail
 • people with learning disabilities
 • people with a mental health condition such as dementia or personality disorder
 • people who are ill and need help to carry out normal daily functions
 • people with physical disabilities
 • people who have undergone a recent trauma – a bereavement, a divorce or loss of a job,
     for instance
 • people who, for whatever reason, are in abusive relationships or are homeless.

But care needs to be taken about who are considered ‘vulnerable’. Just because someone is, for
instance, older, or has a mental health condition or a learning disability, or has a physical
disability, they are not necessarily ‘vulnerable’. Indeed, they may take great offence if you were to
consider them so. Everyone needs to be wary of applying ‘labels’ to the people in our care.
it is also important to recognise that being vulnerable isn’t necessarily a long-term state. People
who come into hospital for operations, for instance, will be very vulnerable immediately before,
during and after the operation when they are not able to care for themselves and rely on health
care staff to protect them and ensure their well-being. But in the vast majority of cases they will
soon be completely independent again, so the vulnerable state is only temporary.

Emerging themes for Social Care and Vulnerable Adults

The Kings Fund published a review into social care in April 2019, Social care 360, which set out
key trends in adult social care and aimed to seek out themes in social care which drew on a wide
range of reliable data sources in order to provide a comprehensive ‘360 degree’ view of adult
social care services in the UK.

Kings Fund researchers have identified some key aspects when examining national data that
suggest there are significant challenges for our care and support system now and in the future.
They are:
  • One of the key areas of the review highlights the consistent rise over the last decade in the
     number of working age adults identifying themselves as having a disability. The Family
     Resources Survey shows a consistent rise over the last decade in the number of working-
     age adults identifying themselves as having a disability. More working-age people are
     approaching local authorities for support, and more are getting it and more working-age
     adults are claiming disability benefits (indicator 5).

  •   This prevalence of disability is increasing among working-age adults is not reflected within
      the demographic of older people. The indicators used by Kings Fund suggest that need for
      social care measured as the proportion of the population is stable, or even falling.

 Wirral Intelligence Service: This is Wirral           January 2020                          7 of 48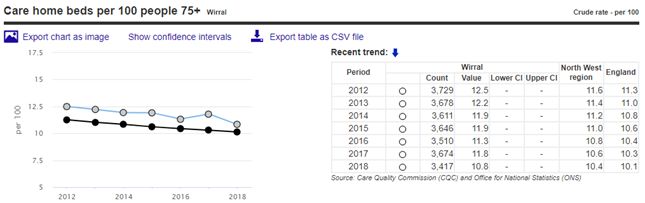
•   However, the number of older people is growing significantly and with projections that these
     aged 65+ will increase more sharply in coming decades alongside evidence from this
     research that a significant amount of need among older people may not be being met.

 •   NHS data suggests rises in the number of emergency admissions for patients aged 85
     years or older and in admissions for patients with multiple health conditions. This could
     relate to variations in investment in necessary preventive services. The investment present
     is not decreasing, but is starting form a low point, yet increases in the number of support
     grants offered and strong evidence for the effectiveness reablement services, the issue
     appears to be the initial low levels of existing funding.

 •   A third theme identified is the area around local authority and central government spending
     – with a tendency that indicators that relate to local authority spending remain the same or
     decline while those driven by central government are more likely to increase. For example,
     nationally the number of carers supported by local government has fallen over the past four
     years while the number receiving Carer’s Allowance, a national benefit, has nearly doubled.

 •   Since 2015/16, the take-up of disability benefits by under-65s has also risen more than the
     take-up of long-term care provided by local authorities, and take-up of disability benefits
     among over-65s has fallen less.

There are some caveats to Kings Fund report that need recording:
 • There are, of course, a number of factors that impact this, including wide local variation that
     is not explored as part of the review.

 •   Their research also notes that the rate of take-up of NHS Continuing Healthcare (as well as
     NHS Funded Nursing Care) is declining and that there has been a small increase in the
     number of young people going into residential care, but the reasons are unclear.

 •   It is also important to point out that we are generally reporting measures of output rather
     than outcome. In terms of service delivery, this means we are reporting on the numbers
     receiving social care services at a time when – as we show – many local authorities have
     criteria thresholds which direct people to local support for their needs or to access social
     care services.

 •   See rest of Emerging Themes section of Kings Fund Adult Social Care 360 degrees
     https://www.kingsfund.org.uk/publications/social-care-360

In the next section the national data collated by Kings Fund research is presented alongside local
content to consider similarities and differences to the reported aspects when reflecting in our
local support for vulnerable adults and social care services.

 Wirral Intelligence Service: This is Wirral          January 2020                           8 of 48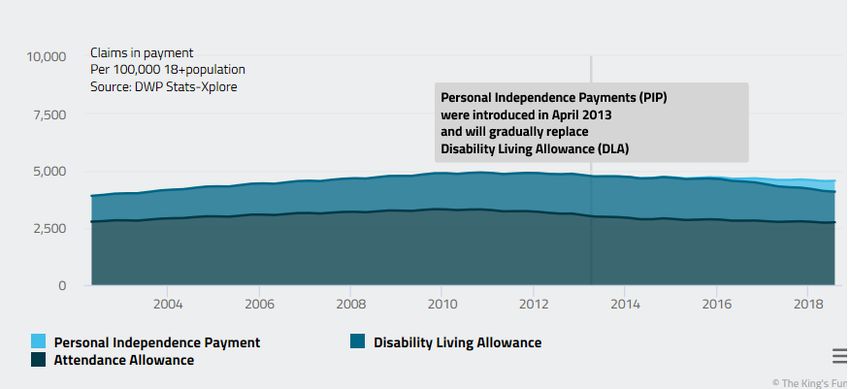
Comparing identified national issues to local situation

Identified issue: Working age adults increasingly ask for help

Figure 1: Requests for social care support from new clients, rate per 100,000 population,
indexed to 2015/16*

Source: Kings Fund 2019 from Adult Social Activity and Finance Report, NHS Digital (2019)
Notes: *Though data for this indicator are available from 2014/15, local authorities advised NHS Digital of
issues with its collection for that year. As a result, this and other analysis in this review only uses data
from 2015/16 onwards.

Figure 1 suggests that nationally the rate of new requests is increasing from working age adults
but falling from older people. In figure 2, points to this possible national phenomenon is also
being played out locally. With new clients support requests for 18 – 64 years increasing from
1,275 per 100,000 population to 1,560 with North West and England also reflecting this growing
number. While new client support requests for over 65 years in Wirral have fallen from 13,455 in
2016/17 to 11,805 per 100,000 population, while North West and England have remained
relatively static. It should be noted that local data suggests for 2018/19 Wirral had lower rates of
requests for support than both North West Local Authorities and England.

Figure 2: Requests for support from new clients, by age group, as a rate per 100,000 population,
for Wirral and comparators, 2016/17 to 2018/19

Source: Adult Social Activity and Finance Report, NHS Digital (2019)

  Wirral Intelligence Service: This is Wirral                           January 2020                           9 of 48
Identified issue: Older people are less likely to be getting support

Figure 3: Number of clients accessing support, rate per 100,000 population, indexed to 2015/16

Source: Kings Fund 2019 from Adult Social Activity and Finance Report, NHS Digital (2019)

Data presented in figure 3 above suggests that short term care for 18 to 64 year olds has
increased most over that 3-year period between 2015/16 and 2017/18 whereas as long term care
for the same age-group has only slightly increased. Both short term and long term care for those
aged over 65 years has fallen in this period between 2015/16 and 2017/18.

Wirral data, in figure 4, suggests that between 2016/17 and 2018/19 that long term care at a
Wirral and North West level has remained static or fallen slightly. This is equally true for short
term care at a North West regional level but not for short term care on a Wirral footprint. This has
seen the percentage of requests for support from new clients (for Long Term and Short Term
care specifically) falling from 17% (2016/17) to 11% (2018/19) for those aged 18 to 64 years and
from 37% (2016/17) to 27% (2018/19) for those aged over 65 years.

Figure 4: Percentage of requests for support from new clients, for Long Term and Short Term
care, for Wirral and North West, 2016/17 to 2018/19

Source: Adult Social Activity and Finance Report, NHS Digital (2019)
Notes: Through the hyperlink above – go to page 5 of 14 in 2016/17, 2017/18 and 2018/19 Activity and Finance Interactive
Report (Power BI) of Adult Social Activity and Finance: Comparator Report

 Wirral Intelligence Service: This is Wirral                        January 2020                                     10 of 48
Kings Fund suggest some reasons that may be relevant at a national, and potentially, local level,
for these differences and could include
  • less financial eligibility,
  • potential service users are being signposting to alternate measures before a formal request
      is made
  • public perception of the quality or availability of social care
  • less need of the older population who may have less disability
  • increased need in 18 to 64 age group due to medical advances, people are surviving into
      adulthood with complex, lifelong conditions that may nonetheless require ongoing social
      care support and
  • increased awareness by wider public of such aspects as ‘hidden’ disabilities such as autism,
      and of mental health conditions, which may lead more people to approach local authorities
      for support

Identified issue: Fewer people now qualify for council social care support because
financial thresholds have remained the same since 2010/11

Figure 5: Number of clients accessing support, rate per 100,000 population, indexed to 2015/16

Source: Kings Fund 2019

Since 2010/11, these means test thresholds for the social care financial assessment have not
been increased in line with inflation; if they had, the Kings Fund estimate the upper threshold
would now be £2,811 higher at £26,061.

So, people whose assets today are between £23,250 and £26,061 have effectively lost their
eligibility for publicly funded social care support.

They will either have to pay for their care themselves, rely on informal care from friends and
family – or go without. This is likely to affect older people rather than working-age adults, as they
have had more lifetime opportunity to build up the level of savings or property that would leave
them above the threshold. Working-age adults may be affected by the similar failure to raise the
minimum income guarantee since 2015.

 Wirral Intelligence Service: This is Wirral           January 2020                           11 of 48
This is the amount of weekly income with which home care users must be left after local
authorities have charged them for social care services. However, unlike for residential care,
individual local authorities can adopt more generous charging policies for home care if they
choose. At this moment Wirral charges 100% of expendable income after all the required
deductions and discretionary allowances have been made. The lower and upper thresholds are
statutory, therefore Wirral charges at the highest level possible.
Identified issue: There’s conflicting evidence on need
Kings Fund research points to the fact that publicly funded social care is available only to people
with high enough needs. But identifying the incidence of need in the population is far from
straightforward.
Figure 6: Percentage of people with a disability, National, 2010/11 – 2017/18
Source: Kings Fund 2019from Family Resources Survey 2018
The Family Resources Survey asks 19,000 households about levels of disability, defined as ‘a
long-standing illness, disability or impairment which causes substantial difficulty with day-to-day
activities’ (see figure 6 above).
The 2017/18 report highlighted:
• 44 per cent of pension-age adults reported a disability, slightly down from 45 per cent in
2010/11.
• However, the percentage of working-age adults has increased over the same period from
15 per cent to 18 per cent.
The Office of Budgetary Responsibility analysis of this data finds that the proportion of disabled
working age adults reporting mental health conditions increased from 24 per cent to 36 per cent
in the five years to 2016/17.
For Wirral, using the same Family Resources Survey and Office for National Statistics population
data (see figure 7 below), it is estimated that 67,739 people in Wirral had some form of a
disability in 2018. This figure consists of 4,730 children, 31,594 working-age adults and 31,415
state pension age adults. This is an increase of almost 9,000 people since 2011, when there was
estimated to be 59,028 people having a disability.
Figure 7: Estimated number of people with a disability, Wirral, 2011 – 2018
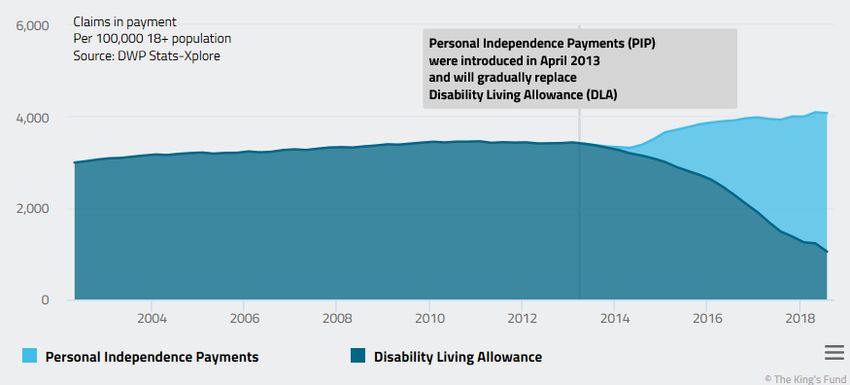
Wirral Intelligence Service: This is Wirral January 2020 12 of 48Source: Family Resources Survey 2018 and Office for National Statistics 2019 Identified issue: Overall, a higher proportion of people is receiving disability benefits Kings Fund suggest in their research that long-term, receipt of disability benefits has increased among working-age adults, though it has now fallen among older people. Despite a growing older adult population, the number of these older adults claiming a disability benefit has remained flat unlike working age-adults that is climbing (see figure 8a). Figure 8a: Payment claims for Disability Living Allowance, Personal Independence Payment and Attendance Allowance per 100,000 18 years+ population, 2018/19 Source: Kings Fund 2019 from DWP Stats-Xplore 2018 The proportion of people who claim disability benefits such as Disability Living Allowance, Personal Independence Payment and Attendance Allowance is a useful further indicator of the rate of disability in the population and therefore of the need for social care (though it can also, of course, be influenced by other factors such as changes to eligibility criteria). Figure 8b: Payment claims for Disability Living Allowance and Personal Independence Payment per 100,000 population, those aged 18 years+, for England, from 2002 to 2018 Wirral Intelligence Service: This is Wirral January 2020 13 of 48
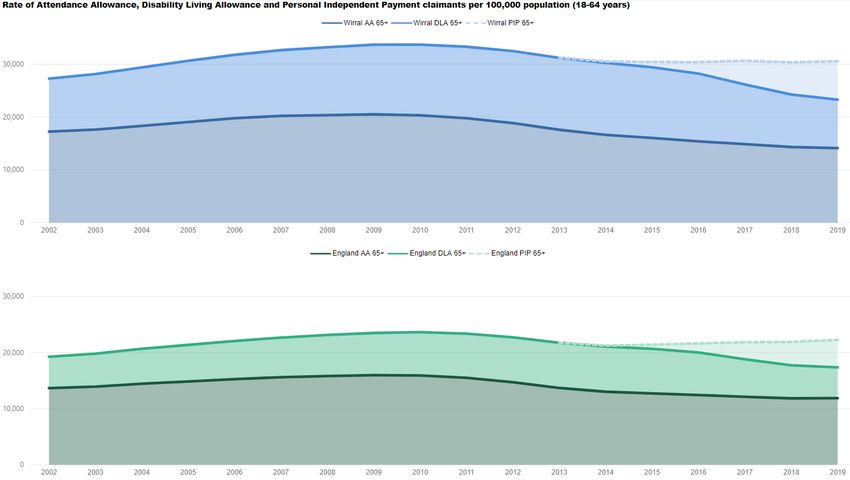
Source: Kings Fund 2019 from DWP Stats-Xplore 2018

  •   Figure 8a and figure 8b above show that a greater proportion of working-age people are
      now receiving disability benefits than in 2002, and the upturn has been greatest since the
      phased replacement of Disability Living Allowance (DLA) by Personal Independence
      Payment (PIP) in 2013 (though there have been some changes in the types of conditions
      most likely to be supported and this analysis focuses on the numbers of people receiving
      benefits, not the expenditure on them). This growth is consistent with the increasing
      proportion of working-age people reporting disability in the Family Resources Survey

  •   In 2017/18 there were 2.4 million people receiving disability benefit compared to 2.6 million
      in 2009/10

  •   This trend could be explained by a reduction in the prevalence of disability, as suggested by
      the Health Survey for England. However, the Office for Budgetary Responsibility observes it
      may also reflect a recent absence of benefit take-up promotion, as was done for pension
      credit after its introduction in 2003, for example.

Figure 9a: Rate of payment claimants per 100,000 residents for Disability Living Allowance and
Personal Independence Payments, aged 18 – 64 years, for Wirral and England, 2002 to 2019

 Wirral Intelligence Service: This is Wirral          January 2020                          14 of 48
Source: Kings Fund 2019 from DWP Stats-Xplore 2018 Figure 9a above suggests that Wirral has followed a similar pattern to England with increasing working age claimants since PIP payments replaced disability living allowance and then PIP increasing since 2014. It can be seen in figure 9b that, although there is a less pronounced fall for Wirral, that the area still has followed England and seen a reduction in DLA and AA claimants aged over 65. Figure 9b: Rate of payment claimants per 100,000 residents for Attendance Allowance, Disability Living Allowance and Personal Independence Payments, aged 65+, for Wirral and England, 2002 to 2019 Source: Kings Fund 2019 from DWP Stats-Xplore 2018 Identified issue: Spending has fallen in real terms Wirral Intelligence Service: This is Wirral January 2020 15 of 48
In 2017/18, total expenditure on adult social care by local authorities was £21.3 billion, up £684
million (3.3 per cent) from the previous year. However, while local authorities have sought to
protect adult social care budgets, in real terms, expenditure is still £700 million below the level of
2010/11, despite increasing demand for services (see figure 10 below).

Figure 10: Total Expenditure on adult social care, UK, 2010/11 – 2017/18

Source: Kings Fund 2019 from Adult Social Care Activity and Finance Report via NHS Digital 2018
Key aspects include:
 • Local authorities now spend nearly as much money on long-term care for working-age
     adults as for older people, though these percentages are essentially unchanged in the last
     three years.
 • The Local Government Association estimate, of the sources of council expenditure on adult
     social care, client contributions 13.1 per cent; government grants 14.7 per cent; other
     income (NHS partnerships) 15.5 per cent; business rates 18.1 per cent; council tax 38.6 per
     cent (potential to raise more income from council tax through an additional 'social care
     precept').

Figure 11: Social Care income sources, UK, 2015/16 – 2017/18*

Source: Kings Fund 2019 from Adult Social Care Activity and Finance Report via NHS Digital 2019
Notes: *all costs adjusted to reflect 2017/18 prices to aide comparison

Figure 11 above shows that, for the three years for which this information is available, income
from the NHS has increased, client contributions – the fees and charges that local authorities levy
on service users after means testing – have also increased by more than inflation, despite a
reduction in the number of people receiving services.
Kings Fund ask us to note:

 Wirral Intelligence Service: This is Wirral                       January 2020                   16 of 48
• There is variation between local authorities in how much they spend, at least part of which
stems from differences in the level of central government support to their central budgets,
their ability to raise money locally and the level of need in the local population.
• The data above does not include private spending on care, for which there are no reliable
estimates of trends (though the National Audit Office estimates the total size of the self-
funder market at £10.9 billion in 2016/17). There is also significant expenditure on disability
through the benefits system
For Wirral, the social care income sources, as seen in figure 12 below, shows an almost 12%
increase (from £50.24 million to £56.12 million) between 2016/17 and 2018/19 with increased
amounts from Client Contributions and other income but predominantly from income from NHS
sources. There has been change in that period (2016/17 to 2018/19) to social care income for
other North West Local Authorities as well.
In the North West region there were increases in Client Contributions, income from NHS and
Other Income that equated to a 6% increase over those three financial years.
Figure 12: Social Care income sources*, Wirral and North West Region, 2016/17 – 2018/19
Source: Adult Social Care Activity and Finance Report via NHS Digital 2019
Notes: *all amounts should be multiplied by 1,000 to reach their actual cost
Identified issue: across UK it is costing councils more to buy care
Though local authorities have increased spending on adult social care in the past two years, the
cost to them of providing residential and nursing care and home care has risen at more than the
rate of inflation. At the same time the cost of providing care for older residents has grown faster
than for working-age adults.
Between 2015/16 and 2017/18 the average weekly unit cost for providing residential and nursing
care to over 65s increased by 6.6 per cent to £615 and the average for under 65s increased by
1.3 per cent to £1,225 (see figure 13 below).
Kings Fund recognise that these figures relate purely to local authority expenditure; there is less
information about the costs to self-funders of residential and nursing care, though the
Competition and Markets Authority estimates that on average they pay 41 per cent more than
local authorities for the same level of care.
Figure 13: Average weekly unit cost of providing care, UK, 2015/16 – 2017/18*
Wirral Intelligence Service: This is Wirral January 2020 17 of 48Source: Kings Fund 2019 from Adult Social Care Activity and Finance Report via NHS Digital 2019
Notes: *all costs adjusted to reflect 2017/18 prices to aide comparison
Key considerations:
• An underlying factor in the increased spending by local authorities may be increased costs
faced by providers, for example arising from increases in the national living wage.
• Additionally, local authorities may feel they need to pay providers more in order to stabilise
the market following closures and withdrawals.
• An additional or alternative explanation for rising costs is that residents require increasing
amounts of support because only those with highest needs enter residential or nursing care
in the first place. This in turn may be because more people are being cared for at home.
• While far fewer working-age adults are in residential care, their costs are significantly higher
than those for over 65s. This may be due to the type and higher level of support provided
(around 45 per cent of working-age people have a learning disability as their primary reason
for support, compared to just 3 per cent of over 65s).
• Unit costs for the provision of care at home have also been increasing. The Kings Fund
research suggests that national rates paid by councils for externally-provided home care
averaged £16.04/hour in 2017/18, compared to a rate of £15.82/hour in 2016/17, when
adjusted for inflation.
• However, the rate of increase has fallen compared to 2015/16 and the average rate remains
well below the £18.93 minimum put forward by the United Kingdom Home Care Association,
which represents home care providers.
• Care provided in-house by local authorities is significantly more expensive than that which is
externally commissioned. The unit costs for in-house provision of long-term residential care
were on average £1,785 for younger people and £933 per week for older people in 2017/18,
compared with external provision at £1,263 and £591 respectively.
• The hourly cost of in-house home care rose from £25.60 to £32.90 between 2016/17 and
2017/18. The additional cost of in-house home care provision may at least partly be
because many reablement services – which are more expensive to provide than standard
home care – are still provided in-house.
Wirral data on the average weekly cost of long term residential and long term nursing care can be
seen in figures 14a and 14b below.
Figure 14a: Average weekly unit cost of providing long-term nursing care for Wirral residents and
comparator areas between 2016/17 and 2018/19
Wirral Intelligence Service: This is Wirral January 2020 18 of 48Year Age Wirral North West England
2018/19 18-64 £ 835 £ 857 £ 976
65+ £ 734 £ 617 £ 678
2017/18 18-64 £ 1,331 £ 817 £ 920
65+ £ 868 £ 576 £ 637
2016/17 18-64 £ 820 £ 796 £ 911
65+ £ 385 £ 517 £ 606
Source: Adult Social Care Activity and Finance Report via NHS Digital 2019
For long term nursing care for working age adults (18 – 64) this rose by over 60% from an
average weekly cost of £820 in 2016/17 to £1,331 in 2017/18 then in 2018/19 to return to
2017/18 levels at £835. Also, average costs for long term nursing in Wirral were lower in 2019/19
at £835 compared to North West at £857 and England at £976. Both England and North West
see steadily rising costs over this 3-year period and similarly for Wirral albeit that costs are rising
but a more erratic trajectory.
For long term nursing care residents aged 65+ in Wirral then the average cost has risen over
90% from £385 in 2016/17 to £734 in 2018/19. Wirral in 2018/19 had higher average costs (£734)
than both North West (£616) and England (£678) when in 2016/17 Wirral was lower (£385) than
North West (£517) and England (£606).
Again, both England and North West have experienced a steady rise in costs over this 3-year
period but the increase in Wirral costs has been a far steeper trajectory.
Figure 14b: Average weekly unit cost of providing long term residential care for Wirral residents
and comparator areas between 2016/17 and 2018/19
Year Age Wirral North West England
2018/19 18-64 £ 1,177 £ 1,150 £ 1,320
65+ £ 547 £ 559 £ 636
2017/18 18-64 £ 1,392 £ 1,090 £ 1,274
65+ £ 669 £ 526 £ 604
2016/17 18-64 £ 732 £ 1,001 £ 1,235
65+ £ 322 £ 490 £ 565
Source: Adult Social Care Activity and Finance Report via NHS Digital 2019
For long term residential care for working age adults (18 – 64), Wirral average unit costs
increased substantially between 2016/17 at £732 to £1,392 in 2017/18 to fallback slightly in
2018/19 to £1,177 but still over 60% higher than 2016/17 levels. Increases were also apparent at
North West and England level with Wirral now slightly higher than North West authorities but
lower than the England figure considering 2018/19 data. This compares to 2016/17 when Wirral
costs were substantially lower than both North West and England.
For long term residential care residents aged 65+, Wirral costs increased by over 100% from
£322 (average weekly cost) in 2016/17 to £669 (average weekly cost) in 2017/18 to then fall back
slightly in 2018/19 to £547 (average weekly cost). This 2018/19 average weekly unit cost of £547
for Wirral is still lower than both North West (£559) and England (£636) but is almost 70% higher
than 2016/17 costs whilst in that time North West costs have increased by 14% and England by
almost 13%.
Identified issue: nationally there are fewer residential and nursing homes places available
for older people
Wirral Intelligence Service: This is Wirral January 2020 19 of 48The number of beds available for people aged over 75, as the main users, has declined
consistently in the past few years and compared to population the number of nursing home beds
has remained flat while the number of care home beds has fallen (figure 15).
Figure 15: Number of beds per 100 people aged over 75, UK, 2012 to 2018
Source: Kings Fund 2019 from Public Health England (2019)
Key considerations:
• Overall nationally there appears to be slightly fewer care beds available now compared to
2012, with a small increase in beds in nursing homes offset by a slightly larger decrease in
beds in care homes.
• Availability of beds for the increasing numbers of older people have declined from around
11.3 beds in care homes per 100 people aged 75+ to 10.1. Beds in nursing homes have
shown a smaller decline.
• The fall in bed availability may reflect the gradual change in social care policy, which has
shifted towards providing care at home rather than in residential care.
• There has also been a significant change in care home ownership in the past few decades:
in 1984, 57 per cent of places were in local authority-run residential homes but by 2017 this
had fallen to just 8 per cent.
For Wirral in figure 16 and figure 17 below the number of care home beds and nursing home
beds are generally following a similar national trend reducing over time but locally there has been
increases in 2017 to drop lower again in 2018.
Figure 16: Number of care home beds per 100 people aged over 75, Wirral and comparators,
2012 to 2018
Wirral Intelligence Service: This is Wirral January 2020 20 of 48Source: Public Health England (2019) Figure 17: Number of nursing home beds per 100 people aged over 75, Wirral and comparators, 2012 to 2018 Source: Public Health England (2019) Identified issue: There are more jobs in the care sector Adult social care is a large and growing sector in England: nearly 1.5 million people work in an estimated 1.6 million jobs (1.1 million full-time equivalents) in around 21,000 organisations, according to social care workforce intelligence body, Skills for Care. The number of jobs has increased by around 275,000 since 2009 but the rate is slowing: the workforce grew by only around 15,000 a year between 2014 and 2017 compared to an average of 45,000 a year between 2010 and 2014. The annual growth in social care jobs has broadly tracked the growth in the older population in England. On average, one adult social care job is needed for every seven people over 65 and every three people over 75. If the number of jobs does continue to grow in line with the growth in the older population, the implications are stark: Skills for Care estimates the need for between 650,000 and 950,000 new adult social care jobs by 2035 and subsequent difficulty in finding people to fill these potential posts. Identified issue… nationally vacancies are growing The vacancy rate in social care has been increasing and is similar to the vacancy rate in the NHS. Overall around 8 per cent of jobs are vacant and 390,000 staff leave their jobs each year. Wirral Intelligence Service: This is Wirral January 2020 21 of 48
Industry workforce body Skills for Care (on whose data the section in the Kings Fund report is
based) estimate that on average around 110,000 jobs, or 8 per cent, are vacant in adult social
care at any one time and similar to vacancies in the NHS and much higher than the 2.8 per cent
figure for the economy as whole. Turnover of staff is also high at 30.7 per cent, equivalent to
around 390,000 leavers over a year (figure18).

Figure 18: Vacancy rates for NHS and Social Care employment, UK, 2012/2013 to 2017/2018

Source: Kings Fund 2019 from Skills for Care, NHS Improvement and Office for National Statistics, 2018

Kings Fund consider this part of a long-term trend that has seen the vacancy rate rise since
2012/13. In 2016/17 the average vacancy rate was 20,000 lower at 90,000.

Turnover rates have also increased steadily, from 23.1 per cent in 2012/13 to 30.7 per cent in
2017/18 – a worrying number, particularly since continuity of caregiver is an important factor for
people who receive care.

Key considerations:
   • residential care has generally had a lower vacancy rates than home care
   • This is despite their pay rising since the introduction of the national living wage in 2016 –
      in 2018 the average increase in care worker pay was 5.2% (2.7% in real terms).
   • the rise has not necessarily made the sector more competitive with other industries. At
      £7.89, the average hourly rate for a care worker in the independent sector is far lower than
      that of store assistants in supermarkets such as Aldi, which pays £10.55 inside the M25
      area and £9.10 outside.
   • Though the lowest paid care workers have seen an increase, the industry’s pay bill as a
      whole increased by only one percent, with 30 per cent of care workers now paid in the
      bottom decile of the pay scale compared to just 10 per cent in 2016.

This is the latest information available from the Adult Social Care Workforce Data Set (ASC-
WDS), taken from local authorities as at September 2018 and from independent sector
employees as at March 2019. This suggests for Wirral that:
   - Vacancy rate
           • All services – 6% (Nationally 7.8% - all job roles)
           • Care Home with nursing – 4% (Nationally 6.3% - all job roles)
           • CQC Non-residential – 11% (Nationally 10.6% - all job roles)

 Wirral Intelligence Service: This is Wirral                        January 2020                         22 of 48
- Turnover rate
• All services – 27% (Nationally 30.8% - all job roles)
• Care home with nursing – 26% (Nationally 31.5% - all job roles)
• CQC Non-residential – 30% (Nationally 38.8% - all job roles)
Also see Wirral Report from Adult Social Care Workforce Data Set
Identified issue…nationally the picture of carer support is mixed
Unpaid carers do the work of an additional four million paid care workers. There are two main
statutory sources of support for them: local authorities offer financial support, services and
advice; a national benefit,
Carer’s Allowance is available to those caring for people receiving disability benefits. More carers
are receiving Carer’s Allowance but the number receiving direct support from local authorities is
falling (figure 19). More carers are receiving ‘information, advice and other universal
services/signposting’ from local authorities, but other types of support have not increased.
Figure 19: Number of carers receiving direct support from their local authority, UK, 2015/2016 to
2017/2018
Source: Kings Fund 2019 from Adult Social Activity and Finance Report, NHS Digital (2019)
Data for Wirral between 2016/17 and 2018/19 (figure 20) suggests that in many cases there has
been a reduction across all types of support from the local authority
Figure 20: Number of carers receiving direct support from Wirral Council, 2016/17 to 2018/2019
Wirral Intelligence Service: This is Wirral January 2020 23 of 48Source: Kings Fund 2019 from Adult Social Activity and Finance Report, NHS Digital (2019) Notes: CASSR is Councils with Adult Social Services Responsibilities At the same time nationally the number of people receiving Carer's Allowance has been increasing (figure 21). Figure 21: Number of people in payment of Carer’s Allowance, UK, 2004/05 to 2017/18 Source: Kings Fund 2019 from DWP Stats-Xplore 2018 Key considerations: Wirral Intelligence Service: This is Wirral January 2020 24 of 48
•   Information, advice and signposting makes up the majority of direct support received by
      carers (64.7 per cent in 2017/18).
  •   By contrast, the number of people claiming Carer’s Allowance has been steadily increasing
      over this period (and, in fact, well before it), with an additional 29,000 nationally receiving
      the benefit between February 2017 and February 2018.
  •   The increase in numbers receiving Carer's Allowance will also have been influenced by an
      increase in the numbers of people claiming the qualifying disability benefits and by changes
      to state pension entitlement, which mean that some women must wait longer to claim their
      pension but are able to claim Carer's Allowance

Nationally, more carers are receiving Carer’s Allowance and this is equally the case for Wirral
where there has been a steady increase in residents in receipt of this payment since 2010 from
4,360 to 6,370 in November 2018 (latest published data), or 46% increase in 8 years (figure 22
below).

Figure 22: Number of people in receipt of Carer’s Allowance payment, Wirral, 2010 to 2018

Source: DWP NOMIS 2019

Identified issue: Care quality appears to be rising
More services are rated good or outstanding, though Kings Fund suggest caution about the
apparent improvement. The 2018 State of Care report (used for comparison by Kings Fund), the
Care Quality Commission (CQC) says the overall quality of social care has improved slightly.

Its data, in figure 23 below, shows a higher percentage of services rated good or outstanding for
each of the past three years.

Though these results should also be considered in terms of
  • how long ratings remain in place (longer for good and above)
  • rated inadequate services are more likely to close
  • Smaller care homes have higher ratings and may relate to those how are resident
  • Inspections are snapshots of performance
  • Level of support offered to local providers
Figure 23: Percentage of care services rated as outstanding, good, requires improvement or
inadequate, UK, 2016 to 2018

 Wirral Intelligence Service: This is Wirral           January 2020                           25 of 48
Source: Kings Fund 2019 from Care Quality Commission 2019
For Wirral just above two-thirds of care services are rated as Good (64.7%) and Outstanding
(2.4%) when compared to data in the State Of Health Care and Adult Social Care in England
2018/19 report though this appears to be lower than national figures (79% in 2018) with those
requiring improvement locally (18.2%) above the national figure (17% in 2018) in figure 24
below.
Figure 24: Percentage of care services rated as outstanding, good, requires improvement or
inadequate, Wirral, 2019 (Latest Inspection List)
Rating Number Percentage (%)
Good 110 64.7
Requires improvement 31 18.2
No Rating 15 8.8
Inadequate 10 5.9
Outstanding 4 2.4
Total number of venues 170 100.0
Source: Care Quality Commission 2019
Notes: data source on CQC website - Active locations for providers registered under the Health and Social Care Act (HSCA) as
CQC care directory - with filters (December 2019)
Identified issue: nationally service users say they're satisfied
Service users' satisfaction with the care funded by local authorities appears to have remained
consistently high over the past four years, with approximately 65 per cent saying they are either
Wirral Intelligence Service: This is Wirral January 2020 26 of 48extremely or very satisfied. Fewer than 5 per cent say they are dissatisfied (see figure 25
below).
Figure 25: Percentage of respondents of combined questionnaire responses for annual adult
social care survey on Service users' satisfaction with the care funded by local authorities, UK,
2016 to 2018
Source: Kings Fund 2019 from Adult Social Care Outcomes Framework, NHS Digital (2019)
Key considerations:
• One interpretation of this data is therefore that, despite declining budgets, local authorities
have managed to protect the services they provide to – an admittedly declining number of –
individuals who are eligible for services.
• The bi-annual survey of adult carers, which asks about satisfaction not only with services for
carers themselves but also with services provided to the person they care for sees only 39
per cent (in 2016/17) extremely or very satisfied
• Local Government Ombudsman (LGO) data showing a rising number of complaints about
adult social care.
• The is some variation between different groups responding to the survey. People over 65
report lower levels of satisfaction than those aged 18–64. Black and minority ethnic people
also report lower levels of satisfaction than white respondents. People in residential care are
more likely to be satisfied than those receiving nursing or community care services.
• There is no data available about the satisfaction of people who fund their own care services
(including any who no longer receive publicly-funded care).
For Wirral the results are very similar to comparator areas with Wirral at 64.8% for overall
satisfaction of people who use services with their care and support and 65.0% for North West
Local Authorities and 64.3% for England (Figures 26a and 26b)
Figure 26a: Percentage of respondents of combined questionnaire responses for annual adult
social care survey, 3A as overall satisfaction of people who use services with their care and
support, Wirral and comparator areas, 2014/15 to 2018/19
Wirral Intelligence Service: This is Wirral January 2020 27 of 48Source: Adult Social Care Outcomes Framework, NHS Digital (2019) Figure 26b: Percentage of respondents of combined questionnaire responses for annual adult social care survey, 3A as overall satisfaction of people who use services with their care and support, Wirral and comparator areas, 2014/15 to 2018/19 Source: Adult Social Care Outcomes Framework, NHS Digital (2019) In terms of those responses to question 3B of the Adult Social Care Outcomes Framework (ASCOF) survey that considers overall satisfaction of carers with social services then the results mirror those suggested results as stated above (see figure 27 below) however they satisfaction is lower but Wirral results are improving slightly over the 3-year period while both Regional and England scores have fallen. Figure 27: Percentage of respondents of combined questionnaire responses for annual adult social care survey, 3B, overall satisfaction of carers with social services for Wirral and comparator areas, 2014/15 to 2018/19 Wirral Intelligence Service: This is Wirral January 2020 28 of 48
You can also read