South Africa Country Operational Plan - (COP) 2018 Strategic Direction Summary March 22, 2018
←
→
Page content transcription
If your browser does not render page correctly, please read the page content below
South Africa
Country Operational Plan
(COP) 2018
Strategic Direction Summary
March 22, 2018
Public Version
Contents

List of Acronyms ......................................................................................................................................... 3
1.0 Goal Statement ...................................................................................................................................... 5
2.0        Epidemic, Response, and Program Context ................................................................................. 6
   2.1 Summary statistics, disease burden and country profile .............................................................. 6
   2.2 Investment Profile........................................................................................................................... 13
   2.3 National Sustainability Profile Update ......................................................................................... 17
   2.4 Alignment of PEPFAR investments geographically to disease burden ..................................... 17
   2.5 Stakeholder Engagement ............................................................................................................... 18
3.0 Geographic and Population Prioritization ....................................................................................... 19
4.0         Program Activities for Epidemic Control in Scale-Up Locations and Populations .............. 20
   4.1 Finding the missing, getting them on treatment, and retaining them...................................... 21
   4.2 Prevention, specifically detailing programs for priority programming .................................... 22
   4.3 Additional country-specific priorities listed in the planning level letter ................................. 24
   4.4 Commodities ................................................................................................................................... 25
   4.5 Collaboration, Integration and Monitoring ................................................................................. 25
   4.6 Targets for scale-up locations and populations .......................................................................... 27
5.0    Program Activities for Epidemic Control in Centrally Supported Locations and
Populations ................................................................................................................................................ 31
   5.1 Targets for attained and centrally supported locations and populations ................................. 31
6.0 Systems Support Necessary to Achieve Sustained Epidemic Control .......................................... 31
7.0 Staffing Plan ....................................................................................................................................... 33
APPENDIX A – Prioritization ................................................................................................................ 34
APPENDIX B – Budget Profile and Resource Projections ............................................................... 41
APPENDIX C – Tables and Systems Investments for Section 6.0 .................................................. 43

2|Page
List of Acronyms
Acronym   Definition
AGYW      Adolescent Girls and Young Women
AIDS      Acquired Immune Deficiency Syndrome
APR       Annual Program Results
ART       Antiretroviral Therapy
ARV       Antiretroviral (drug)
BAS       Basic Accounting System
CCMDD     Central Chronic Medicine Disease Dispensing and Distribution Programme
CDC       U.S. Centers for Disease Control and Prevention
CHW       Community Health Worker
CODB      Cost of Doing Business
COP       Country Operational Plan (PEPFAR)
COP18     2018 Country Operational Plan
DBE       Department of Basic Education
DoH       Department of Health
FBO       Faith-Based Organizations
FSW       Female Sex Workers
FTE       Full-Time Equivalent
FY        Fiscal Year
GBV       Gender-Based Violence
GFATM     Global Fund for AIDS, TB and Malaria
GoSA      Government of South Africa
HAST      HIV/AIDS, STIs, and TB (Directorate)
HIV       Human Immunodeficiency Virus
HSS       Health Systems Strengthening
HTS       HIV Testing Services
IM        Implementing Mechanism
LGBTI     Lesbian, Gay, Bisexual, Transgender and Intersex people
MSM       Men who have sex with men
NDoH      National Department of Health
NGO       Non-Governmental Organization
NHLS      National Health Laboratory System
NSP       South Africa National Strategic Plan for HIV, TB, and STIs, 2017-2022
OVC       Orphans and Vulnerable Children
PEPFAR    President’s Emergency Plan for AIDS Relief
PFIP      Partnership Framework Implementation Plan
PLHIV     People Living with HIV
PMTCT     Prevention of Mother to Child Transmission
PrEP      HIV pre-exposure prophylaxis
PWID      People Who Inject Drugs
SA        South Africa
SANAC     South African National AIDS Council
SI        Strategic Information
SID       Sustainability Index Dashboard
SIMS      Site Improvement Monitoring Systems
SOP       Standard operating procedures
SRH       Sexual and Reproductive Health
StatsSA   Statistics South Africa

3|Page
Acronym   Definition
STI       Sexually Transmitted Infections
TB        Tuberculosis
TLD       Tenofovir/Lamivudine/Dolutegravir fixed-dose combination (ARV)
TVET      Technical and Vocational Education and Training College
U.S.      United States
UNAIDS    Joint United Nations Programme on HIV/AIDS
UNICEF    United Nations International Children's Emergency Fund
USAID     United States Agency for International Development
USD       U.S. Dollars
USG       United States Government
VMMC      Voluntary Medical Male Circumcision
WHO       World Health Organization
ZAR       South African Rand

4|Page
1.0 Goal Statement
In February 2018 President Ramaphosa announced a bold plan to provide life-saving antiretroviral
therapy (ART) for 2 million additional people living with HIV (PLHIV) in South Africa (SA) by
2020. The government of SA (GoSA) has adopted global best practices and a focus-for-impact
strategy in the National Strategic Plan for HIV, Tuberculosis (TB), and Sexually Transmitted
Infections (STIs) (NSP) 2017-2022. Through the President’s Emergency Plan for AIDS Relief
(PEPFAR) Country Operational Plan 2018 (COP18), the United States (U.S.) government (USG)
will support the GoSA to implement a strategic portfolio of multisectoral programs designed to
accelerate epidemic control: (1) the HIV Treatment Surge to rapidly expand quality ART; (2)
combination HIV prevention programs, including services for orphans and vulnerable children
(OVC), programs to reduce HIV risk for adolescent girls and young women (AGYW) and
saturation of voluntary medical male circumcision (VMMC) for men (15-34 years); and (3)
transformative strategic information (SI) systems that link patients to care and drive broader
program achievements. Active partner management and accountability, engagement at all
spheres of government, and mobilizing civil society, the private sector and all stakeholders will be
critical to achieving these goals.

PEPFAR SA has focused for impact both geographically and programmatically. During COP18,
PEPFAR SA will continue to invest in South Africa’s 27 highest HIV burden districts—accounting
for 82% of PLHIV. Within these districts, COP18 will further focus on the four largest
metropolitan districts (accounting for 31% of PLHIV) and populations with largest treatment gaps.
PEPFAR SA continues to partner with key Ministries in SA’s HIV response: Health, Social
Development, Basic Education, National Treasury, Higher Education and Training, Justice and
Constitutional Development, Correctional Services and Defence.

Programmatically, PEPFAR SA will more than double investments in supplemental health worker
staff in the highest burden districts to fast-track the HIV Treatment Surge and will greatly expand
community engagement through a comprehensive Community Health Worker (CHW) program.
In COP18 PEPFAR SA will leverage the country’s vibrant civil society, private sector, faith-based
organizations (FBOs) and traditional structures to improve HIV service demand and access in
highest burden communities and to improve adherence and retention. These investments will
accelerate treatment scale-up through evidence-driven case finding, ART linkage, adherence and
retention. Prevention shifts will include self-screening strategies and index testing, and expansion
of pre-exposure prophylaxis (PrEP) services.1 PEPFAR SA will also prioritize investments in health
systems that contribute directly to epidemic control, including provincial data centers, training
and management programs for CHWs, and increased service space at facilities.

PEPFAR SA has improved the way we do business, strengthening management and
accountability, and implementing a robust program to kick-start the Treatment Surge during the

1
 All interventions are aligned with the 2017-2022 South Africa NSP, the UNAIDS 90-90-90 goals, WHO guidelines and global best
practices, and with the PEPFAR Strategy for Accelerating HIV/AIDS Epidemic Control (2017-2020).

5|Page
current implementation year. Beginning in 2017, PEPFAR SA intensified partner performance
management, increasing oversight at the site, partner and PEPFAR staff levels, introducing
standardized performance guidance and measurement tools, and tightening joint management
and oversight with the GoSA. PEPFAR SA also aligned its programming geographically across
agencies to improve management efficiencies. PEPFAR SA has intensified province-level support
to accelerate program and policy implementation.

2.0 Epidemic, Response, and Program Context
2.1 Summary statistics, disease burden and country profile
SA is an upper-middle income country, with many cultures, languages, races, and religions
shaping its health profile. The population is estimated at 56.5 million, of which approximately 51%
(28.9 million) are female. Life expectancy at birth is estimated to be 64.0 years (66.7 years for
females; 61.2 years for males) and the infant mortality rate is 32.8 per 1,000 live births.2

In 2017, SA’s HIV disease burden was an estimated 7,203,313 PLHIV,3 of which more than half
(53%) were women aged 25 and older. The estimated number of new infections among adults
declined by 53% from 1999 to 2017, but incidence remains high, with an estimated 266,988 new
infections in 2017.4 Among children, the estimated number of mother-to-child transmissions
declined by 80% from 2004 to 2017, and 70% of those transmissions are now estimated to occur
during breastfeeding. This decline in incidence and shift of transmission from perinatal to
postnatal has led to a shift in the age distribution of HIV-infected children, almost half (45%) of
whom are now 10-14 years of age.5

South Africa’s HIV epidemic is largely driven by heterosexual transmission, with underlying
behavioral, socio-cultural, economic, and structural factors influencing HIV transmission risk.
These factors include national and regional population mobility and migration; economic and
educational status; lack of knowledge of HIV status; alcohol and drug use; early sexual debut;
sexual and gender-based violence (GBV); low prevalence of male circumcision; intergenerational
sex; multiple and concurrent sexual partners; inconsistent condom use, especially in longer-term
relationships and during pregnancy/post-partum; discrimination and stigmatization; and gender
dynamics, including unequal power relations between men and women.

The SA National Department of Health (NDoH) and the Departments of Health (DoH) at
provincial and district levels lead the public-sector HIV treatment and biomedical prevention
efforts to achieve epidemic control. As of December 2017, there are 4.0 million people on ART in

2
  Statistics South Africa [StatsSA], Mid-year population estimates, 2017. Statistical Release P0302, StatsSA: Pretoria.
3
  Comprising: 310,593 children
the public sector, including 161,823 children (8,000 CHWs and Outreach Team
     Leads, in addition to the existing 51,000 DoH-funded CHWs. PEPFAR SA investments will
     also support NDoH to establish strong training, performance expectations, management
     structures, standard remuneration, and monitoring systems to ensure impact from
     community workers.
3.   ARV drugs and community ARV delivery: Funding for ARVs to ensure uninterrupted drug
     supply for new and continuing ART patients, including community-based ARV distribution
     implemented as part of differentiated service delivery.

6
  NDoH Program data (DHIS), December 2017.
7
  Johnson, op. cit.
8
  Based on the online VMMC Decision-Makers' Program Planning Toolkit (DMPPT) 2, a PEPFAR-funded monitoring
and planning tool that generates VMMC coverage estimates, targets and impact projections at the district level, dis-
aggregated by five-year age group. http://avenirhealth.org/policytools/DMPPT2/index.html#

7|Page
4. Activation of FBOs and traditional structures: Leveraging these crucial structures to influence social norms, mobilize demand for services, actively link PLHIV to ART, and support ART adherence. 5. Mobilization of the private sector: Working through General Practitioners and the private sector, reach and provide services to people who do not access public health facilities, particularly hard-to-reach men. Through a grand challenge, generate innovative solutions from non-traditional stakeholders. 6. Health information acceleration: Targeted support to the health information systems needed to strengthen data and information use, including through provincial data centers. Major programmatic and system gaps or barriers to achieving epidemic control remain. Patients continue to start treatment too late and too sick; in 2016/2017, 24% of patients initiating ART in Gauteng Province had a CD4 count under 200.9 Linkage and retention must be improved, with only approximately 75% of patients with known HIV infection on ART.10 The nexus with the TB epidemic continues to drive high morbidity and mortality, with the legacy of apartheid and significant income inequality posing additional challenges to the TB and HIV response. Gross National Income per capita is estimated at U.S. Dollar (USD) 5,480 in 2016.11 Total health expenditure is estimated to be about 9% of the Gross Domestic Product with health spending expected to reach SA Rand (ZAR) 205 billion (approximately USD17.1 billion12) in 2018/19.13 A large proportion of this spending occurs in the private health sector, which caters for an estimated 16% of the total population. GoSA is committed to continuously increase budgetary support for the HIV response. In the 2018 budget, an additional ZAR1 billion (approximately USD83 million14) was added to the HIV/TB Conditional Grant to support ART expansion in 2021, and ZAR4.4 billion was reprioritized within the grant over 3 years to support expansion of the CHW portfolio.15 Other HIV-related investments in the 2018 budget include expansion of the CCMDD program to enable 3 million chronic patients to pick up medicines outside the clinic, and implementation of programs to support proposed National Health Insurance, which includes contracting with General Practitioners for services. HIV prevalence and incidence vary significantly across geographic areas; over half (54%) of PLHIV are concentrated in the Gauteng and KwaZulu-Natal provinces.16 Tables 2.1.1 and 2.1.2 below summarize the key HIV epidemiological data and provide a national view of the 90-90-90 cascade. 9 NHLS, FY2016/17, cited in Pillay Y. South Africa’s HIV Program and Partnership with PEPFAR. Presentation to the PEPFAR Regional Planning Meeting, 2/25/2018. 10 PEPFAR Annual Program Results FY2017. 11 Gross National Income per capita, Atlas method (current USD). World Bank: World Development Indicators. Online: http://data.worldbank.org/indicator/ 12 Using the current Exchange Rate (March 2018) of ZAR12.0:USD1. 13 Gross National Income per capita, Atlas method (current USD). World Bank: World Development Indicators. Online: http://data.worldbank.org/indicator/ 14 Using the current Exchange Rate (March 2018) of ZAR12.0:USD1. 15 National Treasury, 2018 Budget Speech. Online: http://www.treasury.gov.za 16 Johnson, op. cit. 8|Page
Table 2.1.1 Government of South Africa Results
                                                                 Table 2.1.1 Government of South Africa Results
Table 2.1.1 Government of South Africa Results
Table 2.1.1 Government of South Africa Results
Table 2.1.2 90-90-90 cascade: HIV diagnosis, treatment and viral suppression
                                            Table 2.1.2 90-90-90 cascade: HIV diagnosis, treatment and viral suppression
                                                                                                                         HIV Testing and Linkage to ART Within
                             Epidemiologic Data                             HIV Treatment and Viral Suppression                                     f
                                                                                                                                      the Last Year
                    Total
                                                 Estimated      PLHIV                                                                    Diagnosed
                 Population         HIV                                                    ART             Viral          Tested for                      Initiated
                                                   Total      diagnosed     On ART                                                          HIV
                    Size         Prevalence                                      b       Coverage       Suppression          HIV                           on ART
                                        b          PLHIV          (#)        (#)                               c                          Positive
                  Estimate          (%)                 b                                  (%)             (%)               (#)                             (#)
                         a                          (#)                                                                                     (#)
                     (#)
Total
                 56,521,900         12.7%         7,203,313                 4,009,162      ~55.7%           ~83%           13,925,665      1,117,343       1,007,317
population
Population                                                                                                                 1,200,648
                 16,724,830         1.9%           310,593                   173,833       ~56.0%           ~65%                            33,885          20,433
Figure 2.1.3 Individuals currently on Treatment in South Africa
5,000,000
4,500,000
4,000,000
3,500,000
3,000,000
2,500,000
2,000,000
1,500,000
1,000,000
500,000
0
2011 2012 2013 2014 2015 2016 2017
Number of adultsART:
Adults Receiving receiving ART_NDoH
South Africa
Number of adults
Adults Receving receiving
ART: ART_PEPFAR
PEPFAR-supported (public sector)
Notes:
‘South Africa’ values (orange line) are derived from the Thembisa model inputs, which estimate the number of
individuals receiving ART in the public and private sector using program reporting inputs and estimated service
provision via the private sector.
‘PEPFAR-supported’ values (blue line) represent PEPFAR results from all 52 districts from the public sector.
PEPFAR SA provides intensive support to 27 highest burden districts. PEPFAR SA provides systems support to the
remaining 25 lower-burden districts through investments at the central level (see Section 6).
2.2 Investment Profile
SA’s national HIV response is funded primarily through public revenue, with additional funding
from external development partners (donors) and the private sector.
In 2016/17, the SA HIV response was funded primarily through the GoSA at ZAR19.6 billion
(USD1.34 billion17) (Table 2.2.1). PEPFAR was the second largest source of funds and contributed
ZAR6.62 billion (USD490.17 million18). The Global Fund for AIDS, TB and Malaria (GFATM) was
the next-largest funding source at ZAR776.9 million (USD54.29 million). The 2013 National AIDS
Spending Assessment reported other external sources (bilaterals, multilaterals, and foundations)
accounting for about 3% of HIV response funding. Private companies and insurance contributed
around 8%. According to the NSP 2017-2020, insurance costs for private ART patients are
estimated to be ZAR1.6billion in 2017/18.
17
Using the average Exchange Rate April 2016-March 2017 of ZAR14.58:USD1.
18
Using the PEPFAR FY2017 Expenditure Analysis Exchange Rate of ZAR13.5:USD1.
13 | P a g eWithin the GoSA response, the NDoH is the largest spender on HIV services, primarily via the HIV/TB Conditional Grant mechanism (ZAR20.5 billion in 2018/19), followed by the Department of Social Development (ZAR1.8 billion for 2018/19). An additional ZAR1.9 billion is being allocated in 2017/18 and 2018/19 to support implementation of the HIV and TB Investment Case and the new NSP including the continued expansion of ART to PLHIV. PEPFAR’s anticipated fiscal year (FY)19 2019 HIV funding in SA is ZAR8.15 billion (USD678.8 million).20 Due to SA’s high HIV burden and the already large and growing number of patients on treatment, HIV costs are expected to increase over the next decade, primarily driven by costs of ARVs and ART service delivery. Introduction of Tenofovir/Lamivudine/Dolutegravir fixed-dose combination (TLD) is expected to partially offset these increases. Modeling undertaken as part of the SA HIV and TB Investment Case found that maximizing prevention efforts (specifically condom provision and VMMC) was more cost-effective than ART provision, and that an approach that combines treatment and prevention is necessary to achieve the 90-90-90 targets. This strategy requires a steadily increasing investment in HIV programs to reach 90-90-90. Given SA’s constrained economy, the GoSA has leveled funding for many services, and future rising HIV and TB treatment costs are projected to consume an increasing share of the health budget. 19 The GoSA fiscal year is April-March, and is referenced as two calendar years (e.g. FY2016/17 for the period April 2016- March 2017). The USG fiscal year is October to September, and is referenced in relation to the latter calendar year (e.g. FY2017 for the period October 2016-September 2017). 20 Using the current Exchange Rate (March 2018) of ZAR12.0:USD1. 14 | P a g e
Table 2.2.1 Annual Investment Profile by Program Area
Table 2.2.1 Annual Investment Profile by Program Area
Total Expenditure % GoSA % PEPFAR % GFATM
Program Area
(USD) (FY 2016/17) (FY 2017) (FY 2016/17)
Clinical care, treatment and support 978,045,721 84% 14% 2%
Community-based care, treatment and support 198,808,165 81% 17% 2%
a
Prevention of Mother-to-Child Transmission 41,950,347 45% 55% 0%
HIV Testing Services 126,663,865 45% 55% 0%
VMMC 96,244,313 22% 78% 0%
Priority population prevention 82,030,609 48% 45% 7%
b
Key population prevention 31,860,980 52% 23% 25%
OVC c 124,588,488 63% 37% 0%
Laboratory d 16,083,574 0% 100% 0%
SI, surveys and surveillance d 36,268,046 0% 89% 11%
Health Systems Strengthening (HSS) d 11,638,397 0% 81% 19%
Other HIV spending (not in COP table) d 143,889,770 93% 0% 7%
Total (USD) 1,888,072,275 71% 26% 3%
General Notes:
GoSA figures are based on Basic Accounting System (BAS) actual expenditures for FY2016/17 (exchange rate:
ZAR14.58:USD1). GFATM figures are actual expenditures from Fy2016/17 (exchange rate: ZAR14.58:USD1). PEPFAR figures are
based on FY2017 expenditures (exchange rate: ZAR13.5:USD1).
The table provides a broad profile of expenditures and budgets for HIV spending in SA, and is not comprehensive of all HIV
expenditures in SA. BAS data do not provide specific information on spending and budget allocation for several of the program
areas or component areas listed, including laboratory, OVC, Communications, Monitoring and Evaluation, Other Prevention,
Policy and Systems Development. This lack of information does not reflect a lack of GoSA expenditure in these program areas.
a
The 45% attributed to GoSA is an underestimate as it does not include ARVs, HTS or full estimates of staff time.
b
The GoSA investment in key population prevention includes costs for interventions in high-transmission areas.
c
The GoSA does not track OVC investments in the BAS. OVC investments in this table include HIV/AIDS investments by the
Department of Social Development, and the life skills education grant from the Department of Basic Education. This lack of
information does not reflect a lack of GoSA expenditure on OVC activities.
d
GoSA Laboratory, HSS and SI expenditures are not coded in the BAS. All GoSA Laboratory, HSS and SI expenditures that do not
relate to the PEPFAR Investment Profile program areas are included in "Other HIV Spending". PEPFAR Laboratory expenditures are
related to systems strengthening. The majority of PEPFAR’s SI and HSS expenditures are integrated across other program areas; the
expenditures reflected here include only those that are not assigned to another program area.
Table 2.2.2 Annual Procurement Profile for Key Commodities
Table 2.2.2 Annual Procurement Profile for Key Commodities
Total Expenditure % GoSA % PEPFAR % GFATM
Commodity Category a a
(USD) (FY 2016/17) (FY 2017) (FY 2016/17)
ARVs 420,375,997 97% 0% 3%
Rapid test kits 7,974,140 98% 2% 0%
Other drugs 0 0% 0% 0%
Lab reagents 188,174,096 100% 0% 0%
Condoms 35,088,175 100% 0% 0%
Viral Load commodities 0 0% 0% 0%
VMMC Kits 16,342,333 39% 61% 0%
b
Other commodities 14,738,848 0% 100% 0%
Total 682,693,589 95% 4% 2%
a
Exchange rate: ZAR14.58:USD1
b
PEPFAR Other Commodities is derived from the FY2017 Expenditure Analysis DataNab Tool as the remaining portion
of “Other Supplies” after subtracting VMMC and Lab commodities.
15 | P a g eTable 2.2.3 Annual USG Non-PEPFAR Funded Investments and Integration
Table 2.2.3 Annual USG Non-PEPFAR Funded Investments and Integration
Non-PEPFAR PEPFAR COP
Total USG
Resources Co- # Co-Funded Co-Funding
(USG) Funding Source Non-PEPFAR b Objectives
Funding PEPFAR IMs (USD) Contribution
Resources (USD) b
IMs USD) (USD)
USAID Maternal and Child Health N/A N/A N/A N/A N/A
USAID TB 13,000,000 N/A N/A N/A TB technical assistance to GoSA
USAID Malaria N/A N/A N/A N/A N/A
Family Planning N/A N/A N/A N/A N/A
a
National Institutes of Health 77,000,000 N/A N/A N/A To advance health objectives
Centers for Disease Control and Prevention
N/A N/A N/A N/A N/A
(CDC) - Global Health Security
Peace Corps 2,300,000 N/A N/A N/A N/A
Department of Defense Ebola N/A N/A N/A N/A N/A
Millennium Challenge Corporation N/A N/A N/A N/A N/A
Total 15,300,000 0 0 0
a
Of which 60-70% are HIV/TB-focused.
b
IM: Implementing Mechanism
Table 2.2.4 Annual PEPFAR Non-COP Resources
Table 2.2.4 Annual PEPFAR Non-COP Resources
Total PEPFAR Total Non- PEPFAR COP
Total Non-COP
Non-COP PEPFAR a Co-Funding
Funding Source Co-funding # Co-Funded IMs Objectives
Resources Resources a Contribution
PEPFAR IMs
(USD) (USD) (USD)
DREAMS Innovation b
3,000,000 N/A N/A N/A 33,323,382 N/A
Challenge Fund
VMMC – Central Funds 17,918,315 N/A 1 18547 22,853,589 Reach VMMC targets
16772,14295,18482,17537,7
Other PEPFAR Central
83,917,320 N/A 10 0310,70287,70288,70289,7 110,788,254 HIV Treatment Surge
Initiatives
0290,70301
VMMC demand creation via
airtime voucher messaging; HCT
Other Public-Private
1,500,000 N/A 2 18484, 18482 N/A in private-sector pharmacies;
Partnership
improving management and
leadership for the HIV response.
Total 103,335,635 0 N/A N/A 166,965,225
a
IM: Implementing Mechanism
b
FY2017 and FY2018 only
16 | P a g e2.3 National Sustainability Profile Update
The second round of PEPFAR SA’s National Sustainability Profile was completed in November
2017 using the Sustainability Index and Dashboard (SID) 3.0. The process was led by the South
African National AIDS Council (SANAC), GoSA, UNAIDS and the PEPFAR SA team, and included
45 multisectoral partners from government and non-governmental organizations (NGOs), the
private sector, civil society, health bilateral and multilateral partners, and international NGOs
working in South Africa’s HIV program. The group completed the review of the index’s 15 critical
sustainability elements. The SID 2017 summary was approved through the bilateral Partnership
Framework Implementation Plan (PFIP) Management Committee, and the results have been
presented in various stakeholders’ meetings including through the PFIP, Health Partners Forum,
SANAC Civil Society Forum, and UN Joint Team.
The SA SID 3.o demonstrated a high level of sustainability (score of 8.5/10) in eight of the 15
critical elements,21 and a score of 8 or higher in an additional three elements.22 Four elements
were identified with vulnerabilities to sustainability: service delivery; human resources for health;
commodity security and supply chain; and epidemiological and health data.
In COP18, PEPFAR SA will continue to invest in those program elements with the weakest
sustainability scores. PEPFAR SA also continues to work closely through the bilateral
workstreams to ensure that the COP18 investments both leverage and complement the
investments of the GoSA and other donors. In particular, PEPFAR SA continues to work closely
with the GFATM CCM and Fund Portfolio Manager to strengthen the alignment of COP18 with
the activities to be included in the next GFATM Request for Funding. The ongoing USG
participation on the CCM and Oversight Committee has resulted in increased efficiencies and
proactive reprogramming to support additional effective interventions.
2.4 Alignment of PEPFAR investments geographically to disease burden
In COP18 PEPFAR SA continues to prioritize the 27 districts that account for 82% of the national
HIV burden, which are the same 27 focus-for-impact districts in the NSP. To further focus the
PEPFAR SA investment, COP18 resources are concentrated in the four largest metropolitan
districts (Johannesburg, eThekwini, Ekurhuleni, Tshwane), which account for 31% of the national
HIV burden. The alignment analysis revealed the need to make additional investments in the
1,437 highest burden facilities that serve 90% of the PLHIV on treatment in the 27 priority
districts. In COP18, PEPFAR SA has increased the investment in all of these facilities to support
additional human resources to supplement existing DoH staff. PEPFAR SA, DoH, and
implementing partners are monitoring these facilities on a weekly basis to optimize allocation of
supplemental staff, technical assistance and other resources (i.e., information technology,
infrastructure, and equipment).
21
(1) Planning and coordination; (2) policies and governance; (3) private sector engagement; (4) civil society
engagement; (5) laboratory; (6) domestic resource mobilization; (7) technical and allocative efficiencies; and (8)
performance data.
22
(1) Public access to information; (2) quality management; and (3) financial/expenditure data.
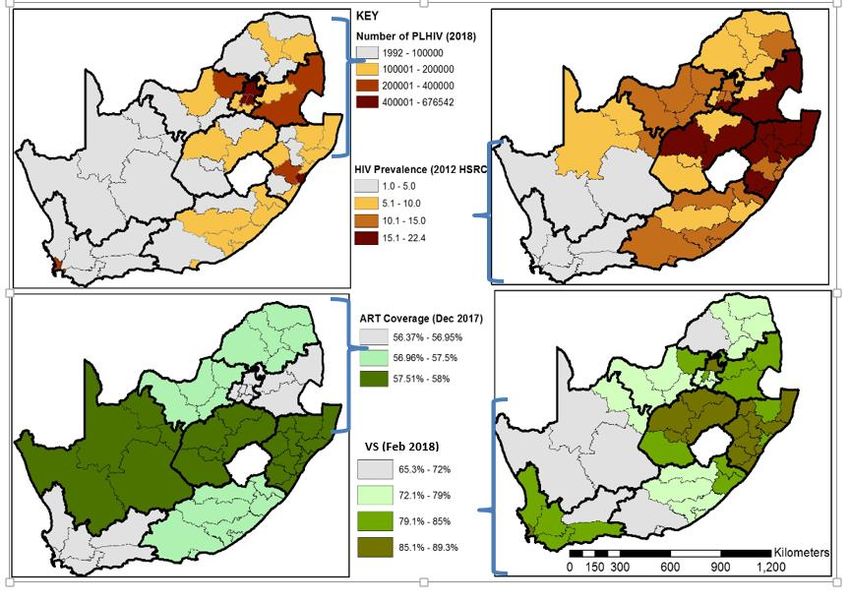
17 | P a g eFigure 2.4.1 PLHIV, HIV Prevalence, ART coverage, and Viral Suppression, by District 2.5 Stakeholder Engagement The process of developing COP18 has been open and consultative, and the proposed plan reflects the strong engagement with and input from a range of stakeholders. In particular, PEPFAR SA received substantial input from the GoSA, the GFATM and other donors, Civil Society and the private sector to prioritize investments included in COP18. The GoSA continues to provide leadership in planning and implementing the PEPFAR program in South Africa. The bilateral partnership is led by the PFIP Steering Committee, co-chaired by the Minister of Health and the U.S. Ambassador to SA, along with the deputy ministers from important GoSA departments. The Steering Committee provides guidance to the PFIP Management Committee, co-chaired by a senior manager from the Ministry in the Presidency for Planning, Monitoring and Evaluation and the interagency PEPFAR Coordinator, and with representation of senior officials from all key GoSA departments. The Management Committee in turn guides the joint technical workstreams, which oversee the implementation of the PEPFAR SA program throughout the year. At each of these levels, the COP18 plan was discussed and reviewed, and members provided strategic input. In addition to these formal, routine bilateral consultations, from December 2017 through February 2018 PEPFAR SA joined with SANAC to 18 | P a g e
convene COP18 consultations with Provincial AIDS Councils and Provincial HIV/AIDS, STI and
TB (HAST) Managers from the eight provinces in which PEPFAR SA supports the 27 focus
districts.

As part of the COP18 development process, PEPFAR SA organized targeted consultations and
leveraged routine coordination meetings to engage with multilateral and bilateral donors and key
international NGOs and foundations. These included meetings of the SANAC NSP Steering
Committee; SA Health Partners Forum; GFATM Country Coordination Mechanism, Request for
Funding Committee and Fund Portfolio Management Team; Bill and Melinda Gates Foundation;
Clinton Health Access Initiative; and the UN Joint Team. PEPFAR SA staff also regularly discuss
COP implementation and proposals in the SA HIV Think Tank, the SA TB Think Tank, and other
national committees and working groups.

Civil Society has been actively engaged throughout the COP18 planning process, including
consolidating strategic insights into “The People’s COP”, presented at the COP18 Regional
Planning Meeting in Johannesburg in February 2018. Valuable national consultations were held
with the SANAC Civil Society Forum and with national PLHIV organizations. At each
consultation PEPFAR SA presented on the COP18 planning process, on program results and
COP18 priorities, and civil society representatives provided input on key program areas through
thematic sub-groups and in plenaries.

Private Sector stakeholders also provided valuable insights in the COP18 planning process and
during the current implementation year through participation in the SID workshop, and through
consultations with important private sector partners. These partners included Discovery Health,
Vodacom, Johnson and Johnson, MassMart, and SA Breweries, among others.

Finally, there was robust participation of external partners in strategic discussions at the COP18
Regional Planning Meeting. Six representatives from South African civil society were joined by
government and SANAC representation, as well as other representatives from advocacy,
international NGOs and multilateral organizations. Inputs from these stakeholders resulted in a
stronger investment plan for COP18.

Building on this annual planning process, PEPFAR SA will continue to engage with external
partners, including civil society at national, provincial, and district levels, to support optimized
implementation of COP18. COP18 implementation will include ongoing consultations, including
sharing of quarterly results at the national and provincial levels. COP18 implementation will also
leverage current efforts to deepen engagement with FBOs and with national and provincial
authorities through the Treatment Surge.

3.0 Geographic and Population Prioritization
During the COP18 planning process, PEPFAR SA utilized new population, burden and coverage
estimates to prioritize districts and populations across the portfolio. New district-level PLHIV and
coverage estimates revealed substantial treatment gaps especially in the four largest metropolitan

19 | P a g e
districts (Johannesburg, eThekwini, Ekurhuleni and Tshwane). As a result, PEPFAR SA is
redoubling efforts in these four districts to reach saturation (81% treatment coverage) by
September 2019 and accelerate treatment coverage in the remaining twenty-three priority districts
to reach saturation by December 2020.

In most geographic areas, there are substantial treatment gaps across age and sex bands (men 25+
years, women 25+ years, AGYW 15-24 years, and children
4.1 Finding the missing, getting them on treatment, and retaining them
A deep dive on the clinical cascade among older women reveals substantial linkage and retention
gaps. To address these gaps, PEPFAR SA will substantially increase its facility- and community-
level human resource investments to conduct HIV testing, enable same-day initiation, extended
service hours, patient navigation, active linkage, adherence and retention tracking and tracing,
and differentiated care.

PEPFAR will support a self-screening effort in COP18, backed by CHWs in priority districts.
Partners will focus on populations that are not well reached by facility-based testing efforts.

To close the treatment gap among men, PEPFAR SA will support the GoSA to close case finding,
linkage, and retention gaps through a diverse, complementary set of interventions including
index testing, workplace testing, community-based testing, self-screening, community ART
initiation through General Practitioner contracting, community medicine pick-up points,
innovative peer-led approaches, and men-friendly services, including through extended service
hours. PEPFAR SA is working with GoSA to fast-track the approval of the new HIV testing service
(HTS) guidelines, which include self-screening.

Similarly, to close the treatment gap for youth in general and AGYW in particular, PEPFAR SA
will close case finding, linkage, and retention gaps by leveraging facility, community, faith-based
and traditional structures. PEPFAR SA will support the GoSA to expand adolescent and youth
friendly services in facilities and communities, after-school hours, school health services, self-
screening, youth connectors, youth care clubs, and mHealth (including social media). PEPFAR SA
will work with the Department of Basic Education (DBE) and provincial and local authorities to
accelerate roll-out of the comprehensive sexuality education (CSE) program, and the provision of
school-based health services including HTS, in line with the National Adolescent and Youth
Health Policy, issued in July 2017.

Case finding and clinical management remain the principal gaps in the clinical cascade for
children. PEPFAR SA will utilize index testing, school health services, provider-initiated testing
and counseling, nutrition and growth monitoring, and additional mentoring and support for
pediatric case management (i.e., phlebotomy, dosing, viral load monitoring). PEPFAR SA will
support the DoH to reach HIV-positive mothers with differentiated models of care that
particularly respond to the needs of the mother-infant pair. In COP18 PEPFAR SA will fully
support the National Health Screening, Testing and Treatment Campaign, which should result in
a significant increase in new HIV treatment initiation.

Implementation of these evidence-based solutions will be optimized through a range of partner
management and support strategies, including clear standard operating procedures (SOPs)
tailored to local (facility and community) context. These strategies are further described in
Section 4.5.

21 | P a g e
In addition, systems-level improvements included in COP18 will support accelerated and
expanded ART coverage and retention for all populations. The NDoH released the same-day
initiation circular in October 2017 with mixed implementation across the provinces—PEPFAR SA
is currently engaging with provincial and district authorities to rapidly expand implementation of
same-day initiation to all sites, and to all eligible patients. The core programmatic interventions
will be further supported by health systems interventions including strengthened data quality and
use, quality improvement, clinic-lab interface, health information systems, supply chain, and
human resources for health planning and development. PEPFAR SA is currently supporting the
DoH to implement the unique patient identifier policy and the Treatment and Retention
Acceleration Plan SOP to improve data analytics and use at the facility, sub-district, district,
provincial and national levels.

In COP18, PEPFAR SA will support the GoSA to scale up TB prevention and treatment among
PLHIV. Priorities include increased HIV testing among individuals with presumptive TB and
expanded screening for TB among PLHIV, ensuring ART for all TB/HIV co-infected individuals,
and increasing TB preventive therapy.

In all these efforts, PEPFAR SA is committed to continue support for public health facilities, and
to expand efforts in communities to improve case identification, linkage to ART, reduction in loss
to follow-up, ART adherence, and other treatment support. These latter efforts will leverage the
local knowledge and experience of FBOs and traditional structures. In addition, PEPFAR SA will
increase its efforts to integrate mental health and substance abuse interventions across the
prevention and treatment portfolios.

4.2 Prevention, specifically detailing programs for priority programming
In COP18, priority combination prevention investments continue to be promoted for AGYW,
OVC, key populations and men (15-34 years), and will include increased use of peer-led
prevention approaches to reach priority populations.

Adolescent girls and young women will be targeted with age-specific, multi-session, and layered
prevention interventions. The new DBE policy on HIV, STIs and TB23 creates substantial
opportunities to scale up effective CSE interventions, and HIV and violence prevention in schools
in the highest burden districts. As a result, PEPFAR SA has doubled its prevention targets for
school-aged young people in COP18, and re-directed resources to support CSE scale-up. In
addition to the current focus in seven districts (City of Johannesburg, eThekwini, Gert Sibande,
Ehlanzeni, Thabo Mofutsanyane, City of Cape Town and King Cetshwayo), PEPFAR SA will
expand CSE activities to priority schools in Nkangala, Ekurhuleni and uMgungundlovu in COP18.

23
  National Policy on HIV, STIs and TB for Learners, Educators, School Support Staff and Officials in all Primary and
Secondary Schools in the Basic Education Sector, August 2017

22 | P a g e
In collaboration with the DBE and DoH, schools implementing CSE interventions will be linked
to local health facilities offering adolescent and youth friendly services, and clinical PEPFAR
partners, to increase the provision of biomedical SRH services, mixed contraception methods
including condoms, STI screening and treatment, VMMC counseling and referral for services,
HTS counseling, care and treatment services. Plans are also underway to support both DoH and
DBE to improve the referral pathways and quality of services offered through the integrated
school health program and to better align with the new DoH adolescent and youth health
policy. PEPFAR is also supporting the DBE to develop the national implementation plan to fully
implement the new policy, including appropriate resource allocation.

Among 9-14 year-old adolescent girls and boys, PEPFAR SA will leverage the OVC, school-based,
safe spaces and community platforms using a combination of interventions to prevent sexual
violence; delay sexual debut; support healthy choices; and empower parents, caregivers and
communities to support, protect, and educate girls. Among adolescent girls 15-19 years, HIV
prevention investments will leverage OVC, school-based, safe spaces, community, and clinical
platforms using a combination of interventions to empower adolescent girls, strengthen families,
mobilize communities, and link girls in this age group to SRH services including PrEP. Among
young women 20-24 years, PEPFAR SA will leverage higher education [Technical and Vocational
Education and Training colleges (TVETs) and universities], community and clinical platforms to
prevent HIV by empowering young women, mobilizing communities, and linking young women
to SRH including PrEP. The GoSA launched PrEP for TVET and university students in October
2017 and will launch PrEP for other AGYW in April 2018, to accelerate uptake in this critical
population (COP18 targets for AGYW are doubled to >8,000). Investments in young women will
also increase demand for services in both communities and facilities, and mobilize communities
to support an end to violence against women.

In COP18, PEPFAR SA will continue to invest in comprehensive support to OVC through a family-
centered case management approach. Through effective case management, household visits, and
improved use of data and targeting, OVC implementing partners will identify the most vulnerable
children (including AGYW) and provide one-on-one support that empowers them to stay in and
progress in school; access health services and grants; be adherent and retained in care; reduce
violence and abuse; and prevent new infections. In COP18, PEPFAR SA implementing partners
will increase the delivery of an evidence-based package of services to beneficiaries 15-17 years of
age especially girls. Implementing partners will also prioritize risk avoidance strategies for girls 9-
14 years to ensure that they stay HIV-negative. In addition, the OVC portfolio of investments will
have greater focus on prevention of GBV and improved linkages to post-violence care and post-
exposure prophylaxis (PEP) as well as using post-violence care facilities as an entry point to
maximize the potential to increase uptake of HIV interventions.

PEPFAR SA continues to strengthen its key population prevention investments targeted to female
sex workers, men who have sex with men, transgender women, people who inject drugs, and
inmates, aligned with strong country plans, and focused using rigorous population estimations. In

23 | P a g e
2016/2017, SANAC launched strategic plans for sex workers and lesbian, gay, bisexual, transgender
and intersex people (LGBTI),24 aligned with the NSP. These plans demonstrate strong consensus
on the strategic direction and confirm GoSA support. The core of the COP18 program focuses on
peer-led outreach and mobilization, targeted strategic communication and demand creation, and
key population-friendly mobile and drop-in centers providing HIV, STI, and TB screening, testing
and treatment services, and PrEP. This core package is complemented by interventions focused
on stigma reduction, community mobilization, and use of strategic information for program
management.

PEPFAR SA aims to reach 80% of males 15-34 years old in priority districts with VMMC services.
Modeling has shown that targeting this age group is the most cost-effective in terms of infections
averted. In COP18, PEPFAR SA will assist the GoSA to scale up the national VMMC program
through planning, coordination, and implementation including advocacy, communication, and
social mobilization. PEPFAR SA implements the WHO-recommended minimum package of
services in public, private and non-governmental facilities in urban and rural communities with
low rates of VMMC coverage and high HIV prevalence. PEPFAR SA will strengthen quality
elements of the VMMC program through routine external quality assurance and continuous
quality improvement activities. VMMC services will address harmful male norms and behaviors
that may promote high-risk sexual behaviors, contribute to GBV, and limit access and/or
adherence to HIV prevention services. The PEPFAR SA VMMC program will also strengthen
linkage to treatment for men with HIV.

As noted above, in COP18 PEPFAR SA will increase its efforts to integrate mental health and
substance abuse interventions across the prevention and treatment portfolios.

4.3 Additional country-specific priorities listed in the planning level letter
The PEPFAR SA COP18 planning level letter identified four priorities that must be addressed to
increase the impact of PEPFAR investments in SA. Solutions to address these priorities have been
identified as part of COP18 planning, and are described in other sections of this document, as
indicated below.
     1.   Identification of greater efficiencies: Sections 4.5 and 7.0.
     2.   Increasing the focus of programming: Sections 3.0, 4.1 and 4.2.
     3.   Effective management of implementing partners: Section 4.5.
     4.   Support for implementation of critical policies: Sections 2.1, 4.1, 4.2 and 6.0.

24
  The South African National Sex Worker HIV Plan 2016-2019, and the South African National LGBTI HIV Plan 2017-
2022.

24 | P a g e
4.4 Commodities
The GoSA invested approximately USD647 million for the procurement of HIV-related
commodities in 2017/18. PEPFAR invested approximately USD25.4 million in HIV-related
commodities in FY2017 and Global Fund invested USD10.6 million in 2016/17.25
In COP18 PEPFAR SA will invest USD65.7 million for ARVs, VMMC, laboratory consumables and
other commodities to complement the GoSA’s investment in the Treatment Surge. No other
funding gaps for commodities have been projected for the period covered under COP18.
South Africa is geared up to transition to the Dolutegravir-based regimen in a phased approach
started in 2018. A full transition to TLD will be initiated once formulations are registered by the
South African Health Products Regulatory Authority.
4.5 Collaboration, Integration and Monitoring
In 2017 and 2018, significant gaps emerged in performance related to getting new PLHIV onto
ART, and in keeping them on ART. PEPFAR SA, together with the NDoH, have and will continue
to address these challenges with a range of strategic and management tools and approaches.
These include the Treatment and Retention Acceleration Plan, SOPs for priority interventions,
ensuring integration of systems interventions to gaps in the cascade, and aligning resources to
HIV burden.
Underperformance by facilities and by implementing partners has and will continue to be
addressed through management and technical interventions:
PEPFAR SA, the NDoH, and the Provincial DoHs collaborated to develop and launch the
Treatment and Retention Acceleration Plan in September 2017. The Plan provides a guide
for weekly review of key data at the facility level and monthly review at the sub-district,
district, provincial, and national levels. To ensure implementing partners share
accountability for weekly facility reviews, implementing partners are reporting weekly
data to PEPFAR SA. In COP18, PEPFAR SA will increase its investment in Data Capturers
and health information systems to support these efforts.
Beginning in FY2018, PEPFAR SA will intensify staff monitoring of the highest burden
facilities in the highest burden districts through the ’Operation 10-10’ strategy (i.e., 10
highest priority facilities in 10 highest burden districts). Modelled after best practices
identified in PEPFAR Namibia, PEPFAR SA staff will actively monitor progress and address
key barriers in these facilities/sites to ensure rapid course correction.
To strengthen technical collaboration, PEPFAR SA and the NDoH jointly developed a
protocol affirming shared responsibility for partner management through collaboration
structures, actors, systems, and policies. PEPFAR SA institutionalized a monthly partner
report that PEPFAR SA and the NDoH are using to track the progress of innovation
projects, their adaptation and scale-up. The partner monthly report also allows
25
All ARV expenditure data were calculated at the exchange rate of ZAR14.58:USD1. Information on HIV-related
commodity expenditures crossed multiple fiscal years (April 2016-March 2018) due to availability of data.
25 | P a g eimplementing partners to provide actionable information on challenges and innovations
to the NDoH.
Building on this collaboration, PEPFAR SA and NDoH are jointly developing 40 SOPs to
cover identified priority interventions across the HIV care cascade. These SOPs are
designed to improve quality and efficiencies across community and facility sites, and to
ensure that key interventions are delivered with fidelity and scaled optimally to address
the identified barriers to performance. Examples of priority interventions include
extended clinic hours, intensified case finding, self-screening, same-day ART initiation,
adherence clubs and support groups. Monthly reporting will monitor the coverage and
quality of these interventions across PEPFAR-supported facilities.
To optimize the use of PEPFAR, GoSA, GFATM and other resources and to improve
impact, PEPFAR SA will continue to collaborate with these important partners to ensure
that resources are leveraged and that investments are planned to be complementary both
technically and geographically. PEPFAR SA is working with the SANAC and GFATM
Principal Recipients to harmonize interventions, indicators, and geographies aimed at
preventing HIV and GBV among AGYW and key populations. These harmonization efforts
are a result of strengthened collaborative relationships between PEPFAR SA staff and the
GFATM Fund Portfolio Team (based in Geneva), the Country Coordinating Mechanism
Secretariat (based at SANAC), and the Principal Recipients. PEPFAR SA, SANAC, and
GFATM Principal Recipients are exploring opportunities to consolidate monitoring and
evaluation and routine reporting tools (a health information system assessment is on-
going to guide these decisions).
During the COP18 planning process, the PEPFAR SA team, in collaboration with staff from the
USG Office of the Global AIDS Coordinator, critically reviewed above-site and above-service
delivery activities to ensure they are mapped directly to key barriers and measurable outcomes. As
a result of this deep dive, the PEPFAR SA team made significant adjustments to prioritize systems
investments that will have the greatest impact on the epidemic. PEPFAR SA also further enhanced
systems investments at the site level to monitor progress in human resources for health, clinic-lab
interface, and supply chain.
26 | P a g e4.6 Targets for scale-up locations and populations
Table 4.6.1 Entry Streams for Adults and Pediatrics Newly Initiating ART Patients in Scale-
up Districts
Table 4.6.1 Entry Streams for Adults and Pediatrics Newly Initiating ART Patients in Scale-up Districts
Newly Identified
Tested for HIV Newly Initiated on ART
Entry Streams for ART a Positive a
(APR FY2019) a (APR FY2019)
Enrollment (APR FY2019)
HTS_TST TX_NEW
HTS_TST_POS
Total Men 4,743,330 456,831 436,098
Total Women 4,867,549 509,537 495,198
Total Children (Table 4.6.2 VMMC Coverage and Targets by Age Bracket in Scale-up Districts
Population Current Expected
Target Size Coverage VMMC_CIRC Coverage
District
Populations Estimate (FY2018 (in FY2018) (in
(FY2019) expected) FY2019)
gp Ekurhuleni Metropolitan
15-34 year olds 618,640 81% 10,260 81%
Municipality
gp Sedibeng District Municipality 15-34 year olds 169,017 99% 5,999 99%
kz eThekwini Metropolitan
15-34 year olds 628,091 73% 133,075 95%
Municipality
kz Harry Gwala District Municipality 15-34 year olds 97,091 70% 11,410 77%
kz King Cetshwayo District
15-34 year olds 168,877 87% 45,927 94%
Municipality
kz Ugu District Municipality 15-34 year olds 156,182 85% 29,709 91%
kz uMgungundlovu District
15-34 year olds 210,846 72% 38,764 82%
Municipality
kz Uthukela District Municipality 15-34 year olds 133,609 74% 23,937 78%
kz Zululand District Municipality 15-34 year olds 169,671 74% 35,934 79%
lp Capricorn District Municipality 15-34 year olds 255,731 112% 5,698 114%
lp Mopani District Municipality 15-34 year olds 224,461 106% 11,888 108%
mp Ehlanzeni District Municipality 15-34 year olds 319,273 91% 10,038 93%
mp Gert Sibande District Municipality 15-34 year olds 234,596 75% 15,895 78%
mp Nkangala District Municipality 15-34 year olds 311,809 96% 11,178 98%
nw Bojanala Platinum District
15-34 year olds 313,995 60% 10,814 69%
Municipality
nw Dr Kenneth Kaunda District
15-34 year olds 131,751 67% 10,935 71%
Municipality
nw Ngaka Modiri Molema District
15-34 year olds 184,581 56% 3,539 62%
Municipality
wc City of Cape Town Metropolitan
15-34 year olds 689,147 53% 28,142 64%
Municipality
TOTAL 7,715,102 570,879
Table 4.6.3a Prevention Interventions to Facilitate Epidemic Control (DREAMS Districts)a
Table 4.6.3a Prevention Interventions to Facilitate Epidemic Control (DREAMS Districts)
Population
FY2018 FY2019
Target Size FY2019
District (DREAMS) Coverage Coverage
Populations Estimate b Target b
Goal Goal
(10-24 yrs)
gp City of Johannesburg Metropolitan
585,725 14% 90,275 15%
Municipality
AGYW gp Ekurhuleni Metropolitan Municipality 419,109 9% 32,549 8%
(PP_PREV)
kz eThekwini Metropolitan Municipality 481,685 7% 76,413 16%
kz uMgungundlovu District Municipality 167,316 14% 49,095 29%
a
This table includes prevention interventions among AGYW. PP_PREV targets for non-DREAMS districts and for other
priority populations are included in the Data Pack.
b
Due to limited data on AGYW, the coverage goal is based on the total 10-24 year-old population, rather than on the
vulnerable and at-risk individuals; as a result the coverage goal underestimates actual coverage of vulnerable and at-risk
individuals. Coverage includes community- and school-based interventions.
28 | P a g eTable 4.6.3b Prevention Interventions to Facilitate Epidemic Control (Key Populations)
Table 4.6.3b Prevention Interventions to Facilitate Epidemic Control (Key Populations)
Population
FY2018 FY2019
Target Size FY2019
District Coverage Coverage
Populations Estimate b Target
a Goal Goal
(2018)
ec Oliver Tambo District Municipality 4,437 34% 3,328 75%
gp City of Johannesburg Metropolitan
16,975 29% 13,580 80%
Municipality
gp City of Tshwane Metropolitan Municipality 11,326 23% 9,061 80%
gp Ekurhuleni Metropolitan Municipality 6,701 42% 5,361 80%
kz eThekwini Metropolitan Municipality 11,694 36% 6,992 60%
Female Sex kz uMgungundlovu District Municipality 2,071 59% 1,554 75%
Workers lp Vhembe District Municipality 2,757 63% 2,206 80%
(KP_PREV)
mp Ehlanzeni District Municipality 3,281 114% 2,461 75%
mp Gert Sibande District Municipality 2,255 87% 1,691 75%
mp Nkangala District Municipality 2,942 86% 2,206 75%
nw Dr Kenneth Kaunda District Municipality 1,420 112% 1,065 75%
wc City of Cape Town Metropolitan
13,561 39% 4,450 33%
Municipality
ec Buffalo City Metropolitan Municipality 3,601 No targets 1,261 35%
ec Nelson Mandela Bay Municipality 5,654 No targets 1,979 35%
gp City of Johannesburg Metropolitan
47,549 31% 16,642 35%
Municipality
Men who gp City of Tshwane Metropolitan Municipality 24,466 25% 6,116 25%
Have Sex gp Ekurhuleni Metropolitan Municipality 13,619 22% 2,405 18%
with Men
(KP_PREV) kz eThekwini Metropolitan Municipality 27,394 25% 6,858 25%
kz uMgungundlovu District Municipality 4,758 40% 2,190 46%
mp Ehlanzeni District Municipality 7,311 No targets 1,828 25%
wc City of Cape Town Metropolitan
29,901 40% 11,893 40%
Municipality
ec Buffalo City Metropolitan Municipality 830 No targets 415 50%
Transgender ec Nelson Mandela Bay Municipality 1,260 No targets 630 50%
Women gp City of Johannesburg Metropolitan
3,892 No targets 1,946 50%
(KP_PREV) Municipality
wc City of Cape Town Metropolitan
2,413 No targets 1,206 50%
Municipality
People Who gp City of Tshwane Metropolitan Municipality 6,190 7% 4,333 70%
Inject Drugs
(KP_PREV) mp Ehlanzeni District Municipality 1,744 No targets 1,221 70%
Inmates
National 157,013 45% 71,112 45%
(KP_PREV)
a
The GoSA and PEPFAR SA conduct routine triangulation of survey and program data to estimate population size and
service coverage among key populations. Risks related to limitations in data availability and reliability, and the biases
these limitations may introduce, are mediated through literature review and stakeholder consultation as part of the
triangulation exercise.
b
FY2018 coverage goals for key populations were developed using 2016 population estimates, but are presented here
using the 2018 population estimates as the coverage denominator; as a result the FY2018 coverage goals appear variable.
Coverage goals consider broader investments, including through GFATM.
29 | P a g eYou can also read