Global Trade Outlook September 2021 - GOV.UK
←
→
Page content transcription
If your browser does not render page correctly, please read the page content below

`

Global Trade
Outlook
September 2021

1 │DIT Global Trade Outlook
PREFACE
                              The Department for International Trade’s new
                              Global Trade Outlook explores the long-term
                              trends that will shape the global economy and
                              international trade in the coming decades.

                              The long-term projections in the Global Trade
                              Outlook (henceforth referred to as the Outlook)
                              are not predictions of what will happen, nor what
                              HM Government (HMG) would like to happen –
                              the Outlook does not include any judgements
                              about the future efficacy of HMG policy. Rather,
                              the projections are one possible future that could
                              emerge based on an informed analysis and neutral
                              extrapolation of the trends we observe today. The
                              projections are a rough guide to how the world
                              could evolve – not a definitive road map it will
                              follow.

                              There are many economic, political, technological,
                              and environmental risks and uncertainties that
                              could materialise over the coming decades that
                              could cause global trade to diverge from the
                              projections in the Outlook. A key uncertainty in
                              the near-term is how countries will recover from
                              the coronavirus crisis. Since the Outlook is
                              focused on the longer term, we abstain from
                              making judgements about the near term by tying
                              our 2021-2026 projections to the International
                              Monetary Fund’s April 2021 World Economic
                              Outlook forecasts. In addition, all UK projections
                              are consistent with the independent Office for
                              Budget Responsibility’s March 2021 forecasts in
                              the near term and long-term projections out to
                              2050 to avoid making any judgements about HMG
                              policy.

                              The Outlook has been produced to help inform
                              policymakers and strategists and contribute to the
                              wider debate about the future of trade. But it is
                              just one source among many. The Department for
                              International Trade continues to draw on a wide
                              range of analysis and information when
                              formulating its strategy.
2 │DIT Global Trade Outlook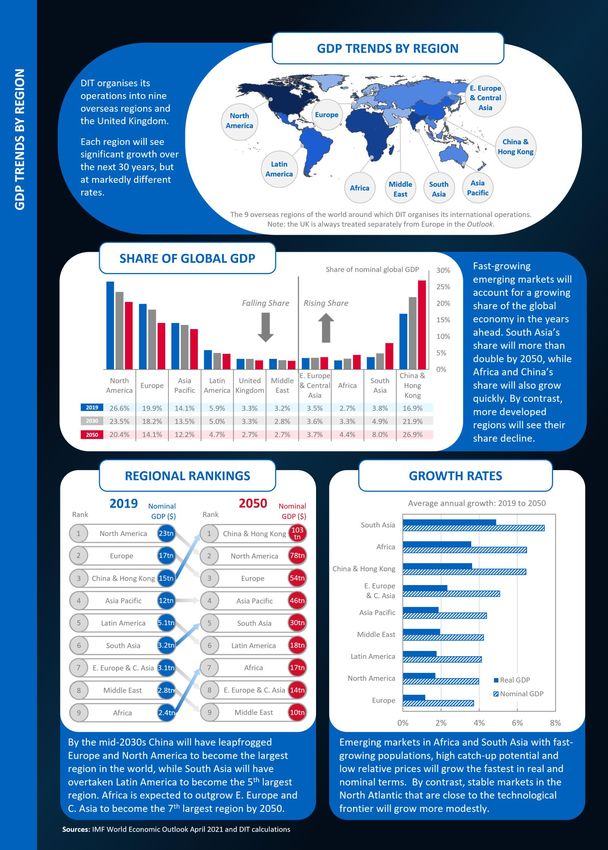
CONTENTS 5
Global GDP growth 6
Economic centre of gravity 7
GDP trends by region 8
Shifts in economic power 9
Top 30 largest economies 10
Global population growth 11
Ageing and urbanisation trends 12
Demographic trends by region 13
Trends in per capita income 14
Income levels across the world 15
The global middle class 16
Middle class by region 17
Global GDP growth by sector 18
Regional drivers of sectoral GDP 19
UK economic prospects 20
21
Global trade growth 22
Regional drivers of global trade 23
Trade trends by region 24
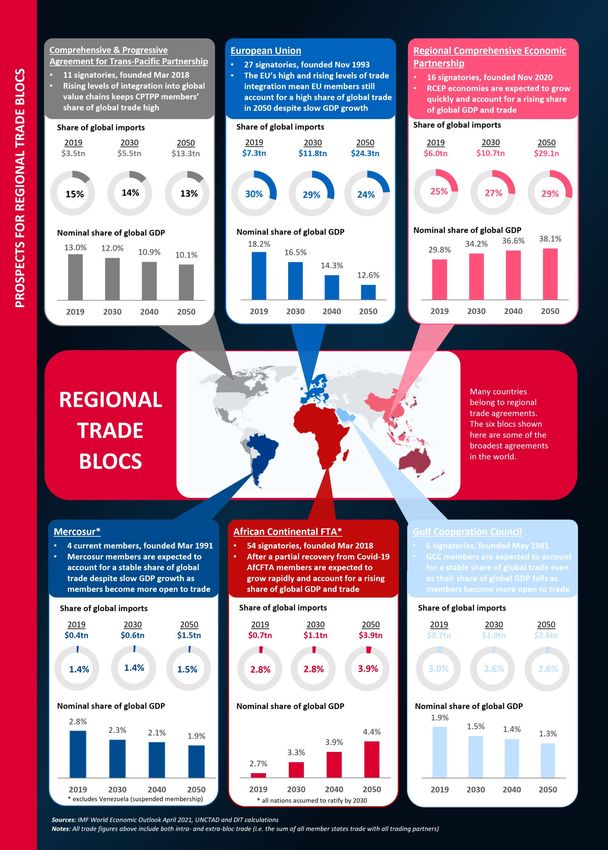
Prospects for regional trade blocs 25
Shifts in trading power 26
Top 30 largest importers 27
Sectoral structure of trade and GDP 28
Box A: Measuring trade by value-added 29
Global trade growth by sector 30
Regional drivers of sectoral trade 31
UK sectors of comparative advantage 32
Box B: UK trade by value-added 33
UK trade and trends in overseas income 34
UK trade prospects 35
36
Overview 37
Conditioning on IMF and OBR forecasts 38
Projecting GDP in the long term 40
Exchange rate assumptions 41
Forecast comparison 42
Projecting trade in the long-term 43
Projecting GDP and trade by sector 44
Sector definitions 45
Drivers of uncertainty: shocks & shifts 50
54
GDP Projections 55
Import Projections 57
Export Projections 59
3 │DIT Global Trade Outlook
4 │DIT Global Trade Outlook
1              Global Economic Backdrop

5 │DIT Global Trade Outlook

Global GDP will continue to expand over the
GLOBAL GDP GROWTH

                    coming decades, but at a slowing rate
                        Global GDP matters for trade. The larger the      Global economic growth is expected to slow in the
                        global economy, the more goods and                decades ahead
                        services available for trade.                     Chart 1: Global GDP growth in real terms
                        Global GDP grew by around two-thirds in                               Percentage change on a year earlier
                        real terms between 2000 and 2020 – or                                                                           7%
                        2.6% per year on average. The past two                                                                          6%
                        decades have been a volatile period in the                                                                      5%
                        world’s economic history, punctuated by the                                                                     4%
                        2008/9 financial crisis and the coronavirus                                                                     3%
                        pandemic (Chart 1). Excluding crisis years,                                                                     2%
                        growth averaged 3.5% per year in the 2000s                                                                      1%
                        (2000-2007) and 2.9% per year in the 2010s                                                                      0%
                        (2011-2019). This declining trend reflects a                                                                    -1%
                        range of factors, including slower growth in                                                                    -2%
                        the world’s population; a slower pace of                                                                        -3%
                        catch-up of emerging markets to the                                                                            -4%
                        technological frontier; and weaker economic          2000       2010       2020      2030       2040       2050
                        dynamism at the frontier itself – likely
                                                                          Sources: IMF World Economic Outlook April 2021 and DIT
                        reflecting a slower pace of globalisation.        calculations
                                                                          Notes: Data refer to real GDP growth for the world economy in 2019
                        Global GDP is expected to rebound in the          prices converted using 2019 market exchange rates – not Purchasing
                        near term from its pandemic-induced low.          Power Parity (PPP). As discussed in Section 3, all projections in this
                                                                          report are expressed in market exchange rates (either 2019
                        The 2021-2026 projections in this report are      exchange rates for real GDP or time varying exchange rates for
                        conditioned on the IMF’s April 2021               nominal GDP) unless stated otherwise because market exchanges
                                                                          rates are the more relevant metric for international trade. The
                        forecasts, which anticipate a rapid but partial   uncertainty band represents one standard deviation around growth
                        recovery from the pandemic (see Section 3).       projection based on 2001-2019 GDP outturns.

                        Over the coming decades, the underlying           In dollar terms, global GDP is expected to increase
                        pace of global growth is expected to slow –       by more than 300% over the next 30 years
                        averaging 2.3% per year in the 2030s and
                                                                          Chart 2: Global GDP in nominal terms
                        2.0% in the 2040s. These projections assume
                        the factors that have caused global growth to                               GDP, trillions US$, current prices
                        slow in the first twenty years of this century                                                                       800
                        will persist in the decades ahead. However,                                                                          700
                        these projections are subject to wide bands                                                                          600
                        of uncertainty both to downside risks (if                                                                            500
                        further economic shocks materialise) and                                                                             400
                        upside surprises (if technological progress                                                                          300
                        accelerates) – as discussed in Section 3.
                                                                                                                                             200
                        In dollar terms, the global economy is                                                                               100
                        expected to be worth around $380tn by                                                                            0
                        2050, up from $87tn in 2019 (and $84tn in          2000        2010        2020       2030        2040       2050
                        2020). This more than 300% increase partly          $34         $66         $84        $149       $242        $380
                        reflects real economic growth (which                 tn          tn          tn         tn         tn          tn

                        accounts for around a third of the overall        Sources: IMF World Economic Outlook April 2021 and DIT
                                                                          calculations
                        increase), with the rest reflecting significant
                                                                          Notes: Data refer to nominal GDP (inclusive of inflation and
                        changes in prices and market exchange rates       converted using time-varying exchange rates). The uncertainty bands
                        over the same period (Chart 2).                   represent one standard deviation around nominal GDP growth
                                                                          outturns for the 2001-2019 period.

                    6 │DIT Global Trade Outlook
The world’s economic centre of gravity will
ECONOMIC CENTRE OF GRAVITY

                             continue to shift eastward in the decades ahead
                              Rapid growth in the Indo Pacific region will pull the world’s centre of economic gravity further east
                              Chart 3: Global economic centre of gravity, 2000-2050

                              Sources: IMF World Economic Outlook April 2021 and DIT calculations
                              Notes: The global centre of economic gravity has been calculated by taking the geographic coordinates (latitude and longitude) of 190+ countries
                              and weighting them by nominal GDP figures expressed at market exchange rates for each year shown above.

                                  The world’s centre of economic gravity has                                   This eastward shift in global demand is
                                  been shifting eastward for decades – causing                                 projected to continue out to 2050. Between
                                  trade patterns to shift as it moves (Chart 3).                               2019 and 2050, 56% of global growth is
                                  This eastward shift is due to rapid growth in                                expected to come from the Indo Pacific,
                                  the Indo Pacific. Between 2000 and 2019, the                                 compared with a quarter from the EU and
                                  Indo Pacific accounted for 50% of global                                     North America combined (Chart 4). Growth
                                  economic growth in real terms. By contrast,                                  within the Indo Pacific is also expected to
                                  the EU contributed only 10% of growth and                                    rebalance over time, with South Asia’s
                                  over the same period (Chart 4).                                              contribution (driven by India) rising over time.

                              The Indo-Pacific region is expected to continue to account for more than half of global growth
                              Chart 4: Regional drivers of global economic growth in real terms

                                  2019-2050         7%           18%                   19%                                                                     56%

                                  2000-2019         10%              19%                     21%                                                               50%

                                               0%         10%          20%       30%         40%         50%         60%        70%         80%         90%        100%
                                                         EU      North America           Rest of World         Indo Pacific                   Share of global growth

                              Sources: IMF World Economic Outlook April 2021 and DIT calculations
                              Notes: Figures show the contribution of different regions to global GDP growth in real terms (expressed in constant 2019 prices and exchange
                              rates). The Indo Pacific region is defined as three DIT HM Trade Commissioner regions: South Asia, Asia Pacific and China & Hong Kong. ‘Rest of
                              world’ includes the UK, non-EU Europe, Eastern Europe & Central Asia, Latin America, Middle East and Africa.

                             7 │DIT Global Trade Outlook
8 │DIT Global Trade Outlook
The world’s largest emerging economies will be a
SHIFTS IN ECONOMIC POWER

                           growing source of economic power
                               Economic power is expected to continue to         The 7 largest emerging economies are expected to
                               shift from the G7 to the largest emerging         overtake the G7 in economic size during the 2030s
                               economies. In the first two decades of this       Chart 5: G7 and ‘E7’ share of global GDP
                               century, labour productivity growth (the
                               main driver of higher living standards) was                                            Share of global GDP
                                                                                                                                                70%
                               three times faster on average across the              65%
                                                                                               G7
                               seven largest emerging economies than                                                                            60%
                               across the G7. As a result, the G7’s share of
                                                                                                50%                                             50%
                               global GDP fell from 65% in 2000 to 46% in                                   46%
                                                                                                                                          41%
                               2020, while the ‘E7’s’ share rose from 11% to                                         40%       38%              40%
                               28% (Chart 5). Over the next thirty years,                                            33%       36%
                                                                                                                                          33%
                                                                                                                                                30%
                               labour productivity growth across the E7 is                                  28%

                               expected to grow at roughly twice the rate of                    22%                                             20%
                               the G7, with the E7 overtaking the G7 in              11%
                                                                                                                                                10%
                               economic size during the 2030s. This shift in                  ‘E7’
                               economic power is likely to mean emerging                                                                      0%
                               economies will play a growing role in the            2000        2010       2020      2030      2040       2050

                               global trading system (see Section 2).            Sources: IMF World Economic Outlook April 2021 and DIT
                                                                                 calculations
                               China is a major driver of this economic shift    Notes: Chart shows nominal GDP (converted into US dollars at time-
                                                                                 varying market exchange rates) for the G7 (Canada, France,
                               as it is expected to become the world’s           Germany, Italy, Japan, the United Kingdom and the United States)
                               largest economy by 2030. China already            and the E7 set of largest emerging markets in 2050 (Brazil, China,
                                                                                 India, Indonesia, Mexico, Russia and Turkey).
                               displaced the US in Purchasing Power Parity
                               (PPP) terms (which account for differences in
                               local prices) in the mid-2010s. But based on      China is expected to become the world’s largest
                               market exchange rates, which are more             economy by 2030
                               relevant for trade (as discussed in Section 3),   Chart 6: US and Chinese GDP in dollar terms
                               the overtake is expected to happen around
                               2030 (Chart 6). At that point both countries                                GDP, trillions US$, current prices
                                                                                                                                                 300
                               will account for around 22% of global GDP.

                               Other emerging economies, particularly                                                                            250
                               those with large populations like India and
                                                                                                                                                 200
                               Indonesia, are also expected to rise up the
                               economic rankings. Emerging economies are
                                                                                                                                                 150
                               generally expected to grow faster than more
                               established markets as they can rapidly raise                                                           China
                                                                                                                                                 100
                               productivity by adopting best practice
                               techniques from overseas. However, while                                                                          50
                               emerging economies have significant ‘catch-                 United States
                               up’ potential, they also face major challenges                                                                  0
                               – including the need to shift from imitation        2000        2010        2020      2030       2040       2050
                               to innovation to escape the middle-income         Sources: IMF World Economic Outlook April 2021 and DIT
                               trap, tackle indebtedness, and rebound from       calculations
                               the pandemic. Given these challenges, the         Notes: Data are for nominal GDP converted into US dollars at time-
                                                                                 varying market exchange rates. The uncertainty bands represents
                               long-term projections in this report are          one standard deviation around growth projection based on 2001-
                               subject to high degrees of uncertainty –          2019 GDP outturns.
                               particularly the relative rankings of emerging
                               economies in 2050 (Chart 7).

                           9 │DIT Global Trade Outlook
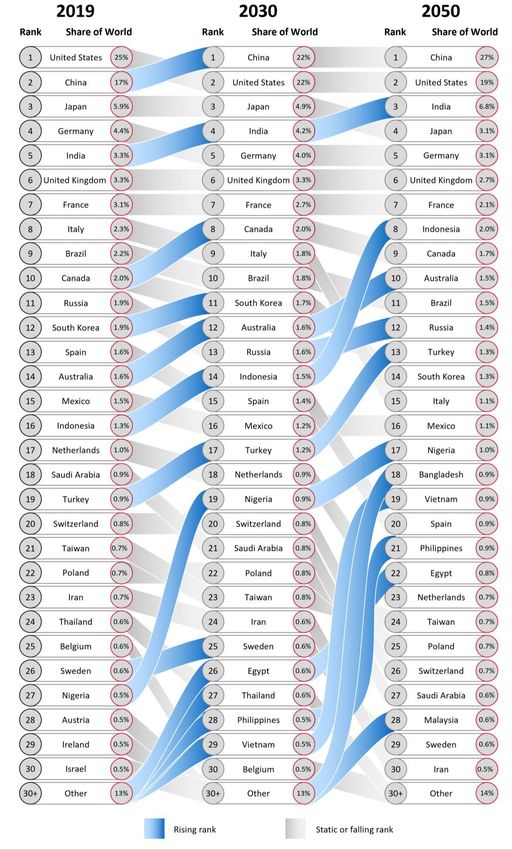
The ranking of the world’s 30 largest economies will shift over the next 30 years as heavily populated
TOP 30 LARGEST ECONOMIES

                                      emerging economies like China, India and Indonesia leapfrog more established markets
                                                                Chart 7: The world’s largest economies, 2019-2050

                           Sources: IMF World Economic Outlook April 2021 and DIT calculations
                           Notes: Rankings are based on nominal GDP expressed in percentage of global nominal GDP at time-varying market exchange rates. Totals may not
                           equal 100% due to rounding.

                           10 │DIT Global Trade Outlook
The world’s growing population will continue to
GLOBAL POPULATION GROWTH
boost economic growth but by less than in the past
The world’s population will continue to grow but at a slowing rate – rising by 2bn between 2020 and 2050
Chart 8: Changes in the world’s population, 1980-2050
Billions of people
11 11
Global Population 6%
10 10
Decadal increase in population 8%
0.54
9 Decadal growth rate 10% 0.65 9
12% 0.75
8 8
13% 0.83
7 17% 7
0.81
6 20% 6
0.87
5 0.86 5
4 4
4.37 5.23 6.10 6.91 7.75 8.49 9.14 9.68
3 3
1980 1990 2000 2010 2020 2030 2040 2050
Sources: UN World Population Prospects (2019) and DIT calculations
Notes: Global figures exclude population estimates for countries with limited data including Cuba, North Korea and some small island states.
The world’s population is expected to rise Most of the world’s population growth is
from 7.8bn in 2020 to 8.5bn by 2030. This ¾ likely to come from lower income countries in
billion rise is substantial, but it will be the Africa and Asia. Countries with per capita
smallest decade-long rise since the 1960s. incomes of less than $4,045 in 2019 (the World
Global population growth has been slowing for Bank threshold for lower-middle income
decades as populations in advanced countries), will account for over 75% of global
economies have plateaued and birth rates in population growth in the 2020s and over 90%
emerging markets have tapered. Slower during the 2040s (Chart 9). Some of these
population growth tends to result in slower lower income countries may capitalise on their
economic growth (after 15-20 years) as there demographic booms and grow quickly, but
are fewer new workers, entrepreneurs and others may be hampered by gaps in education,
consumers to drive economic activity and infrastructure and employment opportunities.
demand. Global population growth is So, while population growth will continue to
expected to continue to ease out to 2050 – support global GDP, it is likely to provide less of
when there should be 9.7 billion people on the a boost than when populations in high-
planet or 2 billion more than today (Chart 8). productivity countries were growing quickly.
Most of the growth in the world’s population will be driven by lower and lower-middle income countries
Chart 9: Sources of global population growth by country-income grouping
2040-2050
2030-2040
2020-2030
2010-2020
2000-2010
0% 10% 20% 30% 40% 50% 60% 70% 80% 90% 100%
Share of global population growth accounted for by countries of different income levels
Low Income (2019 per capita income: $0 - $1,035) Lower Middle Income ($1,035 - $4,045)
Sources: UN World Population Prospects (2019), IMF World Economic Outlook April 2021 and DIT calculations
Notes: Figures show the contribution of different country-groups to global population growth based on their per capita income level in 2019
compared with the World Bank’s income thresholds.
11 │DIT Global Trade OutlookAgeing workforces will hold back growth, while
AGEING AND URBANISATION TRENDS
urbanisation will continue to provide a tailwind
By 2030, there will be 1 billion people over The world is growing older – by 2050 1 in 6 people
the age of 65 (Chart 10). This grey billion will will be over the age of 65
have different consumption preferences to Chart 10: World population by age group, 2000-
the rest of society, creating new 2050
opportunities (e.g. for healthcare and leisure Billions of people
services) as well as risks for trade. 7
Ageing societies will face economic 6.1 6
Working age: 5.5
headwinds that could hold back economic 15-64 5.1 5
growth and trade. As countries age and their
populations decline, a shrinking workforce 3.9 4
must shoulder the welfare costs of more
3
people. As the dependency ratio rises there
Young: 0-14 2.1 2
will be less disposable income for 1.9 2.0 2.0
consumption. Around 30 countries are 1.5
Old age: 65+ 1.0 1
expected to see their populations shrink in 0.7
0.4
the 2020s (including Germany, Russia, South 0
Korea, Japan) while others – notably China – 2000 2010 2020 2030 2040 2050
will see their populations peak around 2030. Sources: UN World Population Prospects (2019) and DIT calculations
At a regional level, workforces are expected
to shrink in Europe and China, weighing on Ageing populations will see workforces shrink in
growth in both regions (Chart 11). Europe and China in the coming decades
Chart 11: Change in workforce by region, 2020-
The urbanisation of the global economy is
2030
expected to continue, with an additional 800
million people living in cities by 2030. In Europe
2020, 4.4 billion people lived in urban areas – China & Hong Kong
56% of the world’s population. By 2030, this E.Europe & C.Asia
figure could reach 5.2 billion (60%) and by United Kingdom
2050 6.7 billion (68%). This assumes that the North America
long-term urbanisation trend continues and
Asia Pacific
that the COVID-induced flight from cities
Latin America
seen in some countries is temporary (Chart
South Asia
12). Urbanisation is linked to higher
productivity and higher living standards as Middle East
cities offer economies of scale, agglomeration Africa
benefits and act as hubs for trade. So rising -10% 0% 10% 20% 30% 40%
urbanisation rates are expected to continue Change in size of working age population: 2020-2030
to provide a tailwind to economic growth in Sources: UN World Population Prospects (2019) and DIT calculations
the decades ahead. Notes: The workforce is defined as the population aged 15-64.
The global urbanisation wave is expected to continue out to 2050
Chart 12: Global urbanisation rate, 1950-2050
Sources: UN World Population Prospects (2019), UN Urbanization Population Prospects (2019) and DIT calculations
12 │DIT Global Trade OutlookDEMOGRAPHIC TRENDS BY REGION
13 │DIT Global Trade OutlookAdvances at the technological frontier and
TRENDS IN PER CAPITA INCOME
‘catch-up’ potential will boost global growth
Productivity growth at the technological Living standards in emerging markets are expected
frontier is expected to rise by 1.4-1.5% per to rise twice as fast as in advanced economies
year out to 2050. One of the fundamental Chart 13: Growth in real GDP per capita growth
drivers of global economic growth is how
Average annual growth rate
fast innovation at the technological frontier 5%
– typically proxied by labour productivity
growth in the United States – is advancing. 4%
New technologies could see productivity
growth surge forward in the decades ahead, 3%
while other factors – such as rising
inequality, public indebtedness, and lower 2%
R&D spending could all weigh on growth. 1
1%
Given the wide bands of uncertainty, the
projections in the Outlook take a neutral
0%
view and assume that US real GDP per 2000-2010 2010-2020 2020-2030 2030-2040 2040-2050
worker will average 1.5% per year in the Emerging and Developing Economies
2020s before edging down to 1.4% between Advanced Economies
2030 and 2050. This gradual easing reflects Sources: IMF World Economic Outlook April 2021, UN World
an anticipated plateau in educational Population Prospects (2019) and DIT calculations
attainment – average years of schooling are Notes: Data are for real GDP converted into US dollars at constant
2019 prices and exchange rates and divided by aggregate population
not rising as quickly as in the past and of the respective group. The classification used for advanced,
cannot keep rising indefinitely. emerging and developing economies are as of 2020 and are aligned
with the IMF WEO’s definitions.
Living standards in emerging markets will
rise much more quickly than in advanced Living standards in emerging markets will see some
economies but the pace of convergence is catch-up to the technological frontier but will
expected to slow (Chart 13). Today’s remain well below those in the US even by 2050
advanced economies will remain by far the Chart 14: Regional living standards relative to the
world’s richest countries on a per capita United States
basis, but the gap with emerging economies Nominal GDP per capita relative to the U.S.
will shrink as emerging economies adopt 40%
cutting edge technologies from the frontier
and benefit from ‘catch-up’ potential. In 30%
nominal terms, per capita incomes in the
United States in 2050 could remain more
20%
than double those in China, four times those
in the Asia Pacific region, ten times those in
South Asia, and twenty times those in Africa 10%
(Chart 14). However, the extent of this
convergence is highly uncertain. Some 0%
Middle
Pacific
E.Europe
America
South
Hong Kong
Africa
& C. Asia
countries may struggle to switch from
Asia
Asia
China &
East
Latin
imitation-led growth to innovation-led
growth and get caught in the middle-
income trap, while others may be successful 2000 2010 2020 2030 2040 2050
in developing cutting edge-technologies Sources: IMF World Economic Outlook April 2021, UN World
Population Prospects (2019) and DIT calculations
that enable them to grow even faster.
Notes: Data are for nominal GDP converted into US dollars at time-
varying market exchange rates and divided by total population.
1 See Rachel and Smith (2015) ‘Secular drivers of global real interest rates’ for a discussion.
14 │DIT Global Trade OutlookThe number of ‘high-income’ countries will rise
INCOME LEVELS ACROSS THE WORLD
over time, increasing demand for trade
By 2050, there could be 90 ‘high income’ countries, up from 60 in 2019
Chart 15: Income per capita in 2019 and changes in the number of high income countries, 2019-2050
Sources: IMF World Economic Outlook April 2021, UN World Population Prospects (2019), World Bank World Development Indicators and DIT
calculations
Notes: Data are for nominal GDP converted into US dollars at time-varying market exchange rates and divided by total population. Income
thresholds refer to income per capita levels on a GNI basis and are based on the World Bank’s low, lower middle, upper middle and high income
categories for 2019. These thresholds values are assumed to grow by 2.3% each year out to 2050 (in line with the average annual growth rate in
GDP deflators for advanced economies). The ‘very high’ income category is not an official World Bank threshold but is defined as having a per
capita income greater than $40,000 in 2019 prices, which is in line with per capita income in the UK in recent years.
GDP is not the only thing that matters for The number of high-income countries is likely
trade – income levels also matter. Low- to increase to around 70 by 2030 and these
income countries with big populations can countries could account for over four-fifths of
have large economies (high GDP), but still global import demand. Newly classified high-
represent only small sources of import income countries are likely to include China,
demand due to their limited purchasing Malaysia, Russia and Turkey that will all see
power, different consumption preferences significant increases in living standards.
and limited role in global value chains.
By 2050, there could be 90 high-income
In 2019, over two-thirds of global import countries, while a handful of countries could
demand was concentrated among the become as rich as the UK is today (in real
world’s 60 high-income countries (blue- terms). South Korea, Taiwan and a smattering
shaded countries in Chart 15). The richest of Eastern European countries could see their
26 of these markets had average per per capita incomes rise above $40,000 (in 2019
capita incomes over $40,000 - on a par or prices) by 2050 – providing a further crop of
richer than the UK. Global import demand ‘very-high’ income markets to spur demand for
is particularly concentrated among these imports.
‘very high’ income countries, who
accounted for 54% of imports in 2019.
15 │DIT Global Trade OutlookThe world’s growing middle class will be a key
THE GLOBAL MIDDLE CLASS
source of global demand
A country’s average income per capita can Average per capita incomes can mask significant
mask significant variations in income differences in incomes within countries
within a country. In countries where Chart 16: Income inequality within countries
income inequality is high (such as South
Africa) the top 10% of earners can account Income share of top 10% of highest earners (%)
55
for over 50% of the country’s income (Chart South Africa
16). Income inequality affects the size of the 50
Bahrain
middle class in each market, and hence the 45
level of demand for high-value traded Brazil
40 India
consumer goods and services.
United States
35 Indonesia
In 2019, there were around 1.7 billion
China Japan
‘middle class’ consumers in the world – 30 Logarithmic
equivalent to one in every five people line of best fit
25 UK
(Chart 17). The size of the global middle
Switzerland
class is calculated by analysing income 20
Luxembourg
distributions within countries and Germany
15
calculating the number of individuals within 25 50 75 100 125
each country with an annual income of at Income per capita in 2019 (US$ '10,000s)
least $12,535 (the World Bank’s definition
Sources: IMF World Economic Outlook April 2021, UN World
of ‘high income’). As living standards rise Population Prospects (2019), UN World Income Inequality Database
and households have more disposable and DIT calculations
income, their consumption patterns tend to Notes: Data on income distributions are for the latest year available
(usually 2016-2018) for 180+ countries.
shift away from necessities towards more
luxury goods and services. Low-income There could be almost 2 billion more middle class
households tend to spend most of their consumers on the planet by 2050
income on food and clothing, whereas high Chart 17: World population by income threshold
income households tend to spend
significantly more on housing, transport,
2050
leisure services and high value consumption
3.5bn Global Middle Class
goods. So as the world becomes richer,
demand for higher-value traded goods and 2030
services is likely to rise. 2.3bn
By 2030, the size of the global middle class 2019
could reach 2.3 billion – equivalent to one 1.7bn
in every four people. Between 2019 and 0 2 4 6 8 10
2030, China is expected to account for the Billions of people
bulk (0.4bn) of the 0.6 billion increase in the "Very high" Income High income,
global middle class, while four other regions Upper Middle Income Lower Middle Income
Low Income
– Asia Pacific, South Asia, Europe, and
Eastern Europe/Central Asia – are each Sources: IMF World Economic Outlook April 2021, UN World
Population Prospects (2019), UN World Income Inequality Database,
expected to add a further 35-40 million. World Bank World Development Indicators and DIT calculations
Notes: Figures are calculated by applying current income distributions
By 2050, the global middle class could within each country to projections for nominal GDP per capita and
reach 3.5 billion people – equivalent to one population. Income thresholds are extrapolated forward from the
World Bank’s income thresholds in 2019 and are increased by 2.3%
in every three people. Over half of these each year. In 2019, the thresholds were: high income = $12,535+,
middle-class consumers are likely to live in upper middle income = $4,045 - $12,535, lower middle income =
$1,035 - $4,045; and low income = $0 - $1,035. ‘Very high’ income is
China and the Indo Pacific (see overleaf). not a World Bank category but is defined as having income greater
than $40,000 in 2019 – broadly in line with UK per capita income.
16 │DIT Global Trade OutlookMIDDLE CLASS BY REGION
17 │DIT Global Trade OutlookThe industrial structure of the global economy is
GLOBAL GDP GROWTH BY SECTOR
likely to become more services-oriented
Shifts in spending patterns are expected to All sectors of the global economy will expand in the
gradually change the industrial structure of decade ahead, but at different rates
the global economy. All sectors will grow Chart 18: Global GDP by sector, 2019-2030
over the next decade (Chart 18), but rising
incomes, changing consumer preferences Private Services (NIE)
and technological advances will mean some Public Services
sectors grow faster than others (Chart 19). Business Services
Financial Services
Rising incomes should see demand for Construction
services grow quickly and their share of IP, Recreation & Media
global GDP rise from 75% to 77% between Transport Services
Agriculture
2019 and 2030. As living standards rise and
Digital Services
middle-class populations expand (mostly in
Manufactured Materials
Asia) demand for service sectors – including Travel Services
intellectual property recreation & media, Food & Beverages
financial, digital and transport services – Power & Heat
should all rise quickly. Mining & Metals
Oil & Gas
Other sectors will see their share of global Consumer Goods (NIE)
GDP fall, either as shifts in consumer Life Sciences
preferences reduce demand or technology Automotive
reduces prices. The oil and gas sector is Chemicals
projected to grow relatively slowly this Advanced Manufacturing
Machinery & Equipment
decade as the green transition accelerates.
Aerospace & Other Transport
Meanwhile, high productivity growth and
Clothing & Footwear
technological progress are expected to drive
2019 0 5 10 15 20 25 30 35
down prices in some manufacturing sectors Growth to 2030 Global sector GDP, US$ trillions
– reducing their share of nominal GDP Sources: IMF World Economic Outlook April 2021, UNCTAD, Oxford
despite growing rapidly in real terms. This Economics and DIT calculations
trend is already evident in the clothing and Notes: Data are for nominal GDP in US dollars at time-varying market
exchange rates. Sectors are defined in Section 3. NIE means ‘Not
footwear, machinery and equipment, and Included Elsewhere’.
automotive sectors.
The sectoral mix of the global economy will shift only gradually over the next decade
Chart 19: Change in sectoral shares of global GDP between 2019 and 2030
Percentage point change
1.0%
0.5% Sectors growing less quickly than global GDP
0.0%
-0.5% High-growth sectors
-1.0%
Sources: IMF World Economic Outlook April 2021, UNCTAD, Oxford Economics and DIT calculations.
Notes: Data show the change in each sector’s share of global GDP in US dollars converted at time-varying market exchange rates. Sectors are
defined in Section 3. NIE means ‘Not Included Elsewhere’.
18 │DIT Global Trade OutlookThe US and EU’s share of global GDP is expected
REGIONAL DRIVERS OF SECTORAL GDP
to fall in almost all sectors
Different regions have markedly different Rapid growth in the Indo Pacific should see
industrial structures – due to variations in the US and EU’s share of global production fall
local demand, factor endowments, and in almost all sectors out to 2030 (right panel,
sectors of comparative advantage (left Chart 20). The Indo Pacific’s share of global
panel, Chart 20). The EU and North America GDP is expected to rise in industrial sectors as
are more specialised in service sectors and its share of global manufacturing continues to
some hi-tech manufacturing sectors (such expand, as well as in some service sectors –
as aerospace), while economies in the Indo including travel, financial and recreational
Pacific tend to be more specialised in services – as the rising purchasing power of
manufacturing and primary production. Asia’s growing middle class increases demand.
The US and EU’s share of global production is expected to fall in almost all sectors out to 2030
Chart 20: Sectoral shares of global GDP by region in 2019 and expected change to 2030
Regional share of global GDP in 2019 Change in share 2019-2030
All Sectors
Business Services
Public Services
Life Sciences
Travel Services
Aerospace & Other Transport
Private Services (NIE)
Digital Services
Financial Services
IP, Recreation & Media
Power & Heat
Machinery & Equipment
Automotive
Chemicals
Consumer Goods (NIE)
Transport Services
Manufactured Materials
Construction
Food & Beverages
Oil & Gas
Advanced Manufacturing
Mining & Metals
Clothing & Footwear
Agriculture
0% 25% 50% 75% 100% -10% -5% 0% 5% 10%
North America EU Rest of World Indo Pacific
Sources: IMF World Economic Outlook April 2021, UNCTAD, Oxford Economics and DIT calculations.
Notes: Data are for nominal GDP in US dollars at time-varying market exchange rates. Sectors are defined in Section 3. NIE means ‘Not Included
Elsewhere’. The Indo Pacific region is defined as three DIT HM Trade Commissioner regions: South Asia, Asia Pacific and China & Hong Kong.
‘Rest of world’ includes the UK, non-EU Europe, Eastern Europe & Central Asia, Latin America, Middle East and Africa.
19 │DIT Global Trade OutlookThe UK should remain one of the world’s largest
UK ECONOMIC PROSPECTS
economies despite a falling share of global GDP
The UK was the 6th largest economy in the In nominal US dollar terms, the UK economy could
world in 2019 and is projected to remain rise to almost $5tn by 2030 and $10tn by 2050
broadly in that position out to 2050. All UK Chart 21: UK Nominal GDP in US dollar terms
projections in the Outlook are based on the
Office for Budget Responsibility’s March GDP, trillions US$, current prices
35
2021 forecasts in the near term and long-
30
term projections out to 2050. These suggest
25
the UK economy will grow by around 15% in
real terms between 2019 and 2030 and by 20
over 50% between 2019 and 2050. In 15
nominal dollar terms – including inflation and 10
the IMF’s exchange rate forecasts – the UK 5
economy could increase from $2.8tn (£2.2tn) 0
in 2019 to around $5tn (£3.2tn) by 2030 and 2000 2010 2020 2030 2040 2050
around $10tn (£6.8tn) by 2050 (Chart 21).
$1.7 $2.5 $2.7 $4.9 $7.2 $10.4
tn tn tn tn tn tn
The UK’s share of global GDP is expected to
continue to edge lower, from 3.3% in 2019 Sources: IMF World Economic Outlook April 2021, Office for Budget
to around 2.7% by 2050. The UK’s share of Responsibility Economic and Fiscal Outlook March 2021 and Long-
Term Economic Determinants and DIT calculations
global activity has been on a falling trend for Notes: Data refer to nominal GDP from the Office for Budget
decades (Chart 22). This reflects a positive Responsibility’s forecasts and projections, converted into US dollars
phenomenon – rising living standards using the IMF’s forecasts out to 2026 and then holding the 2026 US-
GBP exchange rate fixed over the 2027-2050 period. The uncertainty
overseas. As the rest of the world becomes bands represent one standard deviation around nominal GDP growth
richer, the UK’s relative economic weight will outturns for the 2001-2019 period.
tend to fall but the economic opportunities
for the UK to grow via trade will increase. The UK’s economic weight in the world is expected
to continue its gradual long-term decline
The UK still punches above its weight in
economic terms given that less than 1% of Chart 22: UK share of global GDP and population
the world’s population live in the UK. The UK share of world
UK’s share of the global population is 6%
expected to decline from 0.9% in 2019 to
around 0.7% by 2050. Despite that, the UK’s UK share of global 5%
nominal GDP
share of global GDP, at 2.7%, is expected to
4%
remain almost four times its population
weight. That reflects the UK’s high level of 3%
per capita income, which remains more than
double the global average out to 2050. UK 2%
per capita incomes are expected to grow by UK share of global
population
around 1% in real terms on average per year 1%
between 2019 and 2030. This relatively slow
rate of growth partly reflects the negative 0%
impact of the coronavirus pandemic. By 2000 2010 2020 2030 2040 2050
Sources: IMF World Economic Outlook April 2021, UN World
contrast, between 2030 and 2050, growth in Population Prospects (2019), Office for Budget Responsibility
UK per capita incomes is expected to average Economic and Fiscal Outlook and Long-Term Economic Determinants
(March 2021) and DIT calculations
1.4% per year. These figures equate to a real Notes: The uncertainty bands represent one standard deviation
term increase in UK average incomes from around growth outturns for the 2010-2019 period.
£33k in 2019, to £37k by 2030 and almost
£50k by 2050 (in 2019 UK prices).
20 │DIT Global Trade Outlook2 The Future of Global Trade 21 │DIT Global Trade Outlook
Global trade is expected to grow broadly in line
GLOBAL TRADE GROWTH

                      with global GDP growth
                          Global trade growth is closely related to         After rebounding from the COVID-19 shock, global
                          GDP growth. The faster the world economy          trade is expected to grow in line with global GDP
                          grows the faster trade tends to grow.             Chart 23: Global trade growth vs global GDP
                          However, trade is also more volatile than         growth (in real terms)
                          GDP (Chart 23). This is partly because most
                          trade flows involve manufactured goods,                             Percentage change on a year earlier
                                                                                                                                         15%
                          which tend to vary more over the business
                          cycle than the service sectors that dominate
                          global GDP. The outlook for global trade is                                                                    10%
                                                                                                   Global trade
                          therefore even more uncertain than for GDP.
                                                                                                                                         5%
                          The IMF estimate world trade volumes fell
                          by 8.5% in 2020 and will rebound by a
                                                                                                                                         0%
                          similar amount in 2021. The IMF’s April
                          2021 forecasts – on which the near-term                                  Global GDP
                          projections in the Outlook are based –                                                                         -5%
                          assume trade will rebound from COVID-19
                          more slowly than global GDP (Chart 23).                                                                       -10%
                                                                              2010          2020         2030          2040         2050
                          During the 2030s and 2040s, global trade
                          volumes are projected to grow in line with        Sources: IMF World Economic Outlook April 2021, UNCTAD and DIT
                                                                            calculations
                          global GDP growth. There are many factors
                                                                            Notes: Data are for real GDP and imports converted into US dollars at
                          that could cause trade to grow faster or          constant 2019 market exchange rates. The uncertainty band
                          slower than GDP. These include: stability of      represents one standard deviation around growth projection based
                                                                            on 2010-2019 outturns.
                          the global trading system; political appetite
                          for cross-border integration; business
                          attitudes towards global value chains; and        In dollar terms, global trade is expected to increase
                          technological change. The projections in the      by over 300% over the next 30 years
                          Outlook take a neutral view of these factors      Chart 24: Global imports in nominal dollar terms
                          and assume the status quo is maintained
                                                                                                Imports, trillions US$, current prices
                          over the next 30 years. For example, in the                                                                       400
                          case of the trading system, there is neither a                                                                    350
                          further wave of globalisation – as happened
                                                                                                                                            300
                          before the global financial crisis – nor a turn
                          inward. Different scenarios are clearly                                                                           250
                          possible, so figures in the Outlook should be                                                                     200
                          treated with wide bands of uncertainty. See                                                                       150
                          Section 3 for more on projection
                          assumptions and alternative scenarios.                                                                            100
                                                                                                                                            50
                          By 2050, the value of global trade in dollar
                                                                                                                                           0
                          terms is expected to be worth around
                                                                             2010           2020          2030          2040           2050
                          $100tn, up from $24tn in 2019 (Chart 24).
                          That 300% increase is broadly in line with the      $18            $22           $40           $65           $100
                                                                               tn             tn            tn            tn            tn
                          rise in global GDP over the same period, with
                          imports accounting for around a quarter of        Sources: IMF World Economic Outlook April 2021, UNCTAD and DIT
                          global GDP. Data quality and coverage mean        calculations
                          that the Outlook focuses on gross trade. For      Notes: Data are for nominal imports (inclusive of price changes)
                                                                            converted into US dollars at time-varying market exchange rates. The
                          more on value-added trade see Boxes A & B.        uncertainty band represents one standard deviation around the
                                                                            projection based on 2010-2019 outturns.

                      22 │DIT Global Trade Outlook
Global trade will continue to be dominated by
REGIONAL DRIVERS OF GLOBAL TRADE
four regions of the world
Four regions – Europe, North America, China Import demand will remain unevenly distributed
and the Asia Pacific – dominate global trade. across the world - four regions will continue to
In 2019, these four regions accounted for 78% dominate global trade
of global imports and GDP (Chart 25). Chart 25: Regional shares of global GDP and
But unlike GDP, it is not North America and global imports in 2019 and 2050
China that are the biggest regions for trade – UK E. Europe & C. Asia
that honour falls to Europe and Asia Pacific. Africa
Europe 4% 3%
This is because of cross-border supply chains. 3%
Middle East
While a region’s GDP gives a sense of its 3%4% 4% L. America
3%
importance as a source of global demand, a 33% 20% 3% 5%
6% S. Asia
region’s importance for trade also depends on 3%
4%
how often goods and services cross its borders.
Differences in comparative advantage, 2019 14%
resource endowments and demographics all 27% 16%
create incentives for regional supply chains to Asia
17% Pacific
develop across Europe and the Asia Pacific. 15%
North 13% China &
By 2050, the four biggest regions will continue America
Hong Kong
to dominate global import demand, but South
Inner circle = Share of global GDP
Asia will also play a growing role. Europe is
Outer circle = Share of global imports
still likely to be the world’s largest import
UK E. Europe & C. Asia
market in 2050 but its share of global trade is Africa
Europe
expected to fall due to its slow pace of GDP 3% 4% Middle East
growth. By contrast, rapid economic growth in 3%4%
4%
28% 4% L. America
the Indo Pacific – including in South Asia (led 14% 4%
3%
5%
by India) – should see Asia’s share of global 5%
S. Asia
trade rise and the axis of global trade shift 8% 7%
further East (Charts 25 & 26).
20%
2050
12%
These trends will also affect the relative size
13% Asia
of regional trade agreements over time. For 27%
16%
Pacific
example, the Comprehensive and Progressive North
Trans-Pacific Partnership’s (CPTPP) import America 17% China &
Hong Kong
market size (based on its existing 11 members)
Sources: IMF World Economic Outlook April 2021, UNCTAD and
could reach 54% of the EU-27 market by 2050 DIT calculations
– up from 48% in 2019 (see following pages). Notes: Shares of global GDP and imports are expressed in nominal
dollar terms, measured at time varying prices and exchange rates.
Over four-fifths of the growth in global import demand is expected to come from outside the EU
Chart 26: Regional drivers of global import growth
2019-2050 19% 12% 25% 44%
2005-2019 30% 11% 17% 42%
0% 10% 20% 30% 40% 50% 60% 70% 80% 90% 100%
EU North America Rest of World Indo Pacific
Sources: IMF World Economic Outlook April 2021, UNCTAD and DIT calculations
Notes: Figures show the contribution of different regions to global import growth in real terms (expressed in constant 2019 prices and exchange
rates). The Indo Pacific region is defined as three DIT HM Trade Commissioner regions: South Asia, Asia Pacific and China & Hong Kong. ‘Rest of
world’ includes the UK, non-EU Europe, Eastern Europe & Central Asia, Latin America, Middle East and Africa.
23 │DIT Global Trade Outlook24 │DIT Global Trade Outlook
25 │DIT Global Trade Outlook
Emerging economies are likely to account for a
SHIFTS IN TRADING POWER
growing share of trade as economic power shifts East
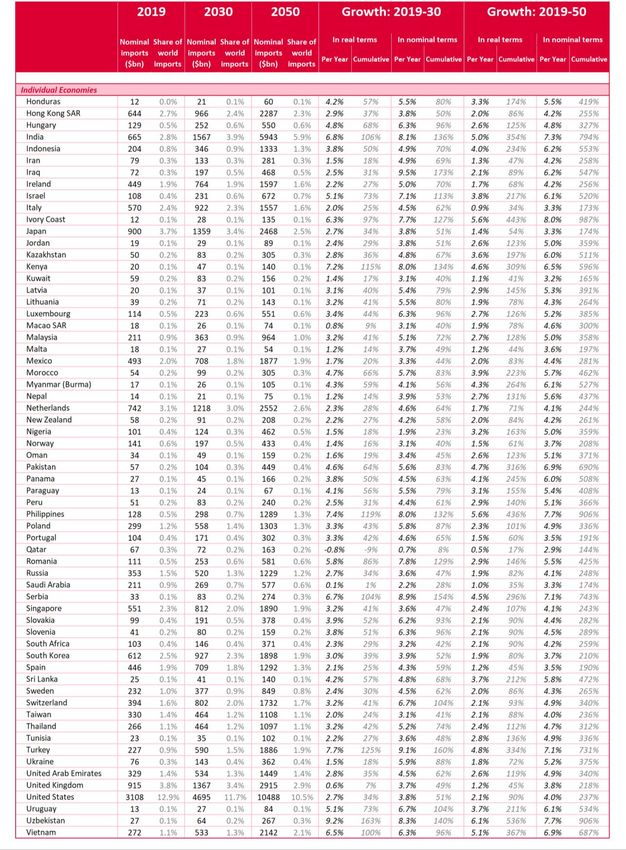
Global trade is concentrated – the top 30 The top 30 import markets are expected to account
markets accounted for over 80% of global for more than three-quarters of global import growth
import demand in 2019. Within this group, Chart 27: Growth in nominal import market size
the 10 largest importers accounted for over between 2019, 2030 and 2050 in US dollar terms
half of global import demand.
2019-2030
Growth in global imports is expected to be
similarly concentrated in the coming decades.
More than three-quarters of the growth in
global import demand out to 2030 and to 2050
is expected to come from the current 30
largest markets. This includes two countries –
the US and China – whose import markets are
expected to grow by well over a trillion dollars
this decade (Chart 27).
2019-2050
Over the next decade, China is expected to
overtake the US to become the world’s largest
importer despite China gradually becoming
less reliant on trade. China is already the
world’s largest exporter, and its share of global
trade is expected to keep growing as its
economy expands. However, as Chinese
consumers become wealthier and Chinese
production becomes more advanced, China’s
economic structure is expected to shift – with
more domestically produced goods and Sources: IMF WEO April 2021, UNCTAD and DIT calculations
services consumed at home. As a result, Notes: Data are for nominal imports (inclusive of price changes)
import demand is expected to fall as a share of converted into US dollars at time-varying market exchange rates.
China’s GDP from 17% in 2019 to 14% in 2050 The 7 largest emerging economies are expected to
– similar to the US’s current level of openness. match the G7’s import market size by 2050
Chart 28: G7 and ‘E7’ share of global import demand
The role of emerging economies in the trading
system will rise over time, consistent with Share of global import demand
their growing weight in the global economy. 40%
38%
The ‘E7 group’ of the 7 largest emerging 35%
economies – China, India, Brazil, Russia, 35%
33%
Indonesia, Mexico and Turkey – are expected G7
29% 30%
to equal the G7’s share of global import 28%
demand by 2050 (Chart 28). However, while 26% 25%
the E7 are the biggest emerging markets in 27%
terms of GDP, they are not the biggest ‘E7’ 22%
20%
20%
importers in the emerging world. Other 17%
economies – such as Vietnam and the 15%
Philippines – are expected to grow more 2010 2020 2030 2040 2050
rapidly in the coming decades and rise up the Sources: IMF WEO April 2021, UNCTAD and DIT calculations
global import rankings as they become more Notes: Nominal imports (converted into US dollars at time-varying
integrated into global value chains (Chart 29). market exchange rates) for the G7 (Canada, France, Germany, Italy,
Japan, the UK and US) and the E7 largest emerging economies in 2050
(Brazil, China, India, Indonesia, Mexico, Russia and Turkey).
26 │DIT Global Trade OutlookThe world’s top 30 import markets in 2030 and 2050 are expected to be similar to the largest import markets
TOP 30 LARGEST IMPORTERS
in 2019, albeit with some changes in ranking as emerging Asian economies rise up
Chart 29: The world’s largest importers, 2019-2050
Sources: IMF World Economic Outlook April 2021, UNCTAD, Office for Budget Responsibility and DIT calculations
Notes: Rankings are based on nominal imports converted into US dollars terms using time-varying market exchange rates and prices. 2019 figures
for all countries (except the UK) are calculated by summing UNCTAD’s balance of payments data for goods (which were released in December
2020), and UNCTAD’s international trade in services data (released in July 2021). UK figures have been converted from the Office for Budget
Responsibility’s March 2021 near term forecast and long-term projection figures into US dollars.
27 │DIT Global Trade OutlookSECTORAL STRUCTURE OF TRADE AND GDP
The sectoral structure of global trade is currently
dominated by goods sectors, unlike global GDP
The sectoral mix of global trade is very The goods-heavy mix of global trade partly
different to GDP. In 2019, goods sectors reflects differences in tradability and market
accounted for 25% of GDP but 75% of trade access barriers for services. As well as data
flows (Chart 30). This difference partly definitions, some services (e.g. hairdressers)
reflects data definitions – GDP is measured are inherently less tradable than goods,
on a value-added basis while most trade which reduces their share in global trade. In
data refer to gross flows, which include the addition, trade liberalisation efforts have
cost of inputs as well as value added (see historically tended to favour goods sectors.
Box A). This difference over-weights the The WTO estimates that in 2019, barriers to
role of goods, whose supply chains cross goods trade were around half those of
borders many times, and under-weights the services.
value of services embedded in goods trade.
Differences in tradability mean that the sectoral mix of global GDP is very different to global trade
Chart 30: Sectoral composition of global GDP and global trade in 2019
Composition of global GDP Composition of global imports
Sources: IMF World Economic Outlook April 2021, Oxford Economics, UNCTAD and DIT calculations
Notes: Sectors are defined in Section 3. * indicates ‘Not Included Elsewhere’. Figures show share of global GDP (left panel) and imports (right
panel) in dollar terms in 2019. Sectors not displayed on chart include: (a) Life Sciences, 1.1%; (b) Advanced Manufacturing, 1.0%; (c) Clothing &
footwear, 0.6%; (d) Aerospace & Other Transport, 0.5%; (e) Aerospace & Other Transport, 2.2%; (f) Construction, 1.9% (g) Private Services NIE,
0.8%; (h) Construction, 0.4%; (i) Public Services, 0.4.
28 │DIT Global Trade OutlookBOX A: MEASURING TRADE IN VALUE-ADDED
Box A: How global trade differs when measured on a value-added basis
Conventional (‘gross’) trade statistics can give Chart A1: Share of value-added in gross global trade
a distorted view of global trading system by 'Global' Gross Exports, 2015
masking the effect of Global Value Chains
(GVCs).2 This can lead to double counting of Double
trade flows, which can over-estimate the Value added (VA) content counted
79% VA
importance of some countries or sectors that
21%
are at the end of value chains.
0% 20% 40% 60% 80% 100%
Trade in Value Added (TiVA) is an innovative
Chart A2: Role of goods and services in trade, 2015
OECD dataset that makes it possible to
examine the role of GVCs in global trade. The
novelty of the TiVA dataset is that it regards 24%
49%
trade as flows of value added rather than gross Goods 51%
flows of final goods and services. This has 76% Services
many advantages in terms of analysing trade,
particularly as the role of GVCs has grown. But Sector output of Value-added content of
gross exports gross exports
the TiVA dataset also has key limitations, (UNCTAD) (OECD TiVA)
including: its timeliness (as of September 2021,
the latest full estimates were for 2015); Chart A3: Difference in top 20 exporters in 2015
coverage (latest estimates cover 64 countries); between value added and gross trade measures
and robustness (TiVA estimates are still
experimental and based on several
assumptions). Given these drawbacks, the
Outlook relies on conventional trade statistics
as the basis for its projections but uses TiVA
data as a complementary source to
understand the role of GVCs.
TiVA data suggest around a fifth of the value
of gross global trade consists of intermediate
inputs that are double counted as they cross-
borders in GVCs (Chart A1).
Services account for almost half of global
trade when measured on a value-add basis,
versus a quarter based on conventional
statistics. (Chart A2). This reflects the value of
embedded services in goods trade, which are
not easily captured in gross trade measures.
The world’s top 20 exporters differ materially
when measured on a value-added basis (Chart
A3). Trading hubs – such as Singapore, Hong
Kong and the Netherlands – drop down the list Sources: UNCTAD, OECD Trade in Value Added & DIT calculations
due to the high proportion of their exports Notes: All data refer to 2015. In panel A2, the share of services in
global exports is higher in the OECD’s TiVA dataset than UNCTAD’s gross
made up of re-exported inputs, while primary export data for methodological and coverage differences, in particular:
commodity producers – such as Russia and 1) the value of embedded services in goods trade is significant; 2) the
TiVA dataset only covers 64 of the largest countries in the world, many
Saudi Arabia – rise up the rankings due to the of which are more service-oriented than the global average); 3) gross
high value-added content of their exports. exports in the TiVA dataset are valued at basic prices, not producer
prices, so domestic distribution margins (inherent in exports at producer
prices) are reallocated to exports of services.
2 Traditional (gross) trade data are recorded in gross value terms (i.e. the entire value of a product is recorded as an export, including the value of
intermediate inputs embodied in its production). By contrast, TiVA records as an export only the value a country/sector has added in the production
of this export (i.e. it nets out the value of intermediate inputs embodied in the production of the export).
29 │DIT Global Trade OutlookThe sectoral structure of global trade is likely to
GLOBAL TRADE GROWTH BY SECTOR
become more service-oriented over time
As with global GDP, the industrial structure All sectors of global trade will expand in the decade
of global trade is expected to evolve ahead, but at different rates
gradually over time. The sectoral Chart 31: Global imports by sector, 2019-2030
projections in the Outlook are based on
extrapolations of historical trends and Advanced Manufacturing
assume a steady evolution of the economic, Oil & Gas
political and technological forces that have Manufactured Materials
Automotive
shaped global trade. However, there are
Travel Services
risks to the sectoral outlook, particularly
Business Services
from disruptive technologies that could Consumer Goods (NIE)
change what we trade and how it is traded. Machinery & Equipment
Uncertainty scales with time so we do not Mining & Metals
present sectoral projections beyond 2030. Food & Beverages
Life Sciences
All sectors are expected to grow over the
Transport Services
next decade, but rising incomes, changing Chemicals
consumer preferences and technological IP, Recreation & Media
advances will see some sectors grow faster Aerospace & Other Transport
than others (Charts 31 and 32). Rising Financial Services
incomes should see global trade become Digital Services
more service-oriented, with the service Clothing & Footwear
sector’s share of trade rising from 25% to Agriculture
Power & Heat
28% by 2030. As middle-class populations
Private Services (NIE)
expand, demand for discretionary services –
Construction
including travel and digital services – should
Public Services
rise particularly quickly. By contrast, 2019 0 1 2 3 4 5
demand for oil and gas is expected to be Growth to 2030 Global sector imports, US$ trillions
sluggish as the green transition takes hold. Sources: IMF World Economic Outlook April 2021, UNCTAD, Oxford
The clothing and advanced manufacturing Economics and DIT calculations
sectors should also see their share of global Notes: Data are for nominal imports in US dollars at time-varying
market exchange rates. Sectors are defined in Section 3. NIE = ‘Not
trade fall as high productivity growth drives Included Elsewhere’.
down prices and hence lowers the dollar
value of output in those sectors.
The sectoral mix of global imports will shift gradually towards services over the next decade
Chart 32: Change in sectoral shares of global imports, 2019-2030
Percentage point change
1.0%
Sectors growing less quickly than global imports
0.5%
0.0%
-0.5% High-growth sectors
-1.0%
Sources: IMF World Economic Outlook April 2021, UNCTAD, Oxford Economics and DIT calculations
Notes: Data show the change in each sector’s share of global imports in US dollars converted at time-varying market exchange rates. Sectors are
defined in Section 3. NIE = ‘Not Included Elsewhere’.
30 │DIT Global Trade OutlookThe US and EU’s share of most import sectors is
REGIONAL DRIVERS OF SECTORAL TRADE
expected to decline out to 2030
Different regions account for markedly The US and EU’s share of most import sectors
different shares of global imports – due to is expected to decline out to 2030 as the
variations in income, factor endowments, growing purchasing power of Asia’s middle
comparative advantage, and positions in class accounts for a rising share of global
global value chains (left panel, Chart 33). import demand (right panel, Chart 33). This
While the EU and North America tend to change is particularly marked in the food,
import a higher share of the world’s finished travel and digital services sectors where larger
goods and services, emerging markets tend and increasingly wealthy populations in the
to import more industrial inputs, reflecting Indo Pacific are expected to consume more
their role as global manufacturing hubs. discretionary goods and services.
The Indo Pacific’s share of global imports is expected to rise in most sectors over the coming decade
Chart 33: Sectoral shares of global imports by region in 2019 and expected change by 2030
Regional share of global imports in 2019 Change in share 2019-2030
All Sectors
IP, Recreation & Media
Automotive
Clothing & Footwear
Private Services (NIE)
Financial Services
Digital Services
Business Services
Life Sciences
Consumer Goods (NIE)
Food & Beverages
Aerospace & Other…
Manufactured Materials
Power & Heat
Machinery & Equipment
Chemicals
Transport Services
Travel Services
Oil & Gas
Mining & Metals
Advanced Manufacturing
Agriculture
Public Services
Construction
0% 25% 50% 75% 100% -15%-10% -5% 0% 5% 10% 15%
North America EU Rest of World Indo Pacific
Sources: IMF World Economic Outlook April 2021, UNCTAD, Oxford Economics and DIT calculations
Notes: Data are for nominal imports in US dollars at time-varying exchange rates. Sectors are defined in Section 3. NIE = ‘Not Included
Elsewhere’. The Indo Pacific region is defined as three DIT HM Trade Commissioner regions: South Asia, Asia Pacific and China & Hong Kong.
‘Rest of world’ includes the UK, non-EU Europe, Eastern Europe & central Asia, Latin America, Middle East and Africa.
31 │DIT Global Trade OutlookYou can also read