The Danish Robotics Cluster in a Global Perspective - December 2019
←
→
Page content transcription
If your browser does not render page correctly, please read the page content below
The Danish Robotics Cluster
in a Global Perspective

December 2019
Introduction
This publication presents an analysis of the Danish
robotics cluster and its economic significance and
future potential in a global perspective.
The analysis first offers an overview of the previous
development and current size of the Danish robotics
cluster.
Next, the analysis covers the future global growth
potential in the field of robotics.
Finally, the profile and characteristics of the Danish
robotics cluster are compared to some of the
leading regions and robotics clusters in other
countries.
The analysis is based on register data, existing
literature, and interviews with Danish and
international experts in the field of robotics. The
attached appendix offers a more detailed
description of the methods and data sources used.
The analysis and publication were completed by
IRIS Group on behalf of the partners of Robotics
Alliance and published in December 2019.
Contents

                               1. Executive Summary                                   4

                               2. Facts about the Danish robotics cluster             6

                               3. Global growth potentials in the field of robotics   14

IRIS GROUP
                               4. Benchmark of the Danish robotics cluster            25
JORCKS PASSAGE 1B, 4th floor
DK-1162 COPENHAGEN K
IRISGROUP@IRISGROUP.DK
                               Appendix                                               38
WWW.IRISGROUP.DK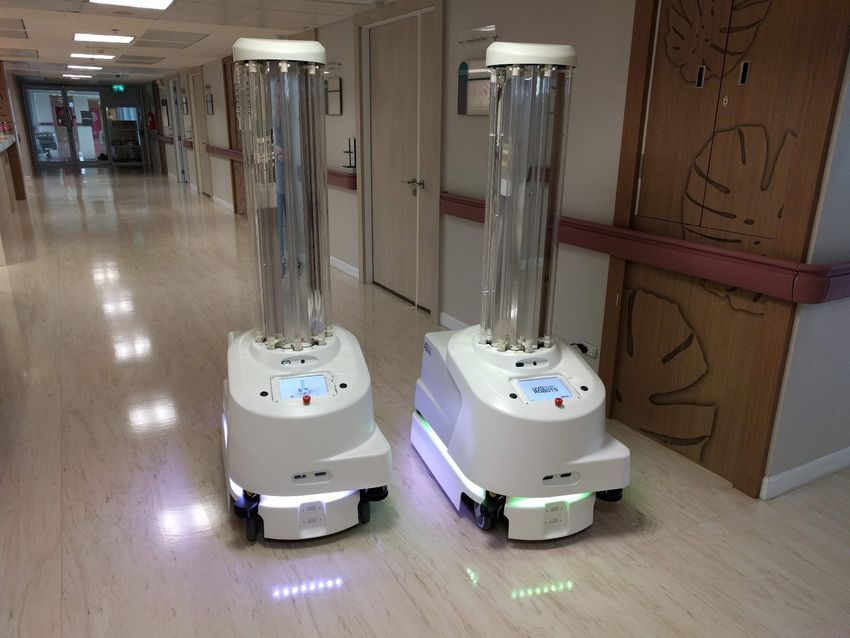
4

1. Executive Summary
               Facts about the Danish robotics cluster                               Global growth perspectives
               • Nationwide, approx. 8,500 people were directly employed in the      •   The global robotics market has seen significant growth in
                  field of robotics and automation in 2017. The total turnover           recent years, and the existing forecasts estimate that the
                  was €2.4 billion, of which almost 60 percent was export.               strong growth will continue.
               • The Danish robotics industry is relatively young and
                  geographically particularly concentrated around a strong           •   This is particularly the case for the collaborative industrial
                  ecosystem on Funen. 34 percent of all Danish robotics                  robots, where Denmark has a clear established position of
                  companies are located here.                                            strength, and in relation to the professional service robots,
               • In particular, Denmark has a clear global position of strength          where the demand is increasing, e.g. in the areas of health
                  within the so-called collaborative industrial robots, as several       and welfare.
                  Danish manufacturers have experienced significant growth in        •   Denmark also has a strong position within automation
                  recent years.                                                          solutions for the food industry.
               • From 2014 to 2017, the employment within the robotics and           •   The structural and technological megatrends driving
                  automation area increased by 1,600 FTE’s (full-time                    growth include the continually growing global economy,
                  equivalents) in Denmark. On Funen alone, 3,600 FTE’s were
                  employed by robotics companies in 2018.                                the United Nations Sustainable Development Goals, and
                                                                                         the development of digital technologies, which increase the
               • The Danish robotics industry is largely characterized by                demand and opportunities for developing new solutions.
                  entrepreneurship. 38 percent of all companies have been
                  established since 2010, and 63 percent have fewer than 20          •   The global growth forecasts and mega-trends are expected
                  employees.                                                             to cause increased competition for price and functionality,
               • The volume of external investments in robotics companies has            as well as an increased need for R&D that can lead to
                  grown strongly in recent years. The investment interest has            translation of technologies into new commercial solutions.
                  been from both Denmark and abroad.                                 •   There will be a greater need for access to competencies
               • Particularly the Danish Technological Institute plays a crucial         within IT and software as well as better links to foreign
                  role in acquiring European research funds from Horizon 2020            partners.
                  for Danish R&D projects in the field of robotics.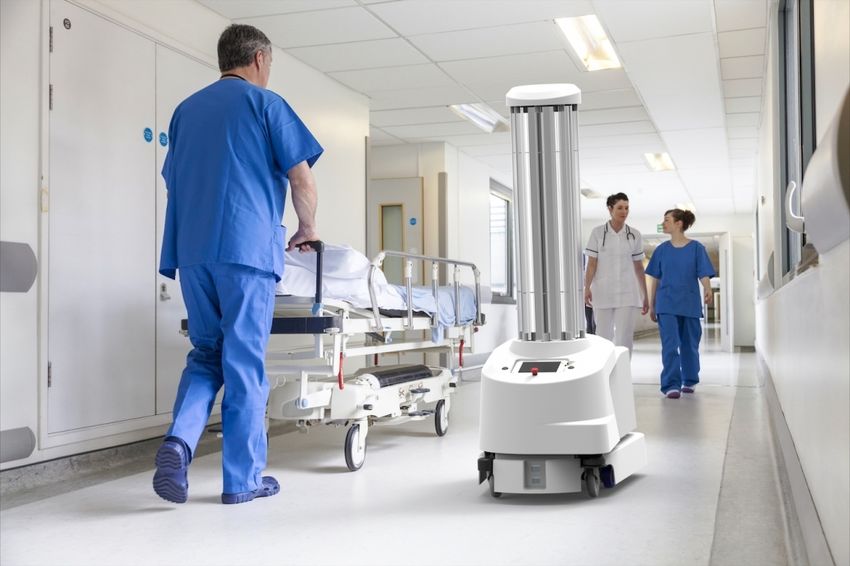
5

1. Executive Summary
                Danish positions of strength                                        Danish growth potentials
                • The Danish positions of strength within the robotics area         • Overall, the analysis indicates that Denmark can continue
                   are relatively new compared to leading foreign regions and          to benefit from strong growth potential in the field of
                   companies, many of which have been in the field since               robotics in the future.
                   the1970s, and have (had) close ties to the automotive            • That is based on the global growth forecasts, the clear
                   industry in particular.                                             commercial positions of strength, and the strong
                • In contrast to several of the foreign robotics clusters, the         companies and knowledge environments (and collaboration
                   Danish cluster and positions of strength are not linked to          between them).
                   particular industries, and the collaborative industrial robots   • The analysis indicates that the Danish robot industry can
                   have a wide range of functions and large growth potentials.         better utilize the global growth potentials in various ways.
                • When measuring the export of industrial robots, Denmark           • Sales of collaborative industrial robots to the global
                   has seen the largest growth from 2014 to 2018 of all the            segment of SME’s can be further scaled and new
                   comparison countries in the benchmark analysis (Sweden,             application areas and possibilities can increase demand
                   Germany, the Netherlands, France, Italy, the USA, Japan,            among old and new customer segments in the global
                   China, and South Korea).                                            market.
                • The number of Danish research articles within the robot           • In addition, the Danish robotics industry can gain a greater
                   area has also increased significantly in recent years. Thus,        share of the growth in the emerging and growing markets
                   the value chain of delivering new research and knowledge -          for professional service robots within, e.g., health and
                   which can be translated into innovative commercial                  welfare, agriculture, and drones, if the existing strong
                   solutions - has been strengthened greatly since 2013.               technical and commercial competencies in Denmark can
                • In general, the Danish ecosystem and the collaboration               be exploited and expanded to these areas.
                   between the various actors (companies, universities, RTO’s,
                   authorities, cluster organizations, etc.) appear
                   extraordinarily strong in the field of robotics. No other
                   European country has worked as systematically and
                   strategically to make the development and production of
                   robots an independent growth area.
6

2. Facts about the Danish robotics cluster

                            Key points
                            •   The Danish robotics industry is relatively young and geographically particularly based
                                around the strong ecosystem on Funen, where there is a close interaction between
                                companies, universities, and RTO’s, largely enabled by cluster and network organizations.

                            •   Nationwide, approx. 8,500 were directly employed in the field of robotics in 2017. The total
                                turnover of the field was €2.4 billion.

                            •   From 2014 to 2017, the revenue and employment across Danish robotics grew by 7.5 and
                                10 percent respectively, and the development has in particular been within Denmark's
                                global position of strength, collaborative industrial robots.

                            •   Companies that develop and produce physical robots make up about half of all the
                                companies within the field of robotics, but they account for 60 percent of the total revenue
                                and 75 percent of export revenue.

                            •   The Danish ecosystem in the field of robotics appears exceptionally strong, and has seen
                                growth in its entrepreneurial environment. 38 percent of the companies in Danish robotics
                                have been established after 2009, and 63 percent have less than 10 employees.

                            •   The Danish robotics companies attract a large number of external investors from both
                                Denmark and abroad. The Danish knowledge institutions – particularly the Danish
                                Technological Institute – play a crucial role in acquiring financial resources from the EU
                                Framework Program Horizon 2020 for strengthening the Danish ability to innovate in the
                                field of robotics.
2. Facts about the Danish robotics cluster – introduction and history                                                                                                                                                                                        7

The Danish robotic cluster is highly anchored both historically and geographically on Funen and in
Odense. But elsewhere in the country, there are also strong research and commercial players within                                                   The history of the Danish robotics cluster on Funen
the field of robotics, and the area can increasingly be described as an established Danish position of
                                                                                                                                                     The historical development of the Danish robotics cluster has been described and covered by a
strength.
                                                                                                                                                     number of researchers and journalists in recent years. Below is a short summary of the most
In this chapter, a number of facts detailing the size and importance of the robotics field throughout                                                important milestones in the construction of the Danish robotics cluster.
Denmark are first presented, before more in-depth facts detail the robotics cluster in and around                                                    •     1985: The Odense Steel Shipyard begins using robot technology.
Odense.
                                                                                                                                                     •     1999: The AP Møller Foundation donates €10 million to the University of Southern Denmark
We have chosen to distinguish between the following four types of robots :                                                                                 (SDU) for the construction of a building for Institute of Production Technology.

   •    Traditional industrial robots                                                                                                                •     2001: The research project AMROSE begins (Autonomous Multiple Robot Operation in
        Typically includes larger, fixed robot                                                                                                             Structured Environments). The project is funded by the Odense Steel Shipyard, the Danish
                                                                                                                                                           Academy of Technical Sciences, The University of Southern Denmark, and an information
        installations that operate independently
                                                                                                                                                           program of the Danish Council for Strategic Research.
        of people and surroundings.
                                                                                                                                                     •     2002: The network for competencies and innovation, RoboCluster, is founded.
   •    Collaborative industrial robots (cobots)
        Typically includes smaller and physically                                                                                                    •     2001-2004: A team of researchers in Denmark receive a number of grants from e.g. Danish
                                                                                                                                                           foundations to reinvent the industrial robot.
        flexible robots that are able to work with
        people in a common work environment.                                                                                                         •     2005: Universal Robots is founded by researchers, who have developed the idea for UR5, a
                                                                                                                                                           lightweight, user-friendly, and flexible cobot, which was designed to boost automation in small
   •    Professional service robots                                                                                                                        and midsized industrial companies.
        Includes both robots within e.g. logistics,
                                                                                                                                                     •     2008: The Growth Fund, SDI and Enrico Krog Iversen invest approx. €1.5 million in Universal
        cleaning, defense, health, cleaning, and
                                                                                                                                                           Robots. Enrico Krog Iversen enters as the new CEO.
        surveillance, as well as drones.
                                                                                                                                                     •     2013: Niels Jul Jacobsen (who was on the board of Universal Robots) founds Mobile Industrial
   •    Personal service robots                                                                                                                            Robots (MIR).
        Includes robots aimed at the private
                                                                                                                                                     •     2014: The Municipal cooperation, Udvikling Fyn (Development Funen), establishes Odense
        consumer segment within e.g.                                                                                                                       Robotics and Odense Robotics Startup Hub, an incubator for new robot companies.
        entertainment, housekeeping, care, and
        cleaning.                                                                                                                                    •     2015: Teradyne acquires Universal Robots for €250 million (+ bonuses of approx. €70 million).
                                                                                                                                                     •     2015-2018: A large number of new robot companies are established, e.g., On Robot, Flow
                                                                                                                                                           Robotics and Purple Robotics.
The analysis primarily focuses on the first three categories of robots, as they have the most
significant relevance to the Danish robotics industry and the global growth potentials.                                                              •     2018: Teradyne acquires MiR for €230 million, of which approx. €90 million is in bonuses.

Source: Steno, Carsten, ”En klynge der virker” (2016) and the International Federation of Robotics classification of industrial robots and service robots) and Mandag Morgen June 3, 2018: “Robotklynge bugner af kontanter”.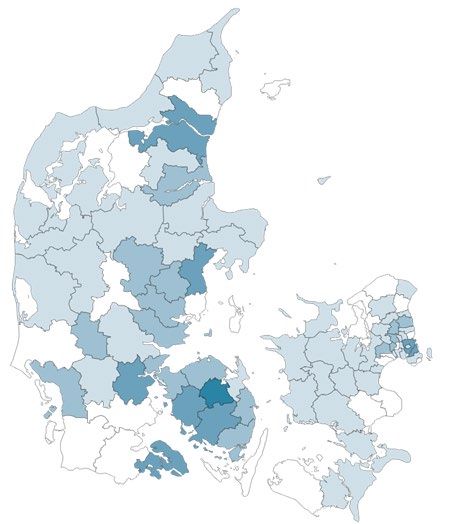
2. Facts about the Danish robotics cluster – significance for Denmark                                                                                                                                                               8

On this page, a summary of the latest available key figures for the Danish field of robotics in terms of                  The map shows that the 292 robotics companies in Denmark are distributed throughout the country. The
size and significance is presented.                                                                                       largest concentration is on Funen, and in particular in Odense. 34 percent of the companies are located
                                                                                                                          on Funen, and these are primarily integrators and manufacturers. 10 percent of the workplaces are
The main conclusions are summarized in the text box below, while a more detailed description of the                       located in Northern Jutland and 15 percent in the Eastern Jutland, where the companies are distributed
various categories of companies is presented in the dark blue text box on the right of the page.                          more evenly between manufacturers, integrators, consultants, and retailers. Furthermore, there are
                                                                                                                          small groups of companies around Sønderborg and around The Technical University of Denmark (DTU)
                                                                                                                          in Lyngby and Copenhagen.
  Key figures on the significance of the robotics industry for Denmark                                                    Distribution of companies in the Danish robotics sector               Categories of robotics
                                                                                                                                                                                                companies
    •    The companies within the robotics and automation area employed approx. 8,500 FTE’s.
         In just three years, the number has increased by a total of 1,600, which corresponds to                                                                                                Manufacturers: Companies
         an annual growth of just under 7.5 percent.                                                                                                                                            that develop and produce the
                                                                                                                                                                                                physical robot units, including
    •    The robot manufacturers have created the highest amount of new jobs. The number                                                                                                        drones.
         of FTE’s among the manufacturers increased by 1,000 from 2014 to 2017, meaning that
         they employed about 4,600 in 2017, which corresponds to more than half (55 percent) of                                                                                                 Integrators: Companies that
         all employees in the field of robotics in Denmark.                                                                                                                                     work to develop and design
                                                                                                                                                                                                solutions to integrate robots in
    •    The robotics and automation industry had a turnover of €2.4 billion in 2017, and                                                                                                       automation processes.
         revenue is rapidly growing. Since 2014, revenue has grown by more than €600 million.
         This corresponds to an annual growth of over 10 percent.                                                                                                                               Retailers: Companies that
                                                                                                                                                                                                distribute and/or sell robots
    •    The robot manufacturers had a turnover of approx. €1.4 billion, which corresponds                                                                                                      and robot-related products.
         to 60 percent of the Danish robotics and automation industry's turnover. Meanwhile,
         the manufacturers also had the largest revenue growth with an annual increase of 11                                                                                                    Advisors: Companies that sell
         percent.                                                                                                                                                                               advisory and consulting
                                                                                                                                                                                                services in relation to robots
    •    The export of the Danish robotics and automation industry amounts to more than                                                                                                         and automation.
         €1.3 billion. In total, exports make up almost 60 percent of the revenue.
                                                                                                                                                                                                In addition, a number of
    •    The robot manufacturers account for approx. 75 percent of exports, and thus exports                                                                                                    suppliers exist that supply
         more than the integrators, consultants and retailers in the sector. The manufacturers’                                                                                                 parts and/or services related
         exports have increased by 14 percent annually from 2014 to 2017, whereas the exports                                                                                                   to the robots. These are not
         of the integrators, consultants and retailers during the same period have increased by                                                                                                 included in the data for this
         8-11 percent per year.                                                                                                                                                                 analysis.

 Source: Damvad Analytics: ”Analyse af den danske robotindustri” (April 2019) and Odense Robotics ”Insight Report 2019”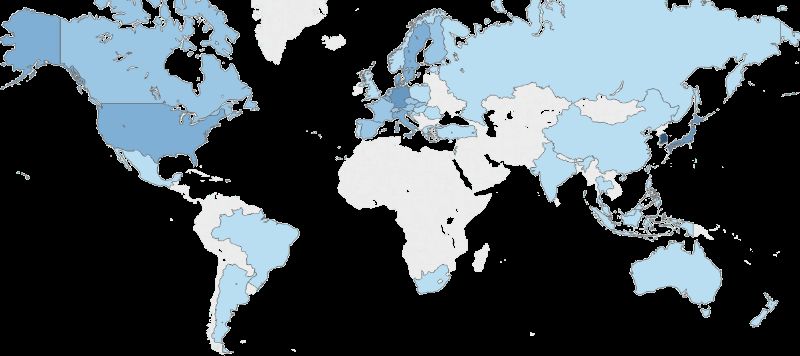
2. Facts about the Danish robotics cluster – development and growth                                                                                                                                                              9

The three figures on this page outline the development in the number of employees, turnover, and                          Overall, the figures reflect the strong growth and development that the robotics area in Denmark has
exports in the Danish robotics industry.                                                                                  experienced in recent years.

  Revenue and exports                                                                                                       Employees and companies
  The revenue in the Danish robotics sector has increased by 34 percent from 2014 to 2017,                                  The Danish robotics sector employed approx. 8,500 people full-time in 2017, corresponding to an
  corresponding to €616 million. The annual average growth was 10.5 percent. In 2017 the total                              increase of 23 percent since 2014. The annual growth was a little less than 7.5 percent.
  revenue was €2.4 billion, of which 60 percent is from exports.
  The export has also increased, both in numbers and in share of revenue. The increase was 43                               Figure 3. Development in the number of full-time employees in the Danish robotics sector
  percent from 2014 to 2017, an annual growth of 12.5 percent.
                                                                                                                                                                        + 23 %
    Figure 1. Development in the revenue of the Danish robotics sector (mil. EUR)
                                                                                                                                                                                                            8,500
                                                                                                                                                                                     7,850
                                                                                                                                                              7,350
                                                                                                                                      6,900
                                                               + 34 %
                                                                                                                2,410
                                                                                 2,156
                   1,794                          1,902

                                                                                                                                      2014                    2015                   2016                    2017

                   2014                           2015                           2016                           2017

                                                                                                                            About the growth and the development in the robotics cluster on Funen
    Figure 2. Development in the exports of the Danish robotics sector (mil. EUR)                                           The entire Danish robotics sector has experienced significant growth in recent years.
                                                                                                                            However, the growth has been particularly strong in the robotics cluster on Funen, where
                                                               + 43 %                                                       the growth in employment increased from 2,200 in 2015 to 3,600 in 2018 (64 percent).
                                                                                                                            In 2017, the turnover in the Funen cluster was approx. €763 million – just under one third of the
                                                                                                                 1,433      total revenue for the entire Danish robotics industry. While growth in revenue for the total
                                                                                 1,232                                      robotics industry was 10.5 percent annually between 2014 and 2017, it was about 15 percent
                                                  1,111
                  1,004                                                                                                     annually in the robotics cluster on Funen.
                                                                                                                            The same trend is seen for export statistics. Here, the annual growth for the total Danish robot
                                                                                                                            industry was 12.5 percent from 2014 to 2017, while the annual growth was 21 percent in the
                                                                                                                            Funen robotics cluster.
                   2014                           2015                            2016                           2017

 Source: Damvad Analytics: ”Analyse af den danske robotindustri” (April 2019) and Odense Robotics ”Insight Report 2019”
2. Facts about the Danish robotics cluster – distribution of companies                                                                                                                                                               10

The three figures on this page show how the 292 companies in the Danish robotics industry are
distributed in relation to size, age, and type. In addition, some examples of some of the leading                                  Company type                                             Figure 6. Distribution by company type
Danish robotics companies are given.                                                                                               The figure shows, that almost half of the companies
                                                                                                                                   in the Danish robotics sector are manufacturers, who                Advisors
                                                                                                                                   develop and produce the physical robot units.                         8%
  Company size and age
                                                                                                                                   This category of companies generates the largest            Retailers
  63 percent of the companies in the Danish robotics sector have fewer than 20 employees, and 12                                                                                                 13%
                                                                                                                                   growth, employment, turnover and exports, and
  percent have more than 100 employees. 38 percent of the companies were established after                                                                                                                        Manufactur
                                                                                                                                   can be considered the core of the Danish robotics
  2009.                                                                                                                                                                                                              ers
                                                                                                                                   sector.
                                                                                                                                                                                                                    48%
  Overall, the two figures reflect that the Danish robot cluster is relatively young, and that it is
                                                                                                                                   The second-largest share is made up of integrators
  characterized by a few large and many small, newly-established companies.                                                                                                                      Integrators
                                                                                                                                   (31 percent), while the remaining companies are within
                                                                                                                                                                                                     31%
  Interviews also show that the area has been characterized by entrepreneurship and many new                                       advisory and retail (18 & 13 percent, respectively).
  companies to a great extent in recent years. Among the leading entrepreneurial companies are,
  e.g., MiR and OnRobot, which originated from Universal Robots.
  Figure 4. Distribution by company size
          Fewer than 20 employees             20-49 employees            50-100 employees            More than 100 employees

                                                                                                                                   Examples of leading Danish robotics companies
                                            185                                             46            27          34
                                           (63%)                                          (15%)          (9%)       (12%)          Among the manufacturers of collaborative service robots, Universal Robots is the beyond doubt
                                                                                                                                   the leading company. In 2017, the company had a turnover of €150 million, corresponding to
                                                                                                                                   approx. 6 percent of the total revenue in the Danish robotics sector.
        0%         10%        20%         30%         40%         50%        60%         70%         80%        90%         100%
                                                                                                                                   Mobile Industrial Robots (MiR), which was sold for €230 million in 2018, is also among the
                                                                                                                                   leading manufacturers. Within professional service robots for the health and welfare area, Blue
  Figure 5. Distribution by year of company establishment                                                                          Ocean Robotics is among the leading Danish companies.
                            Before 2000                            2000-09                           After 2009                    Beyond the companies described above, ABB, Cabinplant, Jorgensen Engineering, LT
                                                                                                                                   Automation and Gibotech are some of the interesting and leading robotics companies in
                                                                                                                                   Denmark.
                            104                                  76                                   112
                           (36%)                               (26%)                                 (38%)

        0%         10%        20%         30%         40%         50%        60%         70%         80%        90%         100%

 Source: Damvad Analytics: ”Analyse af den danske robotindustri” (April 2019) and Odense Robotics ”Insight Report 2019”
2. Facts about the Danish robotics cluster – ecosystem 11
The interviews conducted with Danish and foreign experts indicate that there is an extraordinarily well-
functioning ecosystem in Denmark, which significantly contributes to strengthening the growth and External investments in the robotics cluster
development of Danish robotics companies, e.g. by improving their access to business partners, The figure below shows that the external investments in companies in the Funen robotics cluster
capital, labour, knowledge, etc. has increased significantly in recent years. Since 2015, more than €750 million has been
invested in the Danish companies, with the major part originating from private investors from
At the same time, it has been pointed out that Odense Robotics has, in recent years, played a major Denmark and abroad.
role in uniting the cluster, facilitating effective collaboration between the various robotics companies
and stimulating the entrepreneurial environment, e.g. through the Odense Robotics Start Up Hub. The interviews indicate that the access for capital has been no hinderance for growth and
development of the Danish robotics companies, and that Invest in Odense has allowed for an
In addition to the private companies, the University of Southern Denmark, the Danish Technological efficient and systematic ecosystem at this point.
Institute, Odense Robotics, and Odense Municipality are some of the key players of the ecosystem. An
appendix is enclosed with a complete record of the actors in the cluster. Figure 7. Total external investments in the Figure 8. Sources of the external investments
companies of the cluster (mil. EUR)
The figures in the box on the right show the development and the sources of the external investments Collaboration with
in the companies in the Danish robot cluster. 750 investment consultants
Other 3%
In March 2019, a new national partnership, the Robotics Alliance, was established in Denmark. The
18%
mission of the partnership is to expand and strengthen collaboration and coordination across actors
throughout the country, cf. the box below.
429 447
About the Robotics Alliance Investor
322 s
The Robotics Alliance is a national partnership across
Loans 42%
business organizations, innovation networks, stake-
holders, and companies, which seeks to strengthen 18%
the framework conditions and the ecosystem of the
Danish robotics and automation industry Public funding
28%
Specifically, the partnership will work to:
2015 2016 2017 2018
• Strengthen research and innovation in robot and automation technology, including drones
• Strengthen export opportunities
• Ensure competencies and attract talent
• Gather and strengthen professional activities in local networks
• Promote robotics and automation, including the drone area in Denmark and internationally
So far, the participants of the partnership are RoboCluster, the nationwide innovation network,
Odense Robotics, Sønderborg Growth Council and UAS Denmark, but the partnership plans to
expand and include companies from various areas of Denmark.
Source: Odense Robotics ”Insight Report 2019” and www.robotics-alliance.dk12
”Odense Robotics plays a crucial role in bringing
”The ecosystem of the Danish robot cluster together companies and making the Danish
is very strong and unique. No one in Europe positions of strength visible abroad. In addition,
is close to Denmark when it comes to the municipality also does a unique job in terms of
building a growth strategy on robot improving the access to capital and qualified
technology. There is a strong supply chain labour for the companies through Invest in
and “multiplier effect” in Denmark where Odense and International Community Odense,
the many start-ups deliver innovation and respectively. At the moment, there is generally
new ideas to the established robot good access to external capital – while the
companies who has access to the global companies of the cluster are mainly challenged by
markets” recruitment and retention of qualified labour”
- Ali Muhammad, Senior Scientist - Claus Risager, PhD & CEO
VTT Finland Blue Ocean Robotics2. Facts about the Danish robotics cluster – Horizon 2020 funding 13
Horizon 2020 is the EU's research and innovation program for the period 2014-2020 and is generally
regarded as the largest and most important international program for Denmark. Horizon 2020 Table 1. Recipients of Horizon-funds in total and for the top-3 of the Funen robotics cluster (from 2014
to March 2019)
supports projects at all stages from basic, strategic and applied research to innovation projects and
companies' product development. Name EU funding (‘000 EUR) Share
Danish Technological Institute (TI) 15,759 76%
Overall, more than 40 billion euros has been distributed for almost 22,000 projects. The program is Private companies 2,439 12%
so large, that analyses of activity levels (funds received) can provide an insight into the research and
University of Southern Denmark (SDU) 1,997 10%
innovation activity of organizations, by region or sector in different countries.
Others 473 2%
Total 20,668 100%
Thus, on this page, an analysis is presented of how many funds the various Danish actors have
received in within the sector of drones, robotics, and automation. Table 2. Recipients of Horizon-funds in total and for the top-3 of the Danish robotics sector (from 2014
to March 2019)
A total of 90 different relevant Danish players have been identified, which combined have participated Name EU funding (‘000 EUR) Share
in 103 different Horizon projects within the sector. The 103 projects received a total of €648 million.
Of these, approx. 10 percent – equivalent to €66 million – went to the 90 Danish actors/partners in Danish Technological Institute (TI) 15,759 24%
the sector. Of this, the players from the cluster in Odense received €20.7 million., which corresponds The Technical University of Denmark (DTU) 5,747 9%
to 31 percent of the total funds allocated to Danish partners in the sector. Aalborg University (AAU) 4,454 7%
Others 40,275 61%
The two tables to the right show the three largest players/categories and the total return of Horizon Total 66,235 100%
funds in the robotics sector for the robotics cluster in Odense and for the whole country. The two Figure 9. Horizon-funds distributed by actor Figure 10. Horizon-funds distributed by actor
figures show how funding is distributed among different categories of actors. categories for the Funen robotics cluster categories for the Danish robotics sector
Others Others Public organizations
As can be seen from the tables, the Danish Technological Institute plays a very large role in relation Universities
2% 2% 1%
to receiving funds for Denmark from Horizon 2020 in the robotics area. The Danish Technological 10%
Institute has taken out almost a quarter of all the funds for Danish robotics and accounts for a total of
Private
76 percent of the funding in the cluster in Odense. The spread in the rest of the country is
companies
significantly larger. Research
12% institutions
Private
25%
Among the international experts interviewed, it is pointed out that, due to the close collaboration companies
between the private companies, RTO’s and universities, Denmark is in a strong position in terms of 41%
receiving project funding in the coming program period (Horizon Europe), where a lot of funds are Research institutions
expected to be spent on projects dealing with the development and application of artificial 76% Universitie
intelligence in automation processes. s
31%
Source: The EU Cordis database14
3. Global growth potentials in the field of robotics
Key points
• Overall, the analysis concludes that the future will continue to hold high global
growth potential for Danish companies in the field of robotics and automation.
• The existing growth forecasts indicate that, in the future, growth is expected to be
particularly strong for collaborative industrial robots, where Denmark has a
strong position, which can still be scaled and spread further to new markets and
application areas.
• The field of robotics has experienced significant global growth in recent years,
and the total number of sold industrial robots increased from 60,000 in 2009 to
381,000 in 2017. At the same time, the field is characterized by a strong
development of new knowledge and new technological solutions.
• The growth within robotics is largely driven by a number of overall structural and
technological megatrends. These megatrends include a growing global economy
and the development of digital technologies, which cause increased demand and
opportunities for developing products and solutions within the field of robotics.
• In addition, the Danish robotics cluster has potential for spreading within the field
of professional service robots, e.g. in the health and welfare areas.3. Global growth potentials in the field of robotics – historical growth and development 15
The strong growth in the Danish robotics cluster over the last few years (cf. section 2) is largely
related to the global development in the general field of robotics. The three figures on this page Global sales of industrial robots Figure 12. Development in global sales of
industrial robots
provide a comprehensive insight into how the robot area has developed globally the past few years. The total global sales of industrial robots have
strongly grown since 2009. According to the
i tusinder
Figure 12 shows the development of global sales of industrial robots from 2009 to 2017. Figure 13 International Federation of Robotics, the number
381
shows the development of patent applications in robot technology from 2010 to 2018. Figure 11 shows
‘000 robot units
of sold robot units increased from 60,000 in 2009 294
254
the top 10 of countries with the most industrial robots in relation to the number of employees in the to 381,000 in 2017. From 2016 to 2017 alone, sales 221
Robotenheder
manufacturing sector and visualizes how the global distribution of industrial robots is geographically 166 159 178
increased by 30 percent. 121
distributed. 60
Historically, it has been the automotive industry
The global spread of industrial robots and the electronics industry, which, overall, have
purchased the majority of the industrial robots.
The number of industrial robots in the manufacturing sector is rising rapidly worldwide. From 2009 2010 2011 2012 2013 2014 2015 2016 2017
2015 to 2016, the global average number of industrial robots per 10,000 employees in the
manufacturing sector rose from 66 to 74.
The robotics patent application globally
The figure shows the level of automation in the manufacturing sector. The most robot-intensive
countries in the world today are South Korea, Singapore, Germany, Japan, Sweden and The number of patents in the field of robotics has been accelerating since the 1980s, but has
Denmark. Singapore and Denmark on this list are the only countries that do not have an particularly grown over the past decade. In 2018, three times as many patents were applied for
extensive automotive production, which is otherwise one of the sectors that cause the most use globally in the field of robotics as in 2010. The increase has been particularly strong in China,
of robotics. which had almost 30 times as many patent applications in 2018 as in 2010. Denmark is among
the ‘best of the rest', with six times as many patent applications in 2018 as in 2010 – a
The number of operational industrial robots in Denmark increased from 1,400 in 2000 to 4,250 in
development that exceeds all the other countries in the study, except China*.
2010 and 5,900 in 2016, and is expected to continue growing in years to come.
Figure 11. Number of industrial robots per 10,000 employees in the manufacturing sector, 2016 Figure 13. Index of patent application at PCT within robot technology, 2010-18 (2010=1x)
Sydkorea
South Korea 631 7x
Singapore
Singapore 488
6x
Tyskland
Germany 309
5x
Japan
Japan 303
Sverige
Sweden 223 4x
Danmark
Denmark 211 3x
USA
USA 189 2x
Italien
Italy 185
1x
Belgien
Belgium 184
0 631 0x
Taiwan
Taiwan 177
2010 2011 2012 2013 2014 2015 2016 2017 2018
Note: Measured against Sweden, Norway, Germany, USA, South Korea, Japan, the Netherlands, United Kingdom, France, and Australia – that is, neighbouring countries and key countries within robot technology.
Source: Dansk Metal; International Federation of Robots; analysis of patent data from the World Intellectual Property Organization patent database.3. Global growth potentials in the field of robotics – vital megatrends 16
Global growth in the field of robotics is driven by a variety of technological and structural
megatrends. This page summarizes a number of global megatrends, that are considered to be
crucial for the supply and demand of the robotics area.
Structural megatrends of vital importance to the field of robotics Technological megatrends of vital importance to the field of robotics
Increasing focus on local and sustainable production
Developments in available hardware
The demand for cost reduction, the acquisition of knowledge and
innovation, shorter time-to-market and a better opportunity for Digital hardware is continually improving in a wide range of areas,
flexible adaptation to local requests all create an increased need for making robots cheaper and better. This applies both to performance
producing locally and in smaller and more flexible series. In addition, measures, such as RAM, storage, memory, etc., but sensors,
the focus on climate impact and resource consumption can lead to cameras, batteries, etc. have also significantly progressed in quality,
interest in local production (to minimize transport), while there is a while the price of these units have decreased. This has played and
growing focus on sustainable/responsible production (cf. the SDG’s). will play a major role in the distribution and availability of robotics.
Stronger financial incentive Developments in computer technology and software
Increasing labour costs and falling robot prices have created Recent software technologies such as machine learning, visual
stronger economic incentives to introduce automation into processing, artificial intelligence, voice recognition, etc., enable
production processes in order to increase productivity. In other robots to act at a more independent and informed level. Meanwhile,
words, the economic business case in relation to introducing robots the expectations of continued development of software, that may
has become more attractive to private companies. enable autonomous and creative robots in the future, also increase
the interest in robots.
Increasing global prosperity, longevity and consumption
Developments in connection
The global economy and middle class are progressing rapidly. This
On several parameters, the world becomes more connected, which
increase the demand for a wider variety of goods and services that
makes the usability of robots even greater, as it enables
can be produced and delivered using robotics technology. The global
communication between more devices. The number of Internet-of-
economic and demographic development will thus increase the
Things units is expected to double between 2015 and 2020, but cloud
demand for both physical products and consumer goods within, e.g.,
robotics and the upcoming 5G network are also expected to make
the automotive and electronics industries. Meanwhile, the
possible even more application areas for robots.
increasing life expectancy can boost the need for health robots.
Source: Dansk Metal; International Federation of Robots; analysis of patent data from the World Intellectual Property Organization patent database.3. Global growth potentials in the field of robotics – general growth forecasts 17
This page shows various forecasts for the expected continued growth of robotics in the future. The forecasts
have been made by international research institutes on the basis of historical growth and expected future
Global growth forecasts for industrial and service robots
trends. Figures 15 and 16 show that the expected growth is greater within the service robot sector. Here, the
forecasts are more than quadrupling towards 2025. For industrial robots, the growth forecasts are
Figure 14 shows the expected total revenue growth for the entire sector from 2018 to 2025. This growth is slightly lower, as it is estimated to double between 2018 and 2025.
further divided in figures 15 and 16, which illustrates the expected growth within the two main groups of
Among the industrial robots, the median forecast value for the annual expected growth is 11 percent
robot technology.
per year. According to IFR, this growth is particularly due to growth in the electronics and metal
The figures' blue line indicates the median value for growth in turnover among the selected forecasts, while industries, as they are increasingly catching up to the automotive industry, which remains the world's
the light blue shadow indicates the minimum and maximum values. The light blue shadow thus shows the most robot-intensive sector.
spread in the existing quantitative growth forecasts, which gives an indication of the uncertainty associated Among the service robots, the median value for the annual expected growth is as high as 22.5 percent,
with the growth forecasts. where the low part of the spread is, however, 17 percent. IFR expects the growth to be particularly
sustained by robots in agriculture and in the health sector, but the large areas of logistics and PR are
Overall global growth forecast in the field of robotics also expected to grow significantly. In Denmark, automation is particularly being adopted within the
industries of food, plastic, metal and pharmaceuticals. Hence, there are clear expectations for growth
As seen in figure 14, there is an expectation of significant growth in robotics technology sales up to at
in the home market for the Danish robot manufacturers. However, the global growth is expected
least 2025. The most optimistic expectations are around 4 times the 2018-level, while more conservative
across many different sub-areas of production, indicating a general maturation of the market.
bids are 2 times. The median value corresponds to an annual growth of 17 percent. By comparison, the
expected annual growth in the period is approx. 5 percent for green energy and approx. 5.5 percent for The two figures also indicate a higher level of uncertainty among the existing growth forecasts on the
the pharma sector1. development of service robots than for industrial robots.
Figure 14. Expected growth of robotics, 2018-20252 Figure 15. Expected growth of industrial robots Figure 16. Expected growth of service robots
5x 5x 5x
4x 4x 4x
3x 3x 3x
2x 2x 2x
1x 1x 1x
0x 0x 0x
2018 2019 2020 2021 2022 2023 2024 2025 2018 2019 2020 2021 2022 2023 2024 2025 2018 2019 2020 2021 2022 2023 2024 2025
1) Allied Market Research (2018); QunitilesIMS (2017).
2) In the overall growth forecast, three data sources are used: International Data Corporation (2018), Transparency Market Research (2018) & Siemens (2017). In the industrial robots growth forecast, five data sources are used: Energias Market Research (2018), IFR (2018),
ResearchAndMarkets (2018), Global Market Insights (2018) & ABI Research (2016). In the service robots growth forecast, three data sources are used: ResearchAndMarkets (2018), Mordor Intelligence (2018) & Allied Market Research (2016).3. Global growth potentials in the field of robotics – growth forecast for cobots 18
As shown on the previous page, the overall forecasts indicate that continued high growth is expected both
within industrial and service robots in the coming years. However, there is a significant difference in the level
Global growth forecast for cobots
of growth expected within the different types of industrial robots. According to the global forecasts, an annual growth of around 50 percent is expected within the field of
collaborative industrial robots. This means that the expected number of collaborative robot units sold
The figures on this page show a couple of more specific growth forecast solely for the collaborative worldwide will have increase to around 633,000 by 2027.
industrial robots (cobots), which is the key strength position of the Danish robotics cluster (cf. chapter 2).
Considering that the global sales of industrial robots, according to the International Federation of
This robotics area is expected to have particularly high global growth in the coming years.
Robotics, was 381,000 in 2017 (see figure 12), it must be concluded that an extremely high global
Figure 17 shows an index of the expected development in the average sales price of a collaborative robot, demand for collaborative robots is expected in the coming years.
while figure 18 shows the expected global development in the number of cobots sold. The text box In monetary terms, it is expected that the global market for collaborative industrial robots will grow to
summarizes some of the key issues that, according to existing literature and leading experts, are the basis as much as €10.5 billion in 2027.
for the vigorous global growth of collaborative robots.
Figure 18. Expected development in the number of sold collaborative robot units globally
Background for the global growth Expected development in sales prices
633
of cobots While a large increase in global revenue and
tusinder
• The cobots are small, flexible and demand for cobots is expected, figure 17 shows
‘000 robot iunits
user-friendly and are relatively easily that the average sales price per cobot is expected 422
programmed to decline in the years to come.
Robotenheder
281
• They can safely work alongside people This happens as technology and collaborative 187
in common work environments robots become more developed and widely used. 125
55 83
• They are economically and resource- 11 16 25 37
wise more affordable than traditional Figure 17. Index of expected development in
industrial robots, which often require average sales price per cobot (2017=100) 2017 2018 2019 2020 2021 2022 2023 2024 2025 2026 2027
relatively large investments and 100
reconstruction of production facilities. Earlier forecasts1 predicted that the number of collaborative robots sold would have already exceeded
95
Cobots are thus available to large 30,000 by 2017 and that a level of over 600,000 robot units would have been reached by 2024. However,
90
segment of SME’s according to the latest available forecast shown in figure 18, this level will not be reached before 2027.
85
• They can enable increased quality and Hence, it must be emphasized that the existing growth forecasts are associated with some uncertainty.
80
precision in the production processes 75 However, the uncertainty is primarily related to when the significantly increased demand in the world
• They can reduce production costs and 70 market is expected to occur. In other words, there is widespread agreement that there is very high
increase productivity 65 potential for growth, but the uncertainty is related to how quickly new sectors and industries, e.g. within
60
the health sector, will be able to adapt and use the technology.
2017 2018 2019 2020 2021 2022 2023 2024 2025
1) Earlier forecasts from e.g. ”Asian Robotics Review” for HMC Investment Securities
Source: Figure 18 is based on data from ABI Research in ”Robotter og automatisering” by Region Southern Denmark (August 2018), while figure 17 is based on "Barclays Equity Research”19
”The Danish robotics cluster is not closely linked to any
particular industry – unlike most of the foreign robot regions
– and the collaboration between the manufacturers and the
integrators is good. This means that the Danish robotics
companies are strongly positioned to deliver flexible holistic
solutions to manufacture companies across countries and
industries. And the global market for collaborative industrial
robots is far from having reached saturation point”
- Mads Bruun Ingstrup, Associate Professor
University of Southern Denmark3. Global growth potentials in the field of robotics – industrial robot sales 20
The table and figures on this page offer a closer look at which industries and parts of the world are driving
growth and demand for industrial robots. Global sales of industrial robots by country and continent
The table below shows that nearly three-quarters of the 381,000 industrial robots in 2017 were
sold to China, Japan, Korea, the United States, and Germany and that these five countries are
Global sales of industrial robots by sector still expected to be the dominant part of the world market in the years to come.
The figure below shows how the total of about 381,000 sales of industrial robots in 2017 was distributed The numbers reflect that it is in particular the large, car-manufacturing countries that have
among different industry areas. driven the growth and demand for industrial robots so far, and that the electronics industry will
In 2017, the automotive and electronics industries acquired around one third of all industrial robots also lead to growth in the future.
worldwide each, and they are thus the two industries that purchase the vast majority of all industrial
The table also shows that the total number of sold industrial robots in 2021 is expected to grow
robots. In recent years, there has been significant growth in demand in the electronics industry in
to 630,000 and that global growth in the coming years will continue to be driven mainly by China
particular – in the period of 2012 to 2017 the average annual growth in the number of robots sold to the
and the Asian markets.
electronics industry was 30 percent.
The figure also shows that, for example, the food and medicine area still acquire a relatively modest However, it should be noted that increased sales of industrial robots are expected in all countries
share of the industrial robots. However, existing forecasts indicate that the demand for industrial robots and continents.
in these areas will also grow in line with increased quality assurance and the need for reduction in cost
Table 3. Sales of industrial robots by country (2017 and estimated 2021)
and production time.
2017 2021 (estimate)
Figure 19. Global sales of industrial robots by sector (2017) Country
Unspecified Number Share Number Share
Pharmaceuticals Other 9%
China 137,920 36% 290,000 46%
and cosmetics 5%
1% Japan 45,566 12% 64,000 10%
Food
3% South Korea 39,732 10% 46,000 7%
Plastics and USA 33,192 9% 46,000 7%
chemistry Automotive
33% Germany 21,404 6% 26,000 4%
5%
Rest of Europe 44,855 12% 62,600 10%
Metal and Rest of Asia (incl.
38,608 10% 67,600 11%
machinery Australia)
12% Rest of the Americas 12,926 3% 17,500 3%
Electronics
32% Africa 451 0% 800 0%
Not specified 6,681 2% 9,500 2%
Total 381,335 100% 630,000 100%
Source: Table 3 is based on ”World Robotics 2018 Industrial Robots”, International Federation af Robotics (2018).3. Global growth potentials in the field of robotics – service robots 21
This page further explores the global growth forecasts for service robots, which can be subdivided into
professional and personal sub-categories.
Global growth forecasts for professional service robots
According to the International Federation of Robotics, the total global sales of professional service
Figure 20 summarizes some of the various underlying categories of service robots, and figure 21 shows the robots were around €7.1 billion in 2018. On average, it is expected to grow by 19 percent annually until
geographical distribution of the approx. 700 service robot manufacturers that existed in 2017, according to 2021, where the value of total global sales will have increased to approx. €11.9 bn.
the International Federation of Robotics. The box on the right shows two specific growth forecasts for
The number of units sold was 165,300 in 2018, and this number is expected to grow by 21 percent
professional service robots. The column chart shows the overall forecast for growth in the number of
annually to approx. 293,000 units in 2021, as shown in the figure below.
professional service robots sold from 2018 to 2021, while table 4 shows the expected distribution by the
main application areas, measured by sales value. Figure 22. Expected development in the number of professional service robot units sold globally
Among the experts interviewed, it has been pointed out that the market for professional service robots is in a
powerful maturation process, where robots increasingly move from being "gimmicks" to being 293
‘000 robot units
systematically designed to fit the needs of the users. In this process, the market value and commercial 242
potential of the robots is significantly increased. 200
165
Figure 20. The various categories of service robots
Professional Figure 21. Distribution of 2018 2019 2020 2021
manufacturers by continent (2017) Both in terms of number and economic volume, it is particularly the logistics area which account for a
Inspec- lot of the professional service robots.
Defence tion Logistics
The health and surgery sector is also a relatively large application area. This area is characterized by
high regulation and high unit prices, and leasing models are therefore particularly widespread.
Medicine The application area of agriculture mainly concerns robots for harvesting and milking.
Agri-
Cleaning
Con-
and
North
culture struction Europe
surgery America
43% Table 4. Expected global sales of professional service robots by application area
35%
(307)
(250) Application area 2018 2019 2020 2021 Share (2021)
Logistics €3.1 bn. €3.7 bn. €4.5 bn. €5.3 bn. 44 %
Health and surgery €1.9 bn. €2.2 bn. €2.7 bn. €3.2 bn. 26 %
Entertain-
Household Home care
ment Agriculture €0.9 bn. €1.0 bn. €1.2 bn. €1.5 bn. 12 %
Asia
18% Defence €0.8 bn. €0.9 bn. €1.1 bn. €1.3 bn. 11 %
(133) Other €0.4 bn. €0.5 bn. €0.6 bn. €0.7 bn. 6%
Personal Total €7.1 bn. €8.4 bn. €10.0 bn. €11.9 bn. 100 %
Source: International Federation of Robotics ”World Robotics 2018 Service Robots” (2018)22
”As the sector of service robotics has matured, our
products are increasingly based on use cases and the
wishes of customers rather than standard products.
More business and software people have come into the
field to assist in meeting customers' needs and
complement the engineers, which makes for more
customized and useful end products”
- Jade Le Maitre, Directrice Associée, Partner
HEASE Robotics3. Global growth potentials in the field of robotics – global growth drivers and demands 23
In general, there is some uncertainty about how fast the growth of robotics will develop. But the global Generally, the market and demand-driven growth drivers are closely linked to the global megatrends
forecasts give a clear picture of the fact that the field of robotics has a great potential for growth in the outlined on page 15, and the growth forecasts are largely based on robotics continuing to undergo strong
coming years. This applies in particular to the collaborative industrial robots and to professional service technological development and innovation in the coming years.
robots, e.g. in the areas of health and welfare.
In other words, the increasing global demand and growth requires that robots continue to be improved upon
On this page, some of the most important assumptions regarding the technological and commercial and further developed and that it will succeed in making visible and disseminating the knowledge of the
developments that support the growth forecasts are summarized, as well as what new requirements and (new) possibilities and potentials of robot technology both among existing users and new user segments
challenges that may be in store for the Danish robot cluster. throughout the world.
Growth drivers within Essential future demands to the Danish robotics cluster Growth drivers within
market and demand The global growth and development will most likely affect science and technology
the Danish robotics cluster in the following ways: • Increased functionality and
• Focus on energy efficiency
and the use of new • The growth potential of the robotics area is well-known, and more applications. This
materials requires continuous although the demand will increase, it is expected that includes the development of new
conversion of production processes increased global competition can be expected both in terms application areas
of price and functionality.
• Spread of production to more • Increased ease-of-use and easier
countries and geographical locations • The need for research, development and innovation that can be translated programming and integration of
to meet local needs, shorten time-to- into new commercial solutions for the needs of users and industries will flexible robots to work within existing
market and reduce political and increase with the growth in global competition and technological processes and workflows (plug-and-
logistical risks development. This applies to both developing new application areas for the play)
collaborative industrial robots, as global price competition on the hardware
• Increased need for fast and flexible
will increase, and within the emerging growth areas such as the professional • Greater operational safety and quality
conversion of production processes
health and welfare robots. assurance
• Continued pressure to reduce
• There will be a (still) greater need for access to skills within IT and
production costs • Decreasing costs per robot unit
digitalisation and a (continued) close interaction between manufacturers and
• Conversion to the production of integrators in relation to delivering holistic solutions and not just hardware. • More digital and intelligent robots that
electric cars in the automotive industry can learn and implement optimizations
• The need for access to business partners in other countries and in other
• A growing global economy and sectors will grow both in order to develop new and innovative solutions, to based on AI and data sharing via cloud
consump-tion of electronics, gain better market access and to understand local needs and regulatory and solutions and machine learning
materials, food, etc. commercial market conditions. between robots performing the same
types of tasks. So-called "Cloud
• Increasing life expectancy and health • Growing demands for solutions that support the UN’s Sustainable
Robotics".
expenses Development Goals and data ethical guidelines.3. Global growth potentials in the field of robotics – potentials for the Danish cluster 24
The global megatrends and growth forecasts for the robot area provide a clear indication that, in the future, On this page, a number of different strategic ways have been summarized on how the Danish robotics
there are still major growth potentials for the Danish robotics cluster, both within the existing positions of cluster can exploit the global growth potentials in the best possible way. In addition to existing studies and
strength and possible emerging growth areas. analyses in the field, the findings are based on interviews with a number of leading Danish and international
experts (cf. the appendix).
Scaling of existing strength positions in collaborative industrial Development of industrial robots targeted clinical processes
robots Growth forecasts indicate that there may be an untapped growth potential within, for example, the food
An obvious potential for the Danish robot cluster is to continue the development and pharmaceutical industries, where major clinical and regulatory requirements for production processes
and sales scaling of collaborative industrial robots to the global segment of in terms of tests, documentation, and certification exist.
small and medium-sized enterprises. This market is expected to keep growing
Besides, Denmark has historically had a strong position in automation solutions for the food industry.
significantly, and it is estimated that the existing global market among SME’s is far from
saturated. This means that there is a potential for the Danish robotics cluster to develop new and innovative automation solutions,
e.g. in collaboration with some of the major international suppliers of production plants in the life science and food sector.
In light of these global growth forecasts, it is clear that the future potential can be realized
through technological development and scaling of sales to SME’s. Gaining access to these
relevant target groups, and business segments will typically require collaboration with Development of emerging growth areas within the field of professional service robots
local partners and distributors.
As shown on the previous pages, huge growth is expected within the field of professional service
robots (including drones), and in particular in the health and welfare area, where robot technology
and growth potential is still on the rise.
Development of new application areas for collaborative
industrial robots In general, there is a need for further innovation as well as technological and commercial development within the area,
but the Danish robotics cluster is considered to be in a good position for utilizing future potentials and opportunities
The growth potential of the collaborative industrial robots is very much within the emerging growth area.
linked to the development of new applications that enable robots to handle
increasingly complex, agile and demanding processes. In metal and mechanical The good position is due to the fact that, among other things, an increasing share of entrepreneurs and newly established
engineering, for example, the tasks relate to welding and assembling components rather professional service robot companies have come into the Danish robot cluster in recent years. At the same time, there
than simply handling and moving physical elements. are already leading manufacturers (e.g. Blue Ocean Robotics) of professional service robots for the health and welfare
sector.
The development of new application areas will thus greatly contribute to increasing the
demand and growth of the collaborative industrial robots, both among new and existing Going forward, the Danish robotics cluster will most likely be able to stand strong, as long as the existing technical and
global customer segments. commercial competencies can be utilized and spread to an increasing number of new companies working with
professional service robots in the cluster. These include, for example, agriculture, logistics, and drones for inspection,
surveillance, and transport.You can also read