Temporary Salt Lakes: Ecosystem Services Shift in a Ramsar Site Over a 50-Year Period - Frontiers
←
→
Page content transcription
If your browser does not render page correctly, please read the page content below
ORIGINAL RESEARCH
                                                                                                                                           published: 28 June 2021
                                                                                                                                    doi: 10.3389/fevo.2021.662107

                                            Temporary Salt Lakes: Ecosystem
                                            Services Shift in a Ramsar Site Over
                                            a 50-Year Period
                                            Ioanna Ioannidou 1 , Paraskevi Manolaki 1 , Vassilis D. Litskas 1 and
                                            Ioannis N. Vogiatzakis 1,2*
                                            1
                                             Terrestrial Ecosystems Management Lab, Faculty of Pure and Applied Sciences, Open University of Cyprus, Nicosia,
                                            Cyprus, 2 Department of Earth and Environmental Sciences, University of Milano-Bicocca, Milan, Italy

                                            Changes in land use/land cover (LULC) are the key factors driving biodiversity and
                                            ecosystem services decline globally. This study examines spatiotemporal LULC changes
                                            in a Ramsar coastal temporary wetland (Larnaca Salt Lake) on the island of Cyprus
                        Edited by:
                        Anita Diaz,
                                            between 1963 and 2015. LULC changes in the area are related to variations in
             Bournemouth University,        the provision of ecosystem services (ES) namely food provision, climate regulation,
                   United Kingdom
                                            avifauna support and landscape aesthetics. LULC mapping was performed based on
                       Reviewed by:
                                            the interpretation of aerial photos taken in 1963, while 2015 mapping was based on
                  Mirko Di Febbraro,
             University of Molise, Italy    CORINE classification validated by satellite image analysis and fieldwork. We used the
                         Marc Russell,      following indicators for the ES examined: (1) crops’ yield for the estimation of food
         United States Environmental
            Protection Agency (EPA),
                                            supply, (2) carbon storage potential for climate regulation, (3) land cover potential to
                        United States       support avifauna richness and (4) naturalness as a proxy for landscape aesthetics.
                   *Correspondence:         Quantifications were based on a mixed-methods approach with the use of statistical
                 Ioannis N. Vogiatzakis
                                            data, expert opinion and bibliography. Estimates for every service were assigned to
        ioannis.vogiatzakis@ouc.ac.cy
                                            CORINE land use classes (CLC) present in the area. Landscape structure was measured
                   Specialty section:       using a suite of commonly employed landscape metrics. The results showed that
         This article was submitted to
                                            between 1963 and 2015 there has been a significant reduction in food provisioning
        Conservation and Restoration
                               Ecology,     service by 75%, a 37% reduction in carbon storage capacity, an 11% reduction in the
                a section of the journal    capacity to support avifauna, and a 13% reduction in landscape aesthetics. Increased
    Frontiers in Ecology and Evolution
                                            soil surface sealing, mainly with the construction of the international airport, which
         Received: 31 January 2021
           Accepted: 02 June 2021
                                            resulted in the conversion of natural or semi-natural to artificial surfaces, has been the
          Published: 28 June 2021           main reason for the decrease in ES supply over the last fifty years in the study area.
                               Citation:    The character of the area in terms of land use types richness and diversity remains fairly
               Ioannidou I, Manolaki P,
                                            stable but the dominant land use types have experienced fragmentation. The study sets
 Litskas VD and Vogiatzakis IN (2021)
    Temporary Salt Lakes: Ecosystem         the basis for a monitoring scheme to evaluate the state of the temporary wetlands with
 Services Shift in a Ramsar Site Over       emphasis placed on spatial processes as a link to ES provision.
                     a 50-Year Period.
           Front. Ecol. Evol. 9:662107.     Keywords: Cyprus, climate regulation, Natura 2000, food supply, habitat maintenance, landscape aesthetics,
      doi: 10.3389/fevo.2021.662107         wetlands

Frontiers in Ecology and Evolution | www.frontiersin.org                         1                                            June 2021 | Volume 9 | Article 662107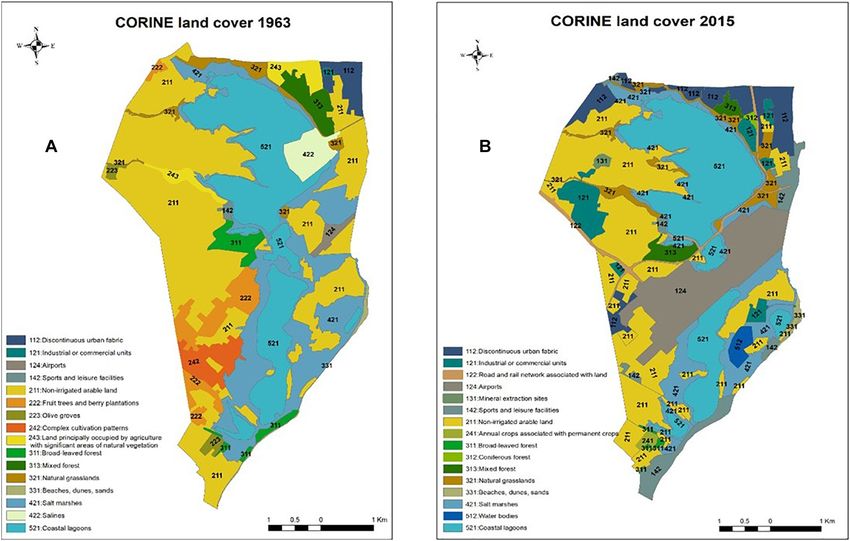
Ioannidou et al.                                                                                                  Salt Lake Ecosystem Services Shift

INTRODUCTION                                                                Ramsar sites, part of the Natura 2000 network of protected areas
                                                                            (Zadereev et al., 2020).
Temporary wetlands are generally small and shallow aquatic                      Despite their valuable ecological and economic functions,
ecosystems, characterised by frequent drying (Boix et al.,                  many temporary salt lakes are often seen as “wastelands” by the
2020) and can be found in a variety of landscape settings                   local communities, particularly during the dry season (Williams,
worldwide (Calhoun et al., 2017). Their intermittent character              2006). As a result, they are threatened and already degraded
makes these ecosystems an ecotone between terrestrial and                   or lost due to urbanisation, population growth, and increased
aquatic environments. The cyclical nature between phases of                 economic activities (Central Pollution Control Board, 2008).
inundation and drought creates a unique and highly dynamic                  Proximity to urban areas has increased their vulnerability to
environment that supports a specialised assemblage of plant                 pollution, eutrophication and other human pressures (Gedan
and animal species (Williams, 2002). Temporary wetlands are                 et al., 2009). Land use/land cover (LULC) changes within
ecologically significant landscape elements especially in regions           the lakes’ catchments may also have adverse effects leading
where water sources are limited, through the insertion of                   to a reduction in inflows and deteriorating quality of the
the aquatic feature into the terrestrial matrix (Boix et al.,               “runoff ” traversing through agricultural fields and urban areas.
2020). They are remarkably diverse ecosystems exhibiting                    Additionally, the tight relationship between their hydroregime
variances based on their genesis, their regional characteristics            and hydrology makes temporary salt lakes extremely vulnerable
and their hydroregime (Vanschoenwinkel et al., 2009; Sim et al.,            to changes in climate (Boix et al., 2020). Due to their small size
2013).                                                                      and their cyclical inundation nature, temporary salt lakes are very
    Salt lakes is a special type of temporary wetlands                      responsive to changes in temperature and precipitation patterns
(Dungan , 1990; Britton and Crivelli, 1993; Tiner, 2003). They              (Boix et al., 2020).
occur throughout the arid (25–200 mm annual precipitation)                      Identifying and mapping the ecosystem services (ES) provided
and semi-arid (200–500 mm) regions of the world (Jellison                   by temporary salt lakes is essential for highlighting their
et al., 2004; Oren et al., 2009). They include a vast array of              importance and the need for further protection, given that
different sizes, ages, salinity, ionic composition, flora and fauna;        they have been relatively neglected, compared to other wetland
from ephemeral playa lakes to ancient lakes (Hammer, 1986;                  ecosystems. Mapping of ecosystem services supply and demand
Williams, 1996). The global volume of inland saline water (85,000           is a critical step in spatial planning with a plethora of mapping
km3 ) is only slightly less than that of freshwater (105,000 km3 )          methods now at hand (Crossman et al., 2013). The use of LULC as
(Shiklomanov, 1990). Locally they may be more abundant than                 a proxy for broad ecosystem type delineation, is often applied to
freshwater, and they often dominate the landscape and provide               large geographic areas where the dominant ES are directly linked
critical habitat for endemic species, and breeding and migratory            to land cover and where data availability is limited (Burkhard
birds (Jellison et al., 2004).                                              et al., 2012; Maes et al., 2015). LULC modifications in an area
    Temporary wetlands are ecologically important given their               could lead directly or indirectly to ES decline or cause shifts
role to global biochemical cycles and the provision of habitats             in the provision and flow of specific ES (Gómez-Baggethun
for a high number of species, disproportionate to their size                et al., 2019; Boix et al., 2020). The assessment of ecosystems’
(Deil, 2005). In addition to their ecological value, temporary              status at a European level indicated that more than half of
wetlands provide important ecosystem services, some of which                ecosystems are in a non-favourable state, which remains stable
are exclusive to these ecosystems, owing to their unique                    or is getting worse (Abdul Malak et al., 2015). Modification, loss
functions and biodiversity. They perform important economic                 and fragmentation of habitats, in combination with pollution and
(fisheries, livestock and forestry), social (water supply, spiritual,       climate change, are the most important pressures that ecosystems
educational, visual), and ecological functions (groundwater                 face (Ghosn et al., 2010). There is an important knowledge gap
recharge, nutrient recycling, and biodiversity maintenance) with            in the combined pressures and causes that result from ecosystem
significant values (Williams, 2002). Although their benefits to             degradation as well as a lack of spatial data to map biodiversity
society are not as easily monetised, their economic value is                and ES provisioning.
estimated at around US$15 trillion a year (Millennium Ecosystem                 Mapping the historical change in wetlands has the value
Assessment, 2005).                                                          of indirectly quantifying the human impact on the natural
    Salt lakes can accumulate and recycle nutrients better than             environment, which can then be used for management and
freshwater systems (Blomqvist et al., 2004). They produce high              education toward sustainable development (Burkhard et al.,
quantities of food for fish which in turn sustain bird populations.         2012). At finer spatial scales, using data from inventories or
Even when salinity levels are too high for fish to survive,                 databases, coupled with land cover data may provide better
invertebrates can still support birds’ diets. Millions of migratory         insights for ES level provision in environmentally sensitive areas
shorebirds and waterfowl utilize saline lakes for nesting and to            (Schmidt and Seppelt, 2018; Linney et al., 2020).
fuel long migrations with abundant food resources such as brine                 Larnaca salt lake ecosystem in Cyprus is an area where
shrimp (Artemia spp.) and brine flies (Ephedra spp.). When                  important changes have had adverse effects over the past 50
saline lakes are desiccated, the amount of habitat decreases and            years, yet unquantified impacts on ES provision. The latter
salinities can rise beyond the tolerance of these invertebrates,            mirrors the limited research in Cyprus regarding ES despite
limiting both food and habitat for birds. Due to their importance           recent attempts (Manolaki and Vogiatzakis, 2017; Vogiatzakis
for avifauna, many salt lakes in Europe are, in addition to                 et al., 2020). Therefore, this study aimed to assess in a spatially

Frontiers in Ecology and Evolution | www.frontiersin.org                2                                      June 2021 | Volume 9 | Article 662107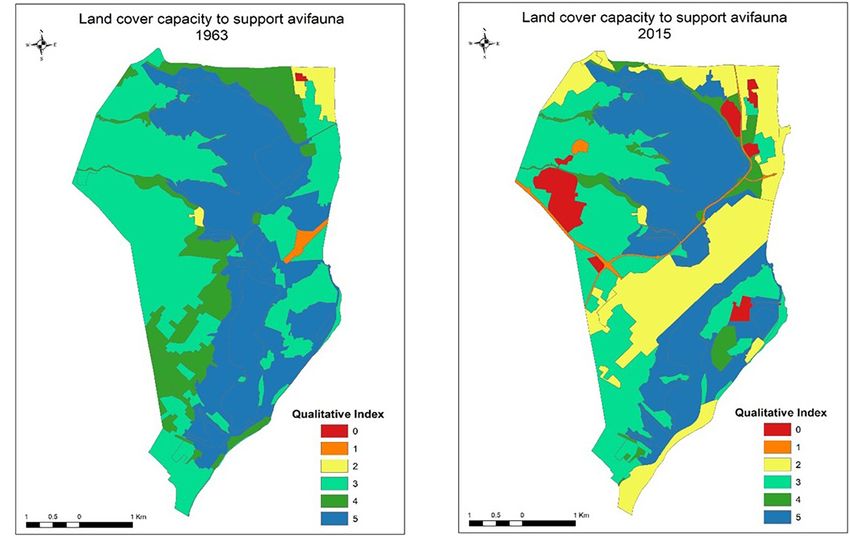
Ioannidou et al. Salt Lake Ecosystem Services Shift
explicit manner the changes in ES, which took place from 1963 to areas. This is also the reason why 1963 was selected as a reference
2015 in the Larnaca salt lake ecosystem. The objectives were to: year for comparison.
i. test the applicability of a biophysical approach for ES LULC Spatiotemporal Changes
assessment in wetlands; Land use/cover changes (LULC) in the study area were examined
ii. use proxy data and experts’ opinion for ES mapping and; between 1963 and 2015 using orthophotos and satellite images
iii. identify spatiotemporal changes in ES, linked to LULC respectively, to relate spatial variations in wetlands extent with
changes over fifty years. the provision of the selected ecosystem services (ES).
For mapping recent land cover (2015), we used the available
CORINE 2012, classification at the 3rd level. To verify the validity
MATERIALS AND METHODS of the available land cover maps and update information, a
combination of remote satellite images analysis using Google
Study Area Earth Pro l with field observations (10 visits). Field visits took
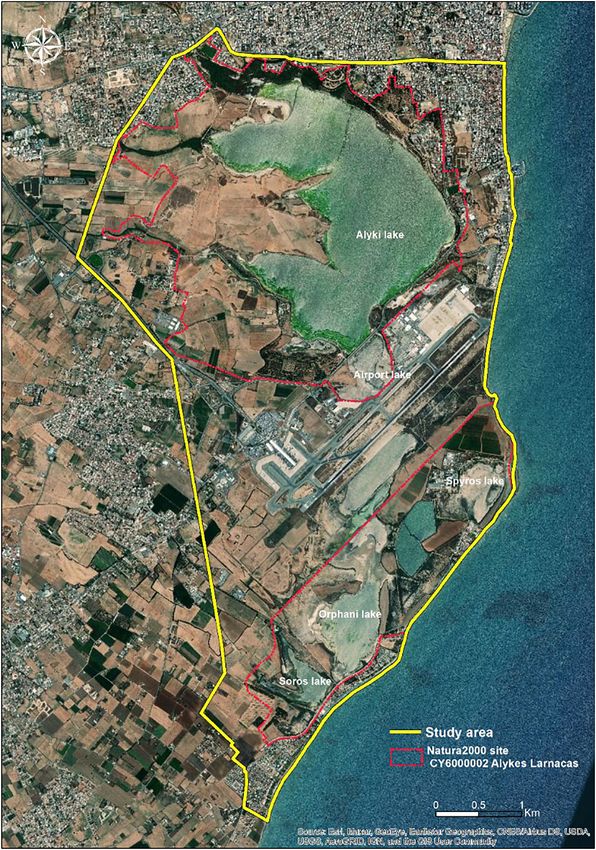
The study area is located to the west of the city of Larnaca, place from March 2015 to February 2016. Layers were digitised
Cyprus (34◦ 540 000 N, 33◦ 370 000 E) comprising a unique in Google Earth (kml type), using the UTM WGS84 36S. The
ecosystem of a complex network of lakes (Alyki, Orphani, obtained kml polygons were processed in ArcGIS (v10.2) and in
Soros, Spyros and Airport Lake). Alyki is the largest lake the attribute table, land use in CORINE (level 3) was recorded.
of the ecosystem with an area of 449 ha and 11.5 km in For mapping historic LULC, we used orthophotos
diameter (Hadjichristophorou, 2008). The ecosystem is one (5,000 m × 5,000 m, 1 dpi resolution from 1963), obtained
of the most important wetlands in Cyprus and the East from the Cyprus Land Registry (Land and Surveys Department;
Mediterranean, of international ecological significance, declared CGRS 1993 LTM reference system). The historic land cover
as a Ramsar site by a decision of Council of Ministers (1997), was determined using photo-interpretation and archived
Special Protected Area under Barcelona Convention, Important cadastral records.
Bird Area while almost the entire area (1560 ha) belongs to We used five commonly employed landscape metrics for
Natura 2000 network of protected areas (CY6000002 Alykes diversity, composition and configuration namely Richness,
Larnacas) (Figure 1). Shannon’s diversity index (SHDI), Shannon’s evenness index
Cyprus is located along one of the main migratory routes (SHEI), Dominance, Mean Shape index (MSI) to study the
between Europe and Africa, and the Middle East. Birdlife complexity of the study area in terms of land use types for
International has identified Cyprus as an Endemic Bird Area the two years of reference. Indices were calculated using the
(EBA) in Europe. Important bird species recorded in the area V-Late 2.0 beta extension for GIS (Lang and Tiede, 2003).
include Oxyura leucocephala, Phoenicopterus roseus, Numenius Diversity metrics are often used in landscape ecology to quantify
arquata, Charadrius alexandrinus, Egretta garzetta, Grus grus, landscape composition and are often met with similar criticisms
Glareola pratincola, Tadorna tadorna, Grus virgo, Vanellus to those expressed in biodiversity studies (Chiarucci et al.,
spinosus, Melanocorypha calandra, Himantopus himantopus, 2011). However, when richness and evenness are evaluated
Francolinus francolinus (Hellicar et al., 2014). Also, the area hosts independently, as carried out herein, they provide a more
key habitat types included in the Annex I of the EU Habitats informative and complete way to measure diversity aspects
Directive (European Council, 1992) such as Coastal Lagoons (McGarigal, 2015).
(1150), Annual vegetation of drift lines (1210), Pseudo-steppe
with grasses and annuals of the Thero-Brachypodietea (6220) and Ecosystem Services (ES) Mapping
Red Data Book plant species Hippomaranthum scabrum (Fenzl) We selected four ecosystem services, one per ecosystem
Boiss., Ferula scabra (Fenzl), Crypsis factorovski, Filago mareotica, category following the Millennium Ecosystem Assessment (2005)
Limonium mucronulatum, Ophrys kotschyi and the endangered framework (provisioning, regulating, supporting and cultural)
Suaeda aegyptiaca (with its largest recorded population in Cyprus namely food provision, climate regulation, avifauna support
2 -3 thousand plants) (Tsintides, 2007). and landscape aesthetics (Table 1). For each ES, an indicator
Despite its ecological importance, during the last 50 years, was employed as a proxy for mapping, and the percentage of
the entire ecosystem has undergone important land cover change (1%) between the two reference years was calculated per
changes, due to urbanisation and the construction of the Larnaca indicator based on the equations presented in Table 1.
international airport. The most significant threats for this wetland
are: (1) the presence of the Larnaca International Airport, (2) Food Provision
human activities such as desalination, wastewater treatment, road Crop yield was used as an indicator for the estimation of food
network maintenance/expansion, (3) urbanisation, (4) tourist provisioning (Eq. 1 and Table 1). Firstly, the agricultural land
activities within the salt lakes, (5) agriculture. of the study area was grouped based on the following major
In this study, we investigated the ES provided by the Larnaca crop categories: (1) cereals (wheat and burley), (2) olive trees, (3)
Salt Lake complex with a total area of 2880 ha, including the vegetables and melons (e.g., cucumbers, watermelons, tomato),
Natura 2000 site (Figure 1). The study area was delimited based (4) citrus (e.g., orange, lemon trees), (5) arable land (cereals) and
on the coverage, availability and quality of past orthophotos, and natural vegetation (in our case, approx. 75% arable land and 25%
included, in addition to the protected area, its surrounding rural natural vegetation), (6) Olive trees with cereals as an additional
Frontiers in Ecology and Evolution | www.frontiersin.org 3 June 2021 | Volume 9 | Article 662107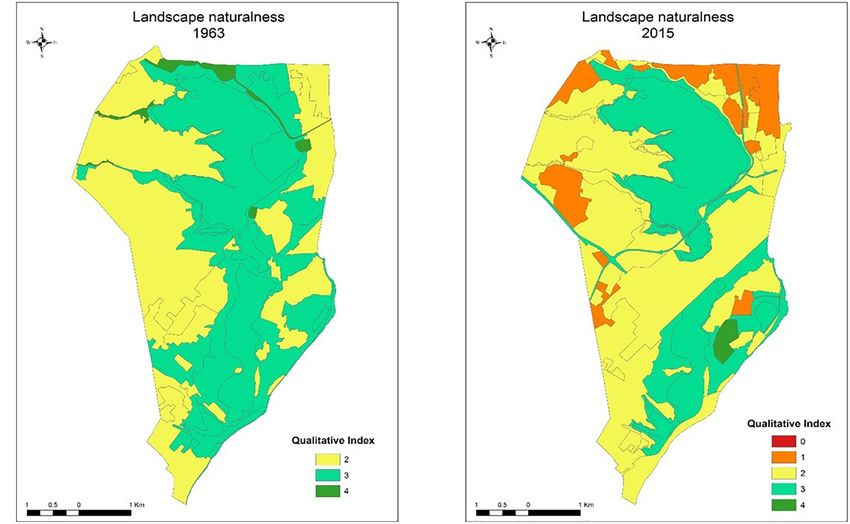
Ioannidou et al.                                                                                                  Salt Lake Ecosystem Services Shift

  FIGURE 1 | Study area.

crop in the main field (75% of the area of the field occupied by            cereals, wheat and barley yields were averaged. For vegetables and
cereals) (Statistical Service, 2019).                                       melons yield, the respective yields for the crops such as carrots,
   The next step was to link the agricultural crop types to the             tomato, cucumber, melons, watermelons, etc., were averaged.
CORINE Land Cover Class (CLC), as obtained by the land cover                The citrus yield was the average of that for oranges, lemons
(shown in Supplementary Table 1; Supplementary Material).                   and grapefruits. For class 243 (Land principally occupied by
   Additionally, for the determination of the food provisioning             agriculture with significant areas of natural vegetation), the yield
service in the area, and according to the above classes, we                 was considered to be 75% of class 211 (Non-irrigated arable
obtained data from the Statistical Service (2019), related to the           land). In the case of olives and cereals cultivation in the same
yields (tons/ha) of these crop types, during the period 1963–2015.          field, the sum of the olive yield to 75% of the yield of cereals
These data are available at a national level for each of these years        was used for the estimation of the total yield. In this case, for
(but not area specific). In more detail, in our case for the yield of       the yields of cereals, we assumed that 75% of the land in an

Frontiers in Ecology and Evolution | www.frontiersin.org                4                                       June 2021 | Volume 9 | Article 662107
Ioannidou et al.                                                                                                                          Salt Lake Ecosystem Services Shift

TABLE 1 | Indicators and methods for the estimation of the Ecosystem Services.

Ecosystem service                Ecosystem                 Indicator                Method                Equation used
category (MA, 2005)              service                                            (reference)

Provisioning                     Food provision            Crop yield               Yields (tons/ha) of   Eq. (1)
                                                                                                                         n
                                                                                    crop types            Btot,year =
                                                                                                                         P
                                                                                                                              Bi Ai
                                                                                                                          i
                                                                                                          Btot,year : the total yield produced in Tons/year in study area
                                                                                                          in each reference year (1963, 2015); Bi is the yield
                                                                                                          attributed in the polygon i; Ai: the area of the polygon (ha).
Regulating                       Climate regulation        Carbon storage           TESSA                 Eq. (2)
                                                           potential                                      Ctot,year = AGBC + BGBC + SoilC + DOM_C
                                                                                                          AGBC : Above ground live biomass carbon stock; BGBC :
                                                                                                          Below ground live biomass carbon stock, SoilC : soil
                                                                                                          carbon; DOMC : Dead organic matter carbon
Supporting                       Avifauna support          Avifauna support         Expert opinion        Eq. (3)
                                                                                                                              n

                                                           potential                                      Etot, year =
                                                                                                                              P
                                                                                                                                  εi Ai ÷ Atot
                                                                                                                              i
                                                                                                          εi: average experts score for the class of the polygon i, Ai:
                                                                                                          the area of the polygon; Atot is the total study area (ha)
Cultural                         Landscape                 Landscape                Hemerobiotic scale    Eq. (4)
                                                                                                                              n

                                 aesthetics                naturalness                                    Ntot, year =
                                                                                                                              P
                                                                                                                                  Ni Ai ÷ Atot
                                                                                                                              i
                                                                                                          Ni: index for naturalness of the polygon i with Ai area, Atot.:
                                                                                                          the total area of the study area.
The percentage of change between the two reference years                                                  Eq. (5)
                                                                                                                         X         −Xtot, 1963
                                                                                                          1Xtot,% = tot, 2015 Xtot, 1963         × 100
                                                                                                          X: Btot,year; Ctot,year ; Etot,year ; Ntot,year

TABLE 2 | The qualitative index to convert each of the 4 indicators values to a 0–5 scale.

Yield (Mg/ha) (B)              C storage potential (Mg                    Avifauna support                Hemerobiotic                                Qualitative index
                                      C/ha) (A)                          (experts score) (E)                index (H)

B=0                                  0 ≤ A ≤ 30.0                             0 ≤ E ≤ 0.5                    6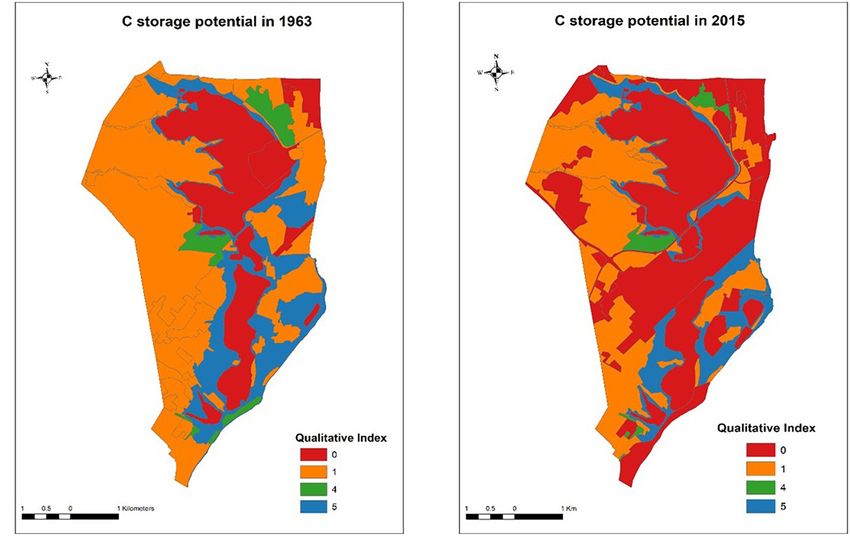
Ioannidou et al.                                                                                                  Salt Lake Ecosystem Services Shift

TABLE 3 | Diversity and form analysis at a landscape level.                 et al., 2014). A group of 14 experts from Cyprus was asked to
                                                                            evaluate CORINE land cover classes on a scale from 0 to 5 (where
                                                 1963           2015
                                                                            0 was the lowest value and 5 the highest) for their suitability to
Diversity analysis                                                          support bird species richness, irrespectively of the presence of
Richness                                          16             16         rare or threatened species (Pitzii, 2017). Experts were identified
Shannon’s diversity                              1.815          2.030       based on their research and/or practical experience in land
Shannon’s evenness                               0.654          0.732       management for birds in Cyprus. Kendall (W) coefficient was
Dominance                                        0.958          0.742       used to determine the degree of agreement among the experts’
Form analysis                                                               answers (0 to +1; where 0 means total disagreement and +1 the
Total patches                                     67             89         opposite) (Legendre, 2005). SPSS was used for this analysis. The
Mean shape index                                 2.294          2.262       average (n = 14) value of the experts’ response was attributed in
Mean perimeter-area ratio                        0.025          0.034       each mapped land cover/use category in the study area. Two of
Mean fractal dimension                           1.334          1.344       the mapped classes in area 521 “Coastal lagoons” and 421 “Salt
                                                                            marshes” were not available in the CLC for Cyprus, therefore
                                                                            512 “Water bodies” and 412 “Peat bogs” were used, respectively.
    The coefficients to estimate AGBC for the terrestrial habitat           In ArcGIS, maps were built for 1963 and 2015, according to
types were obtained from Annex II of the TESSA toolbox (Peh                 the CORINE classes (Supplementary Table 2 and Table 4). Bird
et al., 2013) and for wetlands from IPCC (2006) and they are                fauna support potential was estimated according to Eq. 3 (see
provided in Supplementary Table 3. Estimates for the BGBC                   Table 1). The difference in bird fauna support potential between
were performed using a below-ground to above-ground biomass                 1963 and 2015 was calculated using Eq. 5 (Table 1).
ratio conversion factors (Supplementary Table 3) from IPCC
(2006, 2013, 2014). BGB for permanent woody crops were                      Landscape Aesthetics
obtained from Annex II of the TESSA toolbox (Peh et al., 2013).             Landscape naturalness was used as a proxy for landscape
To calculate biomass carbon stock, biomass (below and above                 aesthetics, assessed by using the hemerobiotic scale (Winter et al.,
live biomass) was multiplied by a conversion factor (CFC) of 0.5            2010; Rüdisser et al., 2012; Table 2 and Supplementary Table 4).
for tree-dominated, forest plantations, perennial crop-dominated            For each of the maps (1963 and 2015) the naturalness index (H)
habitats, or by 0.47 for grass-dominated habitats and by 0.45               was estimated and the difference between 1963 and 2015 was
for salt marshes.                                                           calculated according to Eq. 5 (Table 1).
    The C content in the soil (SoilC ) was estimated according
to the values for each of the soil categories (e.g., Cambisols)
available in IPCC (2006). Soil related data about the study area            RESULTS
were obtained from the BIOframe platform.1 A representative
value for the soil types, which are Cambisols and Solonetz, in the          LULC Changes
study area and considering the semi-arid climatic conditions, is            Figure 2 presents the area for each CLC, at the 3rd level, for
38 Mg C/ha (Supplementary Table 3; Supplementary material)                  the two reference years (1963, 2015). In 1963 the dominant
(Papini et al., 2011).                                                      land use/cover types were semi-natural (421, Salt marshes with
    The DOMC in coniferous forests is 28.2 and for eucalyptus               halophytic vegetation; 521, Coastal wetlands) and agricultural
forests 20.3 Mg/ha (IPCC, 2006; Supplementary Table 2).                     (211, Non-irrigated arable land) while artificial surfaces were
For mixed forests, an average value between coniferous and                  minimal (see also Supplementary Table 4). The semi-natural
broadleaved forests was considered. For all the other vegetation            areas in 2015 were then reduced (both aquatic and terrestrial)
types, the respective value was zero (IPCC, 2006; Supplementary             as well as the agricultural land (i.e., 211) while the area of the
Table 2). Accordingly, for each of the land cover mapped                    artificial surface has been increased. The changes in land cover in
in the study area, a value of total C storage potential                     the study area are presented in Supplementary Table 4. In 2015,
was calculated based on Eq. 2 (Table 1) and presented in                    the construction of the airport changed the spatial configuration
Supplementary Table 2.                                                      of the land cover/use types in the study area since it divided the
    Using ArcGIS total C was linked to the mapped polygons,                 area into two main regions, north and south of the airport.
under the common field of “land cover class” and in the 3rd                    The form and diversity of the area have remained remarkably
CORINE level. C storage potential was then converted into a 5-              stable over the past 50 years (Table 3). However, there has been
scale qualitative index (zero to very high), as given in Table 2. The       an overall increase in the total land parcels in the area, while the
% change 1Ctot, % for the two reference years was also estimated            number of patches and the Mean NN of the dominant land cover
following Eq. 5 (Table 1).                                                  types i.e., 211, 421, and 521 have increased (Table 4).

Bird Fauna Support                                                          Ecosystem Services
Expert opinion was used for the evaluation of the avifauna                  Food Provisioning
support potential of this area (Eycott et al., 2011; Stevenson-Holt         The total yield potential for 1963 was estimated to be
                                                                            5803 Mg/year while the respective value for 2015 was 1447
1
    http://www.cyprusbiodiversity.eu/bioframe/                              Mg/year. The observed reduction in food provisioning for this

Frontiers in Ecology and Evolution | www.frontiersin.org                6                                       June 2021 | Volume 9 | Article 662107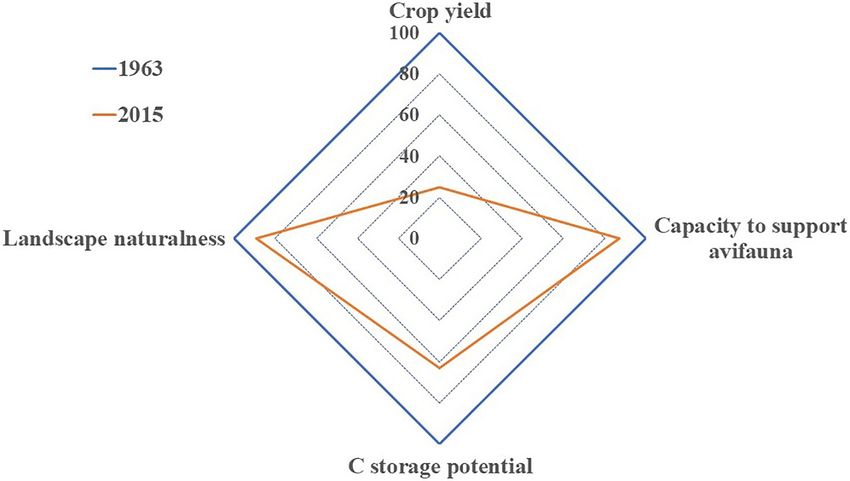
Ioannidou et al. Salt Lake Ecosystem Services Shift
TABLE 4 | Landscape metrics of the Dominant land cover types.
Year CLC code CLC description % of total area No of patches Mean patch size Mean nearest neighbor
211 Non-irrigated arable land 40.76 23 51.13 57.76
1963 421 Salt marshes 17.84 9 51.79 0
521 Coastal lagoons 20.77 6 99.87 217.87
211 Non-irrigated arable land 29.42 24 42.13 93.32
2015 421 Salt marshes 11.42 15 22.88 4.83
521 Coastal lagoons 22.07 6 106.25 183.04
FIGURE 2 | Land cover in 1963 (A) and 2015 (B) in Larnaca Salt Lake.
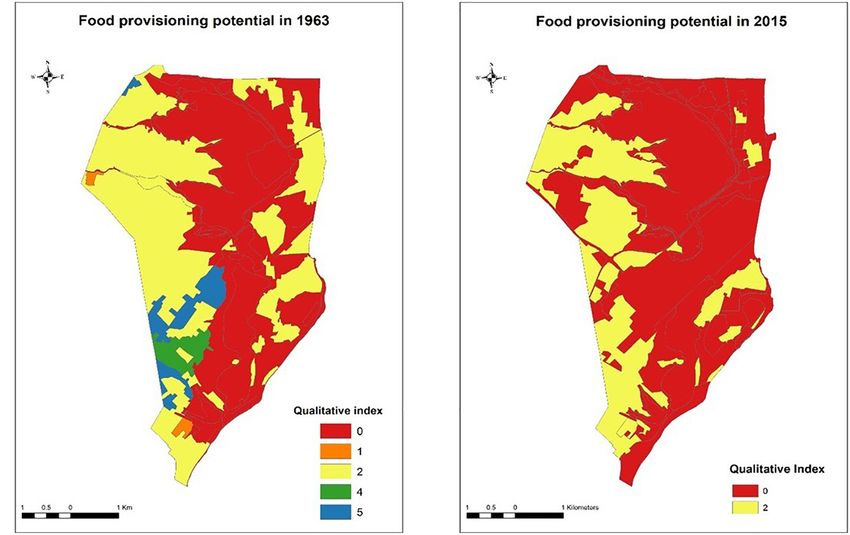
area between this period is 75% (Supplementary Table 5). in the southeast part of the study area, were significantly
Orchards, which are characterised to have high food supply reduced or lost by 2015 and were replaced mainly by sports
potential (yield) have been substituted by artificial surfaces (CLC and leisure facilities (Figure 4). In the western part of the
112, 121-1, 124) or arable land (CLC 211), with no or highly study area, non-irrigated land, which was extensive in 1963
reduced food supply potential (Figures 2, 3). (Figure 2) was significantly fragmented by 2015, following
the construction of industrial units and mineral extraction
Carbon Storage Potential sites (Figure 4).
Total carbon storage potential for 1963 was 246,397 Mg
C while the respective figure for 2015 was 155,534 Mg C.
Generally, a decreasing trend in C storage potential between Avifauna Support
1963 and 2015 (Figure 4) was observed and this reduction was According to the analysis, the capacity of the study area to
estimated to be 37% (Supplementary Table 5). The observed support avifauna was reduced in 2015, compared to 1963 by
drop in C storage resulted mainly from artificial constructions 13% (Supplementary Table 5). The establishment of the airport,
like the airport (124), which caused a severe fragmentation the urban sprawl, and the establishment of animal husbandry
of the semi-natural land cover of the study area (see also facilities were the main factors for this reduction (Figure 5).
Figure 2). Besides, human-made commercial and urban land Apart from the construction of the airport, which caused a severe
uses caused an additional reduction in carbon storage potential reduction in the capacity of the area to support avifauna based
since they replaced significant semi-natural areas (see also on the index (E) other artificial areas also caused a reduction
Figure 2). For example, salt marshes and mixed forest, found of avifauna support ES. As in the case of carbon sequestration,
Frontiers in Ecology and Evolution | www.frontiersin.org 7 June 2021 | Volume 9 | Article 662107Ioannidou et al. Salt Lake Ecosystem Services Shift FIGURE 3 | Food provisioning and relative change between year 1963 (A) and 2015 (B). FIGURE 4 | Spatial distribution of the total Carbon storage in the study area and the changes during the period 1963 (A) to 2015 (B). changes in land use/cover especially along the coast from semi- (N) reduced by 17%. Spatially this is translated as change taking natural to artificial land cover (leisure and sports facilities) place in the whole area for 2015 except for the wetlands that seem reduced E (Figure 5). to have kept their 1963 (landscape) value, to a large extent. Landscape Aesthetics Synthesis of All ES Assessment According to naturalness mapping (Figure 6), landscape A synthesis of the results from all four ES measured in this study aesthetics have changed during the studied period with the index is presented in Figure 7 as a percentage of change in the four Frontiers in Ecology and Evolution | www.frontiersin.org 8 June 2021 | Volume 9 | Article 662107
Ioannidou et al.                                                                                                       Salt Lake Ecosystem Services Shift

  FIGURE 5 | Avifauna support in the area and the changes between 1963 (A) and 2015 (B).

indices used for these services between the reference years (1963,                and loss mainly due to land-use changes and urbanisation
2015). Overall, a significant reduction in all ES between 1963 and                (Calhoun et al., 2017). However, to the best of our knowledge,
2015 was observed, with the highest reduction identified in food                  studies that investigate the effects of land-use changes and
provisioning (75%) followed by a 37% reduction in C storage,                      habitat loss on ecosystem function and services are still
an 11% reduction in habitat naturalness, and 13% in avifauna                      limited. This is the first study that quantifies the temporal
support. This figure reflects the LULC changes recorded, as 37%                   and spatial changes in the ecosystem services provided by a
of agricultural, 36% of natural, 24% of wetlands και 5% of water                  temporary salt lake in Cyprus and one of the few in the
areas in this area (present in 1963) were converted to artificial                 East Mediterranean.
areas for human uses.
                                                                                  LULC
                                                                                  Human activities like agriculture and urban sprawl are associated
DISCUSSION                                                                        with significant threats to the study area, as for the majority
                                                                                  of the temporary water bodies worldwide (Williams, 2006),
This study proposes an approach to assess and map a                               and these are in agreement with other studies in the
representative number of ES provided by a Ramsar temporary                        Mediterranean, reporting important LULC changes in the 21st
salt lake ecosystem in Cyprus. With this approach, we mapped                      century (Vogiatzakis et al., 2008; Parcerisas et al., 2012).
current and past LULC, according to CORINE land cover                             Undoubtedly, the construction of the airport is the most
classification (level 3) and we assessed changes in terms of                      profound land-use change in the area, resulting in soil
ES provision over 50 years for an ecosystem of international                      surface sealing, a significant loss of semi-natural habitats,
importance. Results demonstrated that long term changes in                        mainly salt marshes and halophytic vegetation, and severe
the area associated with land use caused significant impacts                      fragmentation of the entire ecosystem. Moreover, the area
on the ecosystem, landscape structure and the provided                            due to its position is under continuous pressure from
services. Even though scientific attention to the ecology and                     coastal development, which is partly responsible for changes
function of temporary wetlands has been historically limited                      in agriculture uses and abandonment. Mediterranean coastal
(Williams, 2006; Boix et al., 2020), it is well documented                        ecosystems are vulnerable to anthropogenic pressures due to
that they are threatened by human-made habitat degradation                        population expansion and intensification of the touristic and

Frontiers in Ecology and Evolution | www.frontiersin.org                      9                                     June 2021 | Volume 9 | Article 662107
Ioannidou et al. Salt Lake Ecosystem Services Shift
FIGURE 6 | Landscape naturalness and its changes between 1963 (A) and 2015 (B).
FIGURE 7 | Percentage of change in ecosystem services provision capacity indices in the study area.
industrial sectors (Malavasi et al., 2013; Martínez-Fernández study. Results demonstrated that the landscape composition and
et al., 2015). diversity of the study area have remained remarkably stable over
In addition to the temporal dimension of LULC change the past 50 years. Therefore, the area has retained its character
assessing its spatial dimension is also common in wetlands overall, mainly because in both years (1963–2015) the water
mapping (Bortels et al., 2011) and this was also employed by this bodies, i.e., the lake itself, occupy a large part of the area without
Frontiers in Ecology and Evolution | www.frontiersin.org 10 June 2021 | Volume 9 | Article 662107Ioannidou et al. Salt Lake Ecosystem Services Shift
significant reduction. This is in contrast with other studies in the and artificial surfaces minimizes the C storage potential of an
Mediterranean reporting a polarised territorial matrix in coastal area, due to extensive vegetation clearance and soil compaction
wetlands (Zorrilla-Miras et al., 2014), leading to a contrasting (Chen et al., 2013).
habitat condition between the protected and non-protected part In the period 1963–2015, the halophytic vegetation around
of the area. What has changed significantly, however, is the the lake fell from 600 to 329 ha while the aquatic environment
number of land parcels and the proximity between patches of the (salt lake area) is more or less the same. Experts have indicated
dominant land-use types in the past (i.e., 211 and 421). that these two habitats are the most important for avifauna
There is ample evidence in the literature demonstrating the support. Land cover changes and natural vegetation removal
clear link between landscape composition and configuration on affects species richness, especially when specialisations (e.g., a
avifauna richness in different ecosystems (Morante-Filho et al., bird and a plant species) are observed. In this case, vegetation
2018). To date, there have been limited attempts to link landscape removal results in species replacement (e.g., specialists are
structure with ES provision (Zorrilla-Miras et al., 2014; Varin replaced by generalists) (Boren et al., 1999). The index used
et al., 2019) and even fewer attempts trying to identify the relative for avifauna support evaluation shows a decrease during the
influence of composition and configuration in the provision of studied period (1963–2015) especially when habitat loss was
these ES (Lamy et al., 2016). Although this study did not link taking place. However, a large part of the study area continues
explicitly landscape structure to ES, it is expected that this is to maintain a high capacity to support avifauna, which is also
certainly the case at least for avifauna richness and landscape documented by the continued high visitation by birds annually
aesthetics given that temporary wetlands is an ecotone between (Game and Fauna Service data)2 , but admittedly the effect of
land and water, providing foraging and resting sites for migrating this deterioration is still unknown. Annual bird surveys run by
species (Calhoun et al., 2017). the Game and Fauna Service in Cyprus may provide supporting
evidence, although land cover change is not the only factor that
Ecosystem Services impacts bird species particularly in the light of climate change
The four services were selected due to their importance in (Lemoine et al., 2007).
Cyprus. Since the island is a biodiversity hotspot (Médail and The assessment of landscape aesthetics, as a cultural service,
Diadema, 2009), habitat quality is an important service for was based on the concept of naturalness using a hemerobiotic
sustaining biodiversity in the long term. Agriculture remains scale, employed for the evaluation of the degree of human
one of the most important economic activities, and this is the interventions in a natural landscape (Frank et al., 2013; Taelman
reason why we chose to map food provision. Carbon storage et al., 2016). The index used showed a decrease between 1963
is also an important service especially for climate regulation, and 2015, mainly in the area of the airport and its surrounding
given the scenarios for future climatic change on the island infrastructure. Additionally, north of the salt lake, many of the
(Lelieveld et al., 2016). Finally, we selected to map landscape agricultural areas have been changed to urban. The maintenance
aesthetics since the site is one of the main tourist attractions on an of natural vegetation strips in the perimeter of the water bodies
island which is a major tourist destination in the Mediterranean was important for the preservation of naturalness in the salt
(Vogiatzakis et al., 2020). lake ecosystem. Given that the lake receives a high number
The results suggest that land-use change has negative effects of visitors all year round a deterioration of the overall area’s
on ecosystem services in the study period (1963 and 2015). naturalness might also impact the quality of the service provided
The reduction in total yield between 1963 and 2015 was 75%, (i.e., visitors’ experience).
and since the yield for each crop type is similar between 1963 Overall, the greatest ES changes between 1963 and 2015, in
and 2015, the observed decrease seemed to be caused by the the study area are related to C storage and biomass production
reduction of agricultural land (43%) and the conversion to other from crops and they are attributed to LULC changes. The ES
land uses. This reduction is mainly attributed to the removal landscape naturalness and bird fauna support were affected to
of tree crops (orchards) from the area and a shift to annual a lesser extent during this period, mainly because the water
crops (wheat and burley) or complete change to non-agricultural bodies’ characteristics (e.g., area, surrounding strips vegetation)
use. These changes also resulted in increased mechanisation of were maintained. However, the impact of this change on other
agricultural production which in addition to biodiversity and groups of organisms needs further investigation. Recent studies
food provisioning impacts, leads to increased GHG emissions due indicate that climate change affects C storage in the soils (Lozano-
to fuel consumption for cultivation, pesticide application, and García et al., 2017; Soleimani et al., 2017). Climate change affects
harvesting (Litskas et al., 2019). Cyprus and this particular area, as there is a reduction in the
The significant reduction of carbon storage in the area (by annual rainfall and increase in mean annual temperature during
37%) can be attributed to three factors: (1) the great reduction the period 1963–2015 (Lelieveld et al., 2016). This may in turn
of the halophytic vegetation in the south part of the area, affect C storage in the area as well as plant biomass and yield,
(2) the loss of forested areas and (3) the replacement of tree especially in non-irrigated crops. However, in this research, such
crops (orchards) by arable land in the central part of the area. parameters (e.g., C storage potential per soil/habitat type) were
Carbon storage in halophytic vegetation was estimated to be considered constant during the study period (1963–2015).
129 Mg/ha, similar to other studies (Sousa et al., 2012). These
communities have increased C storage potential, mainly through
their extensive root system. Additionally, the transition to urban 2
www.cypruswildlife.org.cy
Frontiers in Ecology and Evolution | www.frontiersin.org 11 June 2021 | Volume 9 | Article 662107Ioannidou et al. Salt Lake Ecosystem Services Shift
The changes recorded have the potential to affect societies beyond i.e., at the watershed level will assist with ES provision
differently, although landscape aesthetics have not been evaluation and guide restoration efforts to target problematic
influenced significantly over the years. Given that migratory areas. This study is an attempt to highlight this gap and
birds are one of the area’s main attraction, habitat loss, the need for LULC monitoring particularly in and around
fragmentation and deterioration has resulted already in reduced wetlands given their importance for a range of services. It
species diversity. This may affect the tourism and related services comes at a time when the first national MAES assessment
sectors which have superseded the agricultural sector in the area. is underway with funding from an EU LIFE+ project
In addition, soil surface sealing has brought irreversible loss (physis.cy), and provides useful methodological insights for
and significant depletion of both agricultural yield and carbon its implementation.
storage in the area.
Limitations CONCLUSION
Mapping LULC changes over a long period is usually constrained
by data availability (thematic and spatial resolution) and this Our results indicate that it is possible to assess ES potential
was also the case in this case study. The use of the 3rd level in an area for a given period and spatial scale using LULC
of CORINE for LULC identification gave a sound basis for data. In this study, the method was selected after reviewing the
inter-annual comparison. Besides, the use of land cover data available alternatives in contrast to the limitations presented
is a standard step in biophysical mapping for ES (Burkhard in the previous paragraph. The study confirms that Larnaca
et al., 2012; Kroll et al., 2012). The C storage analysis was salt lake ecosystem has lost an important part of ES potential,
based on IPCC guidelines (IPCC, 2006) and we are aware of during the last 50 years. An important decrease is observed
the several shortcomings that have been reported concerning in biomass production from the cultivated crops as well
the broad vegetation types and the conversion factors used as in C storage, which is attributed to the LULC changes.
(see for example Manolaki and Vogiatzakis, 2017). However, Halophytic vegetation removal is the main factor for the
given that the same methodology was used in both reference reduction in C storage in this area. The conversion of tree
years, the changes were reported consistently and therefore crops to annual crops is the main cause for the reduction
trends hold. However, field studies would have been preferable in food provisioning. Avifauna support and landscape
to provide an accurate estimate of carbon storage (Smith aesthetics are less affected during the 50 years. However,
et al., 2013). Regarding the bird fauna supported by the land airport expansion, tourism and urban development are
cover in this area, we relied on experts’ opinions which are factors that will continue to harm this Ramsar site. The
commonly used in this type of exercise (Burkhard et al., subsequent ecological degradation will cause a significant
2012). The Kendall (W) index was used to evaluate the deviation from the Ramsar convention’s objectives, the
degree of agreement among the expert opinions and indicated preservation of the wetlands’ ecological character of sustainable
that most of the experts agreed in their judgment although management and use.
there was not an absolute agreement. This fact is desired in One of the challenges for improving the effectiveness of the
studies where expert opinion is used for assessment purposes Ramsar Site Network is effective management and reporting
(Vogiatzakis et al., 2016). (Kingsford et al., 2021). This research supports the view
that LULC changes in such important ecosystems could have
Restoration/Management Implications significant effects on ES and can be used for both management
In addition to a quantitative assessment of ES, this study and monitoring purposes. Larnaca salt lake was designated as
provides a methodology to detect spatial variations of ES and a Ramsar site (Ramsar site no. 1081) in 2001 long after the
identify the influence of anthropogenic activities. The abrupt construction of the airport. Its inclusion in the convention made
change brought by the airport’s construction, was followed by very little practical difference in the area’s management until
urban sprawl at the fringes of the study area with changes 2004, when the site was included in the European network of
in agricultural uses, but also abandonment at certain places. protected areas Natura 2000 which entailed legal obligations at
These pressures continue to be reported for the study area the national level. The ratification of a convention like Ramsar
in the national report to the European Commission as part which does not bear a binding legal obligation to the ratifying
of Cyprus’s obligation for the implementation of the Habitats countries often leads to no formal management on the ground
Directive (European Council, 1992). The effects of LULC and what is commonly referred to paper designations (Bonham
on landscape configuration and its link to ES provision in et al., 2008). The consequences as demonstrated by this study
the wetlands mosaic have been explored in some studies could only lead to depletion of the ES provided by such sites at
(Laterra et al., 2012; Varin et al., 2019) pointing to two the national and global level, given their importance for birds’
major processes i.e., simplification vs polarisation of land migration. The results could be considered in the management
uses. With the integration of ES in landscape planning and plans for the salt lake of Larnaca, as well as similar Ramsar sites in
policy (Albert et al., 2014) determining the spatial pattern other Mediterranean areas. Moreover, further study of the ES and
of different land uses provides a link to understand the broad dissemination to the stakeholders and the public could lead
spatial pattern of ES. Setting in place a monitoring scheme to increased support from the society toward the maintenance
over time to evaluate the state of the salt lake area and of the ecosystems.
Frontiers in Ecology and Evolution | www.frontiersin.org 12 June 2021 | Volume 9 | Article 662107Ioannidou et al. Salt Lake Ecosystem Services Shift
DATA AVAILABILITY STATEMENT ACKNOWLEDGMENTS
The original contributions presented in the study are included We would like to thank the Department of Environment, the
in the article/Supplementary Material, further inquiries can be Game and Fauna Service for providing access to the area,
directed to the corresponding author/s. and Anna Pitzi for sharing the data of experts’ opinions.
We are grateful to Jahna Otterbacher for proofreading
the manuscript.
AUTHOR CONTRIBUTIONS
II and IV contributed to the conception and design of the study. SUPPLEMENTARY MATERIAL
II carried out the mapping and fieldwork. PM and VL carried out
the analysis. VL wrote the first draft of the manuscript. PM and IV The Supplementary Material for this article can be found
wrote sections of the manuscript. All authors contributed to the online at: https://www.frontiersin.org/articles/10.3389/fevo.2021.
manuscript revision, read, and approved the submitted version. 662107/full#supplementary-material
REFERENCES development and subsequent post-development soil rehabilitation. Soil Biol.
Biochem. 66, 38–44. doi: 10.1016/j.soilbio.2013.06.022
Abdul Malak, D., Erhard, M., European Environment Agency, Universidad Chiarucci, A., Bacaro, G., and Scheiner, S. M. (2011). Old and new challenges in
de Málaga, and European Topic Centre for Spatial Information and using species diversity for assessing biodiversity. Philosoph. Trans. R. Soc. B Biol.
Analysis (Etc/Sia). (2015). European Ecosystem Assessment: Concept, Data, and Sci. 366, 2426–2437. doi: 10.1098/rstb.2011.0065
Implementation?: Contribution To Target 2 Action 5 Mapping and Assessment of Crossman, N. D., Burkhard, B., Nedkov, S., Willemen, L., Petz, K., Palomo, I., et al.
Ecosystems and Their Services (MAES) of the EU Biodiversity Strategy to 2020. (2013). A blueprint for mapping and modelling ecosystem services. Ecosyst.
Luxembourg: Publications Office. Services 4, 4–14. doi: 10.1016/j.ecoser.2013.02.001
Albert, C., Aronson, J., Fürst, C., and Opdam, P. (2014). Integrating ecosystem Deil, U. (2005). A review on habitats, plant traits and vegetation of ephemeral
services in landscape planning: requirements, approaches, and impacts. Land. wetlandsa global perspective. phyto 35, 533–706. doi: 10.1127/0340-269X/2005/
Ecol. 29, 1277–1285. doi: 10.1007/s10980-014-0085-0 0035-0533
Blomqvist, S., Gunnars, A., and Elmgren, R. (2004). Why the limiting nutrient Dungan, P. J. (ed.) (1990). Wetland Conservation: A Review Of Current Issues And
differs between temperate coastal seas and freshwater lakes: a matter of salt. Required Action. Switzland: IUCN.
Limnol. Oceanog. 49, 2236–2241. doi: 10.4319/lo.2004.49.6.2236 European Council (1992). Council Directive 92/43/EEC of 21 May 1992 on the
Boix, D., Calhoun, A. J. K., Mushet, D. M., Bell, K. P., Fitzsimons, J. A., and Isselin- Conservation Of Natural Habitats And Of Wild Fauna And Flora. Available
Nondedeu, F. (2020). “Conservation of temporary wetlands,” in Encyclopedia of online at: https://eur-lex.europa.eu/LexUriServ/LexUriServ.do?uri=OJ:L:1992:
the World’s Biomes, eds M. I. Goldstein and D. A. DellaSala (Oxford: Elsevier), 206:0007:0050:EN:PDFt (accessed January 31, 2021).
279–294. doi: 10.1016/B978-0-12-409548-9.12003-2 Eycott, A. E., Marzano, M., and Watts, K. (2011). Filling evidence gaps with
Bonham, C. A., Sacayon, E., and Tzi, E. (2008). Protecting imperiled “paper parks”: expert opinion: the use of Delphi analysis in least-cost modelling of functional
potential lessons from the Sierra Chinajá, guatemala. Biodivers Conserv 17, connectivity. Land. Urban Planning 103, 400–409. doi: 10.1016/j.landurbplan.
1581–1593. doi: 10.1007/s10531-008-9368-6 2011.08.014
Boren, J. C., Engle, D. M., Palmer, M. W., Masters, R. E., and Criner, T. (1999). Land Frank, S., Fürst, C., Koschke, L., Witt, A., and Makeschin, F. (2013). Assessment
use change effects on breeding bird community composition. J. Range Manag. of landscape Aestheticsvalidation of a landscape metrics-based assessment by
52, 420. doi: 10.2307/4003767 visual estimation of the scenic beauty. Ecol. Indicators 32, 222–231. doi: 10.1016/
Bortels, L., Chan, J. C.-W., Merken, R., and Koedam, N. (2011). Long-term j.ecolind.2013.03.026
monitoring of wetlands along the western-greek bird migration route using Gedan, K. B., Silliman, B. R., and Bertness, M. D. (2009). Centuries of human-
landsat and ASTER satellite images: amvrakikos gulf (greece). J. Nat. Conservat. driven change in salt marsh ecosystems. Ann. Rev. Mari. Sci. 1, 117–141. doi:
19, 215–223. doi: 10.1016/j.jnc.2011.01.004 10.1146/annurev.marine.010908.163930
Britton, R. H., and Crivelli, A. J. (1993). “Wetlands of southern Europe and Ghosn, D., Vogiatzakis, I. N., Kazakis, G., Dimitriou, E., Moussoulis, E., Maliaka,
North Africa: mediterranean wetlands,” in Wetlands of The World: Inventory, V., et al. (2010). Ecological changes in the highest temporary pond of western
Ecology and Management Volume I: Africa, Australia, Canada and Greenland, Crete (Greece): past, present and future. Hydrobiologia 648, 3–18. doi: 10.1007/
Mediterranean, Mexico, Papua New Guinea, South Asia, Tropical South s10750-010-0143-9
America, United States Handbook of vegetation science, eds D. F. Whigham, D. Gómez-Baggethun, E., Tudor, M., Doroftei, M., Covaliov, S., Năstase, A., Onără,
Dykyjová, and S. Hejný (Dordrecht: Springer), 129–194. doi: 10.1007/978-94- D.-F., et al. (2019). Changes in ecosystem services from wetland loss and
015-8212-4_6 restoration: an ecosystem assessment of the Danube Delta (1960–2010). Ecosyst.
Burkhard, B., Kroll, F., Nedkov, S., and Müller, F. (2012). Mapping ecosystem Services 39:100965. doi: 10.1016/j.ecoser.2019.100965
service supply, demand and budgets. Ecol. Indicat. 21, 17–29. doi: 10.1016/j. Hadjichristophorou, M. (2008). Lead Shot at Larnaca Salt LakeAssessment and
ecolind.2011.06.019 Restoration Activities. Cyprus: DepartmentofFisheriesandMarineResearch.
Calhoun, A. J. K., Mushet, D. M., Bell, K. P., Boix, D., Fitzsimons, J. A., and Hammer, U. T. (1986). Saline Lake Ecosystems of The World. Dordrecht: Junk.
Isselin-Nondedeu, F. (2017). Temporary wetlands: challenges and solutions to Hellicar, M. A., Anastasi, V., Beton, D., and Snape, R. (2014). Important Bird
conserving a ‘disappearing’ ecosystem. Biol. Conservat. 211, 3–11. doi: 10.1016/ Areas of Cyprus. Available online at: https://issuu.com/birdlifecyprus/docs/
j.biocon.2016.11.024 important_bird_areas_of_cyprus_by_b
Central Pollution Control Board (2008). Available online at: https://www. IPCC (2006). IPCC Guidelines for National Greenhouse Gas Inventories. Available
indiawaterportal.org/sites/default/files/iwp2/status_of_water_quality_2008.pdf online at: https://www.ipcc-nggip.iges.or.jp/public/2006gl/ (accessed January
(accessed January 25, 2021). 30, 2021).
Chen, Y., Day, S. D., Wick, A. F., Strahm, B. D., Wiseman, P. E., and Daniels, W. L. IPCC (2013). AR5 Climate Change 2013: The Physical Science Basis. Available
(2013). Changes in soil carbon pools and microbial biomass from urban land online at: https://www.ipcc.ch/report/ar5/wg1/ (accessed April 16, 2020).
Frontiers in Ecology and Evolution | www.frontiersin.org 13 June 2021 | Volume 9 | Article 662107Ioannidou et al. Salt Lake Ecosystem Services Shift
IPCC (2014). AR5 Climate Change 2014: Mitigation of Climate Change. Available tropical forest and non-forest frugivorous birds. Ecol. Appl. 28, 2024–2032.
online at: https://www.ipcc.ch/report/ar5/wg3/ (accessed August 2, 2019). doi: 10.1002/eap.1791
Jellison, R., Zadereev, S. Y., DasSarma, P. A., Melack, M. J., Rosen, R. M., Oren, A., Naftz, D. L., Palacios, P., and Wurtsbaugh, W. A. (2009). Saline lakes
Degermendzhy, G. A., et al. (2004). Conservation and Management Challenges around the world?: unique systems with unique values, 10th ISSLR conference
of Saline Lakes: A Review of Five Experience Briefs. Available online at: http:// and 2008 FRIENDS of great salt lake forum, May 11-16, 2008, University of
worldlakes.org/uploads/Salt%20Lakes%20Thematic%20Paper%2022Jun04.pdf Utah, Salt Lake CIty. Nat. Res. Environ. 15:1.
(accessed January 25, 2021). Papini, R., Valboa, G., Favilli, F., and L’Abate, G. (2011). Influence of land use on
Kingsford, R. T., Bino, G., Finlayson, C. M., Falster, D., Fitzsimons, J. A., Gawlik, organic carbon pool and chemical properties of Vertic Cambisols in central and
D. E., et al. (2021). Ramsar wetlands of international importance–improving southern Italy. Agric. Ecosyst. Environ. 140, 68–79. doi: 10.1016/j.agee.2010.11.
conservation outcomes. Front. Environ. Sci. 9:643367. doi: 10.3389/fenvs.2021. 013
643367 Parcerisas, L., Marull, J., Pino, J., Tello, E., Coll, F., and Basnou, C. (2012). Land
Kroll, F., Müller, F., Haase, D., and Fohrer, N. (2012). Rural–urban gradient analysis use changes, landscape ecology and their socioeconomic driving forces in the
of ecosystem services supply and demand dynamics. Land. Use Policy 29, Spanish Mediterranean coast (El Maresme County, 1850–2005). Environ. Sci.
521–535. doi: 10.1016/j.landusepol.2011.07.008 Policy 23, 120–132. doi: 10.1016/j.envsci.2012.08.002
Lamy, T., Liss, K. N., Gonzalez, A., and Bennett, E. M. (2016). Landscape Peh, K. S.-H., Balmford, A., Bradbury, R. B., Brown, C., Butchart, S. H. M., Hughes,
structure affects the provision of multiple ecosystem services. Environ. Res. Lett. F. M. R., et al. (2013). TESSA: a toolkit for rapid assessment of ecosystem
11:124017. doi: 10.1088/1748-9326/11/12/124017 services at sites of biodiversity conservation importance. Ecosyst. Services 5,
Lang, S., and Tiede, D. (2003). vLATE Extension für ArcGIS – vektorbasiertes 51–57. doi: 10.1016/j.ecoser.2013.06.003
Tool zur quantitativen Landschaftsstrukturanalyse. Available online at: Pitzii, A. (2017). Assessing the Effects Of Habitat Quality and Landscape Structure in
https://uni-salzburg.elsevierpure.com/de/publications/vlate-extension-f%C3% Bird Biodiversity in Cyprus. Available online at: http://kypseli.ouc.ac.cy/handle/
BCr-arcgis-vektorbasiertes-tool-zur-quantitativen (accessed January 31, 2021). 11128/3120 (accessed January 28, 2021).
Laterra, P., Orúe, M. E., and Booman, G. C. (2012). Spatial complexity and Rüdisser, J., Tasser, E., and Tappeiner, U. (2012). Distance to naturea new
ecosystem services in rural landscapes. Agric. Ecosyst. Environ. 154, 56–67. biodiversity relevant environmental indicator set at the landscape level. Ecol.
doi: 10.1016/j.agee.2011.05.013 Indicat. 15, 208–216. doi: 10.1016/j.ecolind.2011.09.027
Legendre, P. (2005). Species associations: the Kendall coefficient of concordance Schmidt, S., and Seppelt, R. (2018). Information content of global ecosystem service
revisited. JABES 10, 226–245. doi: 10.1198/108571105X46642 databases and their suitability for decision advice. Ecosyst. Services 32, 22–40.
Lelieveld, J., Proestos, Y., Hadjinicolaou, P., Tanarhte, M., Tyrlis, E., and Zittis, G. doi: 10.1016/j.ecoser.2018.05.007
(2016). Strongly increasing heat extremes in the Middle East and North Africa Shiklomanov, I. A. (1990). Global water resources. Nat. Resour. 26, 34–43.
(MENA) in the 21st century. Clim. Change 137, 245–260. doi: 10.1007/s10584- Sim, L. L., Davis, J. A., Strehlow, K., McGuire, M., Trayler, K. M., Wild, S.,
016-1665-6 et al. (2013). The influence of changing hydroregime on the invertebrate
Lemoine, N., Bauer, H.-G., Peintinger, M., and Böhning-Gaese, K. (2007). Effects communities of temporary seasonal wetlands. Freshwater Sci. 32, 327–342. doi:
of climate and land-use change on species abundance in a central european bird 10.1899/12-024.1
community. Conservat. Biol. 21, 495–503. doi: 10.1111/j.1523-1739.2006.00633. Smith, P., Haberl, H., Popp, A., Erb, K., Lauk, C., Harper, R., et al. (2013).
x How much land-based greenhouse gas mitigation can be achieved without
Linney, G. N., Henrys, P. A., Blackburn, G. A., Maskell, L. C., and Harrison, compromising food security and environmental goals? Global Change Biol. 19,
P. A. (2020). A visualization platform to analyze contextual links between 2285–2302. doi: 10.1111/gcb.12160
natural capital and ecosystem services. Ecosyst. Services 45:101189. doi: 10.1016/ Soleimani, A., Hosseini, S. M., Massah Bavani, A. R., Jafari, M., and Francaviglia,
j.ecoser.2020.101189 R. (2017). Simulating soil organic carbon stock as affected by land cover change
Litskas, V., Chrysargyris, A., Stavrinides, M., and Tzortzakis, N. (2019). Water- and climate change, Hyrcanian forests (northern Iran). Sci. Total Environ. 59,
energy-food nexus: a case study on medicinal and aromatic plants. J. Cleaner 1646–1657. doi: 10.1016/j.scitotenv.2017.05.077
Produc. 233, 1334–1343. doi: 10.1016/j.jclepro.2019.06.065 Sousa, F. P., Ferreira, T. O., Mendonça, E. S., Romero, R. E., and Oliveira, J. G. B.
Lozano-García, B., Muñoz-Rojas, M., and Parras-Alcántara, L. (2017). Climate and (2012). Carbon and nitrogen in degraded Brazilian semi-arid soils undergoing
land use changes effects on soil organic carbon stocks in a Mediterranean semi- desertification. Agric. Ecosyst. Environ. 148, 11–21. doi: 10.1016/j.agee.2011.11.
natural area. Sci. Total Environ. 579, 1249–1259. doi: 10.1016/j.scitotenv.2016. 009
11.111 Statistical Service (2019). Statistical ServiceAgricultureKey Figures. Available online
Maes, J., Barbosa, A., Baranzelli, C., Zulian, G., Batista e Silva, F., Vandecasteele, at: https://www.mof.gov.cy/mof/cystat/statistics.nsf/agriculture_51main_
I., et al. (2015). More green infrastructure is required to maintain ecosystem en/agriculture_51main_en?OpenForm&sub=1&sel=2 (accessed January 28,
services under current trends in land-use change in Europe. Land. Ecol. 30, 2021).
517–534. doi: 10.1007/s10980-014-0083-2 Stevenson-Holt, C. D., Watts, K., Bellamy, C. C., Nevin, O. T., and Ramsey, A. D.
Malavasi, M., Santoro, R., Cutini, M., Acosta, A. T. R., and Carranza, M. L. (2013). (2014). Defining landscape resistance values in least-cost connectivity models
What has happened to coastal dunes in the last half century? A multitemporal for the invasive grey squirrel: a comparison of approaches using expert-opinion
coastal landscape analysis in Central Italy. Land. Urban Planning 119, 54–63. and habitat suitability modelling. PLoS One 9:e112119. doi: 10.1371/journal.
doi: 10.1016/j.landurbplan.2013.06.012 pone.0112119
Manolaki, P., and Vogiatzakis, I. N. (2017). Ecosystem services in a peri-urban Taelman, S. E., Schaubroeck, T., De Meester, S., Boone, L., and Dewulf, J. (2016).
protected area in Cyprus: a rapid appraisal. Nat. Conservat. 22, 129–146. doi: Accounting for land use in life cycle assessment: the value of NPP as a proxy
10.3897/natureconservation.22.13840 indicator to assess land use impacts on ecosystems. Sci. Total Environ. 550,
Martínez-Fernández, J., Ruiz-Benito, P., and Zavala, M. A. (2015). Recent land 143–156. doi: 10.1016/j.scitotenv.2016.01.055
cover changes in Spain across biogeographical regions and protection levels: Tiner, R. W. (2003). Geographically isolated wetlands of the United States.
implications for conservation policies. Land. Use Policy 44, 62–75. doi: 10.1016/ Wetlands 23, 494–516. doi: 10.1672/0277-5212(2003)023[0494:giwotu]2.0.co;2
j.landusepol.2014.11.021 Tsintides, T. (ed.) (2007). The Red Data Book of The Flora of Cyprus. Lefkosia:
McGarigal, K. (2015). Fragstats Help. Amherst: University of Massachusetts, 182. Cyprus Forestry Association.
Médail, F., and Diadema, K. (2009). Glacial refugia influence plant diversity Vanschoenwinkel, B., Hulsmans, A., Roeck, E. D., Vries, C. D., Seaman, M., and
patterns in the Mediterranean Basin. J. Biogeogr. 36, 1333–1345. doi: 10.1111/j. Brendonck, L. (2009). Community structure in temporary freshwater pools:
1365-2699.2008.02051.x disentangling the effects of habitat size and hydroregime. Freshwater Biol. 54,
Millennium Ecosystem Assessment. (ed.) (2005). Our Human Planet: Summary for 1487–1500. doi: 10.1111/j.1365-2427.2009.02198.x
Decision-Makers. Washington, DC: Island Press. Varin, M., Théau, J., and Fournier, R. A. (2019). Mapping ecosystem services
Morante-Filho, J. C., Arroyo-Rodríguez, V., de Souza Pessoa, M., Cazetta, E., provided by wetlands at multiple spatiotemporal scales: a case study in Quebec,
and Faria, D. (2018). Direct and cascading effects of landscape structure on Canada. J. Environ. Manag. 246, 334–344. doi: 10.1016/j.jenvman.2019.05.115
Frontiers in Ecology and Evolution | www.frontiersin.org 14 June 2021 | Volume 9 | Article 662107You can also read