Pathways to Sustainable Land-Use and Food Systems - 2020 Report of the FABLE Consortium
←
→
Page content transcription
If your browser does not render page correctly, please read the page content below
2020 Report of the FABLE Consortium

 Pathways to
  Sustainable
Land-Use and
Food Systems
Published by International Institute for Applied Systems Analysis (IIASA) and the Sustainable Development
Solutions Network (SDSN) 2020

The full report is available at www.foodandlandusecoalition.org/fable.
For questions please write to info.fable@unsdsn.org

Copyright © IIASA & SDSN 2020

This work is licensed under a Creative Commons Attribution-NonCommercial-NoDerivatives 4.0
International License (CC-BY-NC-ND 4.0; https://creativecommons.org/licenses/by-nc-nd/4.0/).

Disclaimer
The 2020 FABLE Report was written by a group of independent experts acting in their personal capacities.
Any views expressed in this report do not necessarily reflect the views of any government or organization,
agency, or programme of the United Nations (UN). The country chapters use maps prepared solely by the
national teams. The boundaries, colors, denominations, and other information shown on any map in this
work do not imply any judgment on the part of SDSN or IIASA concerning the legal status of any territory or
the endorsement or acceptance of such boundaries.

Recommended citation: Frank F., Sirimarco X., Barral M.P., Martínez P.G., Villarino S. and Monjeau A.
(2020), “Pathways to Sustainable Land-Use and Food Systems in Argentina by 2050” In: FABLE 2020,
Pathways to Sustainable Land-Use and Food Systems, 2020 Report of the FABLE Consortium. Laxenburg
and Paris: International Institute for Applied Systems Analysis (IIASA) and Sustainable Development
Solutions Network (SDSN), pp. 63-93.
https://doi.org/10.22022/ESM/12-2020.16896

Recommended Creative Commons (CC) License:
CC-BY-NC-ND 4.0 (Attribution-NonCommercial-NoDerivatives 4.0 International).

              Design, layout and production by Phoenix Design Aid A/S, a CO2 neutral company
              accredited in the fields of quality (ISO 9001), environment (ISO 14001) and CSR (DS 49001)
              and approved provider of FSC™ certified products. Printed on environmentally friendly
              paper without chlorine and with vegetable-based inks. The printed matter is recyclable.

                                                                                                              2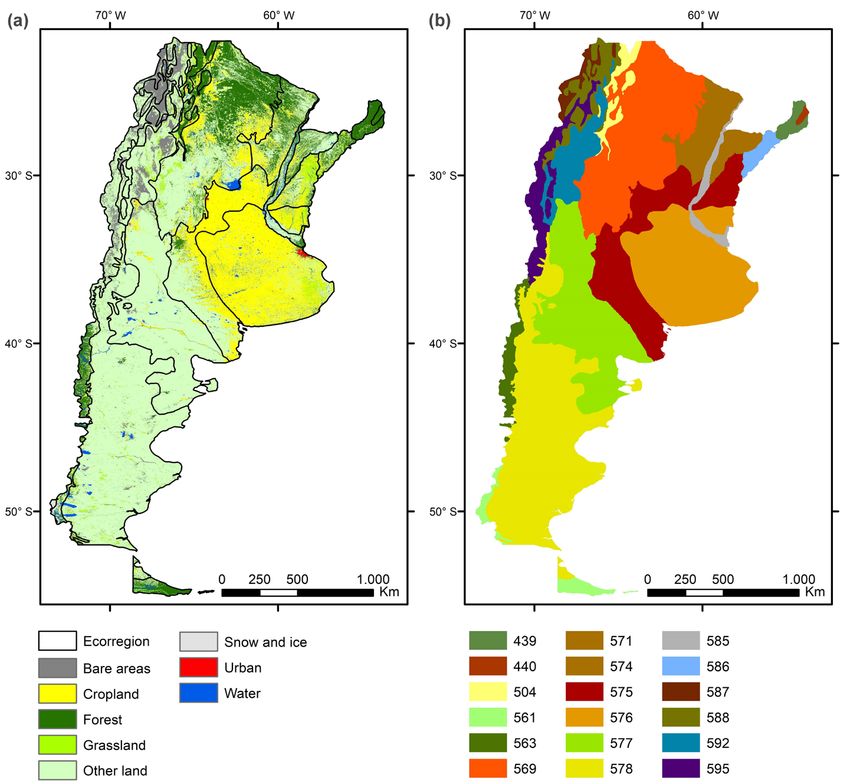
2020 Report of the FABLE Consortium

     Pathways to
      Sustainable
    Land-Use and
  Food Systems in
Argentina by 2050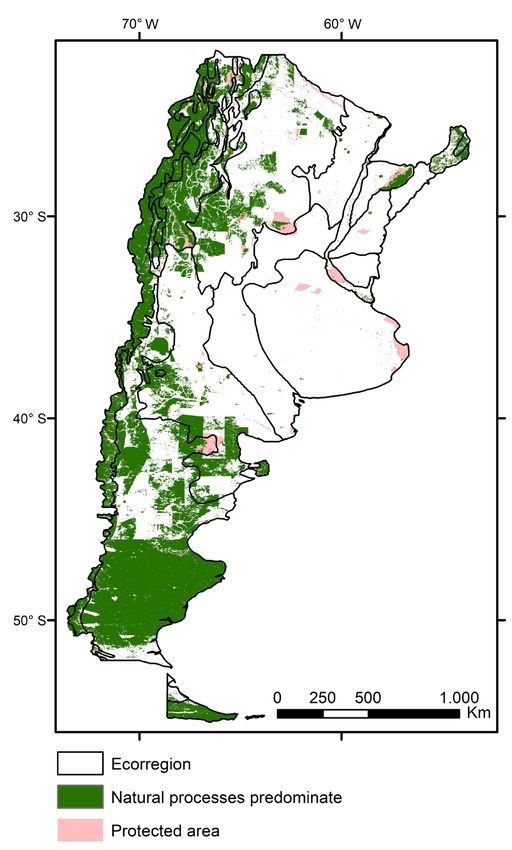
Argentina

Federico Frank1,2*, Ximena Sirimarco3,4, María Paula Barral4,5, Pablo García Martínez6,7,
Sebastián Villarino4,5,7; Adrián Monjeau7,8*
1
 INTA EEA Anguil “Ing. Agr. Guillermo Covas”, La Pampa, Argentina; 2Facultad de Ciencias Exactas y Naturales,
UNLPam, La Pampa, Argentina; 3GEAP, INTA-UNMDP, Argentina; 4Facultad de Ciencias Agrarias, UNMdP, Argentina;
5
  INTA EEA Balcarce, Argentina; 6Centro Atómico Bariloche, Río Negro, Argentina, 7Consejo Nacional de Investigaciones
Científicas y Técnicas, Argentina; 8Fundación Bariloche, Río Negro, Argentina.
*Corresponding authors: frank.federico@inta.gob.ar; amonjeau@gmail.com

This chapter of the 2020 Report of the FABLE Consortium Pathways to Sustainable Land-Use and Food Systems
outlines how sustainable food and land-use systems can contribute to raising climate ambition, aligning climate
mitigation and biodiversity protection policies, and achieving other sustainable development priorities in Argentina.
It presents two pathways for food and land-use systems for the period 2020-2050: Current Trends and Sustainable.
These pathways examine the trade-offs between achieving the FABLE Targets under limited land availability
and constraints to balance supply and demand at national and global levels. We developed these pathways in
consultation with national stakeholders from Instituto Nacional de Tecnología Agropecuaria (INTA), Fundación
Bariloche, Consejo Nacional de Investigaciones Científicas y Técnicas (CONICET), Ministerio de Ambiente y Desarrollo
Sustentable (MAyDS), FUNDAPAZ, Fundación “Nuestros Bosques”, AAPRESID, Fundación Vida Silvestre Argentina,
and others, and modeled them with the FABLE Calculator (Mosnier, Penescu, Thomson, and Perez-Guzman, 2019).
See Annex 1 for more details on the adaptation of the model to the national context.
Argentina

Climate and Biodiversity Strategies and Current Commitments
Countries are expected to renew and revise their climate and biodiversity commitments ahead of the 26th session of
the Conference of the Parties (COP) to the United Nations Framework Convention on Climate Change (UNFCCC) and the
15th COP to the United Nations Convention on Biological Diversity (CBD). Agriculture, land-use, and other dimensions
of the FABLE analysis are key drivers of both greenhouse gas (GHG) emissions and biodiversity loss and offer critical
adaptation opportunities. Similarly, nature-based solutions, such as reforestation and carbon sequestration, can
meet up to a third of the emission reduction needs for the Paris Agreement (Roe et al., 2019). Countries’ biodiversity
and climate strategies under the two Conventions should therefore develop integrated and coherent policies that cut
across these domains, in particular through land-use planning which accounts for spatial heterogeneity.

Table 1 summarizes how Argentina’s Nationally Determined Contribution (NDC), long-term low greenhouse gas emissions
development strategy (LT-LEDS), and Forest Reference Emission Level (FREL) treat the FABLE domains. According to its
NDC, Argentina has committed to reducing its GHG emissions by 18% (unconditional) or 37% (conditional upon receiving
international funding) by 2030 compared to a business-as-usual (BAU) scenario (MAyDS, 2017). Moreover, according to the
latest advances in the ongoing LT-LEDS preparations (INTA, 2020), Argentina is working to develop four targets on GHG
emissions reductions for the agriculture, forestry, and other land use (AFOLU) sector, including “carbon neutral agriculture”.
This process, which should be merged with the ongoing Energy 2050 Long Term Strategy (Climate Transparency, 2019),
includes emission reduction efforts from the AFOLU sector, including afforestation, rehabilitation of deteriorated forests and
other ecosystems, intensification of production, and land sparing. Under its current commitments to the UNFCCC, Argentina
does not mention biodiversity conservation, at least not explicitly (MAyDS, 2017).

Table 1 | Summary of the mitigation target, sectoral coverage, and references to biodiversity and spatially-explicit
planning in current NDC, LT-LEDS, and FREL

                                                      Total GHG Mitigation
                                                                                                                                                       Inclusion of Actionable
                                                                                                            Mitigation Measures

                                                                                                                                                         Maps for Land-Use
                                                                                                                                  Biodiversity (Y/N)
                                                                                                             Related to AFOLU

                                                                                                                                                           Planning1 (Y/N)
                         Baseline                             Mitigation target

                                                                                                                                                                                    FABLE Targets
                                                                                                                                                                                    Links to Other
                                                                                                                                     Mention of
                                                                                                                   (Y/N)
                                      GHG emissions

                                                                                            Sectors
                                      (Mt CO2e/yr)

                                                                                           included
                                                                         Target
                        Year

                                                       Year

 NDC                  2030             570            2030          483 (18% un-      energy, industrial           Y                   N                       N                   Forests
 (2016)                                                              conditional      processes,                                                                                    Water
                                                                   reduction from     agriculture, land-                                                                         Biodiversity
                                                                        BAU)          use change and
                                                                                      forestry, and waste
                                                                      369 (37%
                                                                     conditional
                                                                   reduction from
                                                                        BAU)
 LT-LEDS               2016             136           2050        Four levels for     agriculture, land-           Y                   N                        Y                  Forests
 (2020)            (submission                                   AFOLU sector: 73,    use change and                                                                                Water
                 in preparation)                                   59, 15 and 0       forestry                                                                                      Food
 FREL           Average 2002-           101           2030       Reduction of 27 Mt   land-use change              Y                   N                       N                   Forests
 (2019)        2013 (submission                                    from this sector   and forestry
                   in 2019)                                      (included in NDCs)

 Note. The NDC “Total GHG Mitigation” and “Mitigation Measures Related to AFOLU” columns are adapted from IGES NDC Database (Hattori, 2019).
 Source: Argentina (2016)

1 We follow the United Nations Development Programme definition, “maps that provide information that allowed planners to take action” (Cadena et al., 2019).

                                                                                                                                                                                                     5
Argentina
Table 2 provides an overview of the targets listed in the National Biodiversity Strategies and Action Plan (NBSAP) from
2016, as listed on the CBD website (CBD, 2020), which are related to at least one of the FABLE Targets. In comparison with
the FABLE Targets, the NBSAP targets are less ambitious, but cover a broader range of issues (e.g. education, indigenous
knowledge, marine ecosystems, etc.).
Argentina’s new Biodiversity Strategy and Action Plan (2016-2020) represents a cross-cutting component of the public
agenda and an essential tool for achieving inclusive sustainable development, calling for the involvement of all ministries,
levels of government, institutions, academics and scientists, indigenous peoples, the private sector and civil society
organizations in implementation. It is made up of 9 strategic objectives and 21 priority national targets. The National
Biodiversity Commission (CONADIBIO) will be responsible for coordinating activities and monitoring implementation, and
the actions will be implemented by competent State entities. Environmental protection efforts are increasingly being
assumed by national and provincial entities. In 2012, national spending on biodiversity conservation represented 0.48% of
the GDP, while a growth rate of 350% in such spending was determined for the 2006-2012 period (MAyDS, 2015).
Table 2 | Overview of the latest NBSAP Targets in relation to FABLE Targets
NBSAP Target FABLE Target
(1) BIODIVERSITY: No net loss by 2030 and an
The adequate proportions (of protected areas) will be maintained to fulfil increase of at least 20% by 2050 in the area of
the viability of long-term conservation, buffering, and connectivity among land where natural processes predominate.
protected areas, according to each region’s characteristics and conservation At least 30% of global terrestrial area protected
objectives. by 2030.
(2) BIODIVERSITY: No net loss by 2030 and an
Reaching a minimum protected area of 13% of the national land, setting increase of at least 20% by 2050 in the area of
priorities in relation to the existing percentage of protected areas and their land where natural processes predominate.
connectivity, endemism, and threatened species and ecosystems, and a At least 30% of global terrestrial area protected
minimum of 4% in each ecoregion. While the minimum goal is 13% coverage, by 2030.
the NBSAP refers to 17% coverage (as per CBD Aichi Biodiversity Target 11) as
desirable.
(4) BIODIVERSITY: No net loss by 2030 and an
Augmenting by 20% the current protected wetland areas and integrating them increase of at least 20% by 2050 in the area of
into the public planning system at the local, regional, and national levels. land where natural processes predominate.
At least 30% of global terrestrial area protected
by 2030.
(7) BIODIVERSITY: No net loss by 2030 and an
Fostering sustainable production in regional economies, together with family increase of at least 20% by 2050 in the area of
farming and indigenous populations (...). Incorporation of agroecological land where natural processes predominate
production, integrated livestock production and others, compatible with
sustainable use and conservation of biodiversity and its ecosystem services.
6Argentina
Brief Description of National Pathways
Among possible futures, we present two alternative pathways for reaching sustainable objectives, in line with the
FABLE Targets, for food and land-use systems in Argentina.
Our Current Trends Pathway corresponds to the lower boundary of feasible action, even though it is not a continuation
of ongoing trends (e.g. 2000-2020). It represents a strong decision to improve Argentina’s sustainability without
losing competitiveness or total production or income. It is characterized by high population growth (from 45 million
inhabitants in 2020 to 65 million in 2050), limited constraints on agricultural expansion, a low afforestation target,
high productivity increases in the agricultural sector, no change in diets, and a significant increase in the balance
of trade (both an increase in exports and a decline in imports) (see Annex 2). This corresponds to a future based on
current policy and historical trends that would also see considerable progress with regards to stopping deforestation
(MJyDH, 2007) and reducing post-harvest losses. Moreover, as with all FABLE country teams, we embed this Current
Trends Pathway in a global GHG concentration trajectory that would lead to a radiative forcing level of 6 W/m2 (RCP
6.0), or a global mean warming increase likely between 2°C and 3°C above pre-industrial temperatures, by 2100. Our
model includes the corresponding climate change impacts on yields by 2050 for corn, rice, soybean, wheat, sugarcane,
sunflower, and other minor crops (see Annex 2).
Our Sustainable Pathway represents a future in which further significant efforts are made to adopt sustainable
policies and practices and corresponds to a high boundary of feasible action. Compared to the Current Trends Pathway,
we assume that this future would lead to comparatively lower exports and higher imports of commodities, together
with a significant reduction in food waste, releasing pressure on the environment (see Annex 2). This corresponds to a
future based on no expansion of agricultural areas, increased afforestation (INTA, 2020), and increased irrigation water
efficiency (banning gravitational irrigation, as many provinces have begun to do). With the other FABLE country teams,
we embed this Sustainable Pathway in a global GHG concentration trajectory that would lead to a lower radiative
forcing level of 2.6 W/m2 by 2100 (RCP 2.6), in line with limiting warming to 2°C.
7Argentina
Land and Biodiversity
Current State
In 2016, Argentina was covered by around 15% cropland, 40% grassland and pastures, 12% forest, less than 1%
urban area, and 32% other natural land. Most agricultural area is located in the center-east, while forest can
be mostly found in the north (504-Southern Andean Yunga, 569-Dry Chaco, 586-Southern Cone Mesopotamian
Savanna, 439-Alto Parana Atlantic Forest, and 574-Uruguayan Savanna) and in the southwest (440-Araucaria
Moist Forests, 561-Magellanic Subpolar Forests, and 563-Valdivian Temperate Forests). Other natural lands, such as
grasslands and shrublands (including semi-arid ones) occupy Argentina’s entire western latitude (Map 1). Following
the IUCN’s threats classification scheme, the most important threats to biodiversity are due to changes in land use
for agriculture and livestock (threats 2.11, 2.32, 5.1.2, 7.1.1., 8.1) and fires (9.3.3), where an important displacement
fauna of has occurred. However, the main threat to biodiversity-rich areas, such as protected areas, is the high-level
of tourist activity (threat 1.3).
Map 1 | Land cover in 2010 by aggregated land cover types (a) and ecoregions (b)
Notes. See ecoregion names in Annex 4. Correspondence between original ESACCI land cover classes and aggregated land cover classes displayed on the map
can be found in Annex 3.
Sources. countries - GADM v3.6; ecoregions – Dinerstein et al. (2017); land cover – ESA CCI land cover 2015 (ESA, 2017)
8Argentina
We estimate that land where natural Map 2 | Land where natural processes predominated in 2010,
processes predominate2 accounted for 37.3% protected areas and ecoregions
of Argentina’s terrestrial land area in 2010
(Map 2). The 578-Patagonian steppe (semi-
arid grassland) holds the greatest share of
land where natural processes predominate,
followed by 569-Dry Chaco (temperate forest)
and 577-Low Monte, a semi-arid shrubland
(Annex 4). Across the country, while nearly
23 Mha of land are under formal protection,
falling short of the 30% zero-draft CBD post-
2020 target, only 17.5% of land where natural
processes predominate is formally protected.
This indicates that the area under legal
protection must be expanded to achieve these
goals. The ecoregion areas 439-Alto Paraná
Atlantic Forest, 504-Southern Andean Yungas,
569/571-Chaco forest, 578-Patagonian Steppe,
563-Valdivian, and 561-Magellan Subpolar
forests contain the highest biodiversity and
ecosystem service values. Given that at least
50% of currently protected areas lack effective
protection (MAyDS, 2015), it is critical to
strengthen conservation management, which
should be treated with the same level of
importance as protected area expansion.
Approximately 35% of Argentina’s cropland
was in landscapes with at least 10%
natural vegetation in 2010 (Annex 4). These
relatively biodiversity-friendly croplands are
most widespread in 576-Humid Pampas,
followed by 575-Espinal, 569-Dry Chaco,
Source. countries - GADM v3.6; ecoregions – Dinerstein et al. (2017); protected
and 571-Humid Chaco. However, most of the areas – UNEP-WCMC and IUCN (2020); natural processes predominate comprises key
area in 576-Humid Pampas is either cropland biodiversity areas – BirdLife International (2019), intact forest landscapes in 2016 –
Potapov et al. (2016), and low impact areas – Jacobson et al. (2019)
or pastures, while in 575-Espinal, 569-Dry
Chaco, and 571-Humid Chaco it is a matrix of
natural vegetation that has been colonized by
cultivation. In the Monte, Patagonian Steppe,
and the Andean regions, the percentage of
cultivation is low due to unfavorable climate
and soil conditions.
2 We follow Jacobson, Riggio, Tait, and Baillie (2019) definition: “Landscapes that currently have low human density and impacts and are not primarily
managed for human needs. These are areas where natural processes predominate, but are not necessarily places with intact natural vegetation, ecosystem
processes or faunal assemblages”.
9Argentina
Pathways and Results
Projected land use in the Current Figure 1 | Evolution of area by land cover type and protected
Trends Pathway is based on several areas under each pathway
assumptions, including the prevention
of deforestation by 2030, 2 Mha of
afforestation by 2050, and maintaining
protected areas at 23 Mha, representing
8.4% of total land cover (see Annex 2). 200
Current Trends
By 2030, we estimate that the main
changes in land cover in the Current
100
Trends Pathway will result from an
increase in pasture and cropland area Land Surface (Mha)
and a decrease in the area of other land,
Urban
a trend that stabilizes by 2050 (Figure 0 Cropland
1). The expansion of the planted area for Pasture
Other Land
soybean, corn, and groundnut explain New Forest
almost 80% of total cropland expansion Forest
200
between 2010 and 2030. Soybean
Sustainable
expansion is explained by an increase
in exports (international demand for
feed) and high revenues, while corn and 100
groundnut expansion are due mainly to
an increase of internal feed consumption
and exports and an increase of internal
0
demand for nonfood consumption,
2000 2010 2020 2030 2040 2050
respectively. Pasture expansion is
mainly driven by the increase in internal
demand for beef and milk consumption,
while livestock productivity per head
also increases and ruminant density per Source: Authors’ computation based on FAOSTAT (FAO, 2020) for the area by land cover
hectare of pasture remains constant type for 2000.
over the period 2020-2030. Between
2030-2050, the stabilization of land
use classes is explained by limiting
deforestation and meeting Argentina’s
export targets (without further
intensification). This is a promising result
for this less ambitious pathway, even if
these changes initially result in a decline
in the area where natural processes
predominate, falling to approximately
34% of total land by 2030, and only
increase in later years, reaching a little
over 37% by 2050 (Figure 2).
10Argentina
In the Sustainable Pathway, Figure 2 | Evolution of the area where natural processes predominate
assumptions on agricultural land
expansion and reforestation have
been changed to reflect ongoing
discussions and projections made 110
by stakeholders during the Strategic
Partnerships for the Implementation 39
of the Paris Agreement (SPIPA) 105
% of Total Land
Project (INTA, 2020). The main
Surface (Mha)
assumptions include constraints on
100
the expansion of agricultural land 36
beyond its current extent, and 4 Mha
of reforestation or afforestation by 95
2030 (see Annex 2).
Compared to the Current Trends 90 33
Pathway, we observe the following
changes regarding the evolution
of land cover in Argentina in the 85
Sustainable Pathway: (i) a decline in 2010 2015 2020 2025 2030 2035 2040 2045 2050
cultivated area and the stabilization Current Trends Sustainable
of pasture area, (ii) a moderate
increase in forests and new forests
areas, (iii) an increase in other lands
(due to the decrease in cropland
area). In addition to the changes
in assumptions regarding land-use
planning, these changes compared
to the Current Trends Pathway
are explained by an increase in
productivity, a decrease in food loss,
and more balanced international trade
for foodstuffs (all of which relieve
pressure on land). This leads to a 10%
increase in the area where natural
processes predominate between 2020
and 2050.
11Argentina
GHG emissions from AFOLU
Current State
Direct GHG emissions from Figure 3 | Historical share of GHG emissions from Agriculture, Forestry, and
Agriculture, Forestry, and Other Other Land Use (AFOLU) to total AFOLU emissions and removals by source
Land Use (AFOLU) accounted for in 2012
48.9% of total emissions in 2012
(Figure 3). The principle source of 210MtCO2e
AFOLU emissions is agricultural Source of AFOLU
IPPU
69MtCO2e Emissions
soils, followed by land conversion, 3.6%
Agricultural Soils
and enteric fermentation. This can Enteric Fermentation
Energy AFOLU 47MtCO2e
be explained both by the historical 429MtCO2e Other (Agriculture)
42.7% 48.9%
importance of agriculture and CO2 Emissions and
Removals from Soil
animal husbandry in Argentina’s Forest and Grassland
Waste 61MtCO2e
economy and deforestation, with Conversion
4.8%
over 600 kha deforested in 2012
(Gómez Lende, 2018). Currently,
deforestation for agricultural
purposes is prohibited, although Note. IPPU = Industrial Processes and Product Use
Source. Adapted from GHG National Inventory (UNFCCC, 2020)
illegal deforestation remains an
issue.
Pathways and Results Figure 4 | Projected AFOLU emissions and removals between 2010 and
2050 by main sources and sinks for the Current Trends Pathway
Under the Current Trends Pathway,
annual GHG emissions from AFOLU
decrease to 96 Mt CO2e/yr in 2030,
GHG Emissions (MtCO2e)
200
before reaching 19 Mt CO2e/yr in
2050 (Figure 4). In 2050, livestock
is the largest source of emissions
(57 Mt CO2e/yr) while land-use 100
change (afforestation) acts as a sink Difference in Net Emissions compared
with Current Trends in 2050
(-64 Mt CO2e/yr). Over the period
2020-2050, the strongest relative
0 Sustainable
increases in GHG emissions are for − 60MtCO2e
crops (70%), while emissions from
livestock increased around 7%.
2010 2015 2020 2025 2030 2035 2040 2045 2050
There is a strong relative increase in
GHG sequestration, which reduces Land Use Crops Livestock Biofuels
Argentina’s total emissions by Net AFOLU Emissions: Current Trends Sustainable
around 33%.
12Argentina
In comparison, the Sustainable Pathway leads to a Figure 5 | Cumulated GHG emissions reduction
reduction of AFOLU GHG emissions by 70% by 2050 computed over 2020–2050 by AFOLU GHG
compared to the Current Trends Pathway (Figure 4). The emissions and sequestration source compared to
potential emissions reductions under the Sustainable the Current Trends Pathway
Pathway are achieved by a reduction in GHG emissions
from crops (due to the comparative reduction in Sustainable
total crop area) and a noticeable increase in carbon −600
Absolute Change in CO2 Removals and Emissions (MtCO2e)
sequestration due to land use changes (no deforestation −550
and increased afforestation), while there are less
−500
significant changes regarding emissions from livestock
(Figure 5). −450
−400
AFOLU GHG
Compared to Argentina’s commitments under the Sources and
−350
UNFCCC (Table 1), our results show that AFOLU could Sinks
contribute to as much as 33% of its total conditional −300 Crops
Deforestation
objective for GHG emissions reduction by 2030. Such −250 Livestock
Other Land Use
reductions could be achieved through the following Sequestration (Sink)
−200
policy measures: halting all deforestation, promoting GHG Biofuels (Sink)
afforestation, and enhancing productivity in order −150
to spare natural lands. These measures could be −100
particularly important when considering options for
−50
long-term strategies for reducing GHG emissions.
Regarding the ongoing LT-LEDS preparation process, 0
the Sustainable Pathway results point to how Argentina
could fulfill its less ambitious goal of “less than 2°C”,
although they would still fall short a “carbon neutral
agriculture” goal.
13Argentina
Food Security
Current State
The “Triple Burden” of Malnutrition
Micronutrient Overweight/
Undernutrition Deficiency Obesity
4.6% of the population 18.6% of women of reproductive age suffered 22.5% of adults and 9.9% of
was undernourished in from anemia in 2016, which can lead to children were obese in 2005. The
2016-2018. This share has maternal death (FAO, 2017). share of adult obesity has since
increased since 2015, when increased linearly and reached
the share stood at around 28.5% in 2016 (FAO, 2017).
3.3%. 14.3% of children are deficient in vitamin A,
which can notably lead to blindness and child
mortality, and most children and pregnant
In 2005, 8.2% of children
women from northern provinces are deficient
under 5 were stunted and
in iodine, which can lead to developmental
1.2% were wasted (FAO,
abnormalities (Disalvo et al., 2019).
2017).
Disease Burden due to Dietary Risks
Each year, 203 deaths per 100,000 population are attributable to dietary risks (Afshin et al., 2019).
10% of the adult population suffers from diabetes and 24% of all deaths in 2012 were caused by cardiovascular diseases,
both closely related to dietary risks (INDEC & MINSAL, 2013).
14Argentina
Table 3 | Daily average fats, proteins and kilocalories intake under the Current Trends and Sustainable pathways in
2030 and 2050
2010 2030 2050
Historical Diet (FAO) Current Trends Sustainable Current Trends Sustainable
Kilocalories 2,921 2,903 2,875 2,905 2,898
(MDER) (2,051) (2,070) (2,070) (2,070) (2,070)
Fats (g) 108 108 106 108 107
(recommended range (65-97) (65-97) (64-96) (65-97) (64-97)
Proteins (g) 93 93 91 93 92
(recommended range (73-256) (73-254) (72-252) (73-254) (72-252)
Notes. Minimum Dietary Energy Requirement (MDER) is computed as a weighted average of energy requirement by sex, age class, and activity level (U.S.
Department of Health and Human Services and U.S. Department of Agriculture, 2015) and the population projections by sex and age class (UN DESA, 2017) following
the FAO methodology (Wanner et al., 2014). For fats, the dietary reference intake is 20% to 30% of kilocalories consumption. For proteins, the dietary reference intake
is 10% to 35% of kilocalorie consumption. The recommended range in grams has been computed using 9 kcal/g of fats and 4kcal/g of proteins.
Pathways and Results
Under the Current Trends Pathway, compared to the average Minimum Dietary Energy Requirement (MDER) at the
national level, our computed average calorie intake is 40% higher in 2030 and 2050 (Table 3). The current average
intake is mostly satisfied by cereals, sugar, red meat, and milk, while animal products represent 31% of the total calorie
intake. We assume that the consumption of animal products and in particular red meat will remain constant between
2020 and 2050. The same assumption stands for eggs, poultry, cereals, sugar, and oils consumption. Compared to
the average EAT-Lancet recommendations (Willett et al., 2019), red meat, sugar, eggs, poultry and cereals are over-
consumed (Figure 6).
Under the Sustainable Pathway, we assume that diets will remain similar to those under the Current Trends Pathway,
as we have primarily prioritized discussing environmental concerns with stakeholders. Although this assumption may
not be internally consistent with the rest of the Sustainable Pathway storyline, we will be reaching out to national
stakeholders and experts regarding these issues in the future stages of our analyses.
15Argentina
Current Trends Current Trends
2050 2050
Figure 6 | Comparison of the computed daily average kilocalories intake per capita per food category across pathways
in 2050 with the EAT-Lancet recommendations
Current Trends 2050 Sustainable 2050
Current Trends
Sustainable Sustainable
2050
2050 2050
FAO 2015
Max. Recommended Min. Recommended
Cereals Poultry
Sustainable
FAO FAO Eggs Pulses
Fruits and Veg Red Meat
2050
2015 2015 Milk Roots
Nuts Sugar
Veg. Oils and Oilseeds
Max.Notes.
Recommended Min.
These figures are computed using Recommended
the relative Max.
distances Recommended
to the minimum Min.
and maximum recommended Recommended
levels (i.e. the rings), therefore, different
kilocalorie consumption levels correspond to each circle depending on the food group. The EAT-Lancet Commission does not provide minimum and maximum
recommended values for cereals: when the kcal intake is lower than the average recommendation it is displayed on the minimum ring and if it is higher it is
Cereals
� FAO � Poultry� Cereals
these food categories is significantly higher than the maximum recommended. � Poultry
displayed on the maximum ring. The discontinuous lines that appear at the outer edge of sugar and red meat indicate that the average kilocalorie consumption of
Eggs
� 2015 � Pulses� Eggs � Pulses
� Fruits and Veg � � Fruits and Veg
Red Meat � Red Meat
� Milk � Roots � Milk � Roots
� Nuts � Sugar� Nuts � Sugar
� Veg. Oils and Oilseeds � Veg. Oils and Oilseeds
Max. Recommended Min. Recommended
� Cereals � Poultry
� Eggs � Pulses
� Fruits and Veg � Red Meat
� Milk � Roots
� Nuts � Sugar
� Veg. Oils and Oilseeds
16Argentina
Water
Current State Figure 7 | Water withdrawals by sector in 2011
Municipal
Due to its size, its predominantly latitudinal extension (3,780 15%
km, from 21° 46’ 52” S to 55° 03’ 21” S) and an altitude
variation of almost 8,000 meters, Argentina contains a
Industrial
wide range of climate types. Summers are the warmest 11%
and wettest season in most of the country except in most
of Patagonia, where it is the driest. Winters are normally 37780 Mm3/yr
mild in the north, cool in the center and cold in the south,
which experiences frequent frost and snow. In general,
the north is characterized by hot, humid, rainy summers
and mild winters with periodic droughts. Mesopotamia, in Agriculture
the northeast, is characterized by high temperatures and 74%
abundant precipitation throughout the year, with droughts
being uncommon. West of this lies the Chaco region, where
precipitation decreases, resulting in the vegetation changing Source. Adapted from AQUSTAT Database (FAO, 2017).
from forests in the east to shrubs in the west. Northwest
Argentina is predominantly dry and hot although the Figure 8 | Evolution of blue water footprint in the
rugged topography makes it climatically diverse, ranging Current Trends and Sustainable Pathways
from the cold, dry Puna to thick jungles. The center of the
country, which includes the Pampas to the east and the drier 7000
Cuyo region to the west has hot summers with frequent
Blue Water Footprint (Mm3)
tornadoes and thunderstorms, and cool, dry winters.
Patagonia, in the south, has a dry climate with warm 6000
summers and cold winters, strong winds throughout the
year and one of the strongest precipitation gradients in the
world. In terms of water withdrawals, agriculture is the main 5000
source, accounting for 74% in 2011 (FAO, 2020), with most
of it occuring in the central part of the country. Moreover,
from the 40 Mha suitable for crop and cattle production, only 4000
2.4 Mha are irrigated, most of them through gravitational
2000 2005 2010 2015 2020 2025 2030 2035 2040 2045 2050
irrigation (MAGyP, 2020) .
Current Trends Sustainable
Pathways and Results
Under the Current Trends Pathway, annual blue water use increases between 2000-2015 (3,793 Mm3/yr and 4,819
Mm3/yr), before reaching 6,027 Mm3/yr and 7,248 Mm3/yr in 2030 and 2050, respectively (Figure 8), with sugarcane,
rice, and grape representing respectively 14.6%, 13.8% and 12.3% of computed blue water use for agriculture by
20503. In contrast, under the Sustainable Pathway, blue water footprint in agriculture reaches 5,366 Mm3/yr in 2030
and 5,832 Mm3/yr in 2050, respectively. This improvement is explained by changes in the crop composition of the
harvested area (i.e. each crop has a different water consumption coefficient) and climate change impacts.
3 We compute the blue water footprint as the average blue fraction per tonne of product times the total production of this product. The blue water fraction
per tonne comes from Mekonnen and Hoekstra (2010a, 2010b, 2011). In this study, it can only change over time because of climate change. Constraints on
water availability are not taken into account.
17Argentina
Resilience of the Food and Land-Use System
The COVID-19 crisis has exposed the fragility of food and land-use systems by bringing to the fore vulnerabilities in
international supply chains and national production systems. Here we examine two indicators to gauge Argentina
resilience to agricultural-trade and supply disruptions across pathways: the rate of self-sufficiency and diversity of
production and trade. Together they highlight the gaps between national production and demand and the degree to
which we rely on a narrow range of goods for our crop production system and trade.
Self-Sufficiency
Argentina has long been self-sufficient in food production, with an estimated 40% of total of food produced exported
annually. For example, the exported value of food products of 2010 was around 80 billion USD (MINAGRO, 2016).
Under the Current Trends Pathway, we project that Argentina would be self-sufficient in virtually all product groups
in 2050, with self-sufficiency by product group slightly increasing for the majority of products from 2010 – 2050
(Figure 9). The product groups where the country depends the most on imports to satisfy internal consumption are
nuts, for which no noticeable changes are observed between 2010 and 2050. In the Sustainable Pathway we project
that Argentina would still remain self-sufficient, but that these levels would decrease between 2010 and 2050 for
most products. Nevertheless, no additional groups fall below the level of self-sufficiency due to lower production or
increased consumption.
Figure 9 | Self-sufficiency per product group in 2010 and 2050
Beverages, 2010 Note. In this figure, self-
Current Trends
Spices & Tobacco Sustainable sufficiency is expressed as
2010 the ratio of total internal
Cereals Current Trends
Sustainable production over total internal
2010 demand. A country is self-
Eggs Current Trends
Sustainable sufficient in a product when
Fruits 2010 the ratio is equal to 1, a net
Current Trends
& Veg. Sustainable exporter when higher than 1,
2010
Milk & Dairy Current Trends and a net importer when lower
Sustainable
than 1. The discontinuous lines
2010
Nuts Current Trends on the right side of this figure,
Sustainable
2010
as appear for cereals and
Oilseeds Current Trends
& Veg. Oils Sustainable
oilseeds and vegetable oils,
2010 indicate a high level of self-
Poultry Current Trends sufficiency in these categories.
Sustainable
2010
Pulses Current Trends
Sustainable
Beef, Goat 2010
Current Trends
& Lamb Sustainable
Roots & 2010
Current Trends
Tubers Sustainable
Sugar & 2010
Current Trends
Sugar Crops Sustainable
0.0 0.2 0.4 0.6 0.8 1.0 1.2 1.4 1.6 1.8 2.0
Self−Sufficiency Ratio
18Argentina
Diversity
The Herfindahl-Hirschman Index (HHI) measures the degree of market competition using the number of firms and the
market shares of each firm in a given market. We apply this index to measure the diversity/concentration of:
Cultivated area: where concentration refers to cultivated area that is dominated by a few crops covering large
shares of the total cultivated area, and diversity refers to cultivated area that is characterized by many crops
with equivalent shares of the total cultivated area.
E
xports and imports: where concentration refers to a situation in which a few commodities represent a large
share of total exported and imported quantities, and diversity refers to a situation in which many commodities
account for significant shares of total exported and imported quantities.
We use the same thresholds as defined by the U.S. Department of Justice and Federal Trade Commission (2010, section
5.3): diverse under 1,500, moderate concentration between 1,500 and 2,500, and high concentration above 2,500.
In 2010, Argentina’s imports and exports of food products were diverse. The values of the HHI Index were 818 for
the export and 226 for the import market (calculated from trade values of main products for that year according to
Hausmann et al., 2011). These values were obtained from official import and export records, which differ compared to
our calculations (HHI values of 2,056 and 3,818, respectively). In addition, we found a HHI Index of 3,366 for the planted
crop area in 2010, which is not at all diverse. This is unsurprising given that 60% of the crop area is planted with
soybean and more than 95% of cultivated area is covered by only seven crops (MAGyP, 2020).
Under the Current Trends Pathway, we project a mild increase in the concentration of crop exports and a decrease in
that of imports over the period 2010 to 2050. The difference in the 2010 values found in the literature and our results is
due to the number and categories of food products considered and should be checked more carefully in future reports.
Regarding the concentration in the range of crops planted between 2010 and 2050, the trend shows a marked increase
in the HHI index. This indicates lower levels of diversity across the national production system. In contrast, under the
Sustainable Pathway, we project a comparatively lower concentration of crop exports, fairly stable during the whole
period, but a relatively higher concentration of imports towards 2050 (Figure 10). This is explained by a less ambitious
export target and a higher dependency on imports in this pathway, and the fact that only two or three of the most
relevant products are used to implement import-export scenarios.
Figure 10 | Evolution of Cultivated Area Exports Imports
the diversification of 10000
the cropland area, crop
imports, and crop exports
7500
using the Herfindahl-
Hirschman Index (HHI)
HHI
5000
2500
0
2000 2010 2020 2030 2040 2050 2000 2010 2020 2030 2040 2050 2000 2010 2020 2030 2040 2050
Concentrated Moderately Concentrated Unconcentrated
Current Trends Sustainable
19Argentina
Discussion and Recommendations
The pathways presented in this chapter can be production, minimize emissions from agriculture
summarized as “compromises between development (including transport logistics), and expand the area
and environmental objectives”, with each slightly of biodiversity protection, biomass carbon stocks and
leaning in favor of one or the other. In both, land-use water retention. Our ongoing Nature Map prioritization
changes by 2050 are moderate. In both pathways, studies (Annex 5) show that expanding protected
greenhouse gas emissions increase at first, disappear areas to 30% could conserve more than 75% carbon
from deforestation after 2030 and reach levels similar in biomass, almost 90% of endemic species, and
to those in 2000 by midcentury. Moreover, emissions more than 81% of pure water sources. However, if this
from crops, livestock, and land-use change would expansion were to take place without considering crop
account for only 2.5% of the targeted 4 Gt CO2e from distribution, around 12% of crop-producing areas would
crops and livestock and negative and zero from land use be lost. This tradeoff would lead to production losses
changes by 2050, which all FABLE country teams aim of around 7.6 Mt/year, provided crops are not relocated
to achieve collectively. Finally, under these pathways, and yields remain at their 2017 and 2018 levels (Table 4).
Argentina would achieve zero net deforestation by However, these results were obtained without applying
2030, which also contributes to the zero-net -emissions constraints to the expansion of protected areas within
target from land-use change. the most productive zones. Preliminary results from the
Nature Map Argentina indicate that this overlap could
To achieve these climate goals, it is necessary to halt be strongly reduced without significantly affecting the
the expansion of the current crop area (which should, in fulfillment of conservation targets.
fact, decrease slightly), increase productivity, diversify
Table 4 | Production loss of main crops due to protecting 30% of key natural areas as compared to 2017 and 2018
Production Loss Production value in 2017/2018 Percentage of loss
(t/year) (t/year) (%)
Rice 173,801 1,367,968 12.7%
Oat 12,243 491,713 2.5%
Barley 52,624 3,741,158 1.4%
Rye 2,033 86,098 2.4%
Sunflower 180,647 3,537,545 5.1%
Corn 2,952,293 43,462,323 6.8%
Peanut 57,849 921,231 6.3%
Soybean 2,434,654 37,787,927 6.4%
Sorghum 177,768 1,563,445 11.4%
Wheat 796,096 18,518,045 4.3%
Sugarcane 796,095 17,760,997 4.3%
Total 7,636,101 129,238,450 6.1%
20Argentina
Regarding the principal trade-offs between competing indicator to address this problem, such as, for example,
uses of land, we found no significant compromises one that “corrects” the food supply by its unequal
between conservation goals and food provision. distribution.
Similarly, there are no visible trade-offs in terms of
food security as Argentina can easily cover the dietary To overcome these limitations, our next steps
requirements of its population (Feeney & MacClay, include integrating the Nature Map and the FABLE
2016). In other words, there are no biophysical limits to tools to prioritize areas for conservation and food
produce healthy food in a sustainable way. Rather, the production. We are working on the construction of an
main trade-off would be between sustainability and Environmental Territorial Planning Map of Argentina
an export policy that primarily sells a single commodity using Nature Map and the FABLE Calculator with the
(e.g. soybean and its byproducts) to very few importing Ministry of Environment and Sustainable Development,
countries. which will directly inform the implementation of
sustainable policies. In parallel, we will continue the
This relates to the important issue of “spillover effects”, participation in the ongoing Strategic Partnerships for
understood here as the effects of the decisions taken the Implementation of the Paris Agreement (SPIPA)
in one country on other countries, which needs further Project, which aims at the development of Argentina’s
attention. For example, the positive (i.e. income and LT-LEDS for reducing GHG emissions by 2050. To this
job creation) and negative effects (i.e. deforestation, end, we also intend to include mitigation measures in
pollution, GHG emissions, population displacement, our modeling.
and biodiversity loss) of China´s and the European
Union’s imports from Argentina (Hoff et al., 2019).
When richer countries buy food abroad for their internal
consumption to make progress towards achieving the
SDGs and spare land within their own territories, this
creates spillover effects on producing countries.
In regard to the key limitations of this analysis, the
FABLE Calculator currently has its limits as a tool
for territorial environmental planning given that it is
not spatially explicit, as it is not currently possible to
define priority areas. With Nature Map Argentina we
are moving to bridge this gap. Similarly, we have not
yet explicitly considered the supply of food from small
and medium producers of fruits and vegetables in our
pathways. Family farming and agroecology, as well
as small peri-urban vegetable crops, are important
contributors to Argentina’s food security. Therefore,
these aspects will be particularly important to explore in
the future given that the Ministry of the Environment
and Sustainable Development of Argentina now lists
reducing the prevalence of monocultures and increasing
agroecological production among its highest priorities.
Finally, food distribution is not properly accounted for
in this assessment. Our results show a plentiful supply
of food, which means that hunger is the results of its
unequal distribution. This raises the need for a specific
21Argentina
Annex 1. List of changes made to the model to adapt it to the national context
No significant changes have been made to the Argentinian FABLE Calculator. However, in order to comply with
Argentina’s method for measuring national GHG emissions, we added a method that allowed us to estimate emissions
in line national calculations (results not showed in this report). The only substantial differences between these
calculations relates to forests (the Argentinian NDCs consider forests as net emitters of GHG). In addition, in certain
cases we replaced the default FAO data when more accurate or more recent data were available. Finally, we modified
the Bonn Challenge scenario to account for stakeholder input; an increase from 1 Mha to 2 Mha in Current Trends
Pathway and an additional scenario targeting 4 Mha in the Sustainable Pathway.
22Argentina
Annex 2. Underlying assumptions and justification for each pathway in the
FABLE Calculator
POPULATION Population projection (million inhabitants)
Current Trends Pathway Sustainable Pathway
Population is expected to increase by 33% between 2015 and 2050 from 43 million inhabitants to 57 million. Based on combined extrapolations from INDEC (2019) and
Baumann Fonay & Cohan (2018). (SSP3 scenario selected)
LAND Constraints on agricultural expansion
Current Trends Pathway Sustainable Pathway
We assume that deforestation will be halted beyond 2030. We made our choice We assume no productive land expansion beyond 2010. We made our choice
based on the existence of a new law that establishes forest protection (MJyDH, based on the preferences declared by most stakeholders during the meetings for
2007). (NoDefor 2030 scenario selected) the SPIPA Project (INTA, 2020). (NoExpansion scenario selected)
LAND Afforestation or reforestation target (Mha)
We assume new afforested area to reach 2 Mha by 2050, based on a more We assume new afforested area will reach 4 Mha by 2050, based on the
ambitious target than the Bonn Challenge commitment. Argentina’s national preferences declared by some of the stakeholders during the meetings for the
commitment is to restore 1 Mha by 2030 SPIPA Project (INTA, 2020).
(Bonn Challenge, 2019).
BIODIVERSITY Protected areas (1000 ha or % of total land)
Current Trends Pathway Sustainable Pathway
We used the by-default assumption in the FABLE Calculator which is that in the ecoregions where current level of protection is between 5% and 17%, the natural land
area under protection increases up to 17% of the ecoregion total natural land area by 2050.
23Argentina
PRODUCTION Crop productivity for the key crops in the country (in t/ha)
Current Trends Pathway Sustainable Pathway
We assume that between 2015 and 2050 crop productivity increases:
• from 8 t/ha to 21 t/ha for corn
• from 3 t/ha to 5.6 t/ha for soybean
• from 3.7 t/ha to 10.4 t/ha for wheat
These assumptions are based on estimated yield gaps in Argentina, which stand at 100% for corn, 140% for wheat, and 130% for soybean (Global Yield Gap Atlas, 2019).
Although we assumed productivity to be the same across pathways, some minor differences could appear due to the two different climate change scenarios.
PRODUCTION Livestock productivity for the key livestock products in the country (in kg/TLU)
We assume that between 2015 and 2050, productivity increases:
• from 76 kg/TLU to 90 kg/TLU for beef
• from 5.9 t/TLU to 6.9 t/TLU for cow milk
The estimated yield gap in Argentina is 54% for cow-calf and 60% for finishing (Rearte, 2010).
PRODUCTION Pasture stocking rate (in number of animal heads or animal units/ha pasture)
The average livestock stocking density remains constant at 0.32 TLU/ha of pastureland between 2015 and 2050. This is a conservative assumption. (Rearte, 2010)
estimates that it could increase by 15-20% with better management of forage resources only, but increasing stocking rate elevates the number of heads, thus elevating
GHG emissions, and that is an issue among stakeholders (INTA, 2020).
PRODUCTION Post-harvest losses
Argentina wastes 16 Mt/year of food (Roulet, N, 2018, unpublished data). In order to release pressure on land and resources, loses were reduced by half. Based on
discussions with stakeholders during the SPIPA Project (INTA, 2020).
TRADE Share of consumption which is imported for key imported products (%)
Current Trends Pathway Sustainable Pathway
The share of total consumption which is imported decreases: The share of total consumption which is imported increases:
• from 72% in 2010 to 36% in 2050 for bananas. • from 72% in 2010 to 100% in 2050 for bananas.
The share of total consumption which is imported remains constant at 2010 level The share of total consumption which is imported remains constant at 2010 level
for the other products. for the other products.
TRADE Evolution of exports for key exported products (Mt)
The exported quantity increases: The exported quantity increases:
• from 17 Mt in 2010 to 71 Mt in 2050 for corn • from 17 Mt in 2010 to 36 Mt in 2050 for corn
• from 13 Mt in 2010 to 54 Mt in 2050 for soybean • from 13 Mt in 2010 to 27 Mt in 2050 for soybean
• from 5 Mt in 2010 to 20 Mt in 2050 for soy oil • from 5 Mt in 2010 to 10 Mt in 2050 for soy oil
• from 0.16 Mt in 2010 to 0.48 Mt in 2050 for milk • from 0.16 Mt in 2010 to 0.32 Mt in 2050 for milk
The exported quantity remains constant at 2010 level for the other commodities. The exported quantity remains constant at 2010 level for the other commodities.
24Argentina
FOOD Average dietary composition (daily kcal per commodity group or % of intake per commodity group)
Current Trends Pathway Sustainable Pathway
By 2030, the average daily calorie consumption per capita is 2,900 kcal and comes mainly from cereals, sugar and red meat, with animal products representing 32% of
the total calorie intake. We assume no significant dietary changes in either pathway between 2020 and 2050, except that we assume the consumption of eggs and
poultry will increase while cereals, sugar, and oils consumption will decrease. For this analysis, we prioritized the discussion of environmental concerns rather than food
security issues (in part due to Argentina’s “overproduction” of food – this points to the importance of food distribution, which is not yet considered in the modelling
efforts). In the following stages, we will be contacting expert and stakeholder groups regarding these issues.
FOOD Share of food consumption which is wasted at household level (%)
Between 2015 and 2050, the share of final household consumption which is Argentina wastes 16 Mt/year of food (Roulet, N, 2018, unpublished data). In order
wasted remains stable at 10%. to account for feasible improvements, we selected the scenario Reduced, in which
household food consumption is reduced by half by 2050.
BIOFUELS Targets on biofuel and/or other bioenergy use (Mt)
Current Trends Pathway Sustainable Pathway
Both in the Current Trends and Sustainable pathways, the OECD_AGLINK Scenario was assumed, which corresponds to maintaining projections until 2028, and then
stable values. This represents an initial demand for the following products: sugarcane (3.4 Mt), soyoil (1.8 Mt), and other minimal contributions from corn and rice.
CLIMATE CHANGE Crop model and climate change scenario
Current Trends Pathway Sustainable Pathway
By 2100, global GHG concentration leads to a radiative forcing level of 6 W/m2 By 2100, global GHG concentration leads to a radiative forcing level of 2.6 W/
(RCP 6.0). Impacts of climate change on crop yields are computed by the crop m2 (RCP 2.6). Impacts of climate change on crop yields are computed by the
model GEPIC using climate projections from the climate model HadGEM2-E crop model GEPIC using climate projections from the climate model HadGEM2-E
without CO2 fertilization effect. without CO2 fertilization effect.
25Argentina
Annex 3. Correspondence between original ESA CCI land cover classes and
aggregated land cover classes displayed on Map 1
FABLE classes ESA classes (codes)
Cropland Cropland (10,11,12,20), Mosaic cropland>50% - natural vegetation 50% (40)
Forest Broadleaved tree cover (50,60,61,62), Needleleaved tree cover (70,71,72,80,82,82), Mosaic trees
and shrub >50% - herbaceous 50% - trees and shrubsArgentina
Annex 4. Overview of biodiversity indicators for the current state at the
ecoregion level4
Table 3 | Overview of biodiversity indicators for the current state at the ecoregion level3
Area Protected Share of Land Share of Share of Cropland Share of
(1,000 ha) Area where Natural Land where Land where (1,000 ha) Cropland
(%) Processes Natural Natural with >10%
Predominate Processes Processes Natural
(%) Predominate Predominate Vegetation
that is that is within
Protected Unprotected 1km2
Ecoregion (%) (%) (%)
439 Alto Paraná
2,263.5 9.9 51.9 17.4 82.6 39.3 97.6
Atlantic Forests
440 Araucaria Moist
463.1 10.4 73.4 13.3 86.7 5.0 92.9
Forests
587 Central Andean
3,011.9 36.0 88.4 37.9 62.1 0.5 100.0
Dry Puna
588 Central Andean
8,749.8 26.0 72.8 28.3 71.7 62.0 88.2
Puna
569 Dry Chaco 49,102.3 5.1 25.8 16.5 83.5 8,034.4 46.1
575 Espinal 29,922.7 1.7 6.7 9.1 90.9 14,645.3 27.0
592 High Monte 11,698.6 12.9 68.0 13.7 86.3 108.2 76.1
571 Humid Chaco 16,228.4 10.1 23.2 24.4 75.6 3,051.6 64.5
576 Humid Pampas 39,904.8 3.0 6.8 10.6 89.4 30,050.7 29.4
577 Low Monte 35,411.7 5.4 29.6 11.7 88.3 940.6 55.5
4 The share of land within protected areas and the share of land where natural processes predominate are percentages of the total ecoregion area
(counting only the parts of the ecoregion that fall within national boundaries). The shares of land where natural processes predominate that are protected
or unprotected are percentages of the total land where natural processes predominate within the ecoregion. The share of cropland with at least 10% natural
vegetation is a percentage of total cropland area within the ecoregion.
27Argentina
Area Protected Share of Land Share of Share of Cropland Share of
(1,000 ha) Area where Natural Land where Land where (1,000 ha) Cropland
(%) Processes Natural Natural with >10%
Predominate Processes Processes Natural
(%) Predominate Predominate Vegetation
that is that is within
Protected Unprotected 1km2
Ecoregion (%) (%) (%)
561 Magellanic
2,842.3 36.2 88.0 39.4 60.6 77.4 91.1
Subpolar Forests
585 Paraná Flooded
3,714.6 34.5 31.4 41.3 58.7 254.7 66.3
Savanna
578 Patagonian
53,542.8 6.3 64.2 9.4 90.6 247.7 87.2
Steppe
0 Rock and Ice 124.0 99.0 100.0 99.0 1.0 0.5 51.8
595 Southern
9,485.4 26.2 92.2 27.7 72.3 23.1 78.4
Andean Steppe
504 Southern
4,765.0 9.2 48.5 17.6 82.4 479.0 67.2
Andean Yungas
586 Southern Cone
Mesopotamian 2,683.9 1.6 17.2 7.3 92.7 327.6 80.7
savanna
574 Uruguayan
24.0 0.6 32.9 1.0 99.0 0.8 94.8
Savanna
563 Valdivian
Temperate 4,467.7 37.4 92.4 40.1 59.9 194.1 89.0
Torests
Source. countries - GADM v3.6; ecoregions Dinerstein et al. (2017); cropland, natural and semi-natural vegetation – ESA CCI land cover 2015 (ESA, 2017);
protected areas – UNEP-WCMC and IUCN (2020); natural processes predominate comprises key biodiversity areas – BirdLife International 2019, intact forest
landscapes in 2016 – Potapov et al. (2016), and low impact areas – Jacobson et al. (2019)
28Argentina
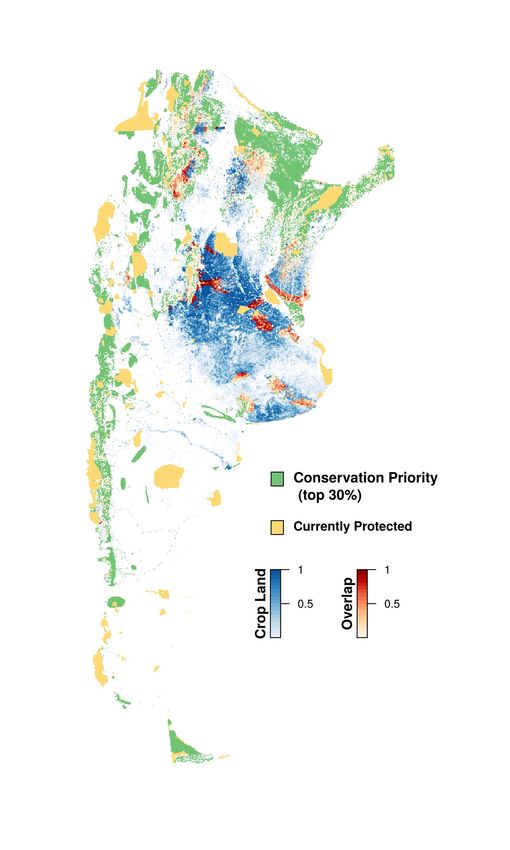
Annex 5. Application of Nature Map in Argentina
The Nature Map project (IIASA, IIS, UNEP-WCMC and SDSN, 2020) is an international effort to produce integrated
maps of terrestrial areas of significance for conservation and restoration of biodiversity, carbon storage, water
provision, and other ecosystem services. In Argentina, we are currently mapping habitats of endemic and non-endemic
species, vulnerable soil and plant carbon, and potential sources of clean water provision. The aim is to build a map
that combines each of these features and prioritizes them for conservation through a spatial optimization algorithm.
To do so, we map the entire country by planning units of either protected or unprotected areas. Within the bounds of
an overall “budget” that limits the maximum extent of protected areas, we then prioritize these units by identifying
those which maximize the relative target fulfillment of each feature.
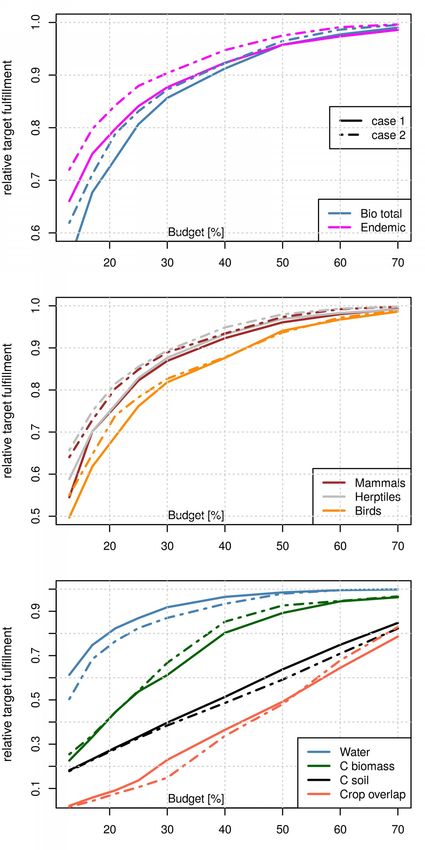
For this preliminary study, we considered 359 endangered species that are present in 17 biomes in Argentina. We set a
target to preserve 80% to 100% of their original distribution ranges, depending on their IUCN endangerment category,
including endemism into the prioritization. Furthermore, we set the target to preserve 100% of vulnerable (prone to
loss) soil and biomass carbon and freshwater supply to downstream beneficiaries.
The variables were then charted against the protection budgets (from 0 to 100% of the country area) needed to reach
the desired targets, considering different relative weights (Figure 11a-c). A preliminary solution is presented in Figure
11d: a map of the optimal way to preserve biodiversity, water, and carbon with a total given budget of 30% of the area
(green areas, in addition to the already preserved yellow ones). This would result in the conservation of more than 75%
of the carbon in biomass, almost 90% of endemic species, and more than 81% of potential clean water provision. Since
soil carbon is distributed more evenly than the other variables, only around 30% of it can be protected. The areas in
red correspond to the overlap of the proposed protected areas with the current cropland distribution, which account for
around a 10% loss of some of the most productive areas. Considering current crop distribution and productivity, this
could mean a loss of near 7.6 Mt of grain, around 6% of 2017-2018 value.
The preliminary Nature Map Argentina results show that potentially contrasting objectives can be achieved jointly
through the use of prioritization models designed to answer how much area is needed for successful conservation of
natural resources (and where protected areas should be located). The 30% budget solution is not entirely satisfactory
due to the overlap of conservation and crop production. Future optimizations should be carried out applying additional
constraints to protecting croplands and other productive areas, or even attempting to achieve both food production
targets and environmental targets by allocating cropland, grazing and conservation areas at the same time, to better
address this trade-off.
29You can also read