Drivers of Change in Urban Growth Patterns: A Transport Perspective from Perth, Western Australia - MDPI
←
→
Page content transcription
If your browser does not render page correctly, please read the page content below
Article
Drivers of Change in Urban Growth Patterns:
A Transport Perspective from Perth, Western Australia
Keone Kelobonye 1,2, * , Jianhong Cecilia Xia 1 , Mohammad Shahidul Hasan Swapan 3 ,
Gary McCarney 1 and Heng Zhou 1
 1    School of Earth and Planetary Sciences, Curtin University, GPO Box U1987, Perth, WA 6845, Australia;
      C.Xia@curtin.edu.au (J.C.X.); garyviaje@gmail.com (G.M.); heng.zhou@postgrad.curtin.edu.au (H.Z.)
 2    Department of Architecture and Planning, University of Botswana, 4775 Notwane Rd. Gaborone, Botswana
 3    School of Design and the Built Environment, Curtin University, GPO Box U1987, Perth, WA 6845, Australia;
      m.swapan@curtin.edu.au
 *    Correspondence: keone.kelobonye@postgrad.curtin.edu.au

 Received: 1 March 2019; Accepted: 7 April 2019; Published: 9 April 2019

 Abstract: The evolution of urban form is a slow and complex process driven by various factors which
 influence its pattern of occurrence (time, shape and directions) over time. Given the ever-increasing
 demand for urban expansion, and its negative effects on travel efficiency and environmental quality,
 it is imperative to understand the driving forces behind this complex process. This study investigates
 the role played by transport developments in the expansion of Perth’s urban footprint. Since transport
 developments are influenced by prevailing economic developments and planning regulations, our
 analysis starts by deconstructing a timeline of milestones under these three themes, from an urban
 land development perspective. An overview of the eras of transport evolution is provided, and we
 discuss the pattern of urban form changes as they relate to these transport advancements. The paper
 ends by mapping and quantifying changes in Perth’s urban land over the past five decades. The results
 show that transport had a strong influence on the pattern of urban expansion for a long time, but that
 trend has now been reversed. Rail constructions have been playing catch-up to residential expansion
 since the late twentieth century. Meanwhile, the rate of urban expansion has gone down in the
 twenty-first century, as the city goes for compact growth.

 Keywords: urban form; urban footprint; transport development; driving force; urban expansion; Perth

1. Introduction
     Low-density suburbanisation has been the dominant trend of urban growth in major cities in the
US, Canada and Australia since the end of WWII [1,2]. In addition to a general world population
increase, urban areas in particular are expected to house more than half of the world’s population by
2020 [3], and two thirds (66%) by 2050 [4]. The effects of urbanisation on the environment around the
world have become a major concern [5]. Urban expansion is one of the major causes of natural ecosystem
degradation [6] as it displaces natural land cover and destroys natural habitats [7,8]. By removing
vegetation, these changes reduce the rate of atmospheric carbon dioxide sequestration [9] and the
cooling effect provided by vegetation to the atmosphere, resulting in the urban heat island effect [10,11],
among other problems. In many cases, urban expansion has exacerbated spatial inequalities as
amenities often remain concentrated in the central areas [12]. It results in job-worker imbalances
which are a significant contributor to long commuting distances and reliance on unsustainable travel
modes [12–15].
     The pace and trajectory of urban expansion is driven by many external factors, which can
either constrain the expansion or facilitate it into urban sprawl. Urban sprawl is often the physical

Urban Sci. 2019, 3, 40; doi:10.3390/urbansci3020040                             www.mdpi.com/journal/urbansci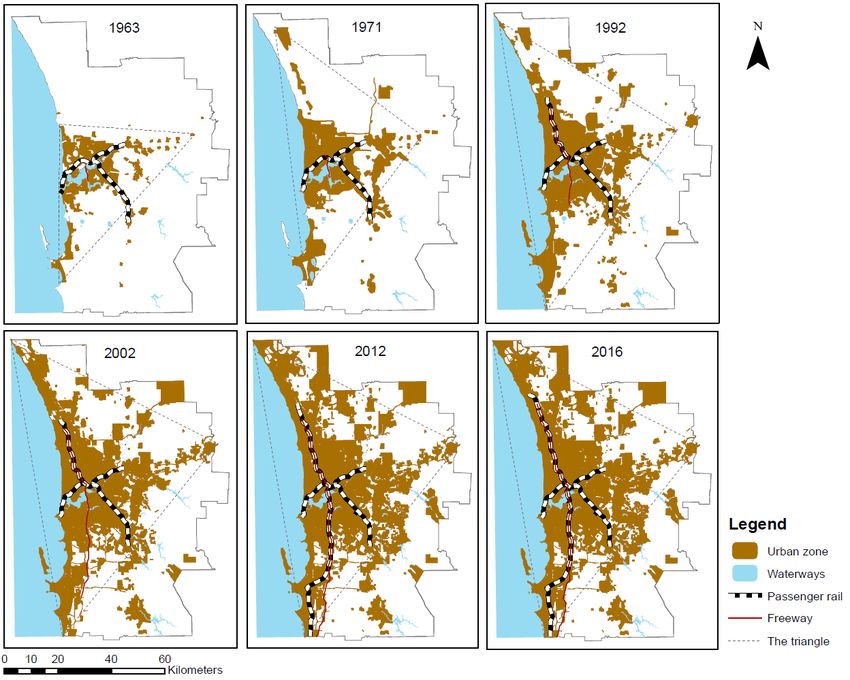
Urban Sci. 2019, 3, 40                                                                            2 of 16

outcome of urbanisation, and is usually the term used to denote unsustainable urban expansion [5].
The phenomenon of urban sprawl/expansion has been discussed extensively in the literature. Several
studies have also investigated forces that affect urban growth and shape the urban form, however,
this is neither uniform nor constant. Catalán, Saurí [16] assert that the study of urban form “must
be approached and understood taking into account specific geographical and historical contexts in
which particular urban forms shape cities” (p. 174). A polarisation of case studies on North-American
urban expansion and transitional urban patterns of some European cities (e.g., Barcelona and Athens)
is noted in the literature. An overwhelming amount of studies ascribes sprawling largely to increasing
automobile usage and road network expansions [17–21]. Also evident in the literature is the wealth of
theoretical discussion highlighting the debate between compact and dispersed urban forms. There
is limited study on the evolution of dispersed urban form in different contexts outside these trends.
Studies of urban growth drivers interwoven along the trajectory of city development are imperative.
      Perth presents a good opportunity to study the pattern of expansion in post-colonial cities.
The evolutionary journey of Perth from a small colonial town of 1829 to a modern metropolis has
attracted the interest of urban scientists due to its rapid and dispersed suburbanisation that made
it one of the most sprawling cities in the world (see, among others, Alexander and McManus [22];
Alexander, Greive [23]; Falconer, Newman [24] Curtis and Mellor [25] and Troy [26]). In 1970, the
Perth Metropolitan Region (PMR) contained 0.7 million people in about 500 km2 of area. While
the population was twice as much in 2005, the footprint area, on the other hand, had more than
doubled [27]. In 2015, the population within the PMR was 2.04 million, which amounted to 79% of
the total Western Australian population. The highest population growth in the state happened in
Perth’s outer suburbs [28]. The metropolitan area of Perth now spans more than 100 km from north
to south. The city recorded a maximum density of just 3600 people per km2 in 2015 [28,29]. Today,
Perth (with just about 2 million people) has a larger area (1566 km2 ) than some of the older and most
populated cities in the world including Hong Kong (285 km2 for 7.3 million people), Madrid (1321 km2
for 6.2 million people) and Istanbul (1360 km2 for 13.8 million over) [30].
      Studies have identified transport as a major driver of urban growth [11,18,31,32]. In Perth, the
state government has invested significantly in transport infrastructure over the years. As Alexander
and McManus [22] describe it, “Perth laid out freeways like red carpet to welcome the automobile”
(p. 6). The city has also, to date, invested in about 180 km of heavy rail across five passenger
lines—plus one currently under construction to the airport, all of which run electric trains. These
investments facilitated the city’s expansion, as they alleviated the effects of living further from the
city centre [25]. Undoubtedly, economic development also plays a fundamental role in driving urban
expansion [18,33–35]. In addition to making transport investments possible, the associated improving
quality of life enables families to cope with longer distance commutes. These infrastructure (and
other urban development) expansions occur under a system of planning regulations that evolves over
time. As it rezones and releases land for development, the planning framework directly influences the
pattern (shape, direction and pace) of how the urban form evolves. The planning framework in Perth
has applied different philosophies over the years. At one point expansion from the city centre was
encouraged [36] and now the policies are advocating limiting future expansion outside the current
urban footprint for a compact urban form [37].
      This paper investigates the role of transport developments in driving urban form change in the
PMR. Given that transport is also influenced by other factors, and the importance of the combinations of
these factors [34], we start our analysis by relating past transport developments to economic milestones
and planning framework. Thus, we identify the major milestones under the broad themes of transport,
economic development and planning framework that happened in the state since British colonisation,
and develop and deconstruct their timelines in relation to land development. We advance our analysis
into a focus on the interaction between transport and urban growth. The paper ends by mapping and
quantifying changes in urban land over the past five decades.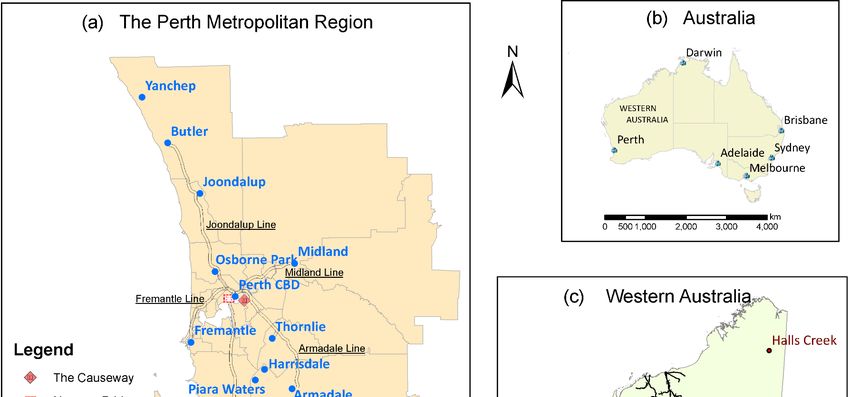
Urban Sci. 2019, 3, 40 3 of 16
1.1. Data
A large part of the information in this work is a product of reviewing historical literature on Perth
and the state of Western Australia (WA). Government publications, museum archives, population data
and academic articles have been reviewed and analysed to understand and examine the growth of
Perth and develop a timeline of milestones. The WA Department of Planning provided copies of the
PMR statutory plans and historic Metropolitan Region Scheme (MRS) data for the years 1963, 1971,
1992, 2002, 2012 and 2016 (the MRS is a statutory plan of broad land zones for future development in
Perth).
1.2. Study Area
Perth is the State Capital of Western Australia. It is located on the south-western coast of Australia,
and happens to be the nation’s most isolated city. The metropolitan region of Perth consists of 30 Local
Government Areas (LGAs) that roll out detailed planning within their areas in conformity with the
MRS zoning. Figure 1 shows the geographical location of Perth, as well as some key places within the
PMR. The subdivision lines within the PMR map depict LGAs.
2. Deconstructing the Timelines of City Development
Perth is relatively a young city that was founded under two centuries ago, in 1829. From its
inception, Perth was a miniscule colony of two small settlement points, one at the mouth of the Swan
River in Fremantle and the other on the northern bank of the river about 15 kilometres upstream at the
present-day Perth Central Business District (CBD) (see Figure 1a). In its earlier years, the colony had
limited planning regulation that mainly provided for current needs with little projection inputs. From
the 1950s, planners sought “to accommodate economic growth and the Australian suburban dream of
home and car ownership” [38]. Perth is ranked among the least dense cities in the world, having an
urban footprint that has become larger than many bigger (by population) cities within a much shorter
period [30]. With its metropolitan population expected to increase by an additional one million people
within the next two decades [39], it is necessary to understand the region-specific factors that will
influence Perth’s future urban form.
In this regard, we propose to deconstruct city development milestones from 1829 (when Perth was
founded as a British colony) up to 2016. We borrow the definition of ‘deconstruction’ from Dear [40],
who refers to it as historicising the growth of a city looking through physical factors including transport
and other infrastructural development, economic shifts and land use planning. We contend that a
timeline analysis can be effectively utilised to understand how the major transport milestones—amid
the influence of economic development and planning regulation—impacted on land use development
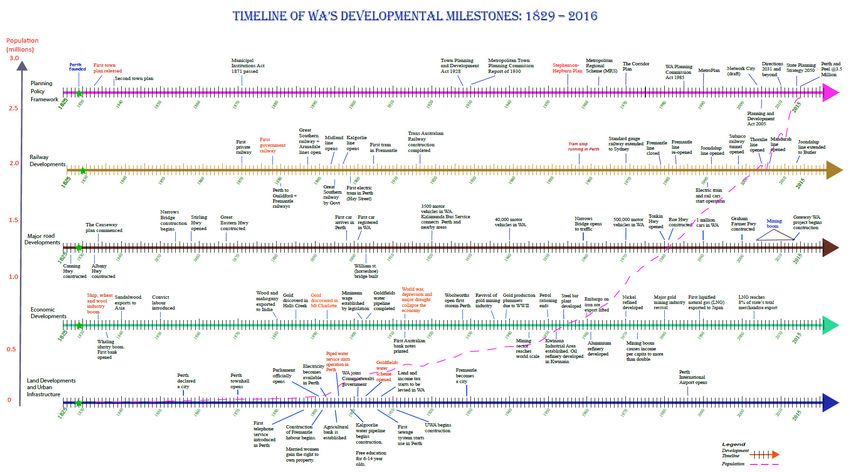
of Perth. Figure 2 presents a timeline of developments under four themes, viz. planning framework,
transport developments, economic milestones (in the State) and the resultant land use developments.
Transport developments, as a focus of the study, are divided into two timelines to distinguish between
rail and road developments. We also have a State population graph superimposed across the timelines,
which enables for a cross-comparison of the milestones against population growth.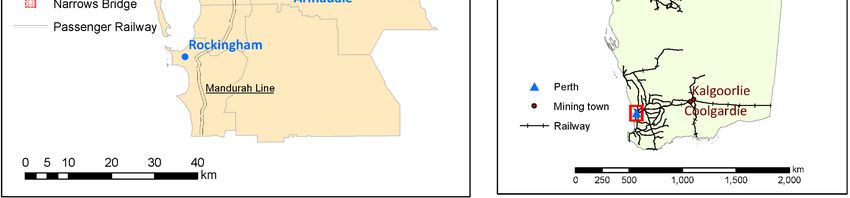
Urban Sci. 2019, 3, 40                                                                                                                                                      4 of 16

1
2           Figure
         Figure         (a) The
                     1. The
                 1. (a)         Perth
                             Perth    Metropolitan
                                   Metropolitan    Region.
                                                Region. (b)(b) Geographic
                                                            Geographic    location
                                                                       location  ofof Australia’smajor
                                                                                    Australia’s   majorcities.
                                                                                                        cities.(c)
                                                                                                                 (c)Locations
                                                                                                                     Locationsofofkey
                                                                                                                                   keymining
                                                                                                                                      miningtowns
                                                                                                                                             towns in
                                                                                                                                                   in Western
                                                                                                                                                      Western Australia.
                                                                                                                                                              Australia. Source:
                                                                                                                                                                         Source: Made
                                                                                                                                                                                 Made by
3           by author.
         author.

    Urban Sci. 2019, 3, x; doi: FOR PEER REVIEW                                        www.mdpi.com/journal/urbansci
Urban Sci. 2019, 3, 40 5 of 16
32
Figure 2. Timelines of major events/developments in the history of Perth. Source: Made by author.
33 Figure 2. Timelines of major events/developments in the history of Perth. Source: Made by author.
Urban Sci. 2019, 3, x; doi: FOR PEER REVIEW www.mdpi.com/journal/urbansciUrban Sci. 2019, 3, 40 6 of 16
It is important to note that given the breadth of the period, it would be impossible to include
all events in the timeline. While we attempt to identify the most prominent events within the
theoretical scope of this study, Dear [40] warns that such historical interpretations are often shaped by
idiosyncrasies of the observer and observed.
The first timeline tracks the evolution of planning framework by highlighting the release of key
planning documents. The two transport timelines trace the introduction of major roads and railways
connecting areas within WA and other states across the country. Economic developments denote
major economic activities in the colony/state impacting on general development such as industrial
boom, mineral discovery or flagship policies for major economic restructuring. The last timeline
shows major land and other infrastructure developments which ensued from the influence of transport
developments, economic milestones and/or planning regulations.
A cross-section inspection of the timelines reveals that the construction of transport infrastructure
significantly contributed to urban land development. The trend was spread out through the spectrum
of time, with some of the most significant highways constructed in the early to mid-nineteenth
century (1827–1858), while the recent constructions were in the late twentieth century (from the 1980s).
Nonetheless, the period between the late 1800s and early 1900s was rather dormant in terms of major
road/highway construction. Ironically this is the period during which the private automobile arrived
and multiplied in numbers in the state. According to the Revolutions Transport Museum, the number
of motor vehicles on the state roads grew from 3500 in the 1920s to 500,000 in the 1970s. This number
had doubled just 20 years later, reaching the million mark in the 1990s. This trend is consistent with
the high rate of urban expansion in the late twentieth century, which is reflective of easier commuting
ability between suburbs and the city centre.
The first major roads of the state predated railway lines, the first of which was only constructed in
the latter half of the nineteenth century (1871). This railway was constructed by a private company,
out of timber. Interestingly, the trough of dormancy in the major roads timeline coincides with an
upsurge of railway constructions. Some of the key rail links with surrounding urban centres and major
towns were established in the late nineteenth century. The trains were mixed (freight and passengers),
with passenger trains mainly within the urban areas. The railway construction industry, too, had a
dormant period. In 1992, the opening of Joondalup Line connecting the northern suburbs to the city
centre appeared as a breakthrough after almost 100 years. This somewhat marked the resurrection
of rail in the state, as the southeast suburbs were connected through Thornlie Line just 12 years later.
About three years after that, a major urban centre in the south was linked through Mandurah Line
at the end of 2007. In 2014 the Joondalup line was extended along the northern coast to follow the
prolonged suburban sprawl- the Butler extension.
The early stage of railway development was enabled by the state’s economic boom. From its
establishment, the state had a shaky economy that could not propel a steady development. The discovery
of gold in Halls Creek, Coolgardie and Mt Charlotte (in 1885, 1892 and 1893 respectively), commonly
referred to as the gold rush, changed the fate of the state forever [41]. It transformed it from a poor,
sparsely populated desert colony to a mineral-rich economy. The gold era is credited for being the
major enabler of the first ‘railway construction period’ in the state. It certainly played a large part in the
growth of household incomes, to which the rise of motor vehicle numbers can be ascribed. A lot of
other land use and planned developments also came after the gold rush. This is despite the fact that
Perth was declared a city in 1856, 30 years before the Halls Creek gold discovery.
Impacts from the First World War, Great (economic) Depression (1929–1930) and drought are also
evident across the timelines. The war led to a collapse of the economy, and no new infrastructural
projects were undertaken during the war and immediate post-war period. As a result, all major land
use developments were halted.
The juxtaposed timelines clearly demonstrate the resulting impacts of organised planning efforts,
transport infrastructure and economic developments on urban expansion during the city’s history.
There were very few planning interventions observed in the early years. The colony’s establishment inUrban Sci. 2019, 3, 40 7 of 16
1829 followed Sir James Stirling’s (first Governor of WA) survey two years prior, and his consequent
persistence and exaggerated description of the soil fertility in the area [42]. The beauty of the landscape,
fresh water springs, fertile soils and availability of building materials proclaimed by Stirling (and
supported by gardener and colonial botanist, Charles Frazer) were some of the factors that led to the
colony’s establishment, and attracted people to the area. No prior arrangement had been made to
establish a colony, so the settlement was laid out hastily upon arrival of the first settlers [43]. Despite
the expedited establishment, growth thereafter was very slow due to low population growth and
highly limited public investment.
With the introduction of convict labour in 1850, a few road and land developments occurred.
Later, the gold rush triggered the need, and provided the means, to invest in port development (e.g.,
Fremantle harbour) and establish rail networks between key economic centres. The resource boom also
brought other land development measures and urban services (e.g., piped water supply and sewage
system) to support the increasing population. The city experienced a slow and steady population
growth, resulting in expansion of the urban footprint. This growth justified investment in tram
transport which led to the introduction of electric trams in Perth (1899) and the first tram operating in
Fremantle (1905) to facilitate travel particularly for the outlying suburb residents commuting to the
city centre.
The first official regional plan for the PMR was released in 1955, which was followed by gazetting
statutory land use zones in 1963, known as the Metropolitan Region Scheme (MRS). Subsequent
regional plans followed in 1970 (the Corridor Plan) and 1990 (MetroPlan). It is important to note that
while the direction of development generally adhered to these statutory documents, a significant
amount of development still happened outside of the identified growth areas. For instance, Adams [27]
noted that by 1990 “urban zoned land had indeed spread into these corridors [of the 1970 Corridor
Plan]; as well as into many other areas which had not been identified for urban growth potential”
(p. 39).
The state population graph communicates another interesting piece of information when
juxtaposed against the timelines (Figure 2). A population growth rate of 27% was recorded between
1849 and 1850, the same year in which convict labour was introduced in the colony. The population
trend line shows that a significant leap occurred between the late 1880s and early 1890s. We performed
a spikes check [44] and it revealed that a more than 20% yearly growth was recorded between 1894
and 1896. It is evident that the gold rush significantly contributed in population growth during this
period. The availability of electricity, piped water supply and improved links with mining towns are
equally considered to have attracted more people in the city in the early 1890s. The growing trend was,
however, disrupted in the early 1910s, causing a declining trend until the end of the decade roughly
due to the WWI. The recent mining boom of the twenty-first century (2003/04-2013/14) also had a big
effect in the state’s population growth. The highest growth was seen during this period, albeit with
some fluctuations.
3. Milestones of Transport Evolution in Perth
3.1. Passenger Trams
Tramways are an integral component of the beginnings of the public transport era in Perth,
having serviced the people for a period of nearly 60 years. Tram lines allowed Perth to grow from
a small riverside colony into an urban centre surrounded by expanding residential suburbs; people
could live further from the centre as the trams allowed them to commute further and more quickly.
The worldwide trend was that as cities grew larger the options to live close to the centre diminished,
forcing more and more people to live further away.
Since city centres were the largest employment areas, there was a dire need for a cheap and fast
way to travel between homes and work on a daily basis. These developments happened during an era
when railway construction was at a peak, and so it is no surprise that the mainline railway emergedUrban Sci. 2019, 3, 40 8 of 16
as the first solution. The train, however, had several disadvantages, which included high level of
investment, distance from residential streets, as well as spacing between stations, which meant that it
could only serve a portion of the population. Other public transport systems that could provide more
flexible travel within the suburban streets and the city were needed. Horse-drawn buses and trams
had horse-related disadvantages such as their maintenance and the unpleasant excretions they left on
the streets. Steam trams provided a more powerful alternative and solution to the horse-based systems,
but they were noisy, smoky and steamy, thus incompatible with residential houses—or even other
road traffic. Cable trams posed solutions, while, just as the other systems, introducing new problems
of their own; they had high installation and maintenance costs, plus several operational limitations.
The electric tram provided a solution to limitations of the cable tram, enabling it to spread and
become popular in many big cities across the world. Sydney, Melbourne and Adelaide had well
developed steam tramways, cable tramways and horse tramways respectively. Perth, on the other
hand, started right off with the electric tram; the electric tram was becoming popular at about the
same time as Perth was starting to invest in improving public transport. This was also during a period
when the state’s population was rapidly expanding due to the ‘pull factor’ of gold discovery. Tram
routes became synonymous with places of residence. While the tram lines were laid along existing
house-lined streets, some lines were laid in advance of residential developments in order to influence
the direction of suburban growth [36]. Trams were able to directly influence urban growth due to
their relatively rigid network and popularity as a major mode of transport of their era, which required
people to live fairly close to them.
3.2. Railways
The first Government railway was a 53km Geraldton-Northampton link of a copper mine and the
port, whose construction started in 1874, and was officially opened in 1879 [45]. Since then several
railway developments occurred, consisting of local metro lines, numerous intra-state tracks and an
interstate standard gauge link.
The construction of many of these railways was inspired by the industrial needs (e.g., transportation
of agricultural products, iron ore and gold), so trains outside the metro area were mainly mixed and
slow for passengers. Passenger trains had a higher significance in the metro area, and this trend
has continued into the modern years. The past three decades, for instance, saw high investment
in metropolitan rail transport, consisting of the introduction of electric train and rail cars, and the
construction of Joondalup Line, Subiaco tunnel (on the Fremantle line), Thornlie and Mandurah Lines
(Figure 1a). Suburban trains not only provided an important connection with the city centre, they also
enabled people to live in the suburbs and enjoy a smoother commute.
3.3. Private Cars
Private car usage has increased rapidly and constantly since cars came into the scene in the early
twentieth century. The car introduced unprecedented flexibility and convenience in travel, allowing
for an extensive urban footprint expansion [22]. At the same time, the urban expansion reinforced car
dependence as driving became the most viable option for travel, particularly the work commute.
The rise in car usage brought along unique challenges that have evolved over the years. Planners
were already dealing with traffic problems as early as the early twentieth century. The Metropolitan
Town Planning Commission Report of 1930 [46] acknowledged two main traffic problems to which it
recommended that planning efforts should be directed. These were the provision of greater facilities
for crossing both the river and the railway.
The report pointed out that at peak periods the Causeway, which was the sole entrance to the
city for the southern and south-eastern suburbs, had approximately as much traffic as the two busiest
bridges in Melbourne. While there were calls to divert traffic elsewhere, it was not until about 30 years
later that the Narrows Bridge was built (1959), providing an alternative route to the city centre for the
southern suburbs. Today, private car is the most dominant mode of transport in Perth and travel timesUrban Sci. 2019, 3, 40 9 of 16
are significantly longer due to congestion [47]. Hence, the general policy objective has gone in the
direction of seeking and encouraging alternative travel modes that are more efficient, environmentally
friendly and sustainable.
4. Intra-Urban Transport and Urban Growth
Advances in transport have played a major role in shaping the spatial structure of modern
cities [48]. In the earlier decades of the nineteenth century, cities were closer to canals, rivers and
harbours which were the main ways of transportation. Inland, intra-urban transport modes were foot,
camel, horse and wagon. These modes were much slower which prompted dwellers to live closer to
the city, thus forming a rather confined footprint of developments. The advents of trams and trains
(which were much faster and more reliable) in the second half of the nineteenth century allowed for an
expansion of the urban form along the tramways and railways.
Even though trains and trams were faster and reliable, they were rigid in timetables, and even
more restricting in geographical coverage. This gave the automobile an upper hand when it sprung into
the scene in the early twentieth century. The automobile rapidly gained popularity among households,
particularly due to its great flexibility and convenience. It changed the patterns of travel to random
intra-urban trips. People increasingly started travelling to places out of the city centre and further from
tram/train zones, and for purposes other than work such as recreation. Urban expansion, particularly in
the form of residential developments, soon became possible as people could live in the outer suburban
areas further from the city centre and tramways/railways. Highways and freeways determined the
urban form as the car became the dominant mode of transport. The eras of intra-urban transport and
urban growth were aptly illustrated by Adams [49] for US cities.
The development of Perth followed a similar trend to the eras described above, save for the
geographical constraints such as the river and ocean. Earlier developments took place along the Swan
River, with most of the settlement being around Perth City, the Fremantle harbour and along the river
between the two. The expansion then followed the spine of transport in the form of tramways in
the latter and early years of the nineteenth and twentieth centuries, respectively, and freeways in the
mid–late twentieth century. This proved a successful influence of growth direction by planners as they
laid the backbone of transport infrastructure in areas to which they wished for the city to expand [36].
5. The Pattern of Perth’s Urban Form Evolution
Using information from Stephenson and Hepburn [50] we present in Figure 3, snapshots of Perth’s
urban footprint in 1901, 1915 and 1942. It is worth noting that the PMR boundary did not, at the
time, exist as depicted in the figure, but is provided for purposes of illustration only. We have further
updated Stephenson and Hepburn’s efforts using the MRS zones from 1963 to 2016 in Figure 4 (next
section). The two figures give us a time series from which we can observe the growth pattern over the
last century. Figure 3 confirms the confinement of growth to areas around the river in the early years,
leading to a jointure of the formerly dis-contiguous colonial centres of Perth and Fremantle. It is also
clear that land development (contiguous) was relatively faster on the northern side of the river than on
the southern side. It is highly plausible that since the CBD was on the northern side, the river was an
access barrier for people on the south, making the northern suburbs more desirable, until the Narrows
Bridge was opened in 1959, as there was only one way to access the CBD from southern suburbs i.e.,
via the Causeway (see Figure 1a).
A linear expansion deviating from the river in the south-eastern direction became visible from
1942. This shows how residences followed the railway line (Armadale) going farther from the city
centre (explained further in the next section).Urban Sci. 2019, 3, 40 10 of 16
Urban Sci. 2019, 3, x FOR PEER REVIEW 11 of 17
Figure 3. Footprints of Perth’s urban expansion between 1901 and 1942. Source: Made by author.
Figure 3. Footprints of Perth’s urban expansion between 1901 and 1942. Source: Made by author.
In recent years (2000–2016), urban expansion has been marked by reduced outward growth,
A linear expansion deviating from the river in the south-eastern direction became visible from
as confirmed by our footprint mapping exercise in Figure 4. During this period, growth was more
1942. This shows how residences followed the railway line (Armadale) going farther from the city
interstitial as the state government sought to restrain sprawl and move towards greater density through
centre (explained further in the next section).
infill and mixed-use developments. During this period, the government produced three strategic
In recent years (2000–2016), urban expansion has been marked by reduced outward growth, as
planning documents; Directions 2031 and Beyond [51], State Planning Strategy 2050 [52] and Perth and
confirmed by our footprint mapping exercise in Figure 4. During this period, growth was more
Peel @ 3.5 million [37]. At the core of each of these documents is advocacy for less outward expansion
interstitial as the state government sought to restrain sprawl and move towards greater density
and more densification for accommodating current and future population demands. As a matter of
through infill and mixed-use developments. During this period, the government produced three
fact, the total urban land increased by 2.75% between 1992 and 2002, but only increased by 0.59% from
strategic planning documents; Directions 2031 and Beyond [51], State Planning Strategy 2050 [52] and
2002 to 2012, and by 1.26% over a longer period of 2002 to 2016 (see Table 1).
Perth and Peel @ 3.5 million [37]. At the core of each of these documents is advocacy for less outward
Overall, the expansion of Perth’s urban footprint imitated a triangular shape, delimited by the
expansion and more densification for accommodating current and future population demands. As a
ocean on the base and following the Swan River at the triangle’s peak (see Figure 4). The CBD lies in
matter of fact, the total urban land increased by 2.75% between 1992 and 2002, but only increased by
the centre of the triangle, as the centre of gravity or driving force of development. As Perth expanded
0.59% from 2002 to 2012, and by 1.26% over a longer period of 2002 to 2016 (see Table 1).
towards the north and south, the shape of the triangle gradually changed from acute triangle with
Overall, the expansion of Perth’s urban footprint imitated a triangular shape, delimited by the
all angles less than 90 degrees to an obtuse triangle with one angle at the peak larger than 90 degrees.
ocean on the base and following the Swan River at the triangle’s peak (see Figure 4). The CBD lies in
This may signify urban sprawl along the coast which led to Perth overtaking some of the world’s
the centre of the triangle, as the centre of gravity or driving force of development. As Perth
biggest cities in its footprint expansion. Coastal developments, also termed as ‘sea change’, have been
expanded towards the north and south, the shape of the triangle gradually changed from acute
a common phenomenon in Australia for several decades [53–55]. Sea change migrants move to coastal
triangle with all angles less than 90 degrees to an obtuse triangle with one angle at the peak larger than
areas for lifestyle reasons [53,56] since “coastal views and short travel times to the sea [are] perceived as
90 degrees. This may signify urban sprawl along the coast which led to Perth overtaking some of the
valuable amenities, and hence the growth of coastal suburbs” [57]. Some other factors also contributed
world’s biggest cities in its footprint expansion. Coastal developments, also termed as ‘sea change’,
to this growth pattern, such as geographical terrain, e.g., escarpments on the east confined expansion
have been a common phenomenon in Australia for several decades [53–55]. Sea change migrants
closer to and along the coast where land is more developable.
move to coastal areas for lifestyle reasons [53,56] since “coastal views and short travel times to the
seaInteraction
6. [are] perceived
betweenas valuable
Transport amenities, and hence
Infrastructure andthethegrowth of coastal suburbs” [57]. Some other
Urban Form
factors also contributed to this growth pattern, such as geographical terrain, e.g., escarpments on the
We analysed
east confined the extent
expansion of urban
closer to andland
alongusethe
zones
coastinwhere
the MRS
landover the last
is more five decades in Figure 4.
developable.
An urban land in this case consists of residential, commercial, recreational and industrial zones.
Also shown in between
6. Interaction the figureTransport
are the freeways and passenger
Infrastructure and therailways that existed at the respective years.
Urban Form
As indicated in the previous sections, transport infrastructure was a strong determinant of the urban
form We analysed
in the the extent
early years of urban
of Perth’s land useTramlines
evolution. zones in the MRS over
attracted the lastsettlements
residential five decadesininthe
Figure
late
4. An urban land in this case consists of residential, commercial, recreational
nineteenth century, and the connection of built-up land between Perth CBD and Fremantle along and industrial zones.
the
Also shown in the figure are the freeways and passenger railways that existed
Swan River also happened to follow the Fremantle railway line. The southerly expansion, while it at the respective
years. As indicated in the previous sections, transport infrastructure was a strong determinant of the
urban form in the early years of Perth’s evolution. Tramlines attracted residential settlements in the
late nineteenth century, and the connection of built-up land between Perth CBD and FremantleUrban Sci. 2019, 3, 40 11 of 16
Urban Sci. 2019, 3, x FOR PEER REVIEW 12 of 17
started
along with
the Swan dispersed
River also settlements
happenedon the coast,
to follow later compacted
the Fremantle and The
railway line. expanded
southerlytowards and along
expansion,
thewhile
freeway.
it started with dispersed settlements on the coast, later compacted and expanded towards and
Three
along railway lines (Fremantle, Midland and Armadale) were present at the first MRS (1963),
the freeway.
from the great
Three ‘railway
railway linesera’ of the late
(Fremantle, nineteenth
Midland century. These
and Armadale) lines formed
were present at the the
firstbackbone
MRS (1963), of urban
from the great
expansion, leading‘railway era’ of concentration
to visible the late nineteenth century. These lines
of developments in the formed the backbone
north-eastern andofsouth-eastern
urban
expansion,However,
directions. leading tothese visible concentration
lines have not been of developments
extended andinthe therapid
north-eastern
urban growthand south-eastern
has now sprawled
directions. However, these lines have not been extended
beyond (in the case of Armadale and Midland) and away from them. It is a similar and the rapid urban growth situation,
has now if not
sprawled
worse, withbeyond
the longer (in north
the case andofsouth
Armadalelines and
whereMidland)
some ofand theaway
furthest from them. It is a from
developments similar
the CBD
situation, if not worse, with the longer north and south lines where some of the furthest
have occurred. When the Joondalup Line was constructed in 1992 after almost a century of railway
developments from the CBD have occurred. When the Joondalup Line was constructed in 1992 after
construction dormancy, it did not go the full extent of the urban expansion. And despite the urban
almost a century of railway construction dormancy, it did not go the full extent of the urban
development
expansion. And expansion
despite the southward, it was notexpansion
urban development until 2007southward,
that the Mandurah
it was not line
untilwas
2007opened.
that the
The 7.5 km extension
Mandurah line was opened. of the Joondalup Line (to Butler) in 2014 is the latest addition to Perth’s
railways, The 7.5 km extension of the Joondalup Line (to Butler) in 2014 is the latest addition to Perth’s MRS
and it still fell behind the rather linear urban land expansion along the coast. The 2016
shows thatand
railways, urban land
it still fellhas gone
behind thebeyond each urban
rather linear of theland
terminals
expansionandalong
somethe lines may
coast. Therequire
2016 MRSextension.
shows
From that
this urban land has
information, it isgone beyond
evident thateach
the of the has
MRS terminals
been and someland
availing lines for
mayurban
require extension. well
development
Fromofthis
ahead information,
transit development.it is evident
Thisthat
is athe MRS hasfrom
deviation beenthe
availing
earlierland
trendfor urban development
of urban expansionwell following
transport links. This has led to a prominent level of dependence on the automobile following
ahead of transit development. This is a deviation from the earlier trend of urban expansion in Perth [22,58],
astransport links.accessible
it is the most This has led to a prominent
transport level of dependence
mode particularly on the automobile
for the outlying residentsinwhere
Perth transit
[22,58], option
as it is the most accessible transport mode particularly for the outlying residents where transit
are limited.
option are limited.
Figure 4. Metropolitan Region Scheme (MRS) urban land footprints changes between 1963 and 2016
Figure 4. Metropolitan Region Scheme (MRS) urban land footprints changes between 1963 and 2016
(Note:
(Note:Industrial
Industrialand
andparks
parks&&recreation
recreationare
arealso
alsoconsidered
consideredtotobe
beurban
urbanland).
land).Source:
Source: Made
Made by
by author.
author.
7. Changes in the Urban Footprint between 1963 to 2016
Using a GIS, the digitised MRS data were used to calculate land areas for different land use
categories in each of the six years (1963, 1970, 1992, 2002, 2012 and 2016). Calculating the areas enables
for a quantitative measure of change for each land use category. Together, these areas define the totalUrban Sci. 2019, 3, x FOR PEER REVIEW 13 of 17
7. Changes in the Urban Footprint between 1963 to 2016
Using a GIS, the digitised MRS data were used to calculate land areas for different land use
Urban Sci. 2019, 3, 40
categories in each of the six years (1963, 1970, 1992, 2002, 2012 and 2016). Calculating the12areas of 16
enables for a quantitative measure of change for each land use category. Together, these areas define
the total in
changes changes
Perth’sin Perth’s
urban form.urban form. Although
Although the MRS data the merely
MRS data merely
shows showszones
planning planning zones (as
(as opposed to
opposeddevelopments),
existing to existing developments),
it does provide it does provide
a valuable a valuableofimpression
impression the trend andof the trendofand
pattern pattern
change of theof
change of
urban form. the urban form.
The results
The results confirmed
confirmed that that land
land areas
areas in
in various
various land
land use
use categories
categories experienced
experienced significant
significant
changes, albeit
changes, albeit inin varying
varying degrees.
degrees. Figure
Figure 55 presents
presents an an analysis
analysis of
of the
the data
data for
for five land uses
five land uses from
from
1963 (first MRS) to 2016, which shows that the areas of state land and rural
1963 (first MRS) to 2016, which shows that the areas of state land and rural land within the PMR land within the PMR
boundary have
boundary have decreased
decreased quite
quite significantly
significantly during
during this
this period.
period. On
On the
the other
other hand,
hand, urban
urban and
and parks
parks
and recreation
and recreationland landareas
areas increased,
increased, encroaching
encroaching intointo formerly
formerly forest
forest and rural
and rural land. land. Specifically,
Specifically, urban
land increased from 7.41% of the total MRS area to 20.64% during this period. Rural landRural
urban land increased from 7.41% of the total MRS area to 20.64% during this period. land
decreased
decreased from 56.56% to 33.49% (see Table 1 for the detailed land area changes).
from 56.56% to 33.49% (see Table 1 for the detailed land area changes). However, the rate of increase However, the rate
in
of increase in urban land area (as well as the rate of decrease in rural land) has significantly
urban land area (as well as the rate of decrease in rural land) has significantly reduced in recent years. reduced
in recent
These years.
trends These trends
highlight highlight
the restricted the growth
urban restricted urban
of the growth ofcentury
twenty-first the twenty-first
by the statecentury by the
government.
state government.
Figure 5. Areal
Figure 5. Arealland
landuse
usechanges between
changes 1963
between andand
1963 2016.2016.
(Percentages signify
(Percentages the proportion
signify of urban
the proportion of
land in the PMR). Source: Made by author.
urban land in the PMR). Source: Made by author.
Table 1. MRS
Table 1. MRS land
land areas
areas between
between 1963
1963 and
and 2016.
2016.
Land use Area (km2) by Year of MRS
Land Use
1963 1971
(km2 ) by2002
Area1992 Year of MRS2012 2016
Industrial 1963 73.29 197178.27 1992
86.18 104.572002 110.43 2012
112.33 2016
Parks and Recreation 273.33 239.59 373.38 728.73 1124.50 1125.49
Industrial 73.29 78.27 86.18 104.57 110.43 112.33
Urban 372.79 533.52 861.35 994.10 1029.34 1069.63
Parks and Recreation 273.33 239.59 373.38 728.73 1124.50 1125.49
Rural 2844.14 2697.80 2361.40 1879.09 1749.58 1736.02
Urban 372.79 533.52 861.35 994.10 1029.34 1069.63
State forest 1464.81 1699.87 1498.09 1422.94 1139.47 1139.47
Rural 2844.14 2697.80 2361.40 1879.09 1749.58 1736.02
Total 5028.36 5249.05 5180.40 5129.43 5153.31 5182.94
State forest 1464.81 1699.87 1498.09 1422.94 1139.47 1139.47
Percentage of Total MRS area
Total Industrial 5028.36 1.46% 5249.051.49% 5180.40
1.66% 5129.432.14%
2.04% 5153.31
2.17% 5182.94
Parks and Recreation 5.44% 4.56% 7.21% 14.21% 21.82% 21.72%
Percentage of Total MRS area
Urban 7.41% 10.16% 16.63% 19.38% 19.97% 20.64%
Industrial Rural 1.46% 56.56% 1.49% 51.40% 1.66%
45.58% 36.63%2.04%33.95% 2.14%
2.17% 33.49%
Parks and Recreation
State Forests5.44% 29.13% 4.56% 32.38% 7.21%
28.92% 14.21%22.11%
27.74% 21.82%
21.72% 21.98%
Urban TOTAL 7.41% 100.00%10.16% 16.63% 100.00%
100.00% 100.00% 19.38%100.00% 19.97%
20.64%100.00%
Note:Rural 56.56%
The total areas differ 51.40%
between the years due45.58% 36.63%
to some other 33.95% not being
land use categories 33.49%
State Forests 29.13% 32.38% 28.92% 27.74% 22.11% 21.98%
included such and roads and water bodies, which also underwent some changes. Source: Made by
TOTAL
author. 100.00% 100.00% 100.00% 100.00% 100.00% 100.00%
Note: The total areas differ between the years due to some other land use categories not being included such and
roads and water bodies, which also underwent some changes. Source: Made by author.Urban Sci. 2019, 3, 40 13 of 16
8. Conclusions
We presented a timeline of developmental milestones in WA since the founding of the Swan River
colony by the British Government. Following the three themes, we demonstrate how the transport
developments, planning regulations and economic milestones, contributed to the evolution of urban
form in Perth. We advanced the discussion into a focus on transport evolution and how it informed
the fashion in which the urban form evolved over the last century, and particularly during the era of
the MRSs.
A deconstruction of the timelines showed that planning regulation was limited in the early years
of the colony, as were land developments. However, as the population increased, it became imperative
to not only regulate current developments but also plan for future growth. Economically, the state
struggled for the better part of the nineteenth century. Agriculture, as the major industry driving
the economy, did not allow for much investment in development. The discovery of gold in the late
nineteenth century was a turning point for the state, allowing more investment in infrastructure (e.g.,
railways, electric trams and piped water). The population also increased rapidly due to interstate and
overseas immigration. Many of these people settled in Perth and created a land demand that propelled
urban expansion.
The city’s transformation to car dependence could also be ascribed to the flourishing economy,
as car ownership grew with commuting distances to newer outer suburbs. The transport
developments—which were also enabled by the economic growth, and provided for by the planning
regulations—supported or encouraged the sprawling urban footprint. In fact, the urban footprint
evolved around transport corridors such as the river and railways. The railways were, however,
overtaken by urban expansion from the late twentieth century, and newer ones were built to catch up
in already developed areas. This was a deviation from the olden trend where urban expansion was
heralded and shaped by transport infrastructure developments, and particularly railway developments
in the case of Perth.
With coastal developments stretching further north and south, and radial expansion around the
spine of the Swan River, Perth’s footprint developed into a triangular shape. As the triangle grew, its
shape changed from acute to obtuse triangle (with reference to the angle inland). Nonetheless, the
expansion has slowed down in the twenty-first century. This reflects the government’s efforts to limit
sprawl and densify developments.
Overall, the general trend has been an increase in population and urban expansion in the PMR
despite some challenges such as the world war, Great Depression and droughts. Considering the
mining boom that just ended, and indeed all those that have happened since the advent of the goldfields,
it is clear that the state will always have a ‘boom and bust’ economy. As such, planning in Perth
needs to incorporate this dimension, and anticipate depressions as a fabric of a mining-based economy.
This paper provides a historical benchmark of the city’s performance, which can help planners and
policy makers in managing urban expansion in the metropolitan area.
An important insight from this study is that public transport in the form of trams and trains had
great influence on the pattern of urban growth. These findings indicate that modern and future cities
could leverage the same kind of influence from similar transport modes such as heavy and light rail
transit. Sustainable growth could be induced by promoting higher density and mixed developments
in their catchment areas. A major challenge lies in increasing the competitiveness of public transport
against the car, particularly in the suburban areas where public transport is hugely uncompetitive [12].
This could be done through appropriate improvements to public transport efficiency including wider
geographic coverage and higher service frequency to reduce walking, waiting and transfer times.
For its relatively small population size, Perth has some of the longest distances between the
city centre and its suburbs particularly on the north-south dimension. This pattern is a product
of a combination of factors including escarpments which curtail easterly expansion, sea change or
coastal migration, and transport related factors such as the passenger train, freeways and high car
dependence and ownership. Together, these factors created a unique set of circumstances that haveUrban Sci. 2019, 3, 40 14 of 16
given metropolitan Perth an elongated urban footprint. This study has shown that the city spread
more widely as mobility became easier and more flexible. As a city that is now so reliant on the
ubiquitous and highly flexible automobile, strategies to mitigate unsustainable urban expansion are
particularly imperative. While new technological revolutions in transportation such as the autonomous
vehicle could continue to increase the ease of mobility, they also present a unique opportunity for
city authorities to introduce nuanced, powerful policies with which they could induce sustainable
urban growth.
Author Contributions: Conceptualization, K.K., J.C.X., M.S.H.S. and G.M.; Data curation, K.K.; Formal analysis,
K.K.; Investigation, K.K.; Methodology, K.K., J.C.X. and M.S.H.S.; Project administration, K.K. and J.C.X.; Resources,
K.K.; Software, K.K. and H.Z.; Supervision, J.C.X., M.S.H.S. and G.M.; Validation, G.M. and H.Z.; Visualization,
K.K.; Writing—original draft, K.K.; Writing—review & editing, K.K., J.C.X., M.S.H.S. and G.M.
Funding: This research received no external funding.
Acknowledgments: We express our utmost gratitude to Valerie Humphrey, the curator at Revolutions Transport
Museum, for her time and insightful comments for improving the manuscript. We are also grateful to the
Department of Planning WA for providing the MRS data. Last but not least, we would like to thank the editor at
this journal and the two anonymous reviewers for their valuable comments which greatly helped to improve
this work.
Conflicts of Interest: The authors declare no conflict of interest.
References
1. Glaeser, E.L.; Kahn, M.E. Sprawl and Urban Growth; Discussion Paper No. 2004; Harvard Institute of Economic
Research: Cambridge, MA, USA, 2003.
2. Goetz, A. Suburban Sprawl or Urban Centres: Tensions and Contradictions of Smart Growth Approaches in
Denver, Colorado. Urban Stud. 2013, 50, 2178–2195. [CrossRef]
3. United Nations Department of Economic and Social Affairs. World Population Prospects: The 2010 Revision;
UNDESA: New York, NY, USA, 2012.
4. United Nations Department of Economic and Social Affairs Population Division. World Urbanization Prospects:
The 2014 Revision, Highlights (ST/ESA/SER.A/352); United Nations: New York, NY, USA, 2014.
5. Osman, T.; Divigalpitiya, P.; Arima, T. Quantifying the Driving Forces of Informal Urbanization in the
Western Part of the Greater Cairo Metropolitan Region. Environments 2016, 3, 13. [CrossRef]
6. Lawler, J.J.; Lewis, D.J.; Nelson, E.; Plantinga, A.J.; Polasky, S.; Withey, J.C.; Helmers, D.P.; Martinuzzi, S.;
Pennington, D.; Radeloff, V.C. Projected land-use change impacts on ecosystem services in the United States.
Proc. Natl. Acad. Sci. USA 2014, 111, 7492–7497. [CrossRef]
7. Sumarga, E.; Hein, L. Mapping Ecosystem Services for Land Use Planning, the Case of Central Kalimantan.
Environ. Manag. 2014, 54, 84–97. [CrossRef]
8. Swetnam, R.D.; Fisher, B.; Mbilinyi, B.P.; Munishi, P.K.T.; Willcock, S.; Ricketts, T.; Mwakalila, S.; Balmford, A.;
Burgess, N.D.; Marshall, A.R.; et al. Mapping socio-economic scenarios of land cover change: A GIS method
to enable ecosystem service modelling. J. Environ. Manag. 2011, 92, 563–574. [CrossRef] [PubMed]
9. Metzger, M.J.; Rounsevell, M.D.A.; Acosta-Michlik, L.; Leemans, R.; Schröter, D. The vulnerability of
ecosystem services to land use change. Agric. Ecosyst. Environ. 2006, 114, 69–85. [CrossRef]
10. Wong, N.H.; Yu, C. Study of green areas and urban heat island in a tropical city. Habitat Int. 2005, 29, 547–558.
[CrossRef]
11. Wu, H.; Ye, L.-P.; Shi, W.-Z.; Clarke, K.C. Assessing the effects of land use spatial structure on urban heat
islands using HJ-1B remote sensing imagery in Wuhan, China. Int. J. Appl. Earth Obs. Geoinf. 2014, 32, 67–78.
[CrossRef]
12. Kelobonye, K.; McCarney, G.; Xia, J.; Swapan, M.S.H.; Mao, F.; Zhou, H. Relative accessibility analysis for
key land uses: A spatial equity perspective. J. Transp. Geogr. 2019, 75, 82–93. [CrossRef]
13. Levinson, D.M. Accessibility and the journey to work. J. Transp. Geogr. 1998, 6, 11–21. [CrossRef]
14. Cervero, R.; Rood, T.; Appleyard, B. Tracking accessibility: Employment and housing opportunities in the
San Francisco Bay Area. Environ. Plan. A 1999, 31, 1259–1278. [CrossRef]
15. Kelobonye, K.; Mao, F.; Xia, J.; Swapan, M.S.H.; McCarney, G. The Impact of Employment Self-Sufficiency
Measures on Commuting Time: Case Study of Perth, Australia. Sustainability 2019, 11, 1488. [CrossRef]Urban Sci. 2019, 3, 40 15 of 16
16. Catalán, B.; Saurí, D.; Serra, P. Urban sprawl in the Mediterranean? Landsc. Urban Plan. 2008, 85, 174–184.
[CrossRef]
17. Rubiera Morollón, F.; González Marroquin, V.M.; Pérez Rivero, J.L. Urban sprawl in Spain: Differences
among cities and causes. Eur. Plan. Stud. 2016, 24, 207–226. [CrossRef]
18. Bhatta, B. Analysis of Urban Growth and Sprawl from Remote Sensing Data; Advances in Geographic Information
Science: Berlin/Heidelberg, Germany, 2010. [CrossRef]
19. Knaap, G.-J.; Song, Y.; Ewing, R.; Clifton, K. Seeing the Elephant: Multi-Disciplinary Measures
of Urban Sprawl. 2005. Available online: http://smartgrowth.umd.edu/assets/documents/research/
knaapsongewingetal_2005.pdf (accessed on 29 March 2018).
20. Ewing, R.; Tian, G.; Lyons, T. Does compact development increase or reduce traffic congestion? Cities 2018,
72, 94–101. [CrossRef]
21. Zhao, P. Sustainable urban expansion and transportation in a growing megacity: Consequences of urban
sprawl for mobility on the urban fringe of Beijing. Habitat Int. 2010, 34, 236–243. [CrossRef]
22. Alexander, I.; McManus, P. A New Direction for Perth Transport? Urban Policy Res. 1992, 10, 6–13. [CrossRef]
23. Alexander, I.; Greive, S.; Hedgcock, D. Planning Perspectives from Western Australia: A Reader in Theory
and Practice; Alexander, I., Greive, S., Hedgcock, D., Bentley, W.A., Eds.; Fremantle Press: Fremantle,
Australia, 2010.
24. Falconer, R.; Newman, P.; Giles-Corti, B. Is practice aligned with the principles? Implementing New
Urbanism in Perth, Western Australia. Transp. Policy 2010, 17, 287–294. [CrossRef]
25. Curtis, C.; Mellor, R. Anticipating a New Railway: The Relevance of Transit-Oriented Development to
Businesses in a Car-Oriented City. Urban Policy Res. 2011, 29, 141–165. [CrossRef]
26. Troy, L. Planning perspectives from Western Australia: A reader in theory and practice. Aust. Geogr. 2012,
43, 102–104. [CrossRef]
27. Adams, T. Taming an urban frontier? Urban expansion and metropolitan spatial plans in Perth 1970–2005.
In Planning Perspectives from Western Australia: A Reader in Theory and Practice; Alexander, I., Greive, S.,
Hedgcock, D., Eds.; Fremantle Press: Fremantle, Australia, 2010; pp. 33–47.
28. Australian Bureau of Statistics. Regional Population Growth, Australia, 2014–2015: Western Australia.
Available online: http://www.abs.gov.au/ausstats/abs@.nsf/Previousproducts/3218.0Main%20Features402014-
15?opendocument&tabname=Summary&prodno=3218.0&issue=2014-15&num=&view= (accessed on 15
February 2018).
29. Australian Bureau of Statistics. A View of Housing Density in Perth, 2005–2009. Available online:
http://www.abs.gov.au/ausstats/abs@.nsf/Latestproducts/1367.5Feature%20Article102010 (accessed on 17
February 2018).
30. Demographia. Demographia World Urban Areas, 13th ed. 2017. Available online: https://docplayer.net/
67953524-Demographia-world-urban-areas-13-th-annual-edition-2017-04.html (accessed on 21 March 2018).
31. Antrop, M. Changing patterns in the urbanized countryside of Western Europe. Landsc. Ecol. 2000, 15,
257–270. [CrossRef]
32. Tan, R.; Liu, Y.; Liu, Y.; He, Q.; Ming, L.; Tang, S. Urban growth and its determinants across the Wuhan urban
agglomeration, central China. Habitat Int. 2014, 44, 268–281. [CrossRef]
33. Zhang, L.; Zhu, T.; Yao, S. Evolvement of urban spatial structure and main drives in Wuxi, China. Chin. Geogr.
Sci. 2005, 15, 309–314. [CrossRef]
34. Zhang, Q.; Su, S. Determinants of urban expansion and their relative importance: A comparative analysis of
30 major metropolitans in China. Habitat Int. 2016, 58, 89–107. [CrossRef]
35. Zhang, T.; Sun, B.; Li, W. The economic performance of urban structure: From the perspective of Polycentricity
and Monocentricity. Cities 2017, 68, 18–24. [CrossRef]
36. Culpeffer-Cooke, T.; Gunzburg, A.; Pleydell, I.D.; Brown, D.; Society, P.E.T. Tracks by the Swan: The Electric
Tram and Trolley Bus Era in Perth, Western Australia; Perth Electric Tramway Society: Perth, Australia, 2010.
37. Western Australian Planning Commission. Perth and Peel @ 3.5 Million; Department of Planning, Ed.; WAPC:
Perth, Australia, 2018.
38. Martinus, K.; Biermann, S. Commuting Across Perth and Peel: Unpacking Patterns, Measures and Policy
Implications; FACTBase Bulletin 46; The University of Western Australia and the Committee for Perth: Perth,
Australia, 2016.You can also read