Response of dust emissions in southwestern North America to 21st century trends in climate, CO2 fertilization, and land use: implications for air ...
←
→
Page content transcription
If your browser does not render page correctly, please read the page content below
Atmos. Chem. Phys., 21, 57–68, 2021
https://doi.org/10.5194/acp-21-57-2021
© Author(s) 2021. This work is distributed under
the Creative Commons Attribution 4.0 License.

Response of dust emissions in southwestern North America to
21st century trends in climate, CO2 fertilization, and land use:
implications for air quality
Yang Li1 , Loretta J. Mickley1 , and Jed O. Kaplan2
1 John   A. Paulson School of Engineering and Applied Sciences, Harvard University, Cambridge, MA, USA
2 Department   of Earth Sciences, The University of Hong Kong, Hong Kong SAR, China

Correspondence: Yang Li (yangli@seas.harvard.edu)

Received: 1 April 2020 – Discussion started: 15 April 2020
Revised: 1 October 2020 – Accepted: 5 November 2020 – Published: 4 January 2021

Abstract. Climate models predict a shift toward warmer and         tation cover declines significantly across most of the domain
drier environments in southwestern North America. The con-         by 2100, leading to widespread increases in fine dust con-
sequences of such a shift for dust mobilization and dust con-      centrations, especially in southeastern New Mexico (up to
centration are unknown, but they could have large implica-         ∼ 2.0 µg m−3 relative to the present day) and along the bor-
tions for human health, given the connections between dust         der between New Mexico and Mexico (up to ∼ 2.5 µg m−3 ).
inhalation and disease. Here we link a dynamic vegetation          Our results have implications for human health, especially
model (LPJ-LMfire) to a chemical transport model (GEOS-            for the health of the indigenous people who make up a large
Chem) to assess the impacts of future changes in three factors     percentage of the population in this region.
– climate, CO2 fertilization, and land use practices – on veg-
etation in this region. From there, we investigate the impacts
of changing vegetation on dust mobilization and assess the
net effect on fine dust concentration (defined as dust particles   1   Introduction
less than 2.5 µm in diameter) on surface air quality. We find
that surface temperatures in southwestern North America            The arid and semiarid region covering the southwestern US
warm by 3.3 K and precipitation decreases by nearly 40 % by        and northwestern Mexico is characterized by large concen-
2100 in the most extreme warming scenario (RCP8.5; RCP             trations of soil-derived dust particles in the lower atmo-
refers to Representative Concentration Pathway) in spring          sphere, especially in spring (Hand et al., 2016). By causing
(March, April, and May) – the season of greatest dust emis-        respiratory and cardiovascular diseases, fine dust particles –
sions. Such conditions reveal an increased vulnerability to        i.e., those particles with diameter less than 2.5 µm (PM2.5 ) –
drought and vegetation die-off. Enhanced CO2 fertilization,        can have negative effects on human health (Tong et al., 2017;
however, offsets the modeled effects of warming tempera-           Meng and Lu, 2007; Gorris et al., 2018). A key question is to
tures and rainfall deficit on vegetation in some areas of the      what extent will climate change and other factors influence
southwestern US. Considering all three factors in the RCP8.5       future dust concentrations in this region, which we define
scenario, dust concentrations decrease over Arizona and New        here as southwestern North America. In this study, we use
Mexico in spring by the late 21st century due to greater           a suite of models to predict the future influence of three fac-
CO2 fertilization and a more densely vegetated environment,        tors – climate change, increasing CO2 fertilization, and land
which inhibits dust mobilization. Along Mexico’s northern          use change – on vegetation in this region, and we assess the
border, dust concentrations increase as a result of the inten-     consequences for dust mobilization and dust concentrations.
sification of anthropogenic land use. In contrast, when CO2           Wind speed and vegetation cover are two key factors that
fertilization is not considered in the RCP8.5 scenario, vege-      determine soil erodibility and dust emissions. Wind gusts
                                                                   mobilize dust particles from the Earth’s surface, whereas

Published by Copernicus Publications on behalf of the European Geosciences Union.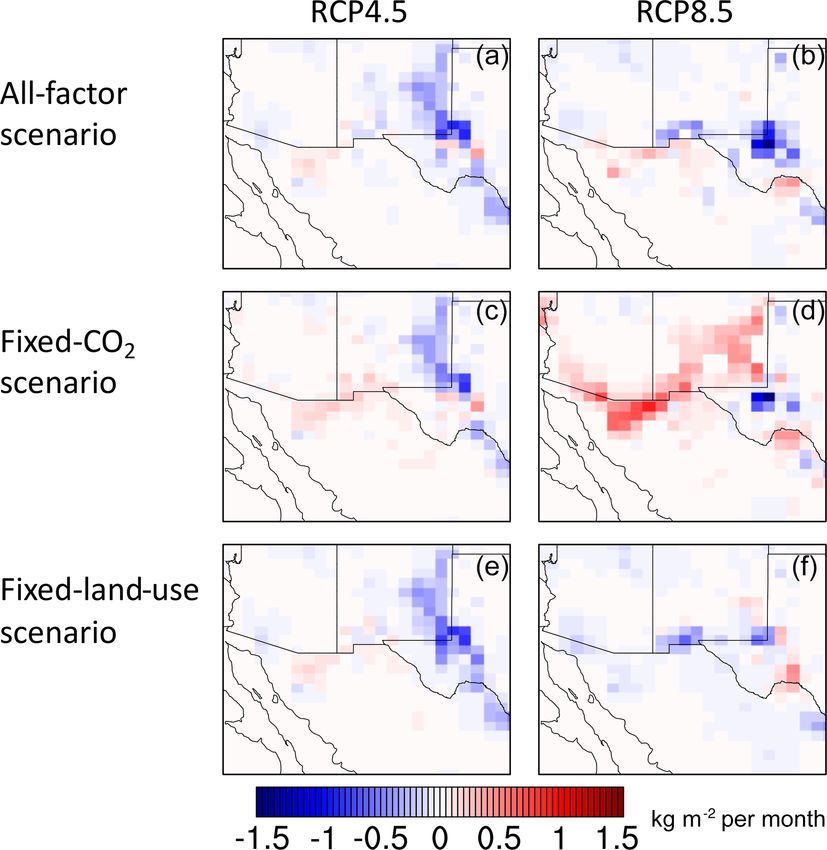
58                 Y. Li et al.: Response of dust emissions in southwestern North America to climate, CO2 , and land use

vegetation constrains dust emissions by reducing the ex-          port of regional fine dust. Tong et al. (2017) further deter-
tent of bare land and preserving soil moisture (Zender et         mined that the observed 240 % increase in the frequency of
al., 2003). The high temperatures and reduced soil moisture       windblown dust storms from the 1990s to the 2000s in the
characteristic of drought play an important role in dust mo-      southwestern US was likely associated with the PDO. Sim-
bilization, as the loss of vegetative cover during drought in-    ilarly, Achakulwisut et al. (2017) found that the 2002–2015
creases soil erosion (Archer and Predick, 2008; Bestelmeyer       increase in average March fine dust concentrations in this re-
et al., 2018).                                                    gion was driven by a combination of positive PDO condi-
   Southwestern North America is covered by desert grass-         tions and phase of the El Niño–Southern Oscillation. More
land, perennial grassland, savanna, desert scrub, and grassy      recently, Achakulwisut et al. (2018) identified the standard-
shrublands or woodlands (McClaran and Van Devender,               ized precipitation–evapotranspiration index as a useful indi-
1997). In recent decades, a gradual transition from grass-        cator of present-day dust variability. Applying that metric
lands to shrubland has been observed across much of this          to an ensemble of future climate projections, these authors
region, with increased aridity, atmospheric CO2 enrichment,       predicted increases of 26 %–46 % in fine dust concentrations
and livestock grazing all possibly playing a role in this trend   over the southwestern US in spring by 2100. In contrast, Pu
(Bestelmeyer et al., 2018). Future climate change may fur-        and Ginoux (2017) found that the frequency of extreme dust
ther prolong this transition, especially as shrubs fare better    days decreases slightly in spring in this region due to the re-
than grasses under a climate regime characterized by large        duced extent of bare land under 21st century climate change.
fluctuations in annual precipitation (Bestelmeyer et al., 2018;      These regional studies relied mainly on statistical models
Edwards et al., 2019). Climate models predict a warmer and        that relate local and/or large-scale meteorological conditions
drier environment in southwestern North America through           to dust emissions in southwestern North America. Pu and Gi-
the 21st century, with more frequent and severe drought           noux (2017) also considered changing LAI in their model,
(Seager and Vecchi, 2010; MacDonald, 2010; Stahle, 2020;          but these dust–LAI relationships were derived from a rela-
Prein et al., 2016; Williams et al., 2020). Such conditions       tively sparse dataset, casting some uncertainty on the results
would decrease vegetative cover and allow for greater dust        (Achakulwisut et al., 2018). In this study, we investigate the
mobilization. On the other hand, elevated CO2 concentra-          effects of climate change, increasing CO2 fertilization, and
tions in the future atmosphere could increase photosynthe-        future land use practices on vegetation in southwestern North
sis and decrease transpiration of some vegetation species, al-    America, and we examine the response of dust mobilization
lowing for more efficient water use and enhancing growth          due to these changes in vegetation. With regard to climate,
(Poorter and Perez-Soba, 2002; Polley et al., 2013). Anthro-      we examine whether a shift to warmer, drier conditions by
pogenic land use practices – e.g., agriculture, human settle-     2100 enhances dust mobilization in this region by reduc-
ment, and urban sprawl – have changed dramatically over           ing vegetation cover and exposing bare land. To that end,
southwestern North America in recent decades, with Ari-           we couple the LPJ-LMfire dynamic vegetation model to the
zona and New Mexico showing decreasing cropland area              GEOS-Chem chemical transport model to study vegetation
and northern Mexico experiencing increasing pasture area          dynamics and dust mobilization under different conditions
(Fig. S1 in the Supplement). Future land use practices could      and climate scenarios, allowing for the consideration of sev-
also influence the propensity for dust mobilization by dis-       eral factors driving future dust mobilization in southwestern
turbing crustal biomass (e.g., Belnap and Gillette, 1998).        North America. We focus on fine dust particles in springtime
   Previous studies have investigated the relative importance     (March, April, and May), because it is the season with the
of climate, CO2 fertilization, and/or land use in present-        highest dust concentrations in the southwestern US (Hand et
day and future dust emissions and concentrations, some-           al., 2017). Given the deleterious impacts of airborne dust on
times with contradictory results. For example, Woodward et        human health, our dust projections under different climate
al. (2005) predicted a tripling of the global dust burden by      scenarios have value for understanding the full array of po-
2100 relative to the present day, whereas other studies sug-      tential consequences of anthropogenic climate change.
gested a decrease in the global dust burden (e.g., Harrison
et al., 2001; Mahowald and Luo, 2003; Mahowald et al.,
2006). These estimates of future dust emissions depended in       2   Methods
large part on the choice of model applied, as demonstrated
by Tegen et al. (2004).                                           We examine dust mobilization in southwestern North Amer-
   In southwestern North America, a few recent studies have       ica, here defined as the area from 25 to 37◦ N and from 100 to
examined statistical relationships between observed present-      115◦ W (Fig. 1), during the late 21st century under scenarios
day dust concentrations and meteorological conditions or          of future climate and land use based on two Representative
leaf area index (LAI). Hand et al. (2016) found that fine dust    Concentration Pathways (RCPs). RCP4.5 and RCP8.5 cap-
concentrations in spring in this region correlated with the Pa-   ture two possible climate trajectories over the 21st century,
cific Decadal Oscillation (PDO), indicating the importance        beginning in 2006. RCP4.5 represents a scenario of moder-
of large-scale climate patterns in the mobilization and trans-    ate future climate change with a gradual reduction in green-

Atmos. Chem. Phys., 21, 57–68, 2021                                                   https://doi.org/10.5194/acp-21-57-2021
Y. Li et al.: Response of dust emissions in southwestern North America to climate, CO2 , and land use                               59

                                                                       Coupled Model Intercomparison Project (CMIP5; https://
                                                                       esgf-node.llnl.gov/search/cmip5/, last access: 17 July 2020).
                                                                       The simulations cover the years from 1801 to 2100 at a spa-
                                                                       tial resolution of 2◦ latitude × 2.5◦ longitude. Changes in cli-
                                                                       mate in the GISS model are driven by increasing greenhouse
                                                                       gases. In RCP4.5, CO2 concentrations increase to 550 ppm
                                                                       by 2100; in RCP8.5 the CO2 increases to 1960 ppm (Mein-
                                                                       shausen et al., 2011).
                                                                          Under RCP4.5, the GISS model predicts a slight increase
                                                                       of 0.45 K in the springtime mean surface temperatures and an
                                                                       increase in mean precipitation of ∼ 17 % over southwestern
                                                                       North America by the 2100 time slice (2095–2099), relative
                                                                       to the present day (2011–2015). In contrast, under RCP8.5,
                                                                       the 5-year mean springtime temperature increases signifi-
                                                                       cantly (by 3.29 K) by 2100 and mean precipitation decreases
                                                                       by ∼ 39 %. The spatial distributions of the changes in tem-
                                                                       perature and precipitation by 2100 under RCP8.5 are pre-
                                                                       sented in the Supplement (Fig. S2). In addition, lightning
Figure 1. Simulated changes in spring averaged monthly mean veg-       strike densities decrease by ∼ 0.006 strikes km−2 d−1 over
etation area index (VAI) in southwestern North America under the       Arizona in RCP4.5, but they increase by the same magnitude
three conditions for RCP4.5 and RCP8.5. Changes are between the        in this region in RCP8.5 (Li et al., 2020). Lightning strikes
present day and 2100, with 5 years representing each time period.      play a major role in wildfire ignition in this region, and wild-
The all-factor case (a, b) includes the effects of climate, CO2 fer-
                                                                       fires may influence landscape succession (e.g., Bodner and
tilization, and anthropogenic land use on vegetation; only climate
and land use are considered in the fixed-CO2 case (c, d); and only
                                                                       Robles, 2017). Finally, future surface wind speeds do not
climate and CO2 fertilization are considered in the fixed-land-use     change significantly under RCP4.5, but they increase slightly
case (e, f). Results are from LPJ-LMfire.                              by ∼ 4 % across southwestern North America under RCP8.5
                                                                       by 2100 (not shown). The increasing winds in RCP8.5 will
                                                                       influence the spread of fires in our study, but they will not
house gas (GHG) emissions after 2050 and a radiative forc-             affect the simulated dust fluxes directly, as described in more
ing at 2100 relative to preindustrial values of +4.5 W m−2 ,           detail below. Compared with predictions from other climate
whereas RCP8.5 represents a more extreme scenario with                 models, the GISS projections of climate change in south-
continued increases in GHGs throughout the 21st century and            western North America are conservative (Ahlström et al.,
a radiative forcing of +8.5 W m−2 at 2100. For each RCP, we            2012; Sheffield et al., 2013), implying that our predictions
investigate the changes in vegetation for three cases: (1) an          of the impact of climate change on dust mobilization may
all-factor case that includes changes in climate, land use, and        also be conservative.
CO2 fertilization; (2) a fixed-CO2 case that includes changes             In our study, we do not specifically track drought fre-
in only climate and land use; and (3) a fixed-land-use case            quency under future climate, as the definition of drought
that includes changes in only climate and CO2 fertilization.           is elusive (Andreadis et al., 2005; Van Loon et al., 2016).
   We use LPJ-LMfire, a dynamic global vegetation model,               Nonetheless, the meteorological conditions predicted in the
to estimate changes in vegetation under future conditions              RCP8.5 scenario for 2100 align with previous studies pro-
(Pfeiffer et al., 2013). Meteorology to drive LPJ-LMfire is            jecting an increased risk of drought in this region (e.g.,
taken from the Goddard Institute for Space Studies (GISS)              Williams et al., 2020), and, as we shall see, such conditions,
climate model (Nazarenko et al., 2015). Using the GEOS-                in the absence of CO2 fertilization, result in decreased vege-
Chem Harvard–NASA Emissions Component (HEMCO),                         tation and greater dust mobilization.
we then calculate dust emissions based on the LPJ-generated
vegetation area index (VAI) for all scenarios. We apply the            2.2   LPJ-LMfire
resulting dust emissions to the GEOS-Chem global chemi-
cal transport model to simulate the distribution of fine dust
across southwestern North America.                                     LPJ-LMfire is a dynamic vegetation model that includes a
                                                                       process-based representation of fire (Pfeiffer et al., 2013).
2.1   GISS ModelE                                                      Input to LPJ-LMfire includes meteorological variables, soil
                                                                       characteristics, land use, and atmospheric CO2 concentra-
Present-day and future meteorological fields for RCP4.5 and            tions, and the model then simulates the corresponding veg-
RCP8.5 are simulated by the GISS ModelE climate model                  etation structure, biogeochemical cycling, and wildfire at
(Nazarenko et al., 2015), configured for Phase 5 of the                a spatial resolution of 0.5◦ latitude × 0.5◦ longitude. Here

https://doi.org/10.5194/acp-21-57-2021                                                       Atmos. Chem. Phys., 21, 57–68, 2021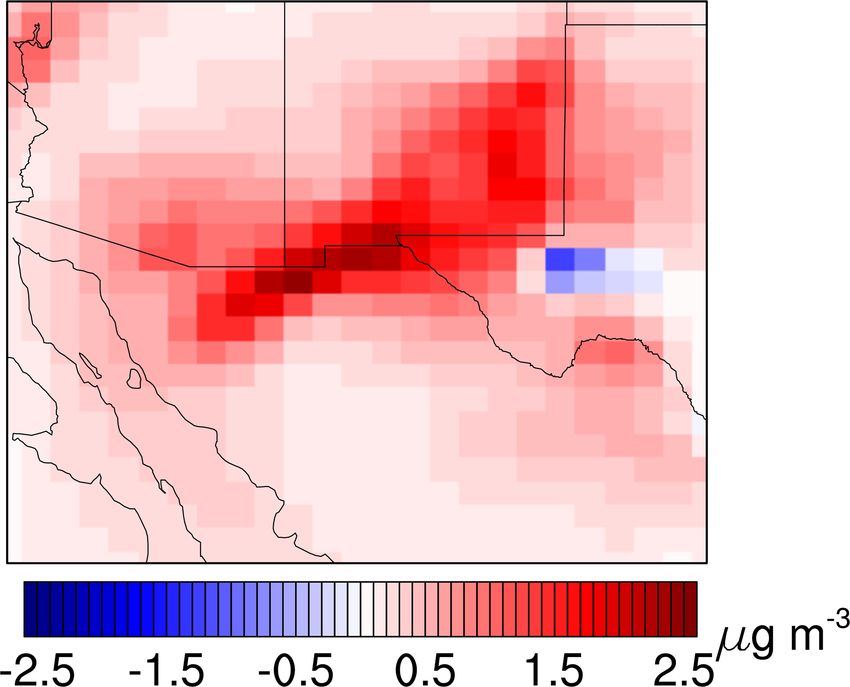
60                 Y. Li et al.: Response of dust emissions in southwestern North America to climate, CO2 , and land use

“vegetation structure” refers to vegetation types and the spa-     allowed to occur on cropland or rangeland, so we do con-
tial patterns in landscapes.                                       sider some land management. On the other hand, our model
   More specifically, LPJ-LMfire simulates the impacts of          does not account for the density of livestock on rangeland,
photosynthesis, evapotranspiration, and soil water dynamics        which, when mismanaged, can lead to a reduction in veg-
on vegetation structure and the population densities of differ-    etation cover and enhanced dust emissions. In RCP8.5, the
ent plants functional types (PFTs). The model considers the        extent of cropland and pasture cover increases by ∼ 30 % in
coupling of different ecosystem processes, such as the in-         Mexico but decreases by 10 %–20 % over areas along Mex-
teractions between CO2 fertilization, evapotranspiration, and      ico’s northern border in the US (Hurtt et al., 2011). Only mi-
temperature as well as the competition among different PFTs        nor changes in land use practices by 2100 are predicted under
for water resources (e.g., precipitation, surface runoff, and      RCP4.5 (Hurtt et al., 2011).
drainage). The different PFTs in LPJ-LMfire respond dif-              We perform global simulations with LPJ-LMfire on a
ferently to changing CO2 , with CO2 enrichment preferen-           0.5◦ × 0.5◦ grid for the two RCPs from 2006 to 2100, and
tially stimulating photosynthesis in woody vegetation and          we analyze results over southwestern North America, where
C3 grasses compared with C4 grasses (Polley et al., 2013).         dust emissions are especially high. For each RCP, we con-
Wildfire in LPJ-LMfire depends on lightning ignition, and          sider the effects of changing climate on land cover as well
the simulation considers multiday burning, coalescence of          as the influence of anthropogenic land use change and CO2
fires, and the spread rates of different vegetation types. The     fertilization. The LPJ-LMfire simulations yield monthly time
effects of changing fire activity on vegetation cover are then     series of the leaf area indices (LAI) and fractional vegetation
taken into account (Pfeiffer et al., 2013; Sitch et al., 2003;     cover (σv ) for nine plant functional types (PFTs): tropical
Chaste et al., 2019). Li et al. (2020) predicted a ∼ 50 % in-      broadleaf evergreen, tropical broadleaf raingreen, temperate
crease in fire-season area burned by 2100 under scenarios          needleleaf evergreen, temperate broadleaf evergreen, temper-
of both moderate and intense future climate change over the        ate broadleaf summergreen, boreal needleleaf evergreen, and
western US. However, the effects of changing fire on vege-         boreal summergreen trees, as well as C3 and C4 grasses. We
tation cover are insignificant in the grass- and bare-ground-      further discuss the LPJ-LMfire present-day land cover in the
dominated ecosystems of the desert Southwest, where low            Supplement.
biomass fuels cannot support the extensive spread of fires.
   For this study we follow Li et al. (2020) and link mete-        2.3   Vegetation area index calculation
orology from GISS-E2-R to LPJ-LMfire in order to capture
the effects of climate change on vegetation. Meteorological        Vegetation constrains dust emissions in two ways: (1) by
fields from the GISS model include monthly mean surface            competing with bare ground as a sink for atmospheric mo-
temperature, diurnal temperature range, total monthly pre-         mentum, which results in less drag on erodible soil (Nichol-
cipitation, number of days in the month with precipitation         son et al., 1998; Raupach, 1994), and (2) by enhancing
greater than 0.1 mm, monthly mean total cloud cover frac-          soil moisture through plant shade and root systems (Hillel,
tion, and monthly mean surface wind speed. Monthly mean            1982). Here, we implement the dust entrainment and depo-
lightning strike density, calculated using the GISS convective     sition (DEAD) scheme of Zender et al. (2003) to compute a
mass flux and the empirical parameterization of Magi (2015),       size-segregated dust flux, which includes entrainment thresh-
is also applied to LPJ-LMfire. To downscale the 2◦ × 2.5◦          olds for saltation, moisture inhibition, drag partitioning, and
GISS meteorology to a finer resolution for LPJ-LMfire, we          saltation feedback. The scheme assumes that vegetation sup-
calculate the 2010–2100 monthly anomalies relative to the          presses dust mobilization by linearly reducing the fraction of
average over the 1961–1990 period, and we then add these           bare soil exposed in each grid cell:
anomalies to an observationally based climatology (Pfeiffer
                                                                   Am = (1 − Al − Aw ) (1 − As ) (1 − AV ) ,                  (1)
et al., 2013). LPJ-LMfire then simulates the response of natu-
ral vegetation to the 21st century trends in these meteorolog-     where Al is the fraction of land covered by lakes, Aw is the
ical fields and to increasing CO2 . We apply the same changes      fraction covered by wetlands, As is the fraction covered by
in CO2 concentrations as those applied to the GISS model.          snow, and AV is the fraction covered by vegetation.
   We overlay the changes in natural land cover with future           For this study, we use the VAI as a metric to represent
land use scenarios from CMIP5 (Hurtt et al., 2011; http:           vegetation because it includes not only leaves but also stems
//tntcat.iiasa.ac.at/RcpDb/, last access: 17 July 2020). Such      and branches, all of which constrain dust emission. The VAI
land use includes agriculture, human settlement, and urban         is used to calculate AV in Eq. (1) as follows:
sprawl – all of which result in habitat loss and the fragmenta-
tion of forested landscapes. Present-day land use prepared for

                                                                   AV = min 1.0, min (VAI, VAIt ) /VAIt ,                     (2)
CMIP5 is taken from the HYDE database v3.1 (Klein Gold-
ewijk, 2001; Klein Goldewijk et al., 2011), which, in turn,        where VAIt is the threshold for the complete suppression of
is based on an array of sources, including satellite observa-      dust emissions – set here to 0.3 m2 m−2 (Zender et al., 2003;
tions and government statistics. In our simulations, fire is not   Mahowald et al., 1999).

Atmos. Chem. Phys., 21, 57–68, 2021                                                    https://doi.org/10.5194/acp-21-57-2021
Y. Li et al.: Response of dust emissions in southwestern North America to climate, CO2 , and land use 61
To compute the dust fluxes, we need to convert the LAI Chem. The calculated present-day VAI and fine dust emis-
from LPJ-LMfire to the VAI. The VAI is generally defined as sions are shown in Fig. S3, and we compare the modeled
the sum of the LAI plus the stem area index (SAI). Assuming VAI with that observed in Figs. S4 and S5.
immediate removal of all dead leaves, the fractional vegeta-
tion cover, σv , can be used to represent the SAI for the differ- 2.5 GEOS-Chem
ent PFTs (Zeng et al., 2002). Given that the threshold VAIt
for no dust emission is relatively low (0.3 m2 m−2 ), leaf area We use the aerosol-only version of the GEOS-Chem
dominates stem area in the suppression of dust mobilization chemical transport model (version 12.0.1; http://acmg.seas.
in the model. In areas where the LAI is greater than the SAI, harvard.edu/geos/, last access: 16 December 2020). For
we assume that the SAI does not play a role in controlling computational efficiency, we apply monthly mean oxidants
dust emissions, and we set the LAI equivalent to the VAI. archived from a full-chemistry simulation (Park et al., 2004).
We also assume that C3 and C4 grasses have zero stem area To isolate the effect of changing dust mobilization on air
to avoid overestimating the VAI during the winter and early quality over southwestern North America, we use present-
spring when such grasses are dead. Based on the method of day MERRA-2 reanalysis meteorology from the NASA
Zeng et al. (2002), with modifications, we calculate the VAI Global Modeling and Assimilation Office (Gelaro et al.,
in each grid cell as follows: 2017) for both the present-day and future GEOS-Chem sim-
ulations. In other words, we neglect the direct effects of fu-
ture changes in wind speeds on dust mobilization, allowing
!
X9 X7
VAI = max LAI σv , (3) us to focus instead on the indirect effects of changing vege-
PFT=1 PFT=1 tation on dust. For each time slice, we first carry out a global
GEOS-Chem simulation at a 4◦ latitude × 5◦ longitude spa-
where the LAI is for the nine PFTs from LPJ-LMfire, and tial resolution; we then downscale to 0.5◦ × 0.625◦ via grid
σv is for just seven PFTs, with σv for C3 and C4 grasses nesting over the North American domain. In this study, we
not considered. Of the nine PFTs, temperate needleleaf ev- focus only on dust particles in the finest size bin (i.e., with
ergreen, temperate broadleaf evergreen, temperate broadleaf radii of 0.1–1.0 µm), as these are most deleterious to human
summergreen, and C3 grasses dominate the region, with tem- health. We compare modeled fine dust concentrations over
perate needleleaf evergreen having the highest LAI in spring. southwestern North America for the present day against ob-
This mix of vegetation type is consistent with observations servations from the Interagency Monitoring of Protected Vi-
(e.g., McClaran and Van Devender, 1997). sual Environments (IMPROVE) network in Figs. S6–S7.
2.4 Calculation of dust emissions
3 Results
Dust emissions are calculated offline in the DEAD dust
mobilization module within the Harvard–NASA Emissions 3.1 Spatial shifts in the springtime vegetation area
Component (HEMCO). We feed both the VAI generated index
by LPJ-LMfire and meteorological fields from the Modern-
Era Retrospective analysis for Research and Applications Figure 1 shows large changes in the spatial distribution of
(MERRA-2) at a spatial resolution of 0.5◦ latitude × 0.625◦ the modeled springtime VAI in southwestern North America
longitude into the DEAD module (Gelaro et al., 2017). Dust for the three cases under both RCPs by 2100. In RCP4.5, the
emission is nonlinear with surface wind speed. Following distributions of changes in the VAI are similar for the all-
Ridley et al. (2013), we characterize subgrid-scale surface factor and fixed-land-use cases. Strong enhancements (up to
winds as a Weibull probability distribution, which allows ∼ 2.5 m2 m−2 ) extend across much of Arizona, especially in
saltation even when the grid-scale wind conditions are be- the northwestern corner. The model exhibits moderate VAI
low some specified threshold speed. The scheme assumes increases in most of New Mexico and in the forest regions
that the vertical flux of dust is proportional to the horizon- along the coast of northwestern Mexico. We find decreases
tal saltation flux, which, in turn, depends on surface friction in the modeled VAI (up to ∼ −1.6 m2 m−2 ) in the southwest-
velocity and the aerodynamic roughness length Z0 . As rec- ern corner of New Mexico, to the east of the coastal forests
ommended by Zender et al. (2003), and consistent with Fair- in Mexico, and in the forest regions near the Mexican bor-
lie et al. (2007) and Ridley et al. (2013), we uniformly set Z0 der connecting with southern Texas. The similarity between
to 100 µm across all dust candidate grid cells. the all-factor and fixed-land-use cases indicates the relatively
With this model setup, we calculate hourly dust emissions trivial influence of land use change on vegetation cover in
for two 5-year time slices for each RCP and condition, cov- RCP4.5, compared with the effects of climate change and
ering the present day (2011–2015) and the late 21st cen- CO2 fertilization. For the fixed-CO2 case, western New Mex-
tury (2095–2099). Dust emissions are generated for four size ico and northern Mexico show greater decreases in the VAI,
bins with respective radii of 0.1–1.0, 1.0–1.8, 1.8–3.0, and indicating how CO2 fertilization in the other two cases off-
3.0–6.0 µm. These dust emissions are then applied to GEOS- sets the effects of the warmer, drier climate on vegetation in
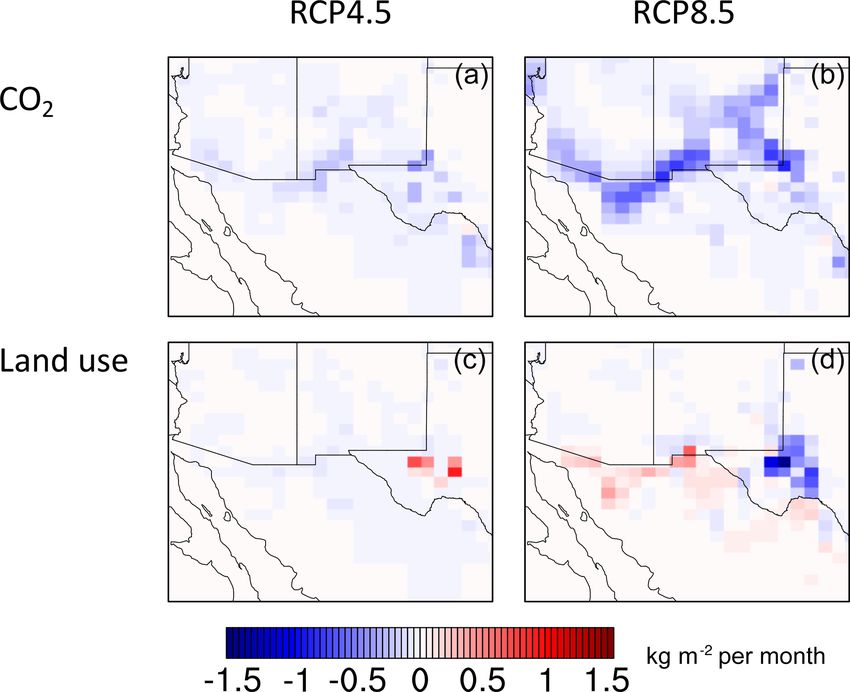
https://doi.org/10.5194/acp-21-57-2021 Atmos. Chem. Phys., 21, 57–68, 202162 Y. Li et al.: Response of dust emissions in southwestern North America to climate, CO2 , and land use this region. Figure S8 further illustrates the strong positive Mexico, and Texas (Fig. S9). The increases in Mexico result impacts that CO2 fertilization has on the VAI. in the fragmentation of forested landscapes and decrease the Compared with RCP4.5, the RCP8.5 scenario shows larger VAI, especially in coastal forest regions and along the border changes in climate, CO2 concentrations, and land use by with the US. 2100 (Fig. 1). The net effects of these changes on vegetation are complex. As in RCP4.5, Arizona experiences a strong in- 3.2 Spatial variations in spring fine dust emissions crease in the VAI in the all-factor and fixed-land-use cases, but this increase now extends to New Mexico. In contrast to Unlike the widespread changes in the VAI, future changes RCP4.5, the modeled VAI decreases in the coastal forest ar- in fine dust emissions are concentrated in a few arid ar- eas in northern Mexico in the all-factor case for RCP8.5. In eas, including (1) the border regions connecting Arizona, the fixed-land-use case, however, the VAI decrease in north- New Mexico, and northern Mexico (hereafter referred to as ern Mexico is nearly erased, indicating the role of vegetation the ANM border); (2) eastern New Mexico; and (3) west- and forest degradation caused by land use practices in this ern Texas (Fig. 2). In RCP4.5, slight increases in fine dust area (Fig. S9). For the fixed-CO2 case for RCP8.5, the VAI emission (up to ∼ 0.3 kg m−2 per month) are simulated in decreases in nearly all of southwestern North America, ex- the ANM border region in all the three cases. In contrast, cept the northeastern corner of Arizona and the northwestern fine dust emissions decrease by up to ∼ −1.0 kg m−2 per corner of New Mexico. month in eastern New Mexico and western Texas in RCP4.5 To better understand the changes in the VAI, we can exam- due to warmer temperatures and increasing VAI. Consistent ine changes in the LAI, which represents the major portion of with the modest changes in the VAI (Fig. 1), the three cases the VAI, for the four dominant plant functional types (PFTs) in RCP4.5 do not exhibit large differences, with only the in this region. For example, decreases in the LAI in the fixed- fixed-CO2 case showing slightly greater increases in dust CO2 case under RCP8.5 are dominated by the loss of tem- emissions along the ANM border and in western Texas. In perate broadleaf evergreen (TeBE) and temperate broadleaf RCP8.5 in the all-factor case, spring fine dust emissions in- summergreen (TeBS) (Fig. S10). Temperate needleleaf ev- crease slightly by up to ∼ 0.4 kg m−2 per month along the ergreen (TeNE) shows areas of increase in the northern part ANM border, but they decrease more strongly in western and south of Texas in this scenario, while both TeBE and Texas by up to ∼ −1.4 kg m−2 per month (Fig. 2). In con- TeBS show increases in northern Arizona and New Mex- trast, the sign of the change in dust emissions reverses for the ico. In other areas, TeBS reveals strong decreases, especially fixed-CO2 case, with significant emission increases along the in southern Arizona and Mexico. As predicted by previous ANM border and in New Mexico. The area with decreas- studies (Bestelmeyer et al., 2018; Edwards et al., 2019), C3 ing emissions in western Texas also shrinks in the fixed- perennial grasses (C3 gr) in this case decrease across a large CO2 case. These trends occur due to the climate stresses swath extending from Arizona through Mexico, showing the – e.g., warmer temperatures and decreased precipitation – impacts of warmer temperatures and reduced precipitation, that impair the growth of temperature broadleaf trees and C3 as well as (for Mexico) land use change. Increased fire ac- grasses. In this case, such stresses are not offset by CO2 fer- tivity also likely plays a role in the simulated decreases of tilization (Fig. S10). forest cover and C3 grasses for RCP8.5 in southern Arizona, Figure 3 more vividly shows the opposing roles of CO2 where fires and drought may have affected landscape suc- fertilization and projected land use change in southwestern cession (Williams et al., 2013; Bodner and Robles, 2017). North America. In RCP8.5, changing CO2 fertilization alone We also investigate trends in the LAI for different months in promotes vegetation growth and dramatically reduces dust spring from the present day to 2100. We find that the greatest mobilization by up to ∼ −1.2 kg m−2 per month. Figure 3 percentage decreases in TeBS and C3 grasses occur in May, also reveals that land use trends are a major driver of in- consistent with the largest decreases in precipitation in that creased dust emissions along the ANM border and in west- month (not shown). ern Texas in RCP8.5, as croplands and rangelands expand in In summary, we find that the warmer and drier conditions this region and temperature broadleaf trees decline (Hurtt et of the future climate strongly reduce vegetation cover by al., 2011). Similarly, the expansion of rangelands in north- 2100, especially in RCP8.5. In addition, CO2 fertilization ern Mexico in RCP8.5 reduces natural vegetation cover there and land use practices further modify future vegetation, al- (Hurtt et al., 2011), contributing to the increase of fine dust though in opposite ways, as illustrated by Fig. S8. Under a emissions by up to ∼ 0.7 kg m−2 per month. warmer climate, higher CO2 concentrations facilitate vege- tation growth everywhere in southwestern North America, 3.3 Spring fine dust concentrations under the with larger VAI increases occurring over Arizona and New high-emission scenario Mexico. Combined changes in anthropogenic land use – in- cluding cropland, pasture, and urban area – are greater under Our simulations suggest that fine dust emissions will in- RCP8.5 than under RCP4.5, with large increases in RCP8.5 crease across arid areas in southwestern North America un- across Mexico but only modest changes in Arizona, New der RCP8.5, although only if CO2 fertilization is of mini- Atmos. Chem. Phys., 21, 57–68, 2021 https://doi.org/10.5194/acp-21-57-2021
Y. Li et al.: Response of dust emissions in southwestern North America to climate, CO2 , and land use 63
Figure 4. Simulated changes in springtime mean concentrations of
fine dust over southwestern North America for the RCP8.5 fixed-
CO2 case, in which the effects of CO2 fertilization are neglected.
Changes are between the present day and 2100, with 5 years rep-
resenting each time period. Results are from GEOS-Chem simula-
tions at a 0.5◦ × 0.625◦ resolution.
mal importance (Fig. 2). To place an upper bound on future
concentrations of fine dust in this region, we apply only the
Figure 2. Simulated changes in spring averaged monthly mean dust fixed-CO2 emissions to GEOS-Chem at the horizontal res-
emission in southwestern North America under the three condi- olution of 0.5◦ × 0.625◦ . Given the large uncertainty in the
tions for RCP4.5 and RCP8.5. Changes are between the present day
sensitivity of vegetation to changing atmospheric CO2 con-
and 2100, with 5 years representing each time period. Panels (a)
and (b) show results for the all-factor condition, panels (c) and (d)
centrations (Smith et al., 2016), we argue that this approach
are for the fixed-CO2 condition, and panels (e) and (f) are for the is justified.
fixed-land-use condition. Cases are as described in Fig. 1. Results Results from GEOS-Chem in the fixed-CO2 case for
are generated offline using the GEOS-Chem emission component RCP8.5 show that the concentrations of spring fine dust
(HEMCO). are significantly enhanced in the southeastern half of New
Mexico and along the ANM border, with increases of up to
∼ 2.5 µg m−3 (Fig. 4). The model also yields elevated dust
concentrations over nearly the entire extent of our study re-
gion by 2100. As Fig. 3 implies, anthropogenic land use
along the ANM border contributes to the increased dust
emissions in that area, by up to ∼ 0.7 kg m−2 per month.
Climate change impacts on natural vegetation, however, ac-
count for the bulk of the modeled increases in dust emis-
sions in this scenario, by as much as ∼ 1.2 kg m−2 per month
(Fig. 2). The modeled wind fields, which are the same in all
scenarios, transport the dust from source regions, leading to
the enhanced concentrations across much of the domain, as
seen in Fig. 4. We find that dust concentrations decrease only
in a limited area in western Texas due to decreased pasture
(Figs. 3 and S9).
4 Discussion
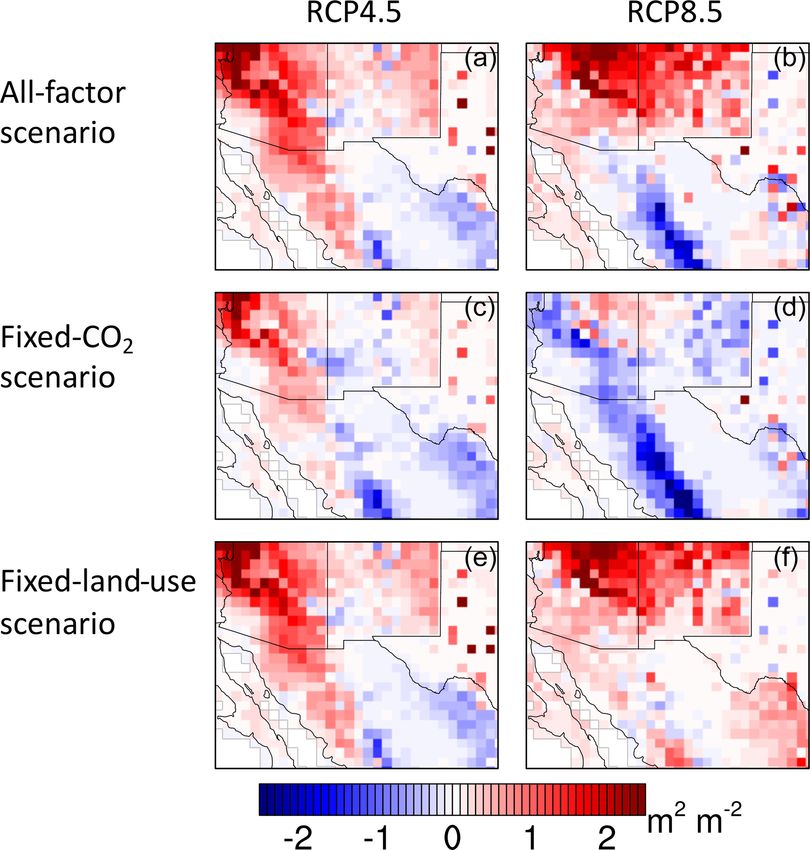
Figure 3. Contributions of CO2 fertilization and land use change to We apply a coupled modeling approach to investigate the im-
changing dust emissions in spring in southwestern North America pact of future changes in climate, CO2 fertilization, and an-
for RCP4.5 and RCP8.5. Changes are between the present day and
thropogenic land use on dust mobilization and fine dust con-
2100, with 5 years representing each time period. Panels (a) and
centration in southwestern North America by the end of the
(b) show the response of dust emission to only CO2 fertilization,
and panels (c) and (d) show the response to only trends in land 21st century. Table 1 summarizes our findings for the two
use. Results are generated offline using the GEOS-Chem emission RCP scenarios and three conditions – all-factor, fixed-CO2 ,
component (HEMCO). and fixed-land-use conditions – in spring, when dust concen-
trations are greatest. We find that in the RCP8.5 fixed-CO2
scenario, in which the effects of CO2 fertilization are ne-
https://doi.org/10.5194/acp-21-57-2021 Atmos. Chem. Phys., 21, 57–68, 202164 Y. Li et al.: Response of dust emissions in southwestern North America to climate, CO2 , and land use
glected, the VAI decreases by 26 % across the region due bilization under the two RCPs in southwestern North Amer-
mainly to warmer temperatures and drier conditions, yield- ica.
ing an increase of 58 % in fine dust emission averaged over In summary, we find that as atmospheric CO2 levels rise,
southwestern North America. In addition, we find that the the effect of enhanced CO2 fertilization boosts vegetation
increase in fine dust emission in northern Mexico is mainly growth and decreases dust mobilization, offsetting the im-
driven by the increases in the extent of cropland and pasture pacts of warmer temperatures and reduced rainfall, at least
cover in this area, signifying the crucial role of land use prac- in some areas. These results are consistent with evidence
tices in modifying dust mobilization. that enhanced CO2 fertilization is already occurring in arid
Our findings with respect to a diminished VAI in the future or semiarid environments like southwestern North America
atmosphere are consistent with observed trends in vegetation (Donohue et al., 2013; Haverd et al., 2020). In such environ-
during recent droughts in this region. For example, Bres- ments, water availability is the dominant constraint on veg-
hears et al. (2005) documented large-scale die-off of over- etation growth, and the recent enhancement of atmospheric
story trees across southwestern North America in 2002–2003 CO2 may have reduced stomatal conductance and limited
in response to short-term drought accompanied by bark bee- evaporative water loss. However, the effects of CO2 fertil-
tle infestations. Similarly, during a multiyear (2004–2014) ization on vegetation growth are uncertain and may be atten-
drought in southern Arizona, Bodner and Robles (2017) uated by the limited supply of nitrogen and phosphorus in
found that the spatial extent of both C4 grass cover and shrub soil (Wieder et al., 2015). These nutritional constraints vary
cover decreased in the southeastern part of that state. greatly among different PFTs (Shaw et al., 2002; Nadelhoffer
The 58 % increase predicted in this study in the fixed- et al., 1999).
CO2 RCP8.5 scenario is larger than the 26 %–46 % future Understanding the drivers in historic dust trends has some-
increases in fine dust for this region predicted by the statisti- times been challenging (Mahowald and Luo, 2003; Ma-
cal model of Achakulwisut et al. (2018). That study relied howald et al., 2002), making it difficult to validate dust
solely on predictions of future regional-scale meteorology mobilization models. A further drawback of our approach
and did not consider the change in vegetation, as we do here. is that the LPJ-LMfire model is driven by meteorological
In contrast, the statistical model of Pu and Ginoux (2017) fields from just one climate model, GISS-E2-R. Given that
estimated a 2 % decrease in the springtime frequency of ex- the GISS model yields a conservative prediction of climate
treme dust events in the southwestern US, driven mainly by change in southwestern North America compared with other
reductions in the bare-ground fraction and wind speed. Like models (Ahlström et al., 2012; Sheffield et al., 2013), our
Pu and Ginoux (2017), we also find that dust emissions de- predictions of the impact of climate change on dust mo-
crease across a broad region of the Southwest when CO2 fer- bilization may also be conservative. Other uncertainties in
tilization is taken into account, as shown in Fig. 2. Pu and our study can be traced to the dust simulation. The differ-
Ginoux (2017) relied on limited data for capturing the sen- ent vegetation types in our model are quantified as frac-
sitivity of dust event frequency to land cover in this region, tions of grid cells, which have relatively large spatial dimen-
and neither that study nor Achakulwisut et al. (2018) consid- sions of ∼ 50 km × 60 km. This means the model cannot cap-
ered changes in land use, as we do here. The direct effects of ture the spatial heterogeneity of land cover, and the aerody-
changing wind speed on dust mobilization, however, are not namic sheltering effects of vegetation on wind erosion are
included in our study, but they could be tested in future work. neglected, as they are in most 3-D global model studies. Such
We further find that consideration of CO2 fertilization can sheltering could play a large role in dust mobilization (e.g.,
mitigate the effects of changing climate and land use on Liu et al., 1990). New methods involving satellite observa-
dust concentrations in southwestern North America. The all- tions of surface albedo promise to improve understanding of
factor and fixed-land-use simulations both yield decreases of the effects of aerodynamic sheltering on dust mobilization,
∼ 20 % in mean dust emissions compared with the early 21st at least for the present day (Chappell and Webb, 2016; Webb
century. In the Intergovernmental Panel on Climate Change and Pierre, 2018). Implementation of aerodynamic shelter-
(IPCC) projections, CO2 reaches ∼ 550 ppm by 2100 un- ing in simulations of future climate regimes would need to
der RCP4.5 and ∼ 1960 ppm under RCP8.5 (Meinshausen account for fine-scale spatial distributions of vegetation. In
et al., 2011). Correspondingly, in the RCP4.5 scenario for addition, as recommended by Zender et al. (2003), we apply
2100, CO2 fertilization enhances the VAI by 30 % in the all- a globally uniform surface roughness Z0 in the model, which
factor case compared with the fixed-CO2 case (1.07 m2 m−2 means that the impact of changing vegetation conditions on
vs. 0.79 m2 m−2 ); in RCP 8.5, the 2100 enhancement is 64 % friction velocity is not taken into account. Future work could
(1.11 m2 m−2 vs. 0.55 m2 m−2 ), as shown in Table 1. These address this weakness by varying the friction velocity ac-
enhancements further decrease fine dust emissions by 21 % cording to the vegetation type. Finally, our study only focuses
under RCP4.5 and 78 % under RCP8.5, compared with the on the effect of changing vegetation on dust mobilization and
present day. Except along the ANM border and a few other does not consider how changing wind speeds or drier soils
areas, trends in land use have only minor impacts on dust mo- in the future atmosphere may more directly influence dust.
Given the slight increase in monthly mean winds in RCP8.5
Atmos. Chem. Phys., 21, 57–68, 2021 https://doi.org/10.5194/acp-21-57-2021Y. Li et al.: Response of dust emissions in southwestern North America to climate, CO2 , and land use 65
Table 1. The averaged spring vegetation area index (VAI) and fine dust emission in southwestern North America for the present day and future
for two scenarios (RCP4.5 and RCP8.5) and three cases. The all-factor case includes changes in climate, land use, and CO2 fertilization;
the fixed-CO2 case includes changes in only climate and land use; and the fixed-land-use case includes changes in only climate and CO2 .
The rows labeled “2100–2010 (%)” give the percentage changes in the VAI and fine dust emissions between the present day and future, with
positive values denoting increases in the future.
VAIb (m2 m−2 ) Fine dust emissionb (kg m−2 per month)
All factor Fixed CO2 Fixed land use All factor Fixed CO2 Fixed land use
RCP4.5 2010a 0.75 ± 0.26 0.71 ± 0.24 0.75 ± 0.26 0.10 ± 0.07 0.11 ± 0.08 0.10 ± 0.07
2100a 1.07 ± 0.48 0.79 ± 0.34 1.07 ± 0.48 0.08 ± 0.04 0.10 ± 0.05 0.08 ± 0.04
2100–2010 (%) 42 12 42 −25 −4 −26
RCP8.5 2010a 0.80 ± 0.27 0.75 ± 0.24 0.75 ± 0.24 0.09 ± 0.04 0.09 ± 0.05 0.09 ± 0.04
2100a 1.11 ± 0.71 0.55 ± 0.33 0.55 ± 0.33 0.07 ± 0.04 0.14 ± 0.09 0.07 ± 0.06
2100–2010 (%) 38 −26 52 −20 58 −16
a Each time slice represents 5 years (i.e., 2011–2015 represents the 2010 time slice, and 2095–2099 represents the 2100 time slice); b values are
spring (MAM) averages over southwestern North America.
by 2100, future dust emissions in this scenario could be un- Code and data availability. GEOS-Chem model codes can be ob-
derestimated. tained at http://acmg.seas.harvard.edu/geos (GEOS-Chem Support
Within these limitations, our study quantifies the poten- Team, 2020). LPJ-LMfire model codes can be obtained at https://
tial impacts of changing land cover and land use practices github.com/ARVE-Research/LPJ-LMfire (Kaplan et al., 2018). IM-
on dust mobilization and fine dust concentration over the PROVE datasets are available online at http://vista.cira.colostate.
edu/improve (IMPROVE Steering Committee, 2020). The GISS-
coming century in southwestern North America. Our work
E2-R dataset was downloaded from https://esgf-node.llnl.gov/
builds on previous studies focused on future dust in this re- search/cmip5/ (NASA Goddard Institute for Space Studies (GISS),
gion by (1) more accurately capturing the transport of dust 2020). The harmonized dataset of land use scenarios is available
from source regions with a dynamical 3-D model, (2) consid- online at http://tntcat.iiasa.ac.at/RcpDb/ (Land-use Harmonization
ering results with and without CO2 enhancement, and (3) in- Team, 2020). Any additional information related to this paper may
cluding the impact of land use trends. Given the many uncer- be requested from the authors.
tainties, it is challenging to gauge which of the three factors
investigated here – climate impacts on vegetation, CO2 fer-
tilization, or land use change – will play the dominant role in Supplement. The supplement related to this article is available on-
driving future changes in dust emissions and concentrations. line at: https://doi.org/10.5194/acp-21-57-2021-supplement.
Thus, this study brackets a range of possible dust scenarios
for southwestern North America, with the simulation with-
out CO2 fertilization placing an upper bound on dust emis- Author contributions. YL conceived and designed the study, per-
sions. In the absence of increased CO2 fertilization, our work formed the GEOS-Chem simulations, analyzed the data, and wrote
suggests that vegetated area will contract in response to the the paper, with contributions from all coauthors. JOK performed the
LPJ-LMfire simulations. LJM conducted critical revisions of the ar-
warmer, drier climate, exposing bare land and significantly
ticle.
increasing dust concentrations by 2100.
Dust enhancement could thus impose a potentially large
climate penalty on PM2.5 air quality, with consequences for Competing interests. The authors declare that they have no conflict
human health across much of southwestern North America, of interest.
where much of the current population is of Native Amer-
ican and/or Latino descent. In New Mexico for example,
10 % of the population is Native American and 50 % iden- Disclaimer. The views expressed in this document are solely those
tifies as either Hispanic or Latino. By some measures, New of the authors and do not necessarily reflect those of the EPA.
Mexico has also one of highest poverty rates in the US
(https://www.census.gov/quickfacts/NM, last access: 20 Au-
gust 2020). In this way, our finding of the potential for an Acknowledgements. This research was developed under assistance
increased dust burden in the future atmosphere has special agreements 83587501 and 83587201 awarded by the US Environ-
relevance for environmental justice in this region. mental Protection Agency (EPA). It has not been formally reviewed
by the EPA. We thank all of the data providers of the datasets used in
https://doi.org/10.5194/acp-21-57-2021 Atmos. Chem. Phys., 21, 57–68, 202166 Y. Li et al.: Response of dust emissions in southwestern North America to climate, CO2 , and land use
this study. PM data were provided by the Interagency Monitoring of Archer, S. R. and Predick, K. I.: Climate change and ecosystems of
Protected Visual Environments (IMPROVE; available online at http: the southwestern United States, Rangelands, 30, 23–28, 2008.
//vista.cira.colostate.edu/improve, last access: 16 December 2020). Belnap, J. and Gillette, D. A.: Vulnerability of desert biological soil
IMPROVE is a collaborative association of state, tribal, and fed- crusts to wind erosion: the influences of crust development, soil
eral agencies, and international partners. The US Environmental texture, and disturbance, J. Arid Environ., 39, 133–142, 1998.
Protection Agency is the primary funding source, with contracting Bestelmeyer, B. T., Peters, D. P. C., Archer, S. R., Browning,
and research support from the National Park Service. Jed O. Ka- D. M., Okin, G. S., Schooley, R. L., and Webb, N. P.: The
plan is grateful for access to computing resources provided by the Grassland–Shrubland Regime Shift in the Southwestern United
School of Geography and the Environment, University of Oxford. States: Misconceptions and Their Implications for Management,
The Air Quality Group at the University of California, Davis is BioScience, 68, 678–690, https://doi.org/10.1093/biosci/biy065,
the central analytical laboratory, with ion analysis provided by the 2018.
Research Triangle Institute, and carbon analysis provided by the Bodner, G. S. and Robles, M. D.: Enduring a decade of drought:
Desert Research Institute. We acknowledge the World Climate Re- Patterns and drivers of vegetation change in a semi-arid grass-
search Programme’s Working Group on Coupled Modelling, which land, J. Arid Environ., 136, 1–14, 2017.
is responsible for CMIP, and we thank the NASA Goddard Institute Breshears, D. D., Cobb, N. S., Rich, P. M., Price, K. P., Allen,
for Space Studies group for producing and making available their C. D., Balice, R. G., Romme, W. H., Kastens, J. H., Floyd, M.
GISS-E2-R climate model output. For CMIP, the US Department L., Belnap, J., Anderson, J. J., Myers, O. B., and Meyer, C.
of Energy’s Program for Climate Model Diagnosis and Intercom- W.: Regional vegetation die-off in response to global-change-
parison provides coordinating support and led development of soft- type drought, P. Natl. Acad. Sci. USA, 102, 15144–15148,
ware infrastructure in partnership with the Global Organization for https://doi.org/10.1073/pnas.0505734102, 2005.
Earth System Science Portals. The GISS-E2-R dataset was down- Chappell, A. and Webb, N. P.: Using albedo to reform wind erosion
loaded from https://esgf-node.llnl.gov/search/cmip5/ (last access: modelling, mapping and monitoring, Aeolian Res., 23, 63–78,
16 December 2020). We thank the Land-use Harmonization team 2016.
for producing the harmonized set of land use scenarios and mak- Chaste, E., Girardin, M. P., Kaplan, J. O., Bergeron, Y., and Hély,
ing the dataset available online at http://tntcat.iiasa.ac.at/RcpDb/ C.: Increases in heat-induced tree mortality could drive reduc-
(last access: 16 December 2020). We also thank the founder, or- tions of biomass resources in Canada’s managed boreal forest,
ganizers, and participants of the Degree Confluence Project (http: Landscape Ecol., 34, 403–426, 2019.
//www.confluence.org, last access: 16 December 2020). Donohue, R. J., Roderick, M. L., McVicar, T. R., and Farquhar, G.
D.: Impact of CO2 fertilization on maximum foliage cover across
the globe’s warm, arid environments, Geophys. Res. Lett., 40,
Financial support. This research has been supported by the US 3031–3035, 2013.
Environmental Protection Agency (grant nos. 83587501 and Edwards, B., Webb, N., Brown, D., Elias, E., Peck, D., Pierson, F.,
83587201). Williams, C., and Herrick, J.: Climate change impacts on wind
and water erosion on US rangelands, J. Soil Water Conserv., 74,
405–418, 2019.
Review statement. This paper was edited by Alex B. Guenther and Fairlie, T. D., Jacob, D. J., and Park, R. J.: The impact of transpacific
reviewed by Nicholas Webb and one anonymous referee. transport of mineral dust in the United States, Atmos. Environ.,
41, 1251–1266, 2007.
Gelaro, R., McCarty, W., Suarez, M. J., Todling, R., Molod, A.,
Takacs, L., Randles, C., Darmenov, A., Bosilovich, M. G., Re-
ichle, R., Wargan, K., Coy, L., Cullather, R., Draper, C., Akella,
References S., Buchard, V., Conaty, A., da Silva, A., Gu, W., Kim, G. K.,
Koster, R., Lucchesi, R., Merkova, D., Nielsen, J. E., Partyka,
Achakulwisut, P., Shen, L., and Mickley, L. J.: What con- G., Pawson, S., Putman, W., Rienecker, M., Schubert, S. D.,
trols springtime fine dust variability in the western United Sienkiewicz, M., and Zhao, B.: The Modern-Era Retrospective
States? Investigating the 2002–2015 increase in fine dust in the Analysis for Research and Applications, Version 2 (MERRA-2),
U.S. Southwest, J. Geophys. Res.-Atmos., 122, 12449–12467, J. Climate, 30, 5419–5454, https://doi.org/10.1175/JCLI-D-16-
https://doi.org/10.1002/2017JD027208, 2017. 0758.1, 2017.
Achakulwisut, P., Mickley, L., and Anenberg, S.: Drought- GEOS-Chem Support Team (Harvard University and Dalhousie
sensitivity of fine dust in the US Southwest: Implications for University): GEOS-Chem, available at: http://acmg.seas.harvard.
air quality and public health under future climate change, edu/geos, last access: 22 December 2020.
Environ. Res. Lett., 13, 054025, https://doi.org/10.1088/1748- Gorris, M. E., Cat, L. A., Zender, C. S., Treseder, K. K., and Ran-
9326/aabf20, 2018. derson, J. T.: Coccidioidomycosis Dynamics in Relation to Cli-
Ahlström, A., Schurgers, G., Arneth, A., and Smith, B.: Robust- mate in the Southwestern United States, Geohealth, 2, 6–24,
ness and uncertainty in terrestrial ecosystem carbon response https://doi.org/10.1002/2017GH000095, 2018.
to CMIP5 climate change projections, Environ. Res. Lett., 7, Hand, J., White, W., Gebhart, K., Hyslop, N., Gill, T., and Schichtel,
044008, https://doi.org/10.1088/1748-9326/7/4/044008, 2012. B.: Earlier onset of the spring fine dust season in the southwest-
Andreadis, K. M., Clark, E. A., Wood, A. W., Hamlet, A. F., and ern United States, Geophys. Res. Lett., 43, 4001–4009, 2016.
Lettenmaier, D. P.: Twentieth-century drought in the contermi-
nous United States, J. Hydrometeorol., 6, 985–1001, 2005.
Atmos. Chem. Phys., 21, 57–68, 2021 https://doi.org/10.5194/acp-21-57-2021Y. Li et al.: Response of dust emissions in southwestern North America to climate, CO2 , and land use 67 Hand, J., Gill, T., and Schichtel, B.: Spatial and seasonal variabil- Mahowald, N. M., Zender, C. S., Luo, C., Savoie, D., Torres, O., ity in fine mineral dust and coarse aerosol mass at remote sites and Del Corral, J.: Understanding the 30-year Barbados desert across the United States, J. Geophys. Res.-Atmos., 122, 3080– dust record, J. Geophys. Res.-Atmos., 107, AAC 7-1–AAC 7-16, 3097, 2017. 2002. Harrison, S. P., Kohfeld, K. E., Roelandt, C., and Claquin, T.: The Mahowald, N. M., Muhs, D. R., Levis, S., Rasch, P. J., Yoshioka, role of dust in climate changes today, at the last glacial maximum M., Zender, C. S., and Luo, C.: Change in atmospheric mineral and in the future, Earth-Sci. Rev., 54, 43–80, 2001. aerosols in response to climate: Last glacial period, preindustrial, Haverd, V., Smith, B., Canadell, J. G., Cuntz, M., Mikaloff-Fletcher, modern, and doubled carbon dioxide climates, J. Geophys. Res.- S., Farquhar, G., Woodgate, W., Briggs, P. R., and Trudinger, C. Atmos., 111, D10202, https://doi.org/10.1029/2005JD006653, M.: Higher than expected CO2 fertilization inferred from leaf to 2006. global observations, Glob. Change Biol., 26, 2390–2402, 2020. McClaran, M. P. and Van Devender, T. R.: The desert grassland, Hillel, D.: Introduction to soil physics.,(Academic Press: San University of Arizona Press, Tucson, AZ, USA, 1997. Diego, CA), Introduction to soil physics, Academic Press, San Meinshausen, M., Smith, S. J., Calvin, K., Daniel, J. S., Kainuma, Diego, CA, USA, 1982. M., Lamarque, J.-F., Matsumoto, K., Montzka, S., Raper, S., Hurtt, G. C., Chini, L. P., Frolking, S., Betts, R., Feddema, J., Fis- and Riahi, K.: The RCP greenhouse gas concentrations and cher, G., Fisk, J., Hibbard, K., Houghton, R., and Janetos, A.: their extensions from 1765 to 2300, Climatic Change, 109, 213, Harmonization of land-use scenarios for the period 1500–2100: https://doi.org/10.1007/s10584-011-0156-z, 2011. 600 years of global gridded annual land-use transitions, wood Meng, Z. and Lu, B.: Dust events as a risk factor for daily hospi- harvest, and resulting secondary lands, Climatic Change, 109, talization for respiratory and cardiovascular diseases in Minqin, 117, https://doi.org/10.1007/s10584-011-0153-2, 2011. China, Atmos. Environ., 41, 7048–7058, 2007. IMPROVE Steering Committee: IMPROVE datasets, available at: Nadelhoffer, K. J., Emmett, B. A., Gundersen, P., Kjønaas, O. http://vista.cira.colostate.edu/improve, last access: 22 Decem- J., Koopmans, C. J., Schleppi, P., Tietema, A., and Wright, ber 2020. R. F.: Nitrogen deposition makes a minor contribution to car- Kaplan, J. O., Pfeiffer, M., and Chaste, E.: ARVE- bon sequestration in temperate forests, Nature, 398, 145–148, Research/LPJ-LMfire: LPJ-LMfire (Version v1.3), Zenodo, https://doi.org/10.1038/18205, 1999. https://doi.org/10.5281/zenodo.1184589, 2018. NASA Goddard Institute for Space Studies (GISS): GISS-E2- Klein Goldewijk, K.: Estimating global land use change over the R dataset, available at: https://esgf-node.llnl.gov/search/cmip5/, past 300 years: the HYDE database, Global Biogeochem. Cy., last access: 22 December 2020. 15, 417–433, https://doi.org/10.1029/1999GB001232, 2001. Nazarenko, L., Schmidt, G., Miller, R., Tausnev, N., Kelley, M., Klein Goldewijk, K., Beusen, A., Van Drecht, G. and De Vos, Ruedy, R., Russell, G., Aleinov, I., Bauer, M., and Bauer, S.: Fu- M.: The HYDE 3.1 spatially explicit database of human-in- ture climate change under RCP emission scenarios with GISS duced global land-use change over the past 12,000 years, Global ModelE2, J. Adv. Model. Earth Syst., 7, 244–267, 2015. Ecol. Biogeogr., 20, 73–86, https://doi.org/10.1111/j.1466- Nicholson, S. E., Tucker, C. J., and Ba, M.: Desertification, drought, 8238.2010.00587.x, 2011. and surface vegetation: An example from the West African Sahel, Land-use Harmonization Team: Dataset of land use scenarios, avail- B. Am. Meteorol. Soc., 79, 815–830, 1998. able at: http://tntcat.iiasa.ac.at/RcpDb/, last access: 22 Decem- Park, R. J., Jacob, D. J., Field, B. D., Yantosca, R. M., and ber 2020. Chin, M.: Natural and transboundary pollution influences on Li, Y., Mickley, L. J., Liu, P., and Kaplan, J. O.: Trends and spa- sulfate-nitrate-ammonium aerosols in the United States: Im- tial shifts in lightning fires and smoke concentrations in response plications for policy, J. Geophys. Res.-Atmos., 109, D15204, to 21st century climate over the national forests and parks of https://doi.org/10.1029/2003JD004473, 2004. the western United States, Atmos. Chem. Phys., 20, 8827–8838, Pfeiffer, M., Spessa, A., and Kaplan, J. O.: A model for global https://doi.org/10.5194/acp-20-8827-2020, 2020. biomass burning in preindustrial time: LPJ-LMfire (v1.0), Liu, S.-J., Wu, H.-I., Lytton, R. L., and Sharpe, P. J.: Aerodynamic Geosci. Model Dev., 6, 643–685, https://doi.org/10.5194/gmd-6- sheltering effects of vegetative arrays on wind erosion: A numer- 643-2013, 2013. ical approach, J. Environ. Manage., 30, 281–294, 1990. Polley, H. W., Briske, D. D., Morgan, J. A., Wolter, K., Bailey, MacDonald, G. M.: Climate Change and water in Southwestern D. W., and Brown, J. R.: Climate change and North Ameri- North America special feature: water, climate change, and sus- can rangelands: trends, projections, and implications, Rangeland tainability in the southwest, P. Natl. Acad. Sci. USA, 107, 21256– Ecol. Manag., 66, 493–511, 2013. 21262, https://doi.org/10.1073/pnas.0909651107, 2010. Poorter, H. and Perez-Soba, M.: Plant growth at elevated CO2 , En- Magi, B. I.: Global lightning parameterization from CMIP5 climate cyclopedia of global environmental change, 2, 489–496, 2002. model output, J. Atmos. Ocean. Tech., 32, 434–452, 2015. Prein, A. F., Holland, G. J., Rasmussen, R. M., Clark, M. P., and Mahowald, N. M. and Luo, C.: A less dusty future?, Geophys. Res. Tye, M. R.: Running dry: The US Southwest’s drift into a drier Lett., 30, 1903, https://doi.org/10.1029/2003GL017880, 2003. climate state, Geophys. Res. Lett., 43, 1272–1279, 2016. Mahowald, N. M., Kohfeld, K., Hansson, M., Balkanski, Y., Har- Pu, B. and Ginoux, P.: Projection of American dustiness in the rison, S. P., Prentice, I. C., Schulz, M., and Rodhe, H.: Dust late 21(st) century due to climate change, Sci. Rep., 7, 5553, sources and deposition during the last glacial maximum and cur- https://doi.org/10.1038/s41598-017-05431-9, 2017. rent climate: A comparison of model results with paleodata from Raupach, M.: Simplified expressions for vegetation roughness ice cores and marine sediments, J. Geophys. Res.-Atmos., 104, length and zero-plane displacement as functions of canopy height 15895–15916, 1999. and area index, Bound.-Lay. Meteorol., 71, 211–216, 1994. https://doi.org/10.5194/acp-21-57-2021 Atmos. Chem. Phys., 21, 57–68, 2021
You can also read