CLIMATE CHANGE ADAPTATION PLAN FOR THE AGGLOMERATION OF MONTRÉAL 2015 2020 - Ville de Montréal
←
→
Page content transcription
If your browser does not render page correctly, please read the page content below
CLIMATE CHANGE ADAPTATION PLAN FOR THE AGGLOMERATION OF MONTRÉAL 20152020 EXECUTIVE SUMMARY

This document was produced by the Service de l’environnement under the supervision of Roger Lachance, Director of the Service de l’environnement. COMMUNICATION Service des communications, Ville de Montréal GRAPHIC PRODUCTION Service de l’environnement, Ville de Montréal 3rd quarter 2015 ISBN 978-2-922388-69-5 (PDF) ISBN 978-2-922388-70-1 (Print) Legal deposit – Bibliothèque et Archives nationales du Québec, 2015 Legal deposit – Library and Archives Canada, 2015 2 CLIMATE CHANGE ADAPTATION PLAN 20152020 EXECUTIVE SUMMARY

A MESSAGE FROM OUR ELECTED OFFICIALS
The undeniable role of cities Heat waves, heavy rainfalls,
in the fight and adaptation to freezing rain… the extreme
climate change is recognized climate events of the past few
throughout the world. Densely years demonstrate that the
populated urban centres are effects of climate change are
on the first lines of the adverse already being felt. These new
consequences that may result conditions represent a challenge,
from climate change. But cities but also opportunities that may
are also environments that be seized to position Montréal in
are conducive to innovation the vanguard of cities in terms of
and action. That is why we are sustainable development.
taking our responsibilities and
are planning for a better quality of living for present and future This first adaptation plan highlights our territory’s vulnerabilities
generations of Montrealers. to climate change. The impacts observed and anticipated on the
population, infrastructures, the natural environment and all of the
The Agglomeration of Montréal committed to reducing its activities that take place on the island are undeniable. The sum
greenhouse gas (GHG) emissions by adopting, in 2013, its of the data consolidated in this plan provides solid arguments on
Plan de réduction des émissions de GES de la collectivité the importance of moving from a strategizing mode to an action
montréalaise 2013-2020. Despite our mitigation efforts, mode, and that is what we are committed to doing.
some of the apprehended climate disruptions are already
observed: heat waves, heavy rainfalls, ice storms, etc. A strategy This adaptation plan presents concrete measures to address
aiming to curtail the negative impacts of climate change is climate hazards that already affect us and whose impacts will
essential for our administration and citizens. That is why I am likely be heightened in the coming years. Climate projections
proud to present this first Climate Change Adaptation Plan for the confirm that heat waves, heavy rainfalls and destructive storms
Agglomeration of Montréal 2015-2020. will occur more frequently. This adaptation process is the ideal
opportunity for us to modify and improve our measures to
With this adaptation plan, many ambitious commitments mitigate the impacts of climate change.
have been undertaken by central departments, boroughs and
municipalities. The measures announced aim to reduce heat This plan is the result of a successful collaboration between the
islands, enhance biodiversity protection, manage runoffs, various actors in the Montréal agglomeration. Specialists in the
increase the resilience of infrastructures and adopt new fields of the environment, water management, infrastructures,
practices with respect to the offering of recreational activities, buildings, green spaces and land use as well as representatives
to name but a few. from all the boroughs and cities within the agglomeration have
contributed to the development of this tool which will prove
This plan is just a first step in a very concrete approach that instrumental in increasing our agglomeration’s resilience in the
not only consolidates our strengths and reinforces our ability next five years.
to address all of these disruptions, but also demonstrates our
resoluteness to maintain and enhance the quality of the living
environments of our citizens.
Denis Coderre Réal Ménard
Mayor of Montreal and President of the Montreal Executive Committee member in charge of sustainable development,
Metropolitan Community the environment, large parks and green spaces
CLIMATE CHANGE ADAPTATION PLAN 20152020 EXECUTIVE SUMMARY 3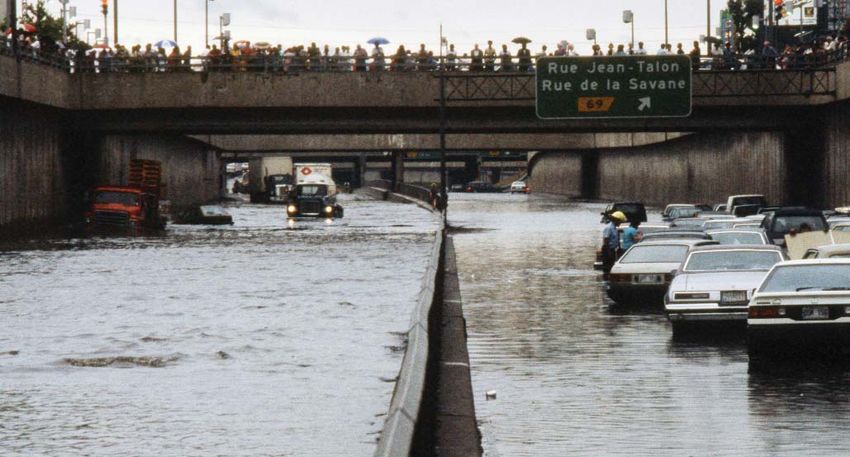
MONTRÉAL ADAPTS
TO CLIMATE CHANGE
The last decades have been crucial in terms of the climate.
There have been countless extreme meteorological events
throughout the world and their impacts have been extremely
varied. Climate change and their amplification have been
confirmed by the scientific community, including the
Intergovernmental Panel on Climate Change (IPCC).
This changing climate is already being felt by the
agglomeration of Montréal. The heat waves, floods and
freezing rains recorded in recent years, which have resulted
in many material and financial damages, and had a disruptive
effect on the population’s activities, are all manifestations of
these climate change.
The agglomeration of Montréal is already dealing with changes
that impact both the natural and built environments, the
population and socioeconomic activities. Many non-climate
factors, such as the age of infrastructures, land-use or
socio-demographic characteristics will either amplify or, on the
contrary, mitigate their apprehended repercussions.
Two types of joint actions are feasible regarding climate
change: mitigation (also called reduction) and adaptation.
Mitigation consists in reducing the intensity of these changes Credit: © Denis Labine, Ville de Montréal
by diminishing anthropogenic (man-made) greenhouse gases.
Montréal, toward this aim, has developed a greenhouse gas
emissions reduction plan (Plan de réduction des émissions de
gaz à effet de serre de la collectivité montréalaise 2013-2020). ADAPTATION AND RESILIENCE
Adaptation consists in assessing the impacts of climate
change on the agglomeration and implementing the necessary Adaptation to climate change is a process whereby
measures to minimize them. Adaptation measures make the communities and ecosystems make adjustments to
agglomeration more resilient to climate change, allowing it to restrict the negative impacts of climate change and
take advantage of their potential benefits.
better react and reorganize itself while securing its essential
functions and its identity.
Resilience refers to the capacity of a community’s
This first climate change adaptation plan, a collaborative effort economic, social, political and physical infrastructure
between municipal departments, local administrations and systems to absorb shocks and stresses and still retain
the Service de l’environnement, is only the starting point of an their basic function and structure.*
iterative process that will be enhanced in the coming years, to
* Source : Craig Applegath, www.resilientcity.org
reflect the accumulation of changing data on the climate and
the inherent risks as well as the effectiveness of the measures
that will have been implemented.
4 CLIMATE CHANGE ADAPTATION PLAN 20152020 EXECUTIVE SUMMARY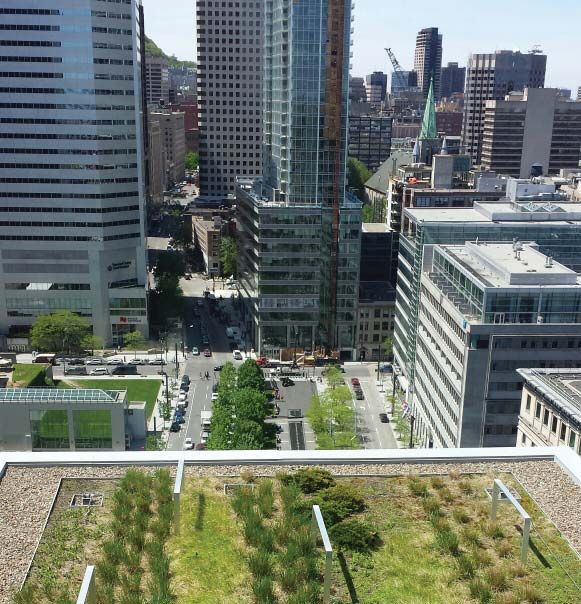
PLAN OBJECTIVES PLAN CONTENTS
The adaptation plan has been designed with three specific This plan presents, in a first volume, a diagnosis of the
objectives in mind, namely: adaptation challenges faced by the agglomeration of Montréal.
It presents the vulnerability analysis of the agglomeration
1. Consolidate all of the adaptation measures already regarding six climatic hazards:
in place which, while not specifically referring to an
adaptation to climate change, truly serve that purpose • increase in average temperatures,
Many of the climate impacts on health issues and issues • heavy rainfalls,
dealing with the protection of both natural and built • heat waves,
environments are already built into many of the plans and • destructive storms,
strategies of the agglomeration of Montréal. More than • droughts and
30 strategies, policies, plans and regulations associated, • floods.
directly or indirectly, with climate change can be identified. For each of these hazards, a description of the meteorological
This adaptation plan supports initiatives that have already observations and climate projections is presented. Then
been announced and provides solid arguments regarding follows an impact review of the hazard on the built and natural
the importance of implementing and acting on strategies. environments, the population and the municipal activities.
Finally, a vulnerability analysis of the agglomeration of Montreal
2. Provide the relevant information on the is presented, in the form of a map when possible.
vulnerabilities associated with climate change for
all of the agglomeration’s municipalities The second volume is entirely dedicated to adaptation
Although climate projections are consistent throughout measures. It focuses on actions that need to be consolidated or
the agglomeration, vulnerability factors vary according developed and on the commitments of the various entities that
to one’s geographic location on the Island of Montréal. make up the agglomeration of Montréal.
Consequently, it is essential to appreciate the local
variations in vulnerability levels to best orient one’s actions
according to local circumstances and focus one’s efforts
where a greater vulnerability is observed.
3. Plan for the development of the agglomeration and
its maintenance and repair operations in light of the
constraints associated with climate change
This objective speaks to the very essence of a climate
change adaptation plan, by encouraging new ways of
thinking and doing things among stakeholders within
the agglomeration, to reduce the inherent risks of
climate change.
Credit: © Denis Labine, Ville de Montréal
CLIMATE CHANGE ADAPTATION PLAN 20152020 EXECUTIVE SUMMARY 5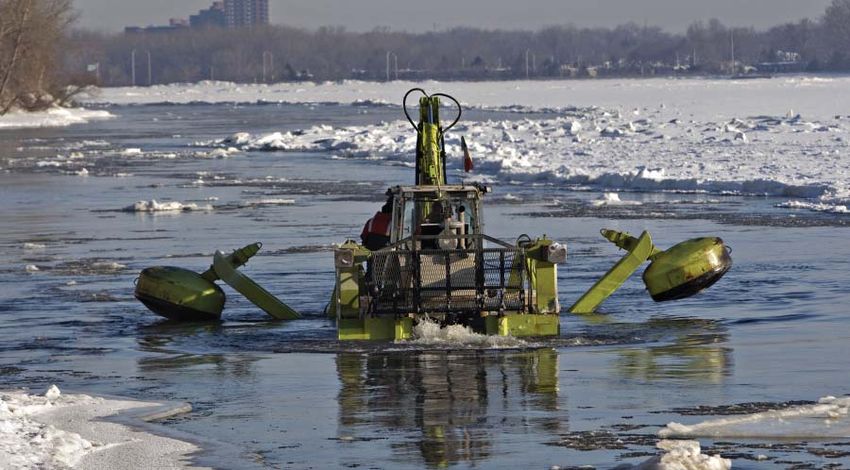
TERRITORY COVERED BY THE PLAN
Located at the confluence of the St. Lawrence and Ottawa THE AGGLOMERATION OF MONTRÉAL IN A FEW FIGURES
Rivers, the Island of Montréal measures approximately 50 km
90% of the territory is urbanized
in length and 16 km at its widest point. Ringed by Des Prairies
River, the St. Lawrence River and Lake Saint-Louis, it has 1.9 million persons lived on the Island of Montréal in 2011
266.6 km of riverbanks and covers an area of 483 km² 3,780 persons per square kilometre (2011) 4, 5
(499 km² counting the neighboring islands).
45% of the population is concentrated in the centre of the island
This territory regroups 16 municipalities that form the 10% of the population lives in the island’s extremities
agglomeration of Montréal, which is comprised of 15% of the population is aged from 0 to 14
15 related municipalities and Ville de Montréal (subdivided
16% of the total population is 65 years of age or older
into 19 boroughs). It is inhabited by almost 2 million people,
i.e. 24% of the population of Québec 2. 33% of the population is immigrant, i.e. 1 of every 3 residents 4
3% of the population speaks neither French nor English
The agglomeration of Montréal has several large parks,
39% of households are comprised of a single person 2
ecoterritories and protected areas that cover 21.3% of its
territory 1. These green spaces are mainly located at the 42% of the housing stock was built before 1961
extremities of the island, except for Mount Royal Park, which 6,200 km of roadways and arteries
acts as a true lung in the centre of downtown Montréal, and
18 bridges to access the island
Jean-Drapeau Park, also located near the city’s business district.
68 metro stations on 4 lines extending 71 km
There are nearly 1.2 million trees in the public spaces 3.
5 lines of commuter trains
AGGLOMERATION OF MONTRÉAL
er
s Riv Rivière-des-Prairies–
rairie
Laval P Pointe-aux-Trembles
es
D
s Montréal-Nord
tain
Moun Anjou Montréal-Est
o
f Tw L'Île-Bizard–
L ake o Sainte-Geneviève Saint-Léonard
Villeray–
Ahuntsic–Cartierville Saint-Michel– Mercier–
Parc-Extension Hochelaga-
Senneville Pierrefonds–Roxboro Dollard-Des Ormeaux
Maisonneuve
er
Rosemont–
Riv
Sainte-Anne- La Petite-Patrie
Kirkland
ce
de-Bellevue Saint-Laurent
ren
Pointe-Claire
Mont-Royal
L aw
Baie-D'Urfé
Beaconsfield
Le Plateau-
Outremont Mont-Royal St.
Côte-des-Neiges–
Dorval Notre-Dame-de-Grâce
Hampstead Ville-Marie
Côte-Saint-Luc
Lak Westmount
e Sa Longueuil
int-Louis L’Île-Dorval Lachine Montréal-Ouest Sud-Ouest
Boroughs of Montréal Verdun
LaSalle
Related municipalities i
as
n
i eB
rair
La P
6 CLIMATE CHANGE ADAPTATION PLAN 20152020 EXECUTIVE SUMMARY
CLIMATE PROJECTIONS
The Climate change adaptation plan of the agglomeration of The trend observed, with respect to an increase in
Montréal builds on climate projections provided by Ouranos. precipitations, particularly in heavy rainfalls, is confirmed
These projections were produced for the Southern Québec by the climate projections. By 2050, annual precipitations
region, including Montréal. A historical analysis was also should increase by 3 to 14% with a greater emphasis on
conducted on Montréal’s meteorological and hydrological rainfalls in the winter (+2 to +27%) and in the spring (+3 to
observations made in the past few decades. These historical +18%). A significant increase in the frequency and intensity of
trends for Montréal are consistent with those for Southern heavy rain episodes is also expected. The intensity of heavy rain
Québec, which validates the relevance of using these projections. episodes should increase by 10 to 25% by 2100. Furthermore,
a rainfall of a given intensity, with a return period of 20 years in
the 1986-2005 timeframe, should occur more frequently near
2046-2065 with a return period of about 7 to 10 years.
Ouranos is a research and development
consortium that relies on more than 450 scientists
and professionals working on regional climatology
and adaptation to climate change.
In terms of temperatures, the projections indicate an increase
of approximately 2 to 4 °C for the 2041-2070 period and
of 4 to 7 °C for the 2071-2100 period. Also, the length of
the plant growing season, which has already increased in
recent decades, should increase from 10 to 30 days by 2050,
depending on the emission scenario that is chosen. The
length of the freeze-up period should continue to decline. It is
expected to decrease from 2 to 4 weeks compared to today. It
is estimated that, for the 2041-2070 horizon, the snow-cover
period should be shortened from 45 to 65 days compared
to the historical period of 1970-1999. The most extreme
projections suggest the possibility of having a snow-cover
period of less than 20 days. Finally, the climate projections
point to an increase in the number of freeze-thaw cycles in
the wintertime, but to a decline in their number in the fall and
spring by 2050. Credit : © Yves Provencher, Journal Métro
Similarly to the rest of the world, climate models forecast
strong increases in the duration of heat waves as well as in
the frequency of hot nights (minimum temperature > 20 °C).
According to these same projections, the maximum extreme
temperatures in the summer will increase more than the
summers’ average temperatures. This suggests longer and
more intense heat waves in the coming decades.
CLIMATE CHANGE ADAPTATION PLAN 20152020 EXECUTIVE SUMMARY 7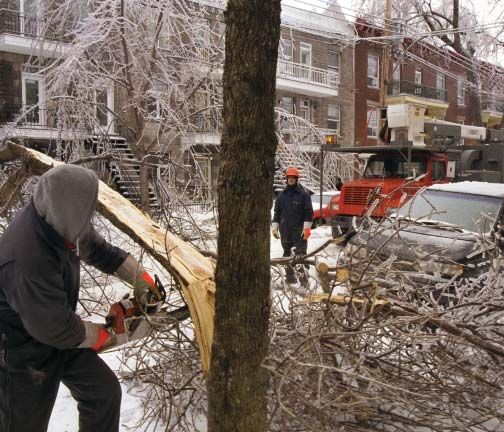
As far as destructive storms are concerned (freezing rain, CLIMATE EVOLUTION ACCORDING TO VARIOUS HAZARDS*
heavy rainfalls, hail and strong winds), the climate projections
present great uncertainties. Despite the uncertainties in
Extension of the summer season
forecasting future destructive storms in Montréal, the trends
that have already been observed and the considerable impacts periods of freeze and snowfall
that are associated with these destructive storms require a
reflection and adapted measures for the agglomeration to number of freeze-thaw
better prepare itself to face these events in the future. INCREASE IN AVERAGE episodes
TEMPERATURES
By 2081-2100, the majority of climate projections agree on
shorter periods of meteorological droughts on an annual
basis and in the winter (from December to February), but on
longer periods during the summer season (June to August). By
frequency and intensity
2081-2100, the projections for abnormalities in soil moisture
indicate annual drier conditions. This trend should be even more
HEAVY RAINFALLS
pronounced for summer seasons.
For Des Prairies River, a recent study simulated the average
daily flow in 2042-2070. The results of this simulation
suggest that spring river floods should occur earlier in the frequency and duration
year than in the past (1972-2000). According to a study done
by Ouranos, the levels of the St. Lawrence River should be HEAT WAVES
lower in the vicinity of Montréal (from 20 cm to 120 cm) by
2050. In summary, it is expected that the spring floods of the
Des Prairies River are trending to occur always earlier in the frequency of heavy
year. However, it is not yet clear whether these spring floods snowfall episodes
will intensify in the future. Hydrological models are still unable
DESTRUCTIVE frequency of freezing rains
to take into account the frazil ice, which presently limits their
STORMS
predictive ability for this type of flood.
duration during
the summer season
DROUGHTS
occurrence of spring floods
earlier in the year
RIVER FLOODS
* The results of this table are based both on meteorological and hydrological observations
in Montréal, and on projections for Southern Québec. The sole exception in terms
of hazards is “Destructive storms” which only presents an analysis of meteorological
observations in Montréal.
8 CLIMATE CHANGE ADAPTATION PLAN 20152020 EXECUTIVE SUMMARY
INCREASE IN AVERAGE
TEMPERATURES
On the territory of the agglomeration of Montréal, one can IMPACTS
observe a definite upward trend in temperatures (about 1 °C)
between the 1970-1980 and 2000-2010 decades, similar to On the Montréal agglomeration territory, the impacts of the
what is observed in the rest of Québec. increase in average temperatures on the built environment
are mainly observed in the wintertime. The increased number
The increase in average temperatures has an impact on all of freeze-thaw cycles entails an accelerated deterioration of
seasons. For instance, the summer season is extended and the arteries of the Montréal roadway system and a greater
the winter season is shortened, which has repercussions on presence of potholes. It also contributes to an accelerated
climate related parameters. For example, in the 1955-1984 deterioration of some bridges, tunnels and overpasses.
and 1985-2014 periods, we observed:
The increase in average temperatures also impacts the
• an increase of nine days in the duration of the plant environment. Insects, whose metabolism depends directly on
growth period; climate conditions, are extremely influenced by the temperature.
• a five-day reduction of the freeze-up period; These changes can generate an increase in the growth rate
of some pests (harmful insects) and multiply the number
• a marked reduction in the duration of the snowfall
of generations in a season. The changing climate may also
period, whose average of 103 days drops to 73 days
modify the geographic distribution area of insects. It may also
on average.
result in an increase in the frequency of infestations and in the
seriousness of the damages caused to plants by pests.
Finally, a 29% increase in occurrences of freeze-thaw has been
observed in the wintertime from 1942 to 2015. Moreover, an increase of a few degrees can be sufficient to
generate drastic changes in the biology of plants. Recently, the
plant hardiness zone of Montréal has changed. The territory has
gone from a 5B zone to a 6 zone, which implies changes in the
distribution area of species and could stimulate the appearance
of undesirable plant species.
Québec’s plant hardiness zones are determined
on the basis of Canadian data which include
the minimum winter temperatures, the duration
of the thaw-free period, summer precipitations,
maximum temperatures, the snow-cover period,
January rains and the maximum wind speeds. 6
Pothole on St. Lawrence Blvd., near Sherbrooke St. (25.02.2013)
Credit: © Dario Ayala, Montreal Gazette
CLIMATE CHANGE ADAPTATION PLAN 20152020 EXECUTIVE SUMMARY 9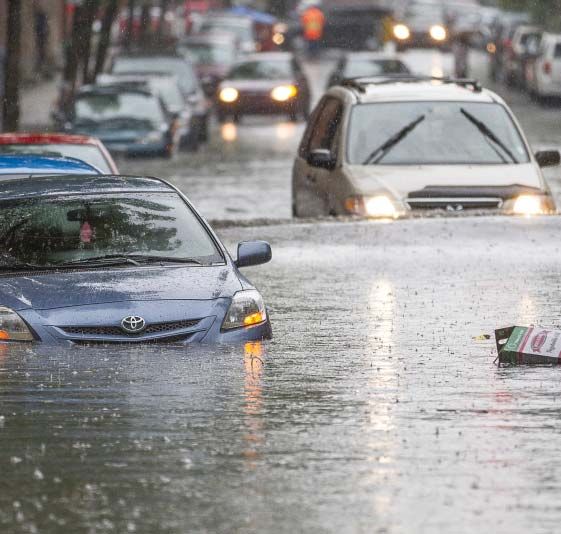
There are growing concerns regarding an increase in the
prevalence of vector-borne and zoonotic diseases caused,
among other factors, by the northward migration of
vector-borne pathogen animal populations. Certain vector
diseases such as Lyme’s disease and the Nile fever, caused by
the West Nile virus (WNV), have increased in the Province of
Québec in recent years.
The increase in the winter average temperatures and the
frequency of freeze-thaw episodes result in significant impacts
on the operations of the agglomeration’s municipalities. They
entail an increase in costs owing to a greater reliance on the
workforce and the consumption of resources (for ex. the need
for abrasives during abrasive spreading operations).
The increase in average temperatures, resulting in an extension
of the summer season, also has some positive impacts such as
an increase in the number of days offering good conditions for
Tar spot on a maple leaf
Credit: © Équipe de lutte intégrée, Ville de Montréal outdoor work or an extension of the bicycle season.
Pathogens (fungi, bacteria, viruses and nematodes), which NUMBER OF RECORDED CASES IN QUÉBEC OF LYME’S
are liable to cause infections in plants, are also impacted by DISEASE AND NILE FEVER CAUSED BY THE WEST NILE VIRUS
an increase in temperatures. The increase in average winter WNV SINCE 2002
temperatures could allow for the survival of a greater number
of pathogen agents and, as a result, an expansion of their NUMBER OF CASES RECORDED
PERIOD
distribution area. Pathogen species that cannot survive in the Lyme’s disease * Nile fever **
present conditions could eventually attack plants in our region.
2002 – 2003 Info not available About 20 per year
The increase in average summer temperatures could lead to
2004 – 2010 < 15 per year < 5 per year
an extension of the pollen production season. This situation
is particularly preoccupying for allergenic plant species. For 2011 32 42
example, in Montréal, the pollen emission period of the
common ragweed (Ambrosia artemisiifolia L.) has increased by 2012 43 132
three weeks between 1994 and 2002.7, 8
2013 141 32
This lengthening of the pollen season can result in greater
health problems for persons who are sensitive to allergens. * MINISTÈRE DE LA SANTÉ ET DES SERVICES SOCIAUX. Maladie de Lyme - Évolution
de la maladie au Québec, [Online]. [www.msss.gouv.qc.ca/professionnels/maladie-lyme.
php#evolution-de-la-maladie-au-quebec] (Consulted May 25, 2015).
** MINISTÈRE DE LA SANTÉ ET DES SERVICES SOCIAUX. Virus du Nil occidental (VNO)
- Surveillance de cas humains de VNO au Québec, [Online]. [www.msss.gouv.qc.ca/sujets/
santepub/environnement/index.php?virus_du_nil#quebec] (Consulted May 25, 2015).
10 CLIMATE CHANGE ADAPTATION PLAN 20152020 EXECUTIVE SUMMARYVULNERABILITY TO THE INCREASE IN AVERAGE TEMPERATURES
The agglomeration of Montréal’s vulnerability to increases MAJOR IMPACTS ON THE OPERATIONS OF THE MUNICIPALITIES
in average temperatures can difficultly be mapped. Indeed, IDENTIFIED WITHIN THE AGGLOMERATION OF MONTRÉAL
there are no particular sectors that are more affected than ASSOCIATED WITH THE INCREASE IN AVERAGE WINTER AND
SUMMER TEMPERATURES
others by this hazard. Therefore, we need to consider that it is
the whole territory that needs to be covered and that will be
impacted by these changes. WINTER
of the average temperature
Nevertheless, certain elements have been identified as of the frequency of freeze-thaw episodes
being sensitive to the impacts of an increase in average
Salt spreading operations intended to make road surfaces and
temperatures. For example, this is the case for concrete
sidewalks safer will be multiplied since temperatures will more
infrastructures which are sensitive to freeze-thaw cycles.
often approach the freezing point.
Consequently, the road network and its associated structures
such as bridges and tunnels are considered vulnerable. In periods of freeze-thaw, inspections of bridges, overpasses,
tunnels, retaining walls and other road related structures are
The interactions between plants and insects are very performed to prevent the fall of fragments. The likely increase
complex. Both will be affected in many ways, but a more in the number of freeze-thaw episodes risks entailing an
detailed analysis of all factors would require a finer increase in the number of these operations to check and secure
understanding of their environment. Therefore, within the these structures.
context of this first plan, it was agreed to draw a summary
portrait of the issues without focusing on any particular sector. The maintenance of outdoor skating rinks has already become
more difficult owing to the variations around the freezing point.
The implementation of projects on a local scale will require that
The number of days during which it will be possible to practice
certain aspects be analysed in more detail.
this winter activity will decrease in the future.
Finally, some groups of people were identified as being
particularly sensitive to the extension of the pollen production SUMMER
Extension of the summer season
season (children, young adults, persons suffering from asthma,
of the average summer temperature
etc.), but no analysis has been performed relative to their
distribution on the territory. The demand for an access to water games, swimming pools and
outdoor sports facilities will increase. An opening or access period
beginning sooner in the spring and ending later in the fall will be
expected by citizens. An adjustment will be required to meet the
greater need for personnel responsible for the maintenance and
surveillance of these facilities.
The lengthening of the summer season will bring about an
increased demand for the resources dedicated to managing parks
and green spaces, and caring for plants.
CLIMATE CHANGE ADAPTATION PLAN 20152020 EXECUTIVE SUMMARY 11HEAVY RAINFALLS
As a result of climate change, the air contained in the
atmosphere warms up. This warmer air may hold more
moisture. Consequently, the movement of water from the
tropics to the boreal regions increases. Subpolar regions, like
Québec, become more humid. Another impact consists in
an increase in the frequency and intensity of heavy rainfall
occurrences. This trend was observed in Southern Québec
in the 1950-2010 period.
The figure below shows an increase in the number of heavy
rainfall occurrences over the years on the territory of the
agglomeration of Montréal, for the 1943-2014 interval.
Flooded street during the violent storm of May 29, 2012
Credit: © Olivier Pontbriand, La Presse
NUMBER OF DAYS DURING WHICH RAIN PRECIPITATIONS EXCEEDED 30 MM
Data compiled by the meteorological station at Montréal-Trudeau International Airport.
10
9
Spring Summer Fall Winter
8
7
Number of events
6
5
4
3
2
1
0
1943 1949 1955 1961 1967 1973 1979 1985 1991 1997 2003 2009 2013
Years
12 CLIMATE CHANGE ADAPTATION PLAN 20152020 EXECUTIVE SUMMARYLANDMARK EVENTS IMPACTS
In the past three decades, the Island of Montréal has witnessed During a heavy rainfall episode, the flow of wastewaters in
many heavy rainfalls. Numerous negative impacts have been sewers may increase drastically and the risks of an overflow
associated with these events. For example, on May 29, 2012, can also rise rapidly in a short timespan. Once the network
45 mm of rain fell on Montréal in less than an hour, resulting is saturated, runoff waters can no longer enter and they
in flash floods, and the closing of many streets and tunnels. accumulate in lower points, which can cause flooding.
Furthermore, many underground shopping centres in Montréal
had to be evacuated, along with the metro stations of the orange Basements are particularly at risk of being flooded. Factors such
line between the Berri-UQAM and Lionel-Groulx stations. as the inadequate levelling of the ground and the presence of
Finally, about 15,300 homes were deprived of electricity. a garage entrance with a slope toward the house can result in
the flooding of homes. Also, non protected buildings can suffer
from a sewer backup, i.e. a return of water from the sewers in a
HEAVY RAINFALL LANDMARK EVENTS ON THE AGGLOMERATION building’s plumbing that is not equipped with a check valve.
OF MONTRÉAL 19832013 PERIOD
The flooding of buildings is responsible for considerable
economic losses. First, they result in costs related to the
February 2,
1983 45.8 mm destruction and damages to properties. Secondly, the increase
in flood damages to buildings results in increased insurance
premiums and can even sometimes reduce insurers’ coverage
June 18,
1984 53.6 mm of this risk.
August 9,
20
1986 mm
June 8,
1987 61.6 mm
July 14,
1987 101.2 mm
Nov. 8-9,
1996 150 mm
July 11,
2009 40 to 70 mm
May 29,
2012 45 mm
Floods result, not only in health problems and economic losses, but also
increased insurance premiums.
August 13, Credit: © Olivier Pontbriand, La Presse
2013 70 mm
Duration of rainfall (1 = 12 h)
Total precipitations
CLIMATE CHANGE ADAPTATION PLAN 20152020 EXECUTIVE SUMMARY 13Significant emotional or material losses can bring about Finally, intense rains have few impacts on the environment.
psychological disorders among victims. Also, flooded buildings In fact, the vegetation and ecosystems of temperate areas are
have a greater risk of developing mould issues. When these quite resilient to heavy rainfalls in the summertime. However,
mould issues are significant, they can cause serious health the overflow of wastewaters in waterways increases the
problems, such as asthma and allergic reactions. quantity of pathogenic organisms and pollutants.
The strong flows of rainwater runoffs and floods in urban The operational impacts identified in Montréal in relation to
environments also damage the road network (particularly the increased frequency and intensity of heavy rainfalls are
culverts), sewer systems (particularly retention basins, rainwater related to public works, drinking water production activities
and combined sewers, and pumping stations) and underground and the treatment of wastewaters. For instance, paving works
facilities, which can result in service outages depending on the and the rehabilitation and replacement of water mains can
service (for ex. electricity, telephone, Internet, etc.). be delayed during periods of heavy rainfalls, which can cause
delays in the subsequent phases of the project.
In addition to reducing mobility in the territory, floods are
an important cause of accidents, injuries and deaths. For
example, two deaths were reported during the heavy rainfall
that occurred in Montréal on July 14, 1987. An elderly
man drowned when his car was submerged in the Décarie
Expressway, while another man was electrocuted.
On July 14, 1987, Décarie Expressway looked like some rapids after a rainfall of 101.2 mm in just two hours.
Credit: © La Presse
14 CLIMATE CHANGE ADAPTATION PLAN 20152020 EXECUTIVE SUMMARYVULNERABILITY TO HEAVY RAINS
The agglomeration of Montréal’s vulnerability to heavy rainfalls Finally, other factors such as the vegetation, type of soil and
is determined through a geographic analysis of the areas having soil occupation influence the speed of runoffs, absorption and
a water accumulation potential, as well as infrastructures and the accumulation of rainwaters.
groups of persons sensitive to the impacts of this hazard.
Many infrastructures are sensitive to heavy rainfalls, of
Topography is the factor that influences water accumulation which the sewer network, buildings, in particular critical sites
the most. The other significant parameter is urbanization. (hospitals, police stations, drinking water plants, etc.) or sites of
The older neighbourhoods, located in the centre of the island interest (for ex. schools, metro stations, bridge entrances and
and having a high density of population, buildings and roads exits, etc.), underground facilities and the road network.
(Ahuntsic-Cartierville, Côte-des-Neiges–Notre-Dame-de-Grâce,
Côte-Saint-Luc, Hampstead, Le Plateau-Mont-Royal, Many groups of persons are sensitive to the impacts of
Rosemont–La Petite-Patrie, Saint-Laurent, Le Sud-Ouest, heavy rainfalls, particularly children, persons aged 65 and
Verdun, Villeray–Saint-Michel–Parc-Extension) all have areas more, and the materially disadvantaged.
with a water accumulation potential on a major portion of their The map below shows that an important part of the
territory. The western and part of the eastern sectors of the agglomeration features a minor or moderate vulnerability to
island are less mineralized areas, which allows rainwaters to be heavy rainfalls and that the most vulnerable areas are found
partly absorbed by the ground, thus diminishing the potential in the centre and eastern sectors of the island. Only a few
for water to accumulate. areas are highly vulnerable, because they are located in areas
with a risk of accumulation of runoff rainwaters along with the
presence of sensitive infrastructures and groups of persons.
AGGLOMERATION OF MONTRÉAL VULNERABILITY TO HEAVY RAINFALLS
Lake of Two Mountains
er
ries Riv
Prai
Des
r
ve
Ri
nce
w re
La
St.
Lake Saint-Louis
Insignificant Moderate
Minor High
0 0.25 0.5 3 4.5 6 km
La Prairie Basin
CLIMATE CHANGE ADAPTATION PLAN 20152020 EXECUTIVE SUMMARY 15HEAT WAVES
Extreme heat, oppressive heat or heat waves are all IMPACTS
expressions that explain the meteorological phenomenon
that refers to abnormally high temperatures both in the In a densely populated urban environment, heat waves are an
daytime and nighttime. This heat, that accumulates faster than important public health issue. Indeed, periods of extreme heat
it can be evacuated, can last a few days and be accompanied provoke thermal stresses in persons, causing cramps, fainting
by high humidity levels that are very uncomfortable. and heat strokes. Extreme heat is also responsible for many
discomforts, resulting in many hospitalizations, and may even
Several aspects have to be considered when studying heat
aggravate the frail condition of persons suffering from certain
waves: duration, rate of humidity and contrast day/night. A
diseases and cause premature deaths. In the past 30 years,
heat wave that last for a long period of time or whose humidity
heat waves have been responsible for over 400 deaths on the
is high (high humidex) will be particularly uncomfortable for
territory of the agglomeration of Montréal.
people. It is the same when nights do not cool enough (night
temperature remains above 20 ° C).
In Montréal, heat waves are on the rise, notably with an
increase of 58% of nights with a high humidex value over
the 1953-2012 period.
LANDMARK EVENTS
The agglomeration of Montréal has witnessed many heat waves
in the last 70 years, some of which were particularly memorable
and even resulted in fatalities.
LANDMARK HEAT WAVE EVENTS
ON THE AGGLOMERATION OF MONTRÉAL
AVERAGE NUMBER
DATE
TEMPERATURES OF FATALITIES
July 9-13, 1987 32.6 °C 169
June 16-18, 1994 33.1 °C 103 A crowded swimming pool in Laurier Park, Le Plateau-Mont-Royal
Credit: © Marco Campanozzi, La Presse
July 1-3, 2002 33.2 °C 30
August 14-18, 2009 30.7 °C N. A. Heat waves can also produce and exacerbate the impacts of
atmospheric pollution. The resulting poor air quality is a factor
July 5-10, 2010 33 °C 106
that can aggravate the symptoms of many health problems and
July 20-23, 2011 32.9 °C 13 restrict the practice of outdoor activities and sports.
July 14-19, 2013 32 °C 2
16 CLIMATE CHANGE ADAPTATION PLAN 20152020 EXECUTIVE SUMMARYVegetation, which is so important in an urban environment, is
also vulnerable to heat waves. Although trees and other plants
can rely on defense mechanisms, a heat wave can induce
shocks, among which hydric stresses that can greatly fragilize
them and lead to illnesses. The vegetation that is impacted then
requires more care or must be replaced. All of these happenings
have impacts on the resources required for their upkeep and
their maintenance costs.
Heat waves, even for a short duration, can diminish the
populations of many insects. This impact may be positive in the
case of harmful species, but the opposite will be true in the case
of species such as pollinators.
The aquatic environment may also suffer from heat waves
since they give rise to a rapid and massive increase in blooms
of cyanobacteria. The proliferation of these blue algae can have
numerous repercussions, among which the eutrophization of
waterways which compromises their equilibrium and reduces
their biodiversity, in addition to reducing the access to water
Appearance of a bloom of cyanobacteria in the summer of 2012 at the last lock of the
for swimming. Lachine Canal, just before the mouth of the Old Port of Montréal
Credit: © Réseau de suivi du milieu aquatique, Ville de Montréal
Extreme temperatures can affect or weaken the agglomeration’s
infrastructures by impacting roads and arteries. Roadways that
are heavily travelled and used by heavy vehicles may soften,
deform themselves and produce ruts under the weight of these
VULNERABILITIES TO HEAT WAVES
vehicles. Extreme temperatures can also cause premature
damages to the expansion joints of structures. Heat islands cover 28% of the Island of Montréal. They
are mainly found in the northern and eastern sectors of
Finally, heat waves can impact municipal operations and
the agglomeration. The boroughs of Ville-Marie, Plateau-
services. They also often give rise to an increased demand for
Mont-Royal, Sud-Ouest, Mercier–Hochelaga-Maisonneuve,
certain services, such as the use of swimming pools, paddling
Villeray–Saint-Michel–Parc-Extension, Montréal-Nord and
pools and water games or an extension of the ‘business’
Saint-Léonard present the greatest area of heat islands.
hours of air conditioned public buildings such as libraries and
community centres. These demands will result in an increase From all of the factors described that contribute to the
in interventions and an increased need for personnel to provide vulnerability of certain sectors of the territory (see the table
services to the population, maintain the infrastructures and on the following page), one needs to add the presence of
deploy emergency measures, when necessary. populations that are particularly sensitive to this hazard,
namely young children and the elderly, especially those who
live by themselves or suffer from chronic diseases. Also, certain
immigrants may be more vulnerable to heat waves because of
their inability to speak and understand French and English. This
is because, in addition to not being reached by the heat wave
advisories and recommended response measures, they are less
CLIMATE CHANGE ADAPTATION PLAN 20152020 EXECUTIVE SUMMARY 17inclined to ask for assistance. The same is true for people who FACTORS CONTRIBUTING TO THE FORMATION
live in social isolation. Finally, the level of revenue influences OF URBAN HEAT ISLANDS
citizens’ vulnerability, since the most disadvantaged have a lesser
access to air conditioning. Type of materials - Certain materials absorb a lot of heat in
the daytime and release this heat at night, which explains why
temperatures remain high at night in urban heat islands.
Vegetation is also sensitive to heat waves, particularly when it is
found in urban heat islands. In fact, although there are generally
Lack of vegetation – In addition to absorbing part of the heat that
few trees in urban heat islands (UHI), those that are present are would otherwise be stored by materials, vegetation refreshes the
particularly vulnerable to heat waves, since the temperatures ambient air through the transpiration process.
therein are greater than those elsewhere on the territory.
Soil sealing – Permeable soils allow for a partial evaporation of
Finally, since roads and arteries are likely to be affected by heat the water they contain in periods of extreme heat. This evaporation
waves, they are identified as being infrastructures sensitive to is produced through the absorption of the energy of ambient air,
which then refreshes the air.
this hazard.
Human (anthropic) activities – Many human activities release
A map of the vulnerability relative to heat waves has been
heat, among which air conditioning, the motors of vehicles and
prepared using all of these factors in order to identify the certain industrial activities.
sectors that are the most sensitive to heat waves. This map is
an extremely useful tool to target vulnerable sectors and then Urban morphology – An urban geometry that combines narrow
decide on the most appropriate adaptation strategies. streets and tall buildings contributes to the formation of urban
heat islands.
AGGLOMERATION OF MONTRÉAL VULNERABILITY TO HEAT WAVES
Lake of Two Mountains
er
ries Riv
Prai
Des
r
ve
Ri
nce
w re
La
St.
Lake Saint-Louis
Insignificant Moderate
Minor High
0 0.25 0.5 3 4.5 6 km
La Prairie Basin
18 CLIMATE CHANGE ADAPTATION PLAN 20152020 EXECUTIVE SUMMARYDESTRUCTIVE STORMS
The destructive storm hazard regroups many types of EVOLUTION OF FREEZING RAIN EPISODES ON THE
storms: wind storms, hail storms, heavy snowfalls and freezing AGGLOMERATION OF MONTRÉAL
rain. This grouping was made mainly on the basis of the Data derived from RESSLER et al. 9
devastating impacts these events can entail. 4
The meteorological data that are presently available for
Montréal do not allow for an assessment of the evolution of
wind or hail storm occurrences in the past decades. 3
Number of occurrences
With respect to freezing rain events, a team of researchers from
McGill University recently collected data from 1979 to 2008 9,
that show an increase of about 26% in the number of events 2
INCREASE OF
26%
that occurred on the agglomeration of Montréal. As far as heavy
snowfalls are concerned, their number increased in the past
70 years. Indeed, the Island of Montréal witnessed 13 days
1
during which there fell more than 30 centimetres of snow
during the 1994-2014 period, whereas this phenomenon only
occurred 9 times during the 1942-1993 period.
0
1979
1981
1983
1985
1987
1989
1991
1993
1995
1997
1999
2001
2003
2005
2007
Years
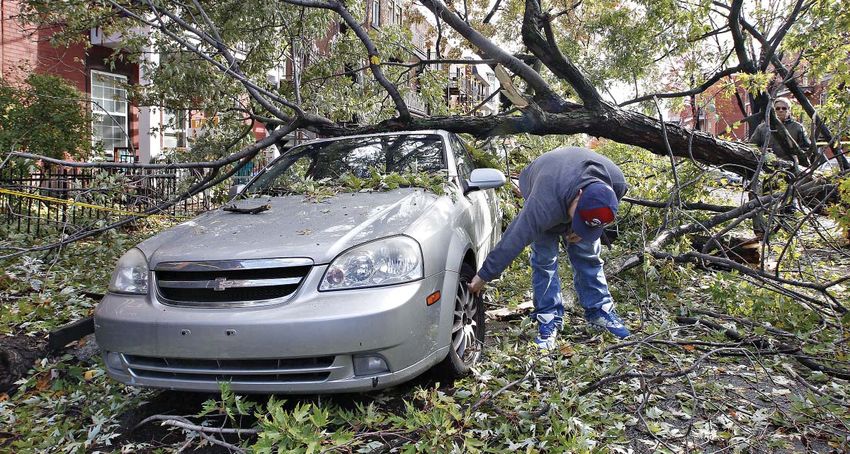
Strong winds knock down a huge tree branch on a vehicle in the Hochelaga-Maisonneuve district. (01.11.2013)
Credit: © Patrick Sansfaçon, La Presse
CLIMATE CHANGE ADAPTATION PLAN 20152020 EXECUTIVE SUMMARY 19LANDMARK EVENTS
In the past 30 years, many destructive storms have hit the
Island of Montréal. These events resulted in numerous negative
impacts. For instance, on January 5, 1998, from 5 to 80 mm
of freezing rain fell from the Maritimes up to the Ottawa and
St. Lawrence River Valleys. This was the second costliest
disaster in Canadian history with 28 deaths, 945 injuries
and 600,000 evacuees.10, 11
LANDMARK EVENTS ON THE AGGLOMERATION OF MONTRÉAL
TYPE OF
DATE PRECISIONS
STORM
November 16, 1983 Snow and 20 cm of snow
freezing rain
December 13, 1983 Freezing rain N.A.
December 3, 1984 Snow 21 cm of snow
1998 ice storm crisis
May 29, 1986 Hail Hailstones up to 8 cm Credit: © Denis Labine, Ville de Montréal
in diameter
June 29, 1986 Hail Hailstones of 0.5 to
1.5 cm in diameter
November 20-22, 1986 Snow 30 cm of snow
January 22-23, 1987 Snow 30 cm of snow
May 29, 1987 Hail Hailstones of 1 to
1.2 cm in diameter
July 18, 1987 Hail N.A.
February 12-13, 1988 Snow 20 cm of snow
January 5, 1994 Snow 25 cm of snow
January 5, 1998 Freezing rain According to sources,
5 to 80 mm of
freezing rain
January 18, 2012 Wind N.A.
December 27, 2012 Snow 45 cm of snow in less
than 24 hrs
December 27, 2012 snowstorm
July 19, 2013 Wind Winds exceeding Credit: © Matias Garabedian, Flickr (CC BY-SA 2.0)
100 km/h
20 CLIMATE CHANGE ADAPTATION PLAN 20152020 EXECUTIVE SUMMARYIMPACTS
Strong winds, the accumulation of freezing rain, hail and The environmental impacts of destructive storms in an urban
heavy snowfalls can all result in distortions, damages and an milieu mainly affect the vegetation, particularly trees. Whenever
accelerated wear of infrastructures and vegetation. The severity snow and freezing rain accumulate and are accompanied
of the damages depends on the force of the storm (wind speed, by very strong winds, trees may be uprooted or their trunks
the thickness of the accumulation of freezing rain or snow, the broken. In addition to affecting the normal growth and shape of
size of the hailstones). Destructive storms have a direct impact trees, the damages inflicted to trees by freezing rain can render
on the population through their consequences on the life, health them more vulnerable to insects and illnesses.
and on activities in the city.
The operational impacts that have been identified in relation
In the Montréal agglomeration, the damages inflicted by to destructive storms in Montréal are related to an increase in
destructive storms mainly consist of falling trees and branches, the cost of operations, among these those pertaining to snow
damages to roofs or other components of the building envelope. removal and tree pruning, an increased deployment of first
On the one hand, strong wind bursts can tear up or raise responders and of personnel to clear snow or spread melters
certain elements of a house, for example its roof. Not only can and abrasives to make roadways and sidewalks safer.
they compromise the integrity of buildings, they can also cause
serious damages in the vicinity. For example, flying debris may
hit and damage windows, window displays and façades, in
addition to being a hazard for pedestrians. On the other hand,
heavy snowfalls and freezing rain can overload a roof structure
and inflict damages.
The damages caused to homes can entail costs related to
material damages, but also result in increased insurance
premiums and reduced coverage for some homeowners.
Disaster victims may also suffer from psychological trauma.
Destructive storms may also cause power outages. Electrical
cables may be broken, either by strong winds or the
accumulation of ice for instance. When power outages occur in
the wintertime, citizens may have to leave their home in search
of warmth. It can also cause carbon monoxide intoxications
due to the indoor use of heating or cooking devices designed
for an outdoor use. Moreover, the stoppage of residential
medical equipment and the increase in food poisoning due to
Snow clearing in Montréal
the interruption of refrigerators and freezers are also a direct Credit: © Martin Chamberland, La Presse
consequence of power outages, and this in all seasons.
Aerial commodities other than electricity may also be damaged.
The damages inflicted on lights or traffic signs, as well as the
snow, freezing rain or debris on the ground, can disrupt road
traffic. Also, health issues may be aggravated when those
suffering are limited in their movements.
CLIMATE CHANGE ADAPTATION PLAN 20152020 EXECUTIVE SUMMARY 21VULNERABILITY TO DESTRUCTIVE STORMS
The vulnerability of the agglomeration of Montréal to Regarding social sensitivity factors, the three groups of persons
destructive storms is obtained by geographically identifying the identified as the most vulnerable to storms are the materially
infrastructures and groups of persons sensitive to the impacts disadvantaged, those living alone and the elderly. Consequently,
of this hazard and by assuming that all sectors within the the sectors that are home to people possessing many of these
agglomeration of Montréal are liable to be hit by a storm. characteristics present a high vulnerability.
Buildings as well as critical sites and places of interest The map below shows that more vulnerable sectors can be
(for ex. hospitals, police stations, subway stations) are found just about everywhere on the Island of Montréal with a
considered vulnerability factors when present in an area hit by slight concentration in more densely populated neighbourhoods,
a destructive storm. Indeed, significant impacts are associated owing to the concentration of sensitive persons and
with the presence of these elements on the territory either infrastructures in those sectors.
because of direct damage to buildings or impacts resulting
from the limited access to places of interest.
AGGLOMERATION OF MONTRÉAL VULNERABILITY TO DESTRUCTIVE STORMS
Lake of Two Mountains
er
ries Riv
Prai
Des
r
ve
Ri
nce
w re
La
St.
Lake Saint-Louis
Insignificant High
Minor Major
Moderate
0 0.25 0.5 3 4.5 6 km
La Prairie Basin
22 CLIMATE CHANGE ADAPTATION PLAN 20152020 EXECUTIVE SUMMARYDROUGHTS
Different definitions of droughts can be found in the literature. rain were recorded in Dorval and 0.6 millimetres in the McGill
Each describes a different reality and their use depends on University station in August. August 1957 is considered the driest
the issue that is considered. If one focuses on the number of month on record in the Greater Montréal Region.
consecutive days without any precipitations, then one is referring
to a meteorological drought. If the focus is on a water deficit One can assess whether meteorological droughts have increased
in the ground, the reference is to ground or soil dryness (also in Montréal by calculating the number of consecutive days
called an agricultural drought). As far as a hydrological drought without any precipitations in a given time interval, as illustrated
is concerned, this type of drought refers to particularly low levels in the figure below. On this basis, one can observe a very
of surface and groundwaters. Finally, a socioeconomic drought slight upward trend in drought occurrences. However, it is not
integrates the actions of humans on water resources. Obviously, significant and it is still too early to attribute it to climate change.
these types of droughts are all interrelated. Within the context Furthermore, on average, for the whole of Southern Québec, the
of this adaptation plan, ground dryness is the one that is most recorded data show a slight downward trend of the indices of
often mentioned due to its potential considerable impacts on the meteorological drought.
territory of the agglomeration.
With respect to agricultural, hydrological and socioeconomic
droughts, historical observations to date do not allow us to
conclude that they have significantly increased in Montréal owing
LANDMARK EVENTS to climate change. Despite these observations’ uncertainties,
the indications for a long-term change seem clearer. Indeed,
No drought of significant importance has been recorded for
the projected increase in the number of droughts only becomes
the agglomeration of Montréal in the past 30 years. The last
reliable starting in the 2081-2100 period. However, there should
major drought occurred in 1957, when some 2.1 millimetres of
be no alarming situation from now until 2020.
EVOLUTION OF THE NUMBER OF CONSECUTIVE DAYS WITHOUT PRECIPITATIONS FROM MAY TO SEPTEMBER BETWEEN 1942 AND 2014
Data compiled by the meteorological station at Montréal-Trudeau International Airport.
20
18
16
14
NNumber of days
INCREASE OF 14%
12
10
8
6
4
2
0
1942 1948 1954 1960 1966 1972 1978 1984 1990 1996 2002 2008 2014
Years
CLIMATE CHANGE ADAPTATION PLAN 20152020 EXECUTIVE SUMMARY 23IMPACTS
The impacts of droughts on the territory of the agglomeration
of Montréal are mainly related to dry soils. These result in
damages to buildings and infrastructures built on clay soils
when the necessary mitigating measures were not applied to
these constructions. Settling of foundations may occur when
clay soils dry up, thus causing a retraction of the soil. These
damages consist in the appearance of tears in the foundations
which may progress to the walls.
Economically speaking, these damages may have serious
consequences. Since home insurance generally does not cover
the damages caused by the settling of clay soils, their owners
must assume the total repair costs, often very expensive, of the
required work on the foundations.
Similarly, dry soils may also damage sidewalks, road surfaces
and sewer lines built on clay soils.
The environmental impacts of droughts in urban settings mainly
affect the vegetation and waterways. In periods of droughts, Cracks in wall likely due to shifting foundations
the quality of water is generally impaired due to various factors: Credit: © Ville de Montréal
a rise in water temperatures, a decline in dissolved oxygen
concentrations, conditions favouring the development of the
efflorescence of cyanobacteria, eutrophization and an increased On the one hand, the increased demand for water, because
concentration of certain pollutants. of the drought, could result in too much pressure being
brought upon water treatment and purification equipment.
Droughts are a source of hydric stress for plants that may This increased demand could entail a shorter network interval,
even kill them should the drought be protracted. This stress enfeeble the system in the event of a problem and cause an
can reduce the vigor of trees and increase their vulnerability increase in production costs. The adduction ability could be
to pests and pathogens. By impacting the vegetation, droughts impaired if water levels were very low, thus restricting the
reduce the many ecological services that it provides. capacity of water production plants.
Periods of droughts are often accompanied by extreme heats On the other hand, greater coordination and more resources
that affect the levels of atmospheric pollutants. Under dry are necessary to ensure the durability of amenities, green
conditions, dust and particles, as well as pollens, are more spaces and street trees.
easily airborne and contribute to poor air quality. This greater
presence of airborne pollutants and pollens is believed to Finally, more street cleaning operations are required for streets
exacerbate the symptoms of respiratory and cardiovascular to remain clean, as under dry conditions they tend to degrade.
illnesses, and contribute to degrading the health of persons
who are already frail.
In the agglomeration of Montréal, the operational impacts of
droughts particularly affect drinking water production activities
and the maintenance of green spaces and streets.
24 CLIMATE CHANGE ADAPTATION PLAN 20152020 EXECUTIVE SUMMARYVULNERABILITY TO DROUGHTS
The agglomeration of Montréal’s vulnerability to droughts As described previously, buildings, roadways and sidewalks
is determined by considering the buildings constructed in are sensitive to soil contraction when they dry up. The
areas where soils are likely to shrink when dry and there are agglomeration of Montréal is particularly sensitive to
groups of persons sensitive to the impacts caused by droughts, this phenomenon, as a large portion of its soils is clayey.
especially due to impaired air quality. Consequently, the density of buildings is a critical factor in a
vulnerability analysis.
The type of soil was the only factor used to determine the
sectors sensitive to soil contraction in the agglomeration of In terms of the social aspect, the groups of persons who are
Montréal. As was mentioned previously, the soils that contract the most sensitive to droughts are the disadvantaged and
when dry are clay soils. However, factors such as the soil’s persons living alone.
water retention potential and the soil’s occupation also influence
its degree of dryness. For example, roads, parking lots and To summarize, vulnerability to droughts varies greatly from
buildings are all impermeable infrastructures that prevent the one sector to another in the agglomeration, mainly depending
absorption of rainwaters by the soil. on the density of buildings and the concentration of persons
sensitive to the impacts associated with poor air quality.
AGGLOMERATION OF MONTRÉAL VULNERABILITY TO DROUGHTS
Lake of Two Mountains
er
ries Riv
Prai
Des
r
ive
ceR
en
wr
La
St.
Lake Saint-Louis
Insignificant High
Minor Major
Moderate
0 0.25 0.5 3 4.5 6 km
La Prairie Basin
CLIMATE CHANGE ADAPTATION PLAN 20152020 EXECUTIVE SUMMARY 25You can also read