Environment and Climate Regional Accession Network - (ECRAN) Task 1: Position paper on modelling activities
←
→
Page content transcription
If your browser does not render page correctly, please read the page content below
Environment
and Climate
Regional
Accession
Network
(ECRAN)

Task 1: Position paper on
modelling activities -

Compilation of
documents on modelling
activities carried out by
the ECRAN beneficiary
countries _

Support to adaption
planning - Step A
ENVIRONMENT AND CLIMATE REGIONAL ACCESSION NETWORK - ECRAN
                CLIMATE ADAPTATION EXERCISE

       TASK 1: POSITION PAPERS ON MODELLING ACTIVITIES
SUPPORT OF THE IDENTIFICATION OF ADAPTION OPTIONS (ADAPTION
 PLANNING) – STEP A: CLIMATE ADAPTION TOOL: PRIORITISATION OF
                        ADAPTION NEEDS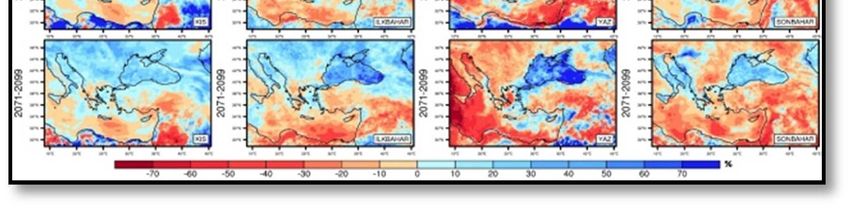
Table of Contents

Background.............................................................................................................................................. 1
    ECRAN Climate Adapt Activities .......................................................................................................... 1
    Knowledge base for adaptation .......................................................................................................... 1
    Development of position papers on specific adaptation topics.......................................................... 3
Annex I: Position Papers of Beneficiary Countries .................................................................................. 5
    Albania ................................................................................................................................................. 5
    Croatia ............................................................................................................................................... 10
    Bosnia and Herzegovina .................................................................................................................... 10
    The Former Yugoslav Republic of Macedonia ................................................................................... 16
    Kosovo*1 ............................................................................................................................................ 18
    Montenegro....................................................................................................................................... 20
    Serbia ................................................................................................................................................. 34
    Turkey ................................................................................................................................................ 37

1
 *This designation is without prejudice to positions on status, and is in line with UNSCR 1244 and the ICJ
Opinion on the Kosovo Declaration of Independence.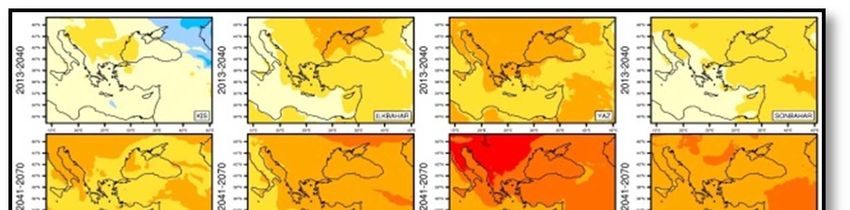
Background

ECRAN Climate Adapt Activities
Within its Climate Component, ECRAN will promote 'climate-proofing' action by further encouraging
adaptation in key vulnerable sectors which would in turn, enable planning for a more resilient
infrastructure, and would support better informed decision-making by addressing gaps in knowledge
about adaptation. ECRAN will address adaptation action by coordinating adaptation activities with
the European Climate Adaptation Platform (Climate-ADAPT) as the 'one-stop shop' for adaptation
information in Europe.

The ECRAN Adaptation Programme includes a series of workshops that will guide the National ECRAN
Adaptation Teams through the different stages towards developing a national climate adaptation
policies and legislation (Activity 4.2). This will be combined with regional training sessions that
support Beneficiary Countries’ experts from the selected technical areas to carry out risk and
vulnerability assessments and adaptation planning (Activity 4.1.b).

Knowledge base for adaptation
Reference is made to the EEA studies and activities on the climate change impacts, vulnerability and
adaptation, all available on the EEA website2. Two particular publications are of particular
importance:
    o Climate change, impacts and vulnerability in Europe (EEA indicator report, Nov 2012 )3
    o National adaptation policy processes in Europe (EEA report published 14 Oct 2014)4

2
    http://www.eea.europa.eu/themes/climate/publications?b_start:int=0
3
    http://www.eea.europa.eu/publications/climate-impacts-and-vulnerability-2012
                                                                                                               1

4
    http://www.eea.europa.eu/publications/national-adaptation-policy-processes
                                                                                                               Page

                  This Project is funded by the                                    A project implemented by
                  European Union                                                   Human Dynamics Consortium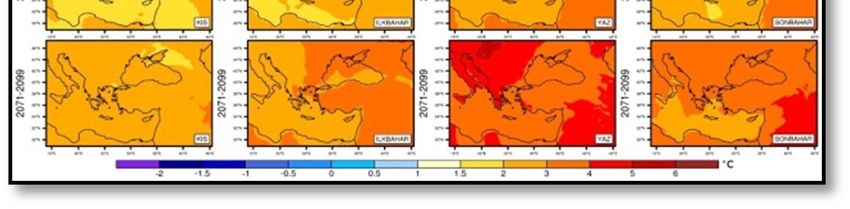
As a part of a first step to prepare the ground for adaptation there is a need to develop a sound
knowledge base. The importance of having 'better informed decision-making' is also highlighted in
the EU Climate Change Adaptation Strategy, which includes this as one of its three main objectives
(EC, 2013). Scientific knowledge, however, needs to be combined with practical and administrative
knowledge. In this context cooperation between scientists, policy actors and other stakeholders such
as civil and business NGOs is fundamental.
• As a first step Establish Exposure Units, Receptors and Risk Assessment Endpoints (climate
    thresholds):
    o The exposure unit represents the system considered to be at risk, often defined in terms of
          geographical extent, location and distribution of a variety population of receptors at risk.
    o These receptors are selected to represent important aspects of the exposure unit,
          particularly those of significance to the decision-making process.
    o Assessment endpoints are chosen to help establish the acceptability of the risk posed to the
          exposure unit(s) by future circumstances and decisions, including those regarding climate
          change risk management.
• For a preliminary screening:
    o Identify and define a set of climate and non-climate variables or factors for the exposure unit
          and for which the receptors may be sensitive;
    o Collect and assess the available data set;
    o Assess the available models and model data (climate, hydrological, impacts);
    o Use climate scenarios to help determine the climate change dependent risk to the receptors;
    o Use non-climate scenarios (population, socio-economic scenarios) to help determine the
          nature of the non-climate dependent risk.
• There are open sources and references of the main observational station datasets (temperature
    and precipitation) that can be used for vulnerability assessment work:
    o Global Historical Climatology Network (GHCN-Monthly and GHCN-daily): Global daily data of
          temperature (max, min and mean) and precipitation from over 43,000 stations (about 8,500
          of which are regularly updated with observations from within the last month) for a period
          starting already from the 19th century5.
    o E-OBS gridded dataset: E-OBS is a daily gridded observational dataset for precipitation,
          temperature and sea level pressure in Europe. The full dataset covers the period 1950-01-01
          until 2013-12-31. Currently it is maintained and elaborated as part of the UERRA project (EU-
          FP7).6
    o MED-HYCOS (Mediterranean Hydrological Cycle Observing System): Network of hydro-
          meteorological real time or near real time data collecting platforms     (DCPs) on the main
          rivers of the Mediterranean catchments. (Albania, Bosnia, Croatia, former Yugoslav Republic
          of Macedonia).7
• The CORDEX tool is providing global coordination to produce improved regional climate change
    projections of all land regions world-wide. The results are fed into the climate change impact and
    adaptation studies within the timeline of the Fifth Assessment Report (AR5) of the IPCC. 8

5
    http://www.ncdc.noaa.gov/data-access/quick-links#ghcn
6
    http://eca.knmi.nl/maxtemp_EOBS.php
7
    http://medhycos.mpl.ird.fr/
                                                                                                               2

8
    http://cordex.dmi.dk/joomla/ and http://www.euro-cordex.net/ and http://wcrp-cordex.ipsl.jussieu.fr/
                                                                                                               Page

                  This Project is funded by the                                    A project implemented by
                  European Union                                                   Human Dynamics Consortium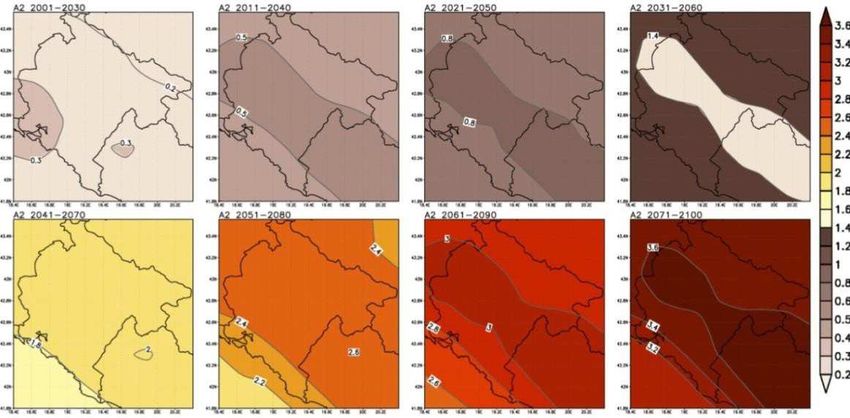
Development of position papers on specific adaptation topics
During the November 2014 ECRAN Adapt STEP A Workshop (see above and also at
www.ecranetwork.org), it was agreed to complete the following three tasks and report on their
progress to the ECRAN team by the deadlines indicated. The outputs will serve as input and
background to the so called STEP B Workshop to be held in May 2015.

Task 1. Position paper on modelling activities (climate models, impact models) performed in your
country. Deadline: 1 February 2015.
Considering past weather events will help to gain a better understanding of the current vulnerability
of a country and current impacts of climate change. It will help determine a country’s sensitivity to
current weather and thus, provide significant insight for the current adaptation needs. From there
climate models give an outlook on the long-term changes/changes over time and give directions for
related adaptation action and needs.
The countries were invited to prepare a position paper on the available relevant existing work, such
as national risk or vulnerability assessments and the availability and use of climate models, which can
provide an excellent starting point for answering these questions. It was expected that information
could be obtained from national Met Offices.
The position paper should be up to 2 pages.
Task 2: The countries were asked to make a qualitative vulnerability assessment of 2 sectors in their
respective countries (first sector: Water resources and links to DRM and cross border aspects) and
the second sector of their own choosing. Method: Use the Adaptation Support Tool of Climate-
Adapt. Deadline: 2 April 2015.
The countries were invited to prepare two short qualitative vulnerability studies for the water sector
and the second sector, which they selected themselves.
    o   As a first step, available information for the country’s future threats (e.g. sectoral
        vulnerability assessments) and opportunities would need to be collected and analysed.
    o   If the available information base was not sufficient for elaborating adaptation responses for
        the two sectors (water and the other chosen sector), additional assessments would need to
        be carried out. Various approaches for risk assessments are available, e.g. from the UK and
        Germany and were addressed in the November workshop. Methods of measuring physical
        vulnerability normally range from the empirical methods to the use of models. The following
        empirical methods could be considered for the studies:
        •   Analysis of observed damage Based on the collection and analysis of statistics of damage
            that occurred in recent and historic events. Relating vulnerability to different hazard
            intensities.
        •   Expert opinion Based on the asking groups of experts on vulnerability to give their
            opinion, for instance on the percentage damage they expect for a particular sector
            having different intensities of hazard/impact.
        •   Score Assignment: Method using a questionnaire with different parameters to assess the
            potential damages in relation to the different hazard levels.
Each vulnerability assessments should range between 5 - 10 pages for each sector (excluding the
annexes).
                                                                                                          3
                                                                                                          Page

Task 3: the countries were asked to identify the adaptation needs and prepare a position paper

              This Project is funded by the                               A project implemented by
              European Union                                              Human Dynamics Consortium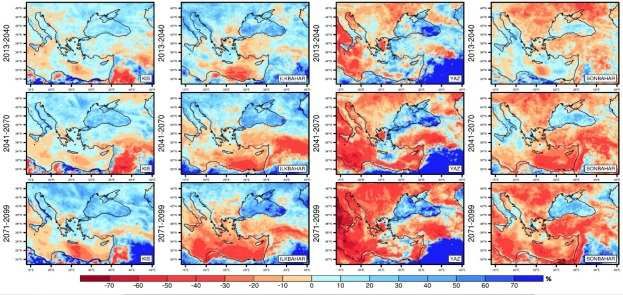
based on vulnerability assessments of their two sectors.. Method: Use the Adaptation Support Tool
Deadline: 1 May 2015.
The countries were asked to prepare a a position paper based on vulnerability assessment for each of
the two studied sectors, and identify the adaptation needs and a list of options. These will be later
assessed and elaborated.
The two adaptation options papers should contain up to 5 pages each.
This document summarises the results of Task 1 only. Hereafter the position papers on modelling
activities (climate models, impact models) performed in the ECRAN beneficiaries are presented in the
annex for:
    •   Albania
    •   Croatia
    •   Bosnia and Herzegovina
    •   The former Yugoslav Republic of Macedonia
    •   Kosovo*
    •   Serbia
    •   Turkey

Please note that the attached position papers have not been reviewed by the ECRAN Team. The
National Adapt Teams agreed to distribute the Task 1 position paper among the regional
stakeholders.

                                                                                                        4
                                                                                                        Page

              This Project is funded by the                             A project implemented by
              European Union                                            Human Dynamics Consortium
Annex I: Position Papers of Beneficiary Countries

The position papers from the ECRAN beneficiaries are included in this section, which is a
compilation of the documents submitted to the project and have not been reviewed by the ECRAN
Adaptation Team.

Albania
Introduction
Studies on Climate change impacts in Albania have been carried out since 1993 with the very first
project ‘Implications of Climate Change for the Albanian Coast’9, implemented in the frame of the
Coastal Areas Management Program of UNEP/MAP. This study is followed by the First and Second
National Communications to UNFCCC10, prepared by the Climate Change Programme of UNDP, in the
frame of the projects ‘Enabling activities for the preparation of national communications of Albania
related to the UNFCCC’. In all these reports the respective Vulnerability and Adaptation Chapters
consist of climate change scenarios, impact analysis of current and expected climate changes,
assessment of adaptation measures and actions. The Third National Communications to UNFCCC is
under preparation.
Impact analysis of current and expected climate change and adaptation was focused on
sectors/systems:
       •    Water resources (FNC, SNC and TNC);
       •    Natural ecosystems (FNC, TNC);
       •    Managed ecosystems (agriculture, forestry- FNC);
       •    Energy, transport (FNC, SNC);
       •    Tourism (FNC, SNC and TNC);
       •    Population (FNC, SNC and TNC);
       •    Health (FNC and TNC);
       •    Natural disasters related to climate (TNC).

The most important and detailed results in the modelling and climate impact were received through
implementation of the project, ‘Identification and Implementation of Adaptation Response Measures
in the Drini - Mati River Deltas’ (DMRD), a pilot MSP project, financed by GEF/UNDP/Government of
Albania11.

9
  Available at
http://www.unepmap.org/index.php?module=library&mode=mts&action=results&_stype=3&s_category=MAP%20Technic
al%20Reports%20MTS&s_descriptors=Climate%20change
                                                                                                                 5

10
     Available at http://www.al.undp.org/content/albania/en/home/library/environment_energy/
                                                                                                                 Page

11
     Available at http://www.al.undp.org/content/albania/en/home/library/environment_energy/

                   This Project is funded by the                                     A project implemented by
                   European Union                                                    Human Dynamics Consortium
Other important contribution on climate modelling and impact analysis is provided by two other
projects, financed by World Bank, already finalized12:
       •    Reducing the Vulnerability of Albania's Agricultural Systems to Climate Change: Impact
            Assessment and Adaptation Options’;
       •    Climate Vulnerability Assessments: An Assessment of Climate Change Vulnerability, Risk, and
            Adaptation in Albania's Energy Sector.

       1. Methodological approach
This report describes only the methodological approach used in the project implemented by the
Climate Change Programme of UNDP.

1.1 Climate Modelling
The Climate Change scenarios for temperature, precipitation, mean sea level pressure and sea level
rise are developed by using the model MAGICC/SCENGEN (v. 5.3, v 2)13. As in vulnerability
assessment is recommended to use a range of SRES scenarios with a variety of assumptions to
capture the range of uncertainties associated with driving forces and emissions, the global model
MAGICC is run by using the following scenarios from different SRES families: A1BAIM, A2ASF,
B1IMA, B2MES, A1T-MES, A1FI-MI14.
Change fields, scaled in SCENGEN by the global-mean temperature change derived from MAGICC are
used to develop the climate scenarios. The changes are generated for each emission scenario up to
the year 2100, by using a multi-model average. The justifications for use of a multi-model average
are two-fold. First, multi-model averages are less spatially noisy. Second, by many measures of skill,
multi-model averages are often better than any individual model at simulating the present-day
climate.
A climate-change projection is the change between a model simulation of present climate15 and the
model climate projection for a period in the future, under a specific emissions scenario. The changes
in annual and seasonal patterns of temperature, precipitation and mean sea level pressure are
generated for every ten years starting with 2020 up to 2100. It is to be noted that the time horizon
means that the model is run for a period of 30 years, e.g. for the year 2050 the running time is from
2035 to 2065. The likely changes temperature, precipitation and mean sea level pressure are
calculated. For the impact analysis mainly the projections for temperature and precipitation are
considered.

12
     available at http://hdl.handle.net/10986/16198
13
     http://www.cgd.ucar.edu/cas/wigley/magicc/
                                                                                                          6

14
     See SNC, DMRD reports
                                                                                                          Page

15
     In this report period 1961-90 is considered as climatic baseline

                    This Project is funded by the                          A project implemented by
                    European Union                                         Human Dynamics Consortium
To evaluate the expected impacts of sea level rise, the model DIVA16 was run in parallel with MAGICC
(with the same scenarios as in MAGICC) for the Albanian coastal part17.

1.2 Model Validation
The General Circulation Models (GCMs) used to run SCENGEN are selected on the basis of their
ability to accurately represent current climate, for Europe and Balkan as well as for the globe. In
Albanian case the annual precipitation is used as the validation variable. Precipitation is more
difficult to model than temperature and models do less well in simulating precipitation than
temperature, so using precipitation is a stringent test of the model skill. For this model validation the
statistics used are: pattern correlation (r), root-mean-square error (RMSE), bias (B), and a bias-
corrected RMSE (RMSE-corr).
After a detailed statistical analysis of these parameters five top models that better simulate the
present precipitation pattern are selected: BCCR-BCM2 (Norway); CNRM-CM3 (France); GFDLCM21
(USA); UKHADCM3 (UK); INCM-30 (Russia).

1.3 Climate Change Scenarios
The seasonal and annual expected changes in temperature and precipitation patterns for Albania,
developed by using the mentioned methodology have a low resolution (50*50 km), that is not
appropriate for adaptation. Given that a statistical downscaling process up to 1*1 km, taking into
account the topography, is carried out for different parts of Albanian territory as per project focus.

1.4 Climate Indices
The changes in following climate indices are evaluated for the use in impact analysis:
       •    Maximum temperatures ≥ 35°CFout! Bladwijzer niet gedefinieerd.;
       •    Minimum temperatures < -5°C;
       •    Hazardous precipitation;
       •    Number of days with hazardous precipitation and SPI3 values;
       •    Expected changes in growing season;
       •    Degree days for heating and cooling;
       •    Tourism climate index (TCI).

       2. Impacts analysis
The impact analysis is based on the three main approaches:

16
    DIVA, a fully dynamic and interactive tool (product of the DINAS-COAST consortium), consists of a global coastal
database, a model, a set of scenarios and a GUI that enables its users to simulate the effects of climate and socioeconomic
                                                                                                                              7

change and of adaptation on natural and human coastal systems at national, regional and global scales.
                                                                                                                              Page

17
     Source: Albania’s Second National Communication to UNFCCC

                  This Project is funded by the                                         A project implemented by
                  European Union                                                        Human Dynamics Consortium
• Modelling;
• Analogue studies;
• Expert judgement.
For impact analysis of climate change in different sectors/systems the following methods are used:
• Water resources: WATBAL, WEAP, empirical statistical models;
• Agriculture: CROPWAT 8, statistical models, analogue studies, expert judgment;
• Forestry: statistical models to evaluate the shift in bioclimatic floors, DIVA (expected changes
in coastal forestry areas), analogue studies, expert judgment;
• Biodiversity : GIS maps to evaluate the loss of biodiversity from sea level increase; DIVA
(total wetland area, net loss of wetland area, low unvegetated wetlands area), empirical
models analogue studies, expert judgment;
• Tourism : Statistical models , Tourism Comfort Index18 , expert judgment , GIS;
• Population & settlements: GIS maps and DIVA to evaluate the population and the loss of
settlements threatened by the sea level rise in coastal areas;
• Energy: LEAP to develop the scenarios of the energy demand and supply under the climate
change conditions.
3. Adaptation Analysis
Adaptation responses and decisions proposed by each and every sector/system are categorized as
measures and strategies that contribute either to19:
• Building adaptive capacity – creating the information (research, data collecting and
monitoring, awareness raising), supportive social structures (organisational development,
working in partnership, institutions), and supportive governance (regulations, legislations,
and guidance) that are needed as a foundation for delivering adaptation actions; or
• Delivering adaptation actions – actions that help to reduce vulnerability to climate risks, or to
exploit opportunities (classified as EbA, CbA, hard engineering)
In TNC another classification for adaptation measures is used: green, grey, soft and fiscal adaptation
measures.
There are many different criteria that might in principle be used for prioritization. The criteria already
used by the adaptation team within the Climate Change Programme have been grouped under five
separate Heading Criteria, which may themselves help to prompt the inclusion of other criteria that
may be important in specific circumstances. The Heading Criteria have been developed within a
Scoring Rate.
18
After Mieczkowski Z (1985) The tourism climatic index: a method of evaluating world climates for tourism. Can Geogr 29:
8
220–233
Page
19
See the Project Synthesis report ‘Identification and Implementation of Adaptation Response Measures in the Drini - Mati
River Deltas’
This Project is funded by the A project implemented by
European Union Human Dynamics ConsortiumThe Heading Criteria are:
• Financial Indicative Cost - covering the secured and estimated cost and expenditure
associated with the project and the sources of finance.
• Time Frame Criteria - measure or action in question to the time implementation planning,
that may impact on the timing or success of a proposed project.
• Potential Partnership - particularly in relation to support for or opposition to a proposed
project and mobilization of additional funds.
• Principle of Additionality Criteria - that assesses existing institutions or related
activities/measures that could provide additional values.
• Win-Win Criteria - covering the wider economic framework (costs, benefits and affordability),
relating directly to the nature of the project and how it can be implemented successfully to
increase the resiliency of ecosystems and protection of the community.
9
Page
This Project is funded by the A project implemented by
European Union Human Dynamics ConsortiumCroatia
Climate modelling
National Meteorological and Hydrological Service (DHMZ) supports various regional climate
modelling activities. A group of currently three experts; Ivan Güttler, Ph.D. Mirta Patarčić, M.Sc.,
Lidija Srnec, M.Sc. and until recently Čedo Branković, Ph.D., is active in model development and
evaluation. The main modelling tool is regional climate model RegCM4. Additionally, results of the EU
FP6 project ENSEMBLES and recent CORDEX activity are used in estimating the uncertainty related to
model formulation. Standard analysis includes an evaluation of the model systematic errors and
estimation of historical and projected climate changes and trends. Some of the results are published
in scientific papers as well as in the national reports on climate change. The group is active in
introducing obtained results to various stakeholders in the process of mitigation and adaptation on
climate change.
Current major activities include:
1. Contribution to the Croatian Science Foundation project CARE. Several high-resolution
simulations will be performed in the scope of this project during the period 2014-2018;
2. Results of the CARE project (simulations at 12.5 km horizontal resolution) and of the internal
DHMZ modelling activities (simulations at the 50 km horizontal resolution) are planned to be
submitted to the common CORDEX database.
In order to: (1) fully support all activities related to regional climate modelling, (2) to extend the
analysis of the large climate model ensembles and (3) to provide requested data to various impact
and end users, an extension of DHMZ computing and data archiving capacities and an increase in the
number of group members is needed in near future.
Risk Assessment
Croatia has a legal obligation to prepare risk assessments at all three levels of government – national,
regional and local. Risk assessment is not oriented to the climate change but assesses the
vulnerability from all natural and technological threats. The focus is on identification, classification
and evaluation of threats and at exposure of people, material goods and environment. The impact of
climate change is mentioned in the context of extreme weather events.
Disaster Risk Assessment in the Republic of Croatia is currently under preparation (to be completed
by the end of 2015). In this document, climate change is not treated as a separate risk but as a
driving force of other risks (such as drought, extreme temperatures, extreme precipitations, soil
salinization, floods) and as important factor in the risk analysis such as the occurrence of harmful
organisms and plant and animal diseases, and the occurrence of epidemics and pandemics. In
addition to analysis of threats, calculation will also include analysis of vulnerability of society to
disasters.
Upon completion of the Risk Assessment, Strategy for Disaster Risk Reduction will be prepared. It will
define next steps in reducing the vulnerability to the identified and emerging risks. Mitigation and
adaptation to climate change will be significant parts of the future Strategy for Disaster Risk
Reduction, taking in consideration the existing historical data on damages.
10
Page
This Project is funded by the A project implemented by
European Union Human Dynamics ConsortiumBosnia and Herzegovina
Compiled by: Ozren Laganin, Milica Djordjevic, Ines Cizmic, Igor Kovacic, Goran Trbic, Sabina Hodzic, Nenad
Trbic, Tatjana Kapetanovic, and Bakir Krajinovic.
Situation Analysis
As a result of historic and current greenhouse gas emissions, and recent vulnerability estimates,
Bosnia and Herzegovina will be exposed to climate change impacts that could have consequences for
its entire society. Opportunities to protect against such impacts at the local level are quite
limited, but there are still numerous options for climate change adaptation.
The observed climate change, with respect to the reference period of 1961-1990, shows an increase
in annual air temperature in the range of 0.4 to 0.8°C whilst the temperature increases during
vegetation periods were up to 1.0°C. Over the past several decades, increased climate variability has
been noted in all seasons and across the entire territory of Bosnia and Herzegovina: five of the past
12 years were very dry to extremely dry, and four of these years were characterised by extreme
flood events. The past four years (2009-2012) have all been characterised by extreme events:
flooding in 2009 and 2010, drought and high heat in 2011 and 2012, cold weather? in early 2012, and
strong wind in mid-2012.
At the same time, decrease in the number of days with rainfall exceeding 1.0 mm and an increase in
the number of days with intensive rainfall caused disruptions in the pluvio-metric regime.
Pronounced change in the annual rainfall patterns, coupled with temperature increases, is one of
the key factors causing more frequent and intensive occurrences of draught and floods on the
territory of Bosnia and Herzegovina. Risk of forest fires is highly significant in the southern parts of
the country.
The analyses of the observed climate change in the country are based on the data from a
homogeneous series of observations from 22 meteorological stations and from approximations
where appropriate. Climate change determinants were established based on an analysis of
temperature change and precipitation change. Detailed analyses covered: changes in annual
temperature and precipitation for the periods 1961-1990 and 1981-2010; trends in temperature
and precipitation changes; and extremes in temperature and precipitation for cities of Banja Luka,
Sarajevo and Mostar for the period 1960-2010.
Models for Projections of Future Climate Change
The Initial and Second National communication have recognized the following sectors as the most
vulnerable to climate change in Bosnia and Herzegovina: agriculture, water resources, human
health, forestry and biodiversity, as well as the vulnerable ecosystems.
Detailed analyses were conducted of the long-term climate change vulnerability and impacts in these
sectors based on the SRES climate scenarios A1B and A2. These reference or “baseline” scenarios
are defined by the IPCC special report on emission scenarios (Nakicenovic and Swart, 2000) and
11
each makes assumptions about greenhouse gas emissions from the future technological, social and
economic development based on human activity. In terms of GHG concentrations, A1B is
Page
characterized as a “medium” scenario and A2 as a “high” scenario according to the projected levels
This Project is funded by the A project implemented by
European Union Human Dynamics Consortiumof greenhouse gases in the atmosphere. In the A1B scenario, the value of the atmospheric
concentration of carbon dioxide (CO2), one of the greenhouse gases is approximately 690 parts
per million (ppm) at the end of 21st century, and in the A2 scenario it is approximately 850 ppm.
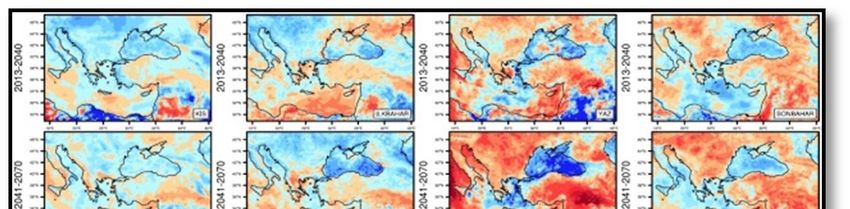
Model results were analysed for the time series 2001- 2030 and 2071-2100. This section focuses on
two basic ground meteorological parameters: air temperature at 2 meters and accumulated
precipitation. Changes in these parameters are shown with reference to mean values from the so-
called base (standard) period of 1961-1990.
A1B scenario, 2001-2030
According to climate model results, the mean seasonal temperature changes for the observed thirty-
year period 2001-2030 are expected to range from +0.6 to +1.4°C, depending on the season and
the region of Bosnia and Herzegovina. The biggest changes will be during the months of June, July
and August (JJA), with predicted changes of +1.4 in the north and +1.1°C in southern areas. During
the months of December, January and February (DJF) changes are approximately +0.7°C, with
maximum values in central parts of BiH. During the months of March, April and May (MAM) changes
are slightly bigger than during DJF, with values ranging from +0.8 to +0.9. During the months of
September, October and November (SON) changes range from +0.6 in the western part of the
country to +0.8, in the eastern part. Figures for precipitation changes show that the models
resulted in both positive and negative variations of this parameter. Positive changes in
precipitation, i.e. an increase, may be seen during the March, April, May (MAM) season, i.e. +5% in
the north and northeast, and during the June, July and August (JJA) season in almost the entire
territory, with a maximum of +15%, with the exception of the southeast. The biggest deficit is
predicted along the south-western border of BH, with a maximum of -20%.
Average annual temperature change in °C (left) and precipitation change in % (right)
Annual temperature changes range from 0.8 to 1°C, with higher values in the north and in the west of
the country (figure above),. Annual precipitation change is negative in the entire territory, ranging
from 0 to -10%., with the exception of the northeast, where precipitation is expected to increase by
up to 5%.
A1B scenario, 2071-2100
12
Results for the A1B scenario during the period 2071-2100 show that spatial distribution of changes
Page
in corresponding parameters, mainly the temperature, are similar to the previously observed period
This Project is funded by the A project implemented by
European Union Human Dynamics Consortium2001-2030, but with a greater magnitude of changes. This time, changes in temperature range
from +1.8 to +3.6°C. The biggest changes of +3.6°C are again predicted for the months of June,
July and August (JJA). During the winter season (December-January-February), maximum is again
predicted in central regions, with values up to 2.4°C. During the March-April-May season temperature
changes from 2.4 to 2.6°C at the entire territory. Finally, during the September – October –
November season changes range from 2.0 to 2.4°C.
During this period, there is almost no season or region that is characterized by a positive
precipitation anomaly. Large negative anomalies are predicted for the December-January-
February (DJF) and September-October-November (SON) seasons, with changes ranging from -15
to -50%. The March-April-May season is characterized by values of approximately -10% for the
entire territory. The deficit during the June-July-August season (JJA) is greater in southern than in
northern regions ranging from -30 to 0%.
Annual temperature changes range from 2.4 to 2.8°C, with greater values in the south and in the west
of the country. Annual precipitation change is negative in the entire territory, ranging from -30 to -
10%.
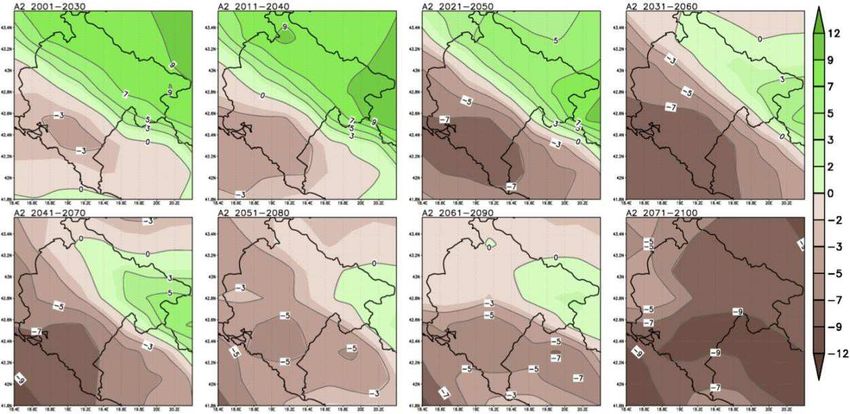
A2 scenario, 2071-2100
In the A2 scenario for the period 2071-2100, the expected increase in temperature in the entire
territory of BiH ranges from 2.4 to 4.8°C. The biggest increase will be during the months of June, July
and August (JJA) season with values above 4.8°C. During the December, January and February (DJF)
season; the maximum predicted change is approximately 3.6°C. The March, April and May (MAM)
season have predicted values ranging from 3.4 to 3.6°C. During the September, October and
November (SON) season the changes are again bigger in the western part of the country, ranging from
2.8 to 3°C. With the exception of the DJF season, the A2 scenario has a negative anomaly in terms of
accumulated precipitation across the entire territory. With the exception of the south eastern
regions, the December, January and February (DJF) season has a positive anomaly across almost the
entire territory, ranging from 0 to +30%. The biggest changes in this scenario are predicted during the
June, July and August (JJA) season, with values of -50%.
During the March, April and May (MAM) season and the September, October and November (SON)
season, anomalies range from -30 to 0%. Annual temperature changes under the A2 scenario range
from 3.4 to 3.8°C for this period (figure below). Annual precipitation change is negative throughout
13
the entire territory, ranging from -15% to 0%.
Page
Temperature change (°C), annual season (left) and precipitation change (%) (right)
This Project is funded by the A project implemented by
European Union Human Dynamics ConsortiumSummary of scenarios
Results from two global climate models: SINTEX-G and ECHAM5 indicate a mean seasonal
temperature increase averaging +1°C by 2030 compared to the base period 1961 – 1990 over the
whole Bosnia and Herzegovina. The largest increase of +1.4°C is expected during summer time (June
– August). For the A2 scenario (2071-2100), the rapid temperature increase of +4°C yearly average is
expected, while the expected increase in temperature during summer time will go up to +4.8°C.
Models indicate uneven precipitation changes. A slight increase in precipitation in mountain and
central areas is expected, while negative precipitation anomalies are projected for the other areas.
According to the A2 scenario for the period 2071-2100, negative precipitation is expected across the
whole B-H territory. The largest precipitation deficit of up to 50% compared to the base period 1961-
1990 is expected during summer months.
Temperature change in °C, SINTEX -5 model.
A1B 2001-2030 A1B 2071-2100 A2 2071-2100
DJF 0.6 – 0.9 1.8 – 2.4 2.4 – 3.6
MAM 0.8 – 0.9 2.4 – 2.6 3.4 – 3.8
JJA 1.1 – 1.4 3.4 – 3.6 4.6 – >4.8
SON 0.5 – 0.9 2.0 – 2.4 2.8 – 3.2
YEAR 0.8 – 1.0 2.4 – 2.8 3.4 – 3.8
Temperature change in °C, ECHAM5 model
A1B 2001-2030 A1B 2071-2100 A2 2071-2100
DJF 0.2 – 0.5 3 – 3.8 3.2 – 4
MAM < 0.2 2.2 – 2.6 2.6 – 3.2
JJA 0.5 – 0.8 4 – 4.2 4.4 – 4.8
SON 0.9 – 1.1 3.4 – 3.8 3.8 – 4.2
YEAR 0.4 – 0.6 3.2 – 3.6 3.6 – 4.0
Precipitation change in %, SINTEX -5 model
14
A1B 2001-2030 A1B 2071-2100 A2 2071-2100
DJF -15 – -5 -50 – -10 -5 – 30
Page
This Project is funded by the A project implemented by
European Union Human Dynamics ConsortiumMAM -10 – 5 -15 – 0 -30 – 0
JJA -5 – 15 -30 – 0 -50 – 0
SON -10 – 20 -50 – -15 -30 – 0
YEAR -20 – 10 -30 – -10 -15 – 0
Precipitation change in %, ECHAM5 model
A1B 2001-2030 A1B 2071-2100 A2 2071-2100
DJF 0 – 10 -15 – 5 -30 – 15
MAM 0 – 15 -5 – 15 -10 – 10
JJA -10 – 10 -50 – -20 -50 – -20
SON -10 – 5 -30 – -5 -20 – 0
YEAR -5 – 10 -15 – -5 -20 – -5
Results from the several regional climate models, in accordance with the SRES scenarios of future
climate A1B and A2 (Nakicenovic and Swart, 2000), will be used in the process of development of
the Third National Communication of B-H. These models are defined by Fourth Report of
IPPC/AR4, and RCP8.5 scenario of future climate (Moss et al., 2008), as defined by the Fifth IPPC
Report (IPCC – AR5).
Results of the regional climate model EBU-POM (Djurdjevic and Rajkovic, 2010) will serve as a
basis for future changes of extreme precipitation regime which may cause possible risks of
landslides, floods and other natural disasters. Results of this models were used as a basis for
impact analyses and vulnerability of socio-economic sectors to the climate change in the Second
National Communication to the UNFCCC (Trbic et al., 2015)
Horizontal resolution of these results is 25 km, and time resolution span is 6 hours, that will enable
improved insight in the possible changes of short-term extensive precipitations that in the most
cases cause the natural disasters. As an additional data source, the non-hydrostatic regional
model NMMB (Janjic and Gall, 2012) will be used, due to its high horizontal resolution of 8km
and time resolution of 6h, for the period 2011-2100 obtained by regionalization of scenario
RCP8.5.
15
Page
This Project is funded by the A project implemented by
European Union Human Dynamics ConsortiumThe Former Yugoslav Republic of Macedonia
As a country that is Party to the United Nations Framework Convention on Climate Change (UNFCCC)
as a non-Annex I country and party to the Kyoto Protocol, the former Republic of Macedonia adopted
three National Communications on Climate Change (in the year 2003, 2008 and 2014).
The preparation and adoption of the Third National Communication on Climate Change (2014) came
as an obligation according to the Law on Ratification of the United Nations Framework Convention
on Climate Change, the Law on Environment and The Programme on Adoption of the EU Acquis. The
preparation of these three plans was supported by the Global Environmental Fund (GEF) and the
UNDP. The thematic reports were prepared by the relevant scientific and specialized institutions:
MANU (Macedonian Academy of Science and Arts), the Research Centre for Energy, Computer
Science and Materials and UHMR (National Hydro-met Office) as well as by other relevant experts.
In the following text, the climate vulnerability and climate change scenarios up to 2100 developed by
the National Hydro-met Office are presented.
Climate Variability
Analysis of the multi-year variation of the mean annual temperature shows that in the most recent
20 years (1994-2012) the mean annual temperature has been constantly higher than the multi-year
average. Differences in the mean annual temperature in comparison with the period from 1961 to
1990 range from 0.2°C to 0.5°C. This is consistent with results from the broader region. The warmest
years recorded on the territory for the period between 1951 and 2012 and for which data from all
meteorological stations are available are 1952, 1994, 2008, 2007 and 2010. The highest maximum air
temperature in the country – an unprecedented 45.7°C – was measured on July 24, 2007. A similar
analysis of precipitation for different regions of the country by years and by seasons – with a special
focus on May and November as the months with the most rainfall throughout the year – indicated a
general trend of decrease in rainfall. However, due to the fluctuations in levels of precipitation from
year to year, it is difficult to establish the exact amount of this decrease in annual precipitation totals.
Analysis of data on the extreme weather events (1961-2012) indicated that the number of summer
days has increased significantly in recent years compared to the number at the beginning of the
analysed period. Similarly, there has been a significant increase in the number of tropical nights in
recent years. An analysis of cold waves and cold weather concluded that cold waves occurred much
less frequently than heat waves. While there was a general trend of decline in the number of ice days
per year, there was no general change in the number of annual frost days.
Climate Change Scenarios up to 2100
Climate change projections were carried out with the use of the MAGICC/ SCENGEN software
package Version 5.3. Six IPCC SRES/AR4 scenarios were used in the process: А1B-AIM, А1FI-MI, А1Т-
MES, А2-AS, B1-IMA and B2-MES, and air temperature and precipitation changes were assessed for
16
the period 2025–2100 (reference period: 1961–1990). Data from 18 models were used in the
estimation, generating results for two central geographical points. Scenarios were generated for four
Page
characteristic years, for each central point, for each of the three values of climate sensitivity, and for
This Project is funded by the A project implemented by
European Union Human Dynamics Consortiumeach of the six scenarios. Values were produced for air temperature and precipitation changes
monthly and seasonally.
The modelling results led to the following conclusions:
1. It is probable that there will be a continuous increase in temperature in the period 2025–
2100;
2. Compared with the period 1961–1990, the predicted changes for the period 2025-2100 will
be most intense in the warmest period of the year;
3. It is possible that the average monthly temperatures at the turn of winter into spring will be
levelled in this period;
4. A decrease in precipitation is predicted in the period 2025–2100, in all seasons and at the
annual level, with the maximum decrease in the summer season;
5. The intensity of changes is greatest in the warm part of the year (in July and August, there
may be no precipitation at all); and
6. In the cold period of the year, decreases in precipitation of up to 40% of the average monthly
quantities are predicted.
In order to examine the robustness of their findings, the modellers also studied differences between
the findings obtained and findings from three previous modelling efforts that produced projections
for the former Republic of Macedonia. The primary cause for the differences in the results was
judged to be the use of different principles when estimating changes.
In the Third National Communication on Climate Change (2014), an analysis of impacts, vulnerability
and adaptive capacity for eight sectors: agriculture and livestock, biodiversity, forestry, human
health, tourism, cultural heritage, water resources, and socio-economic development were
undertaken.
17
Page
This Project is funded by the A project implemented by
European Union Human Dynamics ConsortiumKosovo*
The development of the Climate Change Framework Strategy (CCFS) has been initiated in December
2012 by the Ministry of Environment and Spatial Planning (MESP) with support from UNDP. The
present Climate Change Framework Strategy is an initial step in an adaptive management feedback
policy process. It is also an opportunity to look for mitigation and adaptation measures that will
boost sustainable development. Therefore, it consists of two components: Low Emission
Development Strategy (LEDS) and the National Adaptation Strategy (NAS) presented in this strategy
subsequently in two sections.
Although Kosovo* has not participated in or signed the UN Framework Convention on Climate
Change (UNFCCC) and its Kyoto Protocol yet, it has the responsibility to respond to the requirements
of the Convention and the Protocol, as one of the signatories of the Energy Community Treaty. The
Energy Community Treaty also sets clear reduction targets for the energy use while it demands
increase in the share of renewable energies.
The present Climate Change Framework Strategy is an initial step in an adaptive management
feedback policy process. It is also an opportunity to look for mitigation and adaptation measures that
will boost sustainable development. It is crucial for responding and anticipating the impacts of
climate change in Kosovo*.
1. Alternatives considered: Possible Development Scenarios
Global prediction models
In case of development of Climate Change Strategy (mitigation and Adaption), UNDP expert used the
GAINS model. The US based International Futures considers Kosovo* as part of a group of countries
together with Serbia and Montenegro due to lack of separate historic statistical data. So only very
general observations regarding scenarios for Kosovo* are possible until separate datasets are
developed and entered in these models for the country.
The GAINS model1 is a set of models managed by the IIASA (Austria) on behalf of the EU. It includes
various scenarios and data resulting from different EU research project. Below the projections from
some of these scenarios are presented for the group of countries.
Often, technical measures are not sufficient anymore, and public authorities, non-governmental
organizations and private companies are looking for other solutions to ensure that the vulnerable
water resources are managed in a sustainable manner. However, current institutional arrangements
are often insufficient to manage these new challenges adequately and innovative and adaptive ways
for the governance of climate adaptation are required.
Within this context, Kosovo* is faced with great challenges to make its public governance system
more resilient and flexible, for instance related to: 1) dealing with uncertainties in decision-making,
in particular related to the unpredictable future of climate change, for example by means of long
term scenario analyses, risk assessments and vulnerability assessments; 2) introduction of integrated
approaches and adaptive management concepts;
18
Page
*
this designation is without prejudice to positions on status, and is in line with UNSCR 1244 and the ICJ Opinion on the
Kosovo* Declaration of Independence.
This Project is funded by the A project implemented by
European Union Human Dynamics ConsortiumThe 39 interventions presented in the previous section have been evaluated, based on multi-criteria
analysis (MCA), in order to provide an overall ordering of interventions and to distinguish between
short term, medium term and long term interventions.
19
Page
This Project is funded by the A project implemented by
European Union Human Dynamics ConsortiumMontenegro
Compiled by: Sanja Pavicevic, Slavica Micev, Mladenka Vujosevic, Tonka Popovic, Tanja Mirkovic, Miras
Drljevic
Situation Analysis
Montenegro is located in the central part of the warm moderate zone of the northern
hemisphere (41 ° 52 'and 43 ° 32' North Latitude and 18 ° 26 'and 19 ° 22' East Longitude).
Montenegro has a Mediterranean climate, with warm and somewhat dry summers and moderately
cold and pretty wet winters.
Table 1. IHMS data for the period climatological normals (1961-1990):
Mean annual air temperature 11,2°C
Mean annual rainfall 1.500,5 mm
Mean intensity of heavy rains in the days with over 20 mm 38,2 mm/day
The mean length of the dry season 28,7 day/year
Average length of frost period 71,5 day/year
The mean length of heat waves 7,5 day/year
Climate classification - 3 climate types Cs-Mediterranean, Cf-moderately warm
and wet, Df-snowy-forest climate
Figure 1. Spatial distribution of meteorological stations whose data were used to update the data
and verification of the EBU-POM regional climate model; the figure shows the climate classification by
Köppen
20
Observed extreme weather and climate events by 2010:
Page
• more frequent extreme high maximum and minimum temperatures;
This Project is funded by the A project implemented by
European Union Human Dynamics Consortium• more frequent and longer heat waves;
• increasing number of very hot days and nights;
• smaller number of frosty days and very cold days and nights;
• more frequent droughts;
• increasing number of forest fires;
• interruption dry period followed by heavy rainfall;
• more frequent occurrence of storms (cyclones) during the colder half of the year;
• reducing the number of consecutive days with rain;
• reduce the number of days with heavy precipitation;
• an increase in the intensity of rainfall and
• reduction of total annual snowfall.
As part of the SNC, the chapter „Vulnerability and adaptation to climate change“ consists of 4 parts:
• 1st part analyzes the climate variability and change observed by 2010 in Montenegro;
• 2nd part analyzes the vulnerability of Montenegro to climate change and extreme events. It
used indicators based on the impact of climate change (i.e. Impact indicators) and
projections of extreme climatic events using a regional climate model EBU-POM;
• 3rd part analyzes the vulnerability by sector on the basis of impact indicators and future
exposure to climate and extreme events;
• 4th part proposes appropriate adaptation measures.
Vulnerability and adaptation to changed climate conditions was addressed in the Initial National
Communication (INC) on Climate Change to the UNFCCC. One of the goals of the Second National
Communication is obtain quantitative vulnerability assessment with focus on water resources,
agriculture and forestry, public health and coastal areas, as these were identified in INC as
further priority steps. It is important to note that the quantitative estimates of vulnerability take
into account the observed and projected changes in extreme weather and climate events, and
thus provide the necessary information to open a new chapter in understanding and managing risk.
Climate variability and climate change observed to 2010 were analysed in accordance with
the definitions of the IPCC. So atmospheric and climate variability in Montenegro is usually affected
by the following:
• North Atlantic Oscillation (NAO),
• Genoa cyclone and Siberian High,
• air depression in the Adriatic, the cyclone's path across the Adriatic and the Mediterranean
Sea, while the presence of high pressure over North Africa,
• the impact of El Niño in situations when it is very developed, and
• Impact of atmospheric blocking system.
21
Monitoring and evaluation of climate indicate that the climate of Montenegro changed as a result of
Page
global climate change and variability. The clearest indicators are: a significant increase in air
This Project is funded by the A project implemented by
European Union Human Dynamics Consortiumtemperature, the increase in sea surface temperature and mean sea level, changes in extreme
weather and climate events.
Given that climate change is related to the long-term successive changes (increase or decrease) in
mean state of the atmosphere, and that is one of the clearest signals of climate change change in air
temperature, were analysed:
• changes in annual temperatures in the period 1951-2012;
• mean decade values of annual air temperature;
• mean value for the period 1961-1990, and
• decade deviation (Δ) of climatological normals.
Four Montenegrin municipalities (Zabljak, Pljevlja, Podgorica and Bar) were selected as
representatives of a particular type of climate. Data quality was also considered during this selection.
Table 2. Mean annual air temperature for 4 municipalities’ representatives of climate types
Climatological
normal Decade
Regions '61-'90
2 '51-'60 '61-'70 '71-'80 '81-'90 '91-'00 '01-'10 ∆
Municipality of Zabljak 4,6 5,1 4,7 4,5 4,7 5,4 6,0 +1,4
Municipality of Pljevlja 8,1 8,6 8,1 7,9 8,2 8,8 9,1 +1,0
Municipality of 15,3 15,5 15,4 15,0 15,4 15,8 16,3 +1,0
Podgorica
Municipality Bar 15,5 15,7 15,7 15,3 15,6 15,9 16,8 +1,3
(Δ - deviation of the Decade (2001-2010) annual temperature of climatological normals)
As for the precipitation, as described in the INC:
• no significant reduction in total annual precipitation;
• in the normal range of rainfall increases in the fall, and decreases in the spring, summer and
winter;
• In statistical terms, there is a significant increase in rainfall in September in the Zeta-
Bjelopavlicki region.
Overall, these changes indicate a change in precipitation regime that take extreme character.
Table 3. Decadal annual precipitation (mm)
Climatological
normal Decade
Regions '61-'90 '51-'60 '61-'70 '71-'80 '81-'90 '91-'00 '01-'10 ∆
Municipality of 1.455,4 - 1.514,2 1.564,4 1.287,5 1.370,1 1.610,6 +155,2
Zabljak
Municipality of 796,5 735,7 783,8 865,4 740,4 733 839,86 +43,4
Pljevlja
Municipality of 1.657,9 1.632,1 1.756,7 1.695,2 1.521,7 1.593,7 1.781,6 +123,7
Podgorica
Municipality Bar 1.390,9 1.414,1 1.473,2 1.480,5 1.218,9 1.241,9 1.463,9 +73
(Δ - Deviation of the Decade (2001-2010) annual precipitation of climatological normals)
22
According to the available sequence data IHMS for the period 1980-2012 for the temperature of the
Page
sea surface from the station in Bar, and the sea level in the period 1965-2011 years:
This Project is funded by the A project implemented by
European Union Human Dynamics Consortium• Sea Surface Temperature increases by about + 0.02 ° C per year;
• Each decade is higher than the previous, and the highest was last with an average annual
temperature of 18.3 ° C;
• sea level is rising, with small changes from year to year during the first decade of the 21st
century.
Table 4. Decadal value of the annual sea surface temperature in Bar
°
Decade Sea Surface Temperature ( C)
1981 – 1990 17,9
1991 – 2000 18,1
2001 – 2010 18,3
A more detailed analysis of changes in sea surface temperature and its level due to climate change
and variability is conducted by the Project CAMP ("The Integrated Coastal Zone Management of
Montenegro"). Some very serious problems were identified during its implementation:
• quality of meteorological and hydrological data;
• the availability of the data string, and
• lack of observation stations in the coastal areas,
which provides little basis for assessing current and future changes in sea level.
Climate analysis was performed by climate decades, to obtain a summary of the observed extreme
events in Montenegro in the past 15 years and their projections parallel to the EBU-POM regional
model. What we can immediately notice is that the trends observed and projected climate change
matched well.
Table 5. Decadal Records largest maximum air temperature in the period 1951-2010.
Decade
Regions '51-'60 '61-'70 '71-'80 '81-'90 '91-'00 '01-'10
Municipality of Zabljak 30,4 28,2 30,6 31,3 32,4
Municipality of Pljevlja 38,0 35,0 33,2 36,2 38,2 38,1
Municipality of Podgorica 41,2 40,6 39,2 41,4 41,6 44,8
Municipality Bar 35,4 35,9 36,8 37,7 37,0 36,6
Table 6. Decadal records the smallest minimum air temperature in the period 1951-2010.
Decade
Regions '51-'60 '61-'70 '71-'80 '81-'90 '91-'00 '01-'10
Municipality of Zabljak -26,4 -22,7 -26,4 -25,7 -24,6
23
Municipality of Pljevlja -29,4 -29,0 -27,0 -29,2 -26,7 -23,5
Municipality of Podgorica -9,7 -9,2 -8,5 -9,6 -8,4 -6,7
Page
Municipality Bar -7,0 -7,2 -4,9 -4,4 -5,3 -4,3
This Project is funded by the A project implemented by
European Union Human Dynamics ConsortiumYou can also read