Hawke's Bay Regional Land Transport Plan 2021 - Draft for Consultation Prepared by Hawke's Bay Regional Council for the Regional Transport ...
←
→
Page content transcription
If your browser does not render page correctly, please read the page content below

Hawke’s Bay Regional Land Transport Plan
2021 – Draft for Consultation
Prepared by Hawke’s Bay Regional Council for the Regional Transport Committee
Hawke’s Bay Regional Land Transport Plan
2021 – Draft for Consultation

Prepared By:
Mary-Anne Baker
Acting Transport Manager

Approved By:
Katrina Brunton
Group Manager Policy and Regulation
Contents
Executive summary ....................................................................................................................... 5

1       Introduction ........................................................................................................................ 6

2       Strategic Context ................................................................................................................. 7
        2.1      Our region ........................................................................................................................... 7
        2.2      Landscape and Climate ....................................................................................................... 7
        2.3      Our people .......................................................................................................................... 7
        2.4      Our Economy and Employment .......................................................................................... 9

3       Our Transport System ........................................................................................................ 11
        3.1      Road Safety ....................................................................................................................... 11
        3.2      Greenhouse Gas Emissions and Climate Change .............................................................. 11
        3.3      Health Outcomes .............................................................................................................. 12
        3.4      Network Resilience ........................................................................................................... 12
        3.5      Roading Network/Vehicle Travel ...................................................................................... 12
        3.6      Public Transport ................................................................................................................ 14
        3.7      Walking and Cycling .......................................................................................................... 15
        3.8      The iWay Cycle Network ................................................................................................... 15
        3.9      Freight Demand and Napier Port ...................................................................................... 15
        3.10 Rail              16
        3.11 Air Transport ..................................................................................................................... 16
        3.12 Technology and Transport ................................................................................................ 16

4       Policy context .................................................................................................................... 17
        4.1      Core statutes ..................................................................................................................... 17
        4.2      Other National Policy Context .......................................................................................... 17
        4.3      Other National Plans ......................................................................................................... 20
        4.4      Regional Plans ................................................................................................................... 21
        4.5      Other regional plans and strategies .................................................................................. 22
        4.6      Local Council Plans ............................................................................................................ 23
        4.7      The Future Regional Transport Network .......................................................................... 25
        4.8      Development of a Regional Programme Business Case ................................................... 25

5       Strategic framework .......................................................................................................... 27
        5.1      The regional vision ............................................................................................................ 27

29 January 2021 2.51 pm
6      Policies .............................................................................................................................. 29

7      Ten year transport priorities .............................................................................................. 32
       7.1      Transport priority 1: Road Safety...................................................................................... 33
       7.2      Transport priority 2: Freight Supply Chain ........................................................................ 34
       7.3      Transport priority 3: Transport Choice ............................................................................. 35
       7.4      Transport priority 4: Sustainable Travel Choices .............................................................. 37

8      Fit with strategic context ................................................................................................... 39

9      Regional programme of activities ....................................................................................... 40
       9.1      Full List of Committed Activities for 2021 – 31 ................................................................. 40
       9.2      Prioritised Programme of Significant Activities ................................................................ 41
       9.3      Ten Year Forecast by Activity Class ................................................................................... 42
       9.4      Activities of Inter-Regional Significance............................................................................ 48
       9.5      Regionally significant expenditure from other funding sources....................................... 48
       9.6      Activities to be varied suspended or abandoned ............................................................. 48

10     Assessment of the relationship of police activities to the Regional Land Transport Plan....... 49

11     Monitoring indicator framework ........................................................................................ 50

Appendix A          Significance Policy ............................................................................................... 52

Tables
Table 1:            Population Growth                                                                                                         8
Table 2:            Annual Traffic Counts.                                                                                                   14

Figures
Figure 1: Stakeholders                                                                                                                        6
Figure 2: Unemployment Rate 2000 - 2019                                                                                                      10
Figure 3: Crashes by year for the Hawke's Bay region                                                                                         11
Figure 4: Transport Outcomes Framework                                                                                                       18

                                                                                                                                               4
29 January 2021 2.51 pm
Executive summary
The Hawke's Bay Regional Land Transport Plan 2021–2031 (RLTP) sets out a picture of the Hawke's Bay
community and the current state of the transport network, the context for developing the Plan, the key issues
it addresses and the priorities for future investment. It takes an integrated and strategic approach to address
the current and anticipated transport issues facing the region by setting out:

    •        The context in which the transport system operates.
    •        The vision and strategic objectives for the transport system.
    •        The priorities for investment – key areas where further investment is required in order to achieve
             the vision and objectives.
    •        A prioritised regional programme of transport activities.

The RLTP has been developed by the Hawke's Bay Regional Transport Committee (RTC), which is a joint
committee of the region’s councils as well as Waka Kotahi NZ Transport Agency (Waka Kotahi).

The vision in this RLTP is that:

         Hawke's Bay’s transport network fosters a vibrant, accessible and sustainable Hawke’s Bay

The objectives adopted to reach this vision aim to:

    •    Achieve a safe transport system for users.
    •    Achieve a transport network that is resilient, reliable and efficient.
    •    Provide transport choices to meet social, environmental, e and cultural needs.
    •    Minimise travel demand through planning and development.

The work programme included in this RLTP is an agreed regional programme that contributes to shared
regional prosperity and well-being.

In developing the draft RLTP, the RTC has taken into account the strategic direction provided by the
Government through the Ministry of Transport’s Outcomes Framework and the Government Policy
Statement on Land Transport 2021 as well as guidance provided by regional and local plans, strategies and
policies.

The content of this draft RLTP has been impacted by the COVID-19 pandemic. However, while the pandemic
creates uncertainties, it has not changed the RTC’s focus on developing a transport network that enables the
region to become vibrant, accessible and sustainable.

                                                                                                       5
29 January 2021 2.51 pm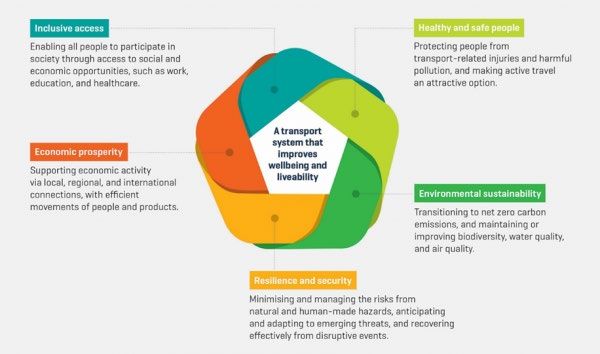
1       Introduction
This Regional Land Transport Plan (RLTP) is the primary document guiding integrated land transport planning
and investment in the Hawke’s Bay region.

This Plan has been developed by the Regional Transport Committee (RTC) comprising the Hastings, Wairoa
and Central Hawke’s Bay district councils, Napier City Council the Hawke's Bay Regional Council and Waka
Kotahi (the NZ Transport Agency). Its adoption and implementation is the collective responsibility of these
organisations.

The RLTP:
         •       Sets the strategic transport direction to guide transport activities in Long Term Plans (LTPs).
         •       Identifies the agreed view of regional transport priorities to inform the National Land
                 Transport Programme (NLTP).
         •       Sets the long-term vision and strategic direction for the region’s land transport system.
         •       Identifies the agreed regional transport priorities for investment in the short to medium
                 term.
         •       Presents the activities of Approved Organisations in an integrated three-to-six-year
                 programme, which is consistent with the Government Policy Statement on land transport
                 (GPS), as a bid for funding from the National Land Transport Fund (NLTF).
         •       Addresses issues that cross regional boundaries.
         •       Provides the basis for communication of the region’s transport direction and priorities with
                 stakeholders and the general public.

The relationship of the RLTP with other key stakeholders and the wider transport and land use planning and
funding context is set out in the diagram below.

Figure 1: Stakeholders

                                                                                                        6
29 January 2021 2.51 pm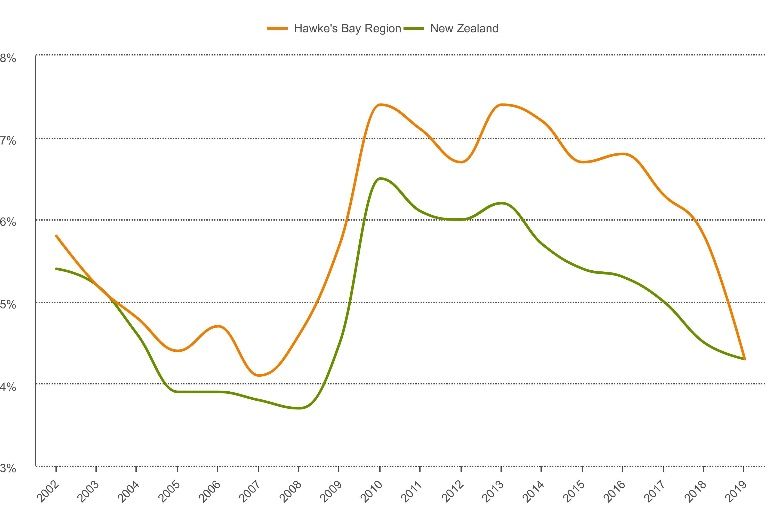
Draft for Consultation January 2021 7
2 Strategic Context
This section provides an overview of the region, together with key trends and issues impacting the
region’s transport system. These matters have informed the objectives and investment priorities for the
region’s transport system, which are outlined in subsequent chapters.
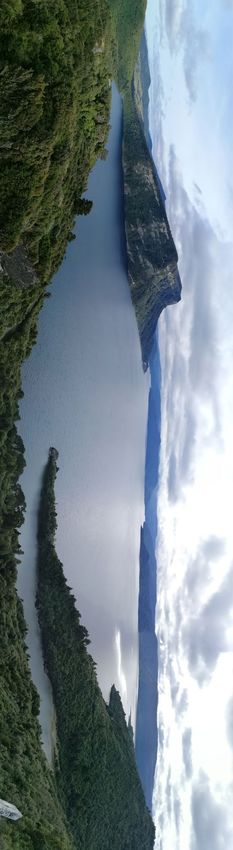
2.1 Our region
Hawke’s Bay covers 1.42 million hectares, lies on the east coast of the North Island and includes Wairoa,
Hastings and Central Hawke’s Bay district councils and Napier City Council. The region adjoins Bay of
Plenty, Waikato and Manawatū-Whanganui regions and Gisborne District. The Heretaunga Plains, at the
centre of the region are characterised by highly productive horticultural land and the two major urban
centres of Napier and Hastings are located only 20 kilometres apart, with a number of other small
satellite settlements close by. The productive Ruataniwha Plains can be found to the south, Otane,
Waipawa and Waipukurau are within an hour’s commuting distance of Hastings and Napier and have
seen significant growth in recent years. Wairoa is a more isolated settlement to the north. All three
district councils having a large percentage of arable and pastoral farming.
2.2 Landscape and Climate
In the north of the region, much of the land is unstable, highly erodible and deeply incised by rivers and
streams. In the centre and in the south, more extensive plains have been formed. In the west all these
lands are bound by high axial ranges and by lower limestone hills in the east south of Napier. This
landscape restricts movement north and south and to other regions to two main corridors.
Hawke’s Bay’s weather is sunny and warm overall, with hot dry summers. However, storm systems from
the north and east affect the region seasonally and can cause significant rainfall events to occur. Wairoa
District, with the highest rainfall in the region, is particularly susceptible to erosion as a result.
The region is increasingly likely to suffer drought as a result of climate change and biosecurity hazards
could become more prevalent as a result. Extreme, rare rainfall events are projected to become more
severe in the future, exacerbating the region’s vulnerability to road failure and disruptions. Short
duration rainfall events have the largest relative increases compared with longer duration rainfall events.
Hawke’s Bay is also vulnerable to natural hazards such as earthquakes and coastal erosion. These hazards
combine to increase the cost of infrastructure maintenance and repair and disruption to the economy.
2.3 Our people
2.3.1 Population and residential growth
Hawke’s Bay is home to approximately 174,000 people, with 80% of those living in Napier or Hastings.
The population is expected to increase by 18% to 195,900 by 2043 according to the December 2019 Stats
NZ high growth prediction scenario. The impacts of long-term population projections are likely to be
impacted by the COVID-19 pandemic, and assumptions used for forecasting will need to be reviewed and
monitored.Draft for Consultation January 2021 8
The 2018 Census usually resident population data for each of our districts was:
2006 2013 2018 % increase since 2013
Central Hawke’s Bay District 12,957 12,717 14,142 11.2
Hastings District 70,842 73,245 81,537 11.3
Napier City 55,359 57,240 62,241 8.7
Wairoa District 8,484 7,890 8,367 6.0
Hawke’s Bay Region 147,783 151,179 166,638 10.2
Table 1: Population Growth
By far the largest proportion of population growth has been due to net migration to the region, rather
than natural population increase. The population is ageing quickly, with 18.5% of our population aged
65 or over, compared with just 15.6% nationally. In 2018, those over 65 years old made up just 18% of
the residential population; by 2043 28% of Hawke’s Bay’s population is expected to be 65 or over, a 55%
increase.. The ageing population will change housing needs (smaller, more centrally located housing),
increase the number of retirement villages constructed 1 and may change travel patterns, with less peak
commuter travel. However, counter-balancing this is a trend ofo working past 65, and increased travel
for recreational activities by retirees.
There is considerable variation across the region in a range of social indicators. Hawke’s Bay’s median
income is $77,700, compared with $89,100 nationally and $62,200 in Wairoa District.
Most of Wairoa, Flaxmere and Maraenui rate at Decile 10 on the Social Deprivation Index, while Havelock
North, Bluff Hill, Taradale and Greenmeadows are Decile 1.
The Heretaunga Plains Urban Development Strategy (HPUDS) 2017 aims to protect valuable horticultural
land, allow distinct identities for the two cities and ensure that community facilities and infrastructure
are integrated and affordable. The strategy plans to accommodate population growth by achieving urban
development that is 60% intensification, 35% greenfield, 5% rural by 2045, with balanced supply between
Napier and Hastings. 2 A further review of the Strategy will commence in 2021 in order to incorporate
2018 Census data and the consequent subnational projections of population and households.
Napier City Council is reviewing its District Plan and proposes future greenfields growth areas for the
western hills behind Taradale. This is in addition to the Mission Residential Precinct which will provide
around 550 homes. The move to the hills is in response to concerns about the flat growth areas within
Napier’s boundaries, which are subject to natural hazards such as flooding and tsunami risk. However,
these proposals are at an early stage of consultation and yet to be incorporated in HPUDS, which
currently includes areas identified in 1993 for growth in behind Te Awa and Riverbend Road. Napier City
Council also plans for intensification in the CBD.
In the Hastings District, the focus is on residential development as close to existing urban areas as
possible, but which avoids the loss of high quality soils. Hastings is also planning further urban
intensification within the CBD and selected residential neighbourhoods.
Due to the close proximity of two urban centres with major industry, education, health and transport
facilities distributed between them, commuting between the two cities is significant. Census data shows
major flows at peak times, in particular from the Taradale and Greenmeadows area of Napier to the
central and western areas of Hastings. Educational travel between the cities is also a major contributor
to peak time commuting, with the Eastern Institute of Technology drawing students to southern Taradale
and special character schools dispersed across the Heretaunga Plains.
As house prices have increased rapidly in Napier and Hastings, more people are now living in Central
Hawke’s Bay but commuting to employment or education in Napier or Hastings, which also increases
1 There are four new retirement villages under construction in Hawke’s Bay during 2020.
2
https://www.hpuds.co.nz/assets/Docoment-Library/Strategies/2017-Heretaunga-Plains-Urban-Development-Strategy-incl-Maps-AUG17.pdfDraft for Consultation January 2021 9
travel demand. This is reflected in the significant increase in population in the district between 2013 and
2018.
Central Hawke’s Bay is preparing a second-generation District Plan review for notification in May 2021.
Preparing for projected growth and development has been a major focus of the review. However, based
on the high-level residential development capacity analysis undertaken for the review it was found that
the main urban towns of Otane, Waipawa and Waipukurau theoretically have capacity within the existing
Residential /Rural Township Zone boundaries to accommodate projected household growth over the
next 30 years.
2.4 Our Economy and Employment
Hawke’s Bay’s rural land is used for pastoral farming and forestry, horticulture and viticulture. There is
almost 20,000 hectares of land on the Heretaunga Plains dedicated to horticulture, including almost
5,000 to apple production and 3,600 to viticulture. The value of this land to the Hawke’s Bay economy is
very significant and the Heretaunga Plains Urban Development Strategy 2017 aims to protect it from
necessary encroachment by residential or other development.
Agriculture, forestry and fishing was the largest contributor to an overall increase in Hawke’s Bay’s GDP
between 2009 and 2019, with an increase of $190 million.
The pipfruit sector has seen significant growth in plantings in Hawke’s Bay; it is estimated that over 1
million new trees have been planted in the region in the last two years. Hawke’s Bay has 55% of the
apple growing area in New Zealand. While production is increasing significantly, this is largely due to
intensification, rather than to major increases in land area under production. 3 The increase in production
has flow-on effects for the transport network. A record apple crop drove an 8.6% increase in
containerised apple exports through Napier Port in 2019.
Agriculture, forestry and fishing make the largest contribution to employment (13.8%), followed by
manufacturing (12.4%) then health and social services (11.2%).
There are 134,841 hectares of plantation forests in the region – up from 128,100 hectares in 2012. Timber
products are a major export and Napier Port saw a 17% increase in log volumes handled in 2018-19,
representing a doubling of log volumes over the last three years. 4 Increases in forestry plantings as a
result of the Climate Change Response (Zero Carbon) Amendment Act could have a particular effect in
the Wairoa District, which has already seen 8,486 hectares of sheep and beef land converted to forestry.
This may impact on employment 5 and forecasts also indicate that one-way logging truck movements on
SH2 from Wairoa will increase from 171 per day in 2017 to 278 by 2023.
The main processing centres for rural produce are concentrated in and around Tomoana/Whakatu,
Omahu Road and Irongate areas in Hastings, and the Awatoto and Onekawa areas in Napier.
Tourism has been a growing industry within our region due to the attraction of the climate, unique Art
Deco architecture, New Zealand Cycle Trails and wine and food reputation. The regional tourism spend
for the year to the end of October 2020 was $640m, a decrease of 5%. However, the October 2020 spend
was an 18% increase on the previous October. The yearly spend includes $508m from domestic tourism
and $132m international 6. The COVID-19 pandemic is estimated to be less detrimental to Hawke’s Bay’s
tourist numbers than some other regions, due to the significant proportion of tourism spend from within
New Zealand. With overseas travel not possible in the short term, Hawke’s Bay could benefit from more
domestic travel, although this is likely to be tempered by the economic after-effects of the pandemic.
The development of Rocket Lab’s launch site adds to tourism on the Mahia Peninsula, while Lake
Waikaremoana’s Great Walk also attracts both domestic and international visitors to the Wairoa District.
3 https://www.westpac.co.nz/assets/Business/Economic-Updates/2019/Monthly-Files-2019/NZ-Over-the-Fence-7-June-2019.pdf
4 https://www.napierport.co.nz/wp-content/uploads/2019/11/Annual-Report-2019.pdf
5 https://beeflambnz.com/research-afforestation-impacts-wairoa
6
https://www.mbie.govt.nz/immigration-and-tourism/tourism-research-and-data/tourism-data-releases/monthly-regional-tourism-estimates/Draft for Consultation January 2021 10
Central Hawke’s Bay District is developing opportunities for tourism based around the area’s rich cultural
heritage. The district is also promoting its NZ Cycle Trails Heartland Ride and other cycling events.
While Hawke’s Bay has traditionally had a higher unemployment rate than NZ overall, this had declined
to the national average of 4.3% by 2019, the lowest since 2007. However, Hawke’s Bay’s NEET 7 rate of
16.1% is higher than the national average of 12%.
Figure 2: Unemployment Rate 2000 - 2019
In 2019, there were 83,076 filled jobs in Hawke’s Bay, an increase of almost 8,000 jobs in the last five
years.
The growth in mean income in Hawke’s Bay was 4.2%, compared with 3.8% national growth. 8 However,
the benefit of this growth was unevenly spread across the region, with Wairoa District continuing to have
a higher unemployment rate and lower mean income than Napier and Hastings.
The 2020 COVID-19 pandemic is forecast to contract the Hawke’s Bay economy by 6.2% and raise
unemployment to 8.4%, although Hawke’s Bay is likely to be less affected than other parts of New
Zealand. However, Māori as well as low-income households will be particularly vulnerable to job losses.
Retail, food services and accommodation will be worst hit, with likely little disruption to primary
production and food manufacturing.
Such a varied economic and social profile means the transport disadvantaged may become more isolated
and vulnerable with access to socials services increasingly difficult.
7 The NEET rate measures the proportion of people aged 15–24 years who are not employed or engaged in education or training.
8
https://ecoprofile.infometrics.co.nz/Hawke%2527s%2bBay%2bRegion/StandardOfLivingDraft for Consultation January 2021 11
3 Our Transport System
3.1 Road Safety
Hawke’s Bay has a relatively poor road safety record. With the increase in vehicles on our roads and the
increased kilometres travelled around the region, road deaths and serious injuries have also increased
over the last five years, which is consistent with a concerning national trend. (Figure 1 below shows the
number of DSI crashes per year since 2010.)
For example, Hastings District experienced an increase in deaths and serious injuries of around 4% each
year between 2015 and 2019, after a previously declining trend. Wairoa District residents are at the
highest personal risk in the country for many crash types.
However, there have been significant safety improvements to the region’s strategic routes over the last
five years, with more planned. These include major intersection upgrades, retrofitting of guardrails,
centre wire rope barriers, shoulder-widening and a range of other measures, mainly on state highways
across the region.
The Road to Zero road safety strategy’s first action plan 9 sets out a range of key actions for 2020-22
across the five focus areas - infrastructure improvement and speed management, vehicle safety,
work-related road safety, road user choices and system management.
1600 120
1400
100
Total number of crashes
Number of DSI crashes
1200
80
1000
800 60
600
40
400
20
200
0 0
2010 2011 2012 2013 2014 2015 2016 2017 2018 2019
DSI Crashes Total Crashes
Figure 3: Crashes by year for the Hawke's Bay region
3.2 Greenhouse Gas Emissions and Climate Change
The transport system is responsible for about one-fifth of New Zealand’s climate changing greenhouse
emissions. Between 2016 and 2017 gross overall emissions increased by 2%, mainly from an increase in
emissions in road transport and fossil-fueled electricity generation. In Hawke’s Bay, a growing vehicle
fleet and an increase in the number of vehicle kilometres travelled is contributing to this growth in
emissions.
The light vehicle fleet registered in Hawke’s Bay was 132,929 in 2018, which is 42.5% higher than in
2001. However, this increase cannot all be attributed to population growth, as vehicle ownership per
capita across Hawke’s Bay grew by 8% between 2015 and 2018 and is now 29% higher than it was in
2001.
9
https://www.transport.govt.nz//assets/Uploads/Report/Road-to-Zero-strategy_final.pdfDraft for Consultation January 2021 12
Hawke’s Bay residents are therefore now more likely to own a vehicle and use it to get around, and this
is reflected in growth in vehicle kilometres travelled in the region. This now sits at 1.65 billion
kilometress (2018), an increase of 16.2% since 2014.
Private vehicles make up about 90% of the mode split for travel to work, and about 60% for travel to
education, indicating a community that is very car dependent.
While the energy efficiency of the overall vehicle fleet is improving, uptake of electric vehicles in Hawke’s
Bay is growing from a low base, with an increase in electric vehicles registered from 201 to 309 during
2019.
The major effects of climate change in Hawke’s Bay that may impact on the transport network are sea
level rise and the increasing severity of weather events, including storm surges along the coast and
extreme flood events exacerbating resilience deficiencies in the current network.
Climate change may also have a significant effect on primary production, necessitating changes in land
use or location of production, along with consequent change in freight demand.
3.3 Health Outcomes
Hawke’s Bay has the lowest physical activity rate in New Zealand. The region also has one of the highest
overweight/obesity rates in the country, with over 70% of adults and over 35% of children aged 2-14
years considered overweight/obese. One of the key factors that contributes to a sedentary lifestyle that
leads to poor health outcomes is car dependency. Walking and cycling for transport is one of the most
practical and effective ways of incorporating physical activity into daily life.
3.4 Network Resilience
Maintaining a resilient network in the face of more frequent extreme weather events will be an ongoing
challenge for the region. Lack of resilience in the network can isolate rural communities and areas of
primary production, negatively affecting the region’s social and economic outcomes.
Roading assets are ageing in the Hastings District, and the council has commenced a seven-year
programme of prioritised bridge strengthening to accommodate high productivity motor vehicles. This
targeted investment is also intended to protect lifeline routes and add resilience by providing alternative
routes when needed.
The resilience of the strategic network between Napier and Hastings (including SH2, SH50 and SH51)
can be an issue if peak time disruptions occur, with sometimes lengthy diversions onto alternative routes
and significant congestion.
3.5 Roading Network/Vehicle Travel
The State Highway network connects both communities and freight to the rest of the North Island and
within the region to work, education, goods and services.
The region is serviced by State Highways 2, 5, 50 and 51, as shown on the map below.
SH2 north connects the region to Wairoa, Te Urewera, Gisborne and Opotiki. SH5 connects us to the
central North Island. SH2 south links the more urban areas of Napier and Hastings to Central Hawkes Bay
and onto Wellington as well as the Central North Island Freight Hub in Palmerston North. Internally, we
have an expressway from Bayview to Pakipaki, which is the region’s transport spine and connects our
communities.Draft for Consultation January 2021 13
Figure 4: State Highway Network.
In total there is around 4,700 kilometres of road in the Hawke’s Bay region, with 55% of kilometres
travelled on local roads and 45% on state highways.
There have been a number of significant road improvements undertaken in Hawke’s Bay over the last
five years. These include:
• SH2-Watchman Rd-HB Airport intersection – safety improvement.
• Pakowhai-Links Rd intersection – safety and efficiency.
• Whakatu Arterial Link ( Te Ara Kahikitea) – safety and efficiency.
• SH2 –Napier Road intersection Mangateretere- safety.
• SH2 intersection Pakipaki – safety.
• SH2 Bay View to Hawke’s Bay Airport Passing Lanes.
• HB Expressway Safety Treatments.
• SH2 Pakipaki to Waipukurau Safety Improvements.
• SH2 Wairoa to Bay View Safety Improvements.Draft for Consultation January 2021 14
Currently, much of our network has the capacity to accommodate medium growth but recent population
growth predictions and increasing logging and apple volumes may affect levels of service on the strategic
network and some sections of local networks.
Increases in heavy vehicle transport near Napier Port could increase conflict with other land uses in the
area, although there is sufficient network capacity for growth.
The latest traffic counts on some key commuter and freight routes are summarized below. Major
roadworks on the HB Expressway over the last three years have caused significant variations in travel
patterns. 2020 would have been the first year to show normalized volumes, however reduced traffic
volumes during the COVID-19 lockdown may affect some results.
Section 2019 Annual Average Average yearly increase over
Daily Traffic last five years (2015-2019)
State Highway 2 (HB Expressway), Pandora 11,957 5%
State Highway 2 (HB Expressway) Meeanee Overbridge, 26,463 3%
State Highway 2 (HB Expressway) south of Pakowhai Links 18,679 4%
Intersection
State Highway 2 (HB Expressway) Omahu Road 12,654 0%
State Highway 50, Port of Napier between port entrance & 6,576 5%
Battery Rd
State Highway 51 Waitangi Washout Bridge 15,850 6%
State Highway 51 north of Mangateretere 10,190 0%
Pakowhai Rd between Brookfields Rd and Pakowhai-Links 10,659 9%
Roundabout
Brookfields Rd , near intersection with Pakowhai Rd 4,813 28%
Pakowhai Rd between Te Ara Kahikitea and Evenden Rd 12,920 3%
Table 2: Annual Traffic Counts.
3.6 Public Transport
Long distance bus services operate through the region to the Manawatu and Wairarapa, Taupō and
Gisborne.
Local bus passenger services operate in and between Napier, Hastings and their dormitory towns;
Flaxmere, Taradale, Havelock North and Bay View, with approximately 650,000 passengers carried
annually, for a distance of approximately 6.9 million kilometres. The mode share of journeys to work is
small, with only 0.5% of the working population travelling by bus according to the 2018 Census.
However, 14.5% of children travel to school by either school or public bus. 10
The use of public buses has declined from 799,000 boardings in 2013-14 to 645,000 in 2018-19.
The increase in car ownership and vehicle kilometres travelled, together with higher employment and
low fuel cost appear to be linked directly to lower bus use, and this is borne out by the sharpest decline
in patronage on some of the bus services in lower income areas.
An ageing population and consequent development of more retirement villages will require public
transport services that are directly targeted to the needs of this sector.
10
https://www.stats.govt.nz/tools/2018-census-place-summaries/hawkes-bay-region#travel-to-educationDraft for Consultation January 2021 15
A taxi based Total Mobility scheme is provided for those people unable to use public transport services
and carries approximately 100,000 passengers annually. As the population ages, the number of Total
Mobility users is likely to increase.
There is no Public Transport offered in Wairoa or Central Hawke’s Bay. As more people commute from
Central Hawke’s Bay to Hastings and Napier for work, using private vehicles, the increase in traffic
produces a negative impact on safety on the State Highways and contributes negatively to climate
change.
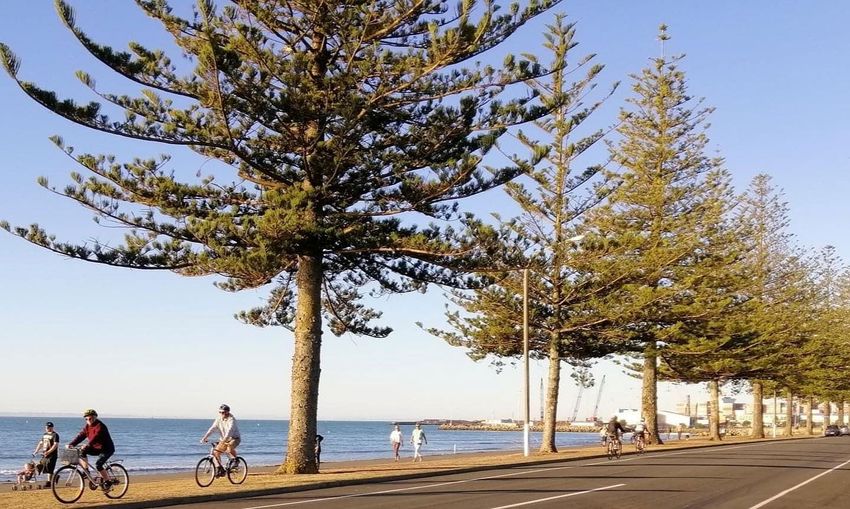
3.7 Walking and Cycling
Since 2002, Hawke’s Bay has created over 200 kilometres of off-road cycle trails and well over 100
kilometres of on-road cycle facilities.
The Hawke’s Bay Trails on the Heretaunga Plains are part of the NZ Cycle Trails Great Rides network and
are largely Grade 1 and 2, flat limestone or concrete pathways. Use of the trails has grown significantly
over the years and while many sections are used for commuting, the greatest use comes from local
recreational riders and tourists.
A riverside trail beside the Tuki Tuki in Central Hawke’s Bay has gained Heartland Ride status through
NZ Cycle Trails, and further improvements to the cycle network are planned.
Central Hawke’s Bay has developed a trail’s cycling masterplan building on the success of the Tuki Tuki
Trails. This creates an overarching strategic plan for key cycling routes in Central Hawke’s Bay. The key
projects in the plan have been included in Councils Long Term Plan 2021 -2031. The completion of a
partly built multi-purpose off-road cycle link between Waipukurau and Waipawa alongside the State
Highway is a priority.
In Wairoa, a 7.7 kilometre riverside path has been constructed from the town’s lighthouse to
Whakamahia Beach. Wairoa District Council is currently developing a cycle plan.
3.8 The iWay Cycle Network
The iWay network is focused on urban travel for commuting and getting around our cities. The iWay
network is complemented and overlapped by the Hawke’s Bay Trail network that is focused on providing
a world class tourism offering, providing scenic off-road experiences to explore the region. Combined
these networks provide an extensive regional network for active transport. With the increase in e-bikes
it is expected commuting, on both networks, will be an attractive option for many. Despite the significant
investment, mode share of journeys to work for active transport modes remains low across the region,
with no appreciable improvement noted in Census data to 2018. Active transport mode share in the
Hastings District sits at 5.5%, with 10% of people using active modes to travel to work across the region
as a whole.
The iWay programme in Hastings commenced in 2010 with funding from NZTA to establish a model
community. The programme focused on developing key arterial routes to urban areas, complementary
on-road cycle lanes on key collector routes, shared pathway projects and a complementary education
and promotion programme. In 2015, iWay expanded to Napier with 36.5kilometress of off-road
pathways and cycle lanes now almost completed.
3.9 Freight Demand and Napier Port
The Port of Napier is the fourth largest port in New Zealand by overseas export volumes. It accounts for
10% of New Zealand’s export tonnages and is therefore a nationally significant asset. In dollar terms,
Napier Port supports more than $3.4 billion of Hawke’s Bay’s Gross Regional Product.
There have been significant increases in the freight flow through the Port, with overall tonnages growing
from 3.4 million tonnes in 2010 to 5.5 million tonnes in 2019. Napier Port predicts that growth in keyDraft for Consultation January 2021 16
freight types through the Port will increase truck movements by 187% (being 171,000 truck movements)
along the critical Ahuriri access corridor, between 2018 and 2027.
It is estimated that 70% of freight travelling though Hawke’s Bay is generated within region (7.5M
tonnes). The main inter-regional freight connection is to the Manawatu –Whanganui region, with 1.6
million tonnes carried on this route.
3.10 Rail
The Palmerston North to Gisborne rail line runs the length of the region, although the section from
Napier to Gisborne was closed in 2012 due to a washout of the line. The line between Napier and Wairoa
has since been reinstated and a commercial agreement has been reached between Napier Port and
KiwiRail for the transport of logs from Wairoa by rail to the port. KiwiRail currently operates a dedicated
log service to Whanganui every weekday and this train is utilised to provide four services each weekend.
It is estimated that this service will decrease the daily one-way logging truck movements by 50 per day
when forest harvesting is in full swing.
Road transport carries 95% of the region’s freight, while rail accounts for almost all the remaining 5%.
The rail line south from Napier is commercially viable and handles all the region’s rail freight. The line
runs directly through both Hastings and Napier, resulting in numerous urban crossings.
However, the rail system has potential to contribute to reducing greenhouse gas emissions and
improving resilience and safety on the interregional routes. The volume of cargo reaching Napier Port
on rail is also growing. There is now an average of 40 trains per week arriving at Napier Port, delivering
logs, pulp and a variety of containerised cargoes. 11
Passenger services between Napier and Palmerston North ceased in 2001 due to low demand and
increasing costs. Passenger services between Napier and Gisborne were cancelled after damage to the
line caused by Cyclone Bola in 1988.
3.11 Air Transport
Hawke’s Bay Airport hosts regular scheduled domestic flights. Until recently, both Air New Zealand and
Jetstar operated passenger services in and out of the airport. However, Jetstar ceased services in late
2019.
In 2018-19, 750,000 passengers passed through the airport, compared with 450,000 in 2014. The airport
is aiming for 1 million passenger movements by 2025; however, the COVID-19 pandemic will slow
growth to some extent.
3.12 Technology and Transport
Travel options and ways of transporting goods are changing rapidly with technological advances. Shared
mobility will increasingly move away from traditional methods of provision such as buses, and car
ownership in high density areas may reduce as car-sharing and on-demand shared shuttle or car services
take their place. As their use increases in Hawke’s Bay, infrastructure provision will increasingly need
to cater for these alongside more traditional forms of transport.
The potential of micro-mobility has broadened with e-scooters and e-bikes, enabling their use over
longer distances due to motor assistance. Many of these advances are in their infancy in Hawke’s Bay
but will be increasingly adopted as they become more commonplace in major urban centres. This will
provide both opportunities and challenges to diversify the modal choice available to users in preference
to motor vehicles.
11
https://www.napierport.co.nz/wp-content/uploads/2019/03/Napier-Port-Annual-Report-2018-Web.pdfDraft for Consultation January 2021 17
4 Policy context
A number of statutes and policy and planning documents provide the legislative and policy context for
land transport planning and investment at the national, regional and local level. These have informed
the development of this Regional Land Transport Plan (RLTP).
4.1 Core statutes
The Land Transport Management Act (LTMA) 2003 is the principal statute guiding land transport
planning and funding in New Zealand. The purpose of the Act is to contribute to the aim of achieving an
affordable, integrated, safe, responsive and sustainable land transport system. The LTMA sets out the
core requirements of regional land transport plans and regional public transport plans for every region.
The Resource Management Act (RMA) 1991 which aims to promote the sustainable management of
natural and physical resources and provides the statutory framework for land use planning and the
development of regional policy statements, regional plans and district plans. Land use planning can have
a significant influence on travel choice and transport network demand. Likewise, transport network
investment can shape land use patterns within a region. The Hawke's Bay Regional Transport Committee
must take the Hawke's Bay Regional Policy Statement into account when development the Hawke's Bay
RLTP.
The Local Government Act (LGA) 2002 which guides local government planning and the way councils
carry out their functions. It includes provisions guiding the development of council long-term plans and
infrastructure strategies, where the local funding share for transport network investment is identified
alongside other local investment priorities. The LGA also sets out consultation principles that are
relevant for development of regional land transport plans.
The Climate Change Response Act 2002, which was amended by the Climate Change Response (Zero
Carbon) Amendment Bill in 2019. The Act now provides a framework for New Zealand to develop and
implement climate change policies that contribute to global efforts under the Paris Agreement to limit
the global average temperature increase to 1.5 degrees Celsius above pre-industrial levels. Key
provisions include setting a target to reduce net carbon emissions to zero by 2050. The transport sector
will have a key role in contributing to achieving this target and the direction set at a national level has
informed the development of this RLTP.
4.2 Other National Policy Context
Transport Outcomes Framework
In 2018 the Ministry worked with other government agencies to develop an outcomes framework for
the transport system.Draft for Consultation January 2021 18
Figure 5: Transport Outcomes Framework
This framework takes a strategic, long-term, and integrated approach to transport and makes clear what
government is aiming to achieve through the transport system in the long term. It is an enduring document
meant to last beyond government of the day change. The five outcomes are:
• Inclusive access: enabling all people to participate in society through access to social and economic
opportunities, such as work, education, and healthcare.
• Healthy and safe people: protecting people from transport-related injuries and harmful pollution and
making active travel an attractive option.
• Environmental sustainability: transitioning to net zero carbon emissions, and maintaining or improving
biodiversity, water quality, and air quality.
• Resilience and security: minimising and managing the risks from natural and human-made hazards,
anticipating and adapting to emerging threats, and recovering effectively from disruptive events.
• Economic prosperity: encouraging economic activity via local, regional, and international connections,
with efficient movements of people and products.
All of these outcomes are inter-related. To make a positive contribution across the five outcomes, the
transport system also needs to be integrated with land use planning, urban development, and regional
development strategies. The Hawke's Bay RLTP has included these outcomes as the foundation of its
strategic framework, to align with this enduring long-term direction.
Government Policy Statement on Land Transport 2021
The LTMA requires the Minister of Transport to issue the Government Policy Statement on Land Transport
(GPS) every three years. The GPS sets out the government’s priorities for expenditure from the National Land
Transport Fund over a 10-year period, and how funding should be allocated. Regional land transport plans
must be consistent with the GPS, and NZTA must give effect to it with regards to land transport planning and
funding.
The 2021 GPS strategic priorities are safety, better travel options, improving freight connections, climate
change. Safety and better travel options have been identified as the key strategic priorities. The Hawke’s Bay
RLTP has taken account of the 2021 GPS direction and priorities, particularly in relation to the identificationDraft for Consultation January 2021 19
of its short – medium term transport investment priorities and regional programme. The RLTP contains the
following direction that is consistent with the GPS:
• Investments that support improved rates of cycling and patronage of public transport to meet transport
choice objectives as well as reduce dependency on private vehicles, provide safe transport options and
reduce emissions.
• Measures to improve road safety and reduce deaths and serious injuries.
• Improvements to freight routes that improve network efficiency as well as resilience and reliability.
Road to Zero – NZ Road Safety Strategy 2020 – 2030
Road to Zero articulates the Government’s vision of ‘a New Zealand where no one is killed or seriously injured
in road crashes’, guiding principles for design of the road network and road safety decisions, as well as targets
and outcomes for 2030. It sets out the five areas of focus for the next decade:
• Infrastructure improvements and speed management
• Vehicle safety
• Work-related road safety
• Road user choices
• System management.
This RLTP includes a headline target that is aligned with the NZ Road to Zero Safety Strategy target of a 40
percent reduction in deaths and serious injuries by 2030 by adopting this target at a regional level. (The policy
framework and transport priorities in this RLTP respond to the critical and urgent nature of the change
outlined in Road to Zero and have considered strategic responses across the five focus areas.’
National Policy Statement on Urban Development 2020
This national policy statement (NPS UD) aims to guide local government decisions about enabling growth, in
the right locations. This includes investing in transport networks to drive more efficient and liveable urban
forms and ensuring active travel that provides health benefits is a more attractive and accessible choice. The
NPS UD will enable more compact, multi-unit dwellings to be built close to public transport, services and
amenities, as well as Greenfield development opportunities.
This policy direction will provide important context for land use and transport integration policies within
RLTPs, particularly for regions with major urban areas and growth pressures. The NPS UD will strengthen the
existing requirement for regions to have future development strategies to guide long term planning. These
are now required for New Zealand’s major urban centres, including Napier Hastings, and are encouraged in
other urban environments. This is important context as the rate and pattern of development will have a
significant impact on the transport challenges for the region.
New Zealand Energy Efficiency and Conservation Strategy (NZEECS) 2017-2022
Sets the overarching direction for government and specific actions for the promotion of energy efficiency
and renewable sources of energy. The current NZEECS includes ‘Efficient and low-emissions transport’ as one
of three priority areas, with an associated target for electric vehicles make up two per cent of the vehicle
fleet by the end of 2021. The contribution of public transport (fleet and use) and efficient freight movement
are recognised in the strategy and this has been taken into account in developing the policies and priorities
in the Hawke's Bay RLTP as required by LTMA.
Arataki
Arataki is the Waka Kotahi’s 10-year view of what is needed to deliver on the government’s current priorities
and long-term objectives for the land transport system. Arataki outlines the context for change, the step
changes in existing responses that it believes are needed, and the levers the Transport Agency will use, in
partnership with others, to shape change. It includes national, pan-regional and regional summaries. Arataki
Version Two has just been released, providing an update in relation to COVID impacts.Draft for Consultation January 2021 20
Key insights are identified for the Hawke’s Bay region in Arataki and these have informed the development
of this RLTP. The step changes that are areas of ‘high’ focus for the Waka Kotahi in relation to the Hawke’s
Bay region when considered in the wider national context are to:
• improve urban form (well-designed, compact, mixed-use and higher density urban development);
• transform urban mobility;
• tackle climate change and
• significantly reduce harms.
Waka Kotahi’s focus of effort in Hawke’s Bay is to help create a safer, more resilient land transport system,
one that supports economic recovery and regional growth, maintains critical connections; encourages
increased use of public transport, walking and cycling in Napier and Hastings; and provides appropriate levels
of service across all transport networks.
Toitū Te Taiao – Wala Kotahi Sustainability Action Plan
Toitū Te Taiao, Waka Kotahi’s new sustainability action plan, supports Arataki by setting out the actions Waka
Kotahi will take to tackle climate change and create a sustainable land transport system to realise our vision
is for a low carbon, safe and healthy land transport system.
4.3 Other National Plans
Other national plans which provide important context for this RLTP include:
Waka Kotahi’s Keeping Cities Moving: National Model Shift Plan - this sets out national objectives and
programmes to increase the share of travel by public transport, walking and cycling by shaping urban
form, making shared and active modes more attractive, and influencing travel demand and transport
choice.
The Ministry of Transport’s draft New Zealand Rail Plan – this outlines the Government’s long-term
vision and priorities for New Zealand’s national rail network, both freight and passenger networks. The
Land Transport (Rail) Legislation Bill will amend the Land Transport Management Act to bring about the
proposed policy framework for rail.
One Network Road Classification (ONRC) - the land transport system is currently classified using a single
system regardless of who the Road Controlling Authority is. The One Network Road Classification (ONRC)
classifies the road transport network based on vehicle-based traffic volumes, strategic corridors and
place of significance such as ports, airports and hospitals. ONRC reflects current travel demand and how
communities are interconnected.
The Regional partnership is evolving the ONRC classifications to an updated system to be known as the
One Network Framework (ONF). It will introduce the importance of adjacent land use and place
functions in defining how the network should look and feel at any location. ONF provides an opportunity
for more integrated delivery of regional outcomes.
During the 2021/24 period Hawke’s Bay Road Controlling Authorities will advance their current ONRC
network classifications and transition them into the new One Network Framework in time for the
2024/27 RLTP planning processes.
The One Network Framework will be used to define the strategic transport system and enable a
strategic reporting framework in the 2024 review of this RLTP.Draft for Consultation January 2021 21
The New Zealand Upgrade Programme 12
The regional component of this programme includes two projects in Hawke’s Bay:
• SH2 College Road to Silverstream Cost: $13m
The vertical and horizontal curve realignment and the addition of a passing lane along a 1.7
kilometre section of SH2 north of Waipukurau in Central Hawke’s Bay. It will improve the
efficiency and safety of this key freight route between Hawke’s Bay, the Manawatū and
Tairāwhiti and will improve the connection to Napier Port. This project will support regional
economic growth by reducing travel times, improving access and efficiencies for moving
people and goods along this key route.
• SH2 Tahaenui Bridge Cost: $1.2m
The upgrade of Tahaenui Bridge on SH2 between Wairoa and Gisborne to allow two-lane
travel. The funding will enable the bridge to be widened to two-way travel and will improve
the roading network access and efficiency for those travelling between Gisborne and Hawke’s
Bay. This bridge is currently the only one-lane restriction on the important link between
Gisborne and Napier Port.
4.4 Regional Plans
Regional Policy Statement
The Regional Policy Statement describes the regionally significant natural and physical resource issues.
It provides an overall management framework of objectives and policies that applies across the region
including the operational maintenance and development of transport infrastructure and the integration
of land use with transport infrastructure while:
• limiting network congestion
• reducing dependency on private motor vehicles
• reducing emission of contaminants to air and energy use and
• promoting the use of active transport modes.
The Hawke’s Bay Regional Public Transport Plan (RPTP 2019-2029).
The RPTP sets out the objectives and policies that will guide the public transport network and
development for the region for the next ten years and is due for a review in 2021. It states that the vision
for public transport is:
“To deliver a public transport service which is safe, increasingly used, integrated with other modes and
contributes to the economic, social and environmental wellbeing of the people of Hawke’s Bay”.
Matariki: Hawke’s Bay Regional Economic Development Strategy and Plan 2019
The vision of the Matariki Regional Economic Development Strategy and Plan is that: “Every household
and every whānau is actively engaged in, contributing to and benefiting from, a thriving Hawke’s Bay
economy.”
The strategy states that this will be achieved by making Hawke’s Bay NZ’s most innovative region, the
leading exporter of premium primary produce, and a hub for business growth. It includes promotion of
several transport projects including improvements to SH2 and protection of access to the Port. It seeks
a future focused approach to infrastructure investment so that it is resilient and robust as well as
delivery of increased environmental sustainability through reduced pollution and greenhouse gas
emissions.
12
https://www.nzta.govt.nz/planning-and-investment/nz-upgrade/regional-packageDraft for Consultation January 2021 22
Regional Cycle Plan 2015
The Hawke’s Bay Regional Cycle Plan is a 10-year plan that sets out the region’s priorities for cycling and
is undergoing a review in 2020/21. The vision of the plan is “to normalise cycling in Hawke’s Bay to such
an extent that the region is nationally and internationally recognised as providing the most bike-friendly
experience in New Zealand.”
The Regional Cycle Plan establishes a coordinated approach for the development and delivery of cycle
network infrastructure and promotion across the region to ensure resources are pooled and actions
prioritised to achieve the greatest gains for cycling in Hawke’s Bay. The document sets out an
infrastructure plan, as well as a marketing and promotions plan and actions aimed at influencing travel
behaviour.
4.5 Other regional plans and strategies
Heretaunga Plains Urban Development Strategy 2017
The Heretaunga Plains Urban Development Strategy (HPUDS) is a collaboration between the Hastings
District Council, Napier City Council and Hawke's Bay Regional Council to plan for urban growth on the
Plains between 2015 and 2045. It is due for a review commencing in 2021. There are opportunities and
benefits from broadening the scope of HPUDS to include Central Hawke’s Bay in the short term and
Wairoa in the longer term. It enables a more integrated approach to urban development and
consequential transport infrastructure across a wider, interdependent and connected area.
The HPUDS vision is:
“In 2045, the Heretaunga Plains is a place where there are thriving communities, quality living
environments with high levels of amenity, and where mana whenua values and aspirations are
recognised and provided for, and where:
• There is a growing and resilient economy which promotes opportunities to live, work, play and
invest.
• The productive value of its soil and water resources are recognised and provided for, and
sustainable use is promoted.
• The urban centres of Napier and Hastings have distinct identities and provide complementary
living, working and learning opportunities.
• Community and physical infrastructure is integrated, sustainable and affordable.”
An integrated and accessible transport network will help to achieve this vision and provide connections
from new developments to key destinations. The HPUDS lists the following key approaches for
transport:
• Making best use of the existing transport network.
• Protecting key intra and inter regional routes (road and rail).
• Supporting economic development in the region by integrating transport with industry and
business requirements. These need to be anticipated in a timely manner and planned for in an
integrated way.
• Ensuring that development does not compromise key transport hubs or routes and that
opportunities for future expansion are not foreclosed (for example at the Port of Napier).
• Implementing the Airport Fans and Airport Noise boundaries.
• Encouraging public transport, walking and cycling in urban areas.
• Promoting live, work and play to reduce travel demand.You can also read