Moreland Integrated Transport Strategy 2019 - Appendix Final - Moreland City Council
←
→
Page content transcription
If your browser does not render page correctly, please read the page content below
Moreland Integrated Transport Strategy
2019
Appendix
Final

Prepared by: GTA Consultants (VIC) Pty Ltd for Moreland City Council

on 25/03/19

Reference: V132700

Issue #: B
Moreland Integrated Transport
     Strategy 2019
     Appendix
     Final

     Client: Moreland City Council

     on 25/03/19

     Reference: V132700

     Issue #: B

                  © GTA Consultants (GTA Consultants (VIC) Pty Ltd) 2019
                  The information contained in this document is intended solely for the
                  use of the client for the purpose for which it has been prepared and
                  no representation is made or is to be implied as being made to any
                  third party. Use or copying of this document in whole or in part without
                  the written permission of GTA Consultants constitutes an infringement
                  of copyright. The intellectual property contained in this document         Melbourne | Sydney | Brisbane
                  remains the property of GTA Consultants.
                                                                                                Canberra | Adelaide | Perth
()
1.1.      Introduction
This document is the Appendix to the Moreland Integrated Transport Strategy (‘MITS Appendix’). It builds on the MITS
Background Report and contains further information, research and statistics which inform many of the strategies and actions
in the Moreland Integrated Transport Strategy (‘MITS’). The documents have been structured this way to reduce the length
of MITS and improve its readability and clarity, whilst making background material available separately.

This document includes key challenges, a summary of key changes and a review of potential funding mechanisms. It is noted
that the material in this Appendix is intended to inform MITS (and is not the Strategy itself) and is based on the direction
provided by Council and the community, including input from Councillors at adoption.

1.2.      Key Challenges
Growth and Congestion
What is the challenge?
                                                                                Figure 1: Peak Car Use, VISTA 14
Melbourne is forecast to overtake Sydney to become Australia’s
most populous city by the 2030s 1 and is on track to reach a
population of eight million by 2051. 2 Moreland’s population is
expected to exceed 200,000 in the next five years and is projected
to grow by 43,000 by 2036.3 As the city evolves, Moreland will need
to begin a shift in the way we travel to protect our liveability and
ensure we can continue to move efficiently.

As growth occurs, congestion and delays are worsening on roads
across Victoria.4 The Victorian Auditor-General found that
congestion is generally worse in inner Melbourne than in outer
areas, with travel to school and work among the most significant
contributing factors. 5 Moreland is no exception, with 56 per cent of
all journeys to work6 and 48 per cent of travel to educational facilities
undertaken by car.7

Moreland’s main roads are typically congested during weekday peak
periods and across the middle of the day on weekends. 8 During
morning and afternoon peak periods on Sydney Road, when parking
clearways are enforced, average travel speeds are typically slow,
on average 17 kilometres per hour and 14 kilometres per hour
respectively. Between peak hours across the middle of the weekday,
when parking lanes are re-instated and general traffic shares the
tram lanes, the average speed deteriorates to 9 kilometres per hour,
the slowest of all arterial roads in Melbourne. 9

Traffic congestion can also slow on-road public transport services
and make it harder to connect the right workers to jobs. It can
introduce costs in time and fuel and significant carbon emissions
and air pollution. By 2030, congestion is expected to cost every
Melburnian $1,700 per year. 10

On the positive side, traffic congestion acts as a catalyst to change
the way we travel and whether we travel at all. This includes shifting

                                                                            V132700 // 25/03/19
                                                                            Final // Issue: B
                                                                            Moreland Integrated Transport Strategy 2019, Appendix   1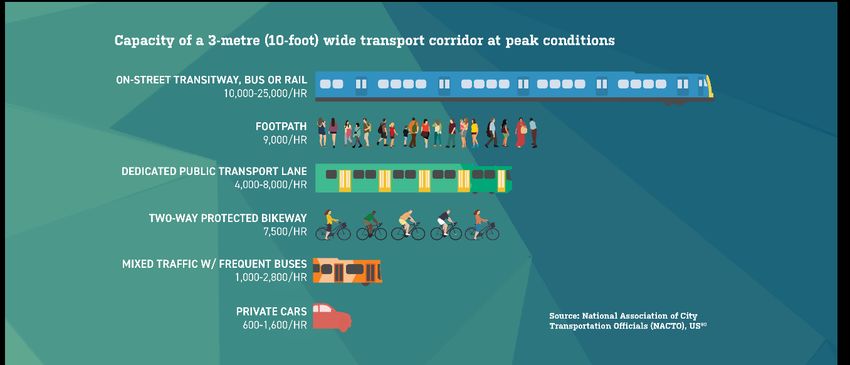
to more environmentally sustainable, healthy or affordable modes, such as walking or cycling, which provide alternative
access during periods of congestion. 11

Congestion can have the effect of changing what trips some people take, such as travelling at a different time of day or to a
closer destination. This can result in more effective use of road space over the day, making shorter trips, and meeting daily
or weekly needs more locally.

Traffic can also show that there is significant demand for travel to a location which may indicate latent demand for more
efficient alternatives, such as public transport. Sometimes, the cost of building new infrastructure (like roads and public
transport) can outweigh congestion’s cost to society, so that our roads are congested in peak periods can be a sign that we
haven’t wastefully overbuilt our road network. 12,13 While roads are typically congested in peak periods (and some key roads
beyond this), many roads function adequately outside of peak times.
How can MITS address this challenge?
For the whole of Melbourne, the highest level of car use occurs during the morning and afternoon peak hours. 14 This means
at the times of day which have the highest demand for travel, we also have the largest nu mber of the most space- inefficient
vehicles on our roads at the same time.

Recent data shows that on average across Victoria, our traffic and on-road public transport lanes carry 570 – 800 people per
lane per hour,15 far below the throughput achievable by other uses of the equivalent road space. By comparison, a dedicated
bus or tram lane, or a two-way protected bikeway, could move up to ten times the number of people per hour in the same
road width.16

Figure 2: Capacity of a 3-metre (10-foot) wide transport corridor at peak conditions, National Association of City
Transportation Officials 16

Road schemes are often touted as ‘busting congestion’, but in an urban environment, if a road is widened or improved, more
people will be attracted to use it. This phenomenon is known as ‘induced demand’ and is widely recognised as a problem in
urban planning and a challenge facing our cities. 17

Building new road links can also encourage people to live further away from where they work, encouraging urban sprawl and
ingraining reliance on the private car for travel. 18 On this basis it is often said that we “cannot build our way out of congestion” 92
and solving traffic congestion by building more roads has proven to be an unsustainable solution. 19

Instead, Council will implement a holistic transport solution for Moreland that considers both supply and demand -side
interventions, and that seeks to break the self- reinforcing cycle of car dependency. The alternative is to promote a positive
self-reinforcing cycle of integrated land use and transport planning which makes better, more efficient use of our existing

                                                                          V132700 // 25/03/19
                                                                          Final // Issue: B
                                                                          Moreland Integrated Transport Strategy 2019, Appendix            2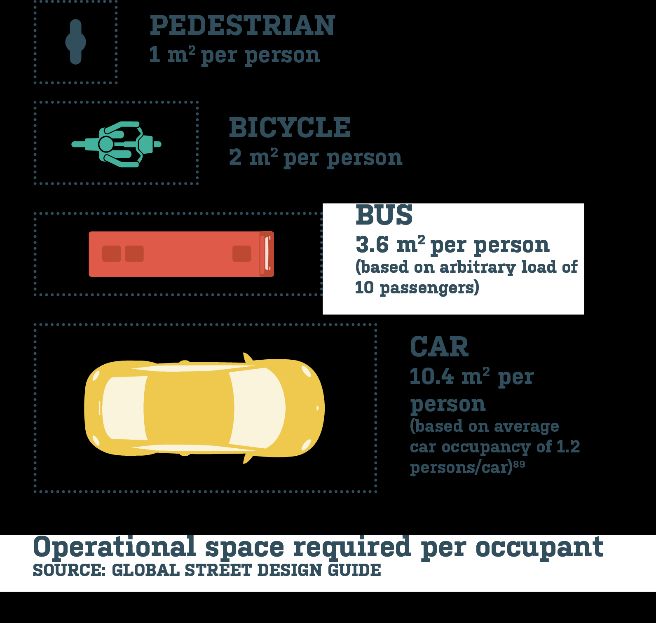
urban space, including our road space. In short, increasing urban density, if managed well, can encourage more sustainable
travel, and vice versa. As people live closer to their daily destinations, active modes become more convenient and viable.
Likewise, while increased demand for public transport supports upgrades to services, which in turn encourages further
increases in urban density, particularly around transport nodes and corridors.

Climate Change
What is the challenge?
The climate in Moreland is comfortable for most of the year, but we are increasingly feeling the impacts of climate change on
our community and our environment. The consequences of climate change caused by humans are becoming more evident,
with warmer weather and a number of ‘record’ high temperatures and heatwaves. More frequent and more intense fluctuations
in weather and increasingly severe weather events can be expected, including droughts , fires, storms and floods. By 2030,
approximately two weeks per year are expected to be over 35˚C. 20 In September 2018, Council acknowledged that we are in
a state of climate emergency requiring urgent action by all levels of government. The increasing severity of weather events
(such as heatwaves) can be expected to impact on our community’s health and wellbeing. The body’s ability to respond to
heat can be compromised in the elderly, infants or those with medical conditions, increasing the r isk of heat stress, heat
stroke or heat exhaustion, which can be fatal. 21

Weather events (like heat, storms and extreme rainfall) could also impact productivity, with more hot -weather ‘stop work’
events and potential disruptions to our infrastructure networks, including our transport and electricity supply. Weather events
such as fire and floods can bring devastating consequences to safety and property, as well as substantial impacts on the
natural environment. Rising temperatures can impact both land and w ater ecosystems and create challenges for food
security.22
How can MITS address this challenge?
In Moreland, transport accounts for more than one-third of an average household’s carbon emissions, and almost one-fifth
of Victoria’s and Australia’s overall greenhouse gas emissions. 23,24 Nationally, transport is the third largest source of
greenhouse gas emissions, predominantly generated by road-based vehicles. 25 On average, private cars are one of the
highest-emitting modes of transport (on a per passenger-kilometre basis) in urban Victoria 26 and are responsible for almost
half of Australia’s transport- related greenhouse gas emissions 23.

Moreland has long been a leader in the sustainable transport space. In 2012, Council launched an electric vehicle hub in
Coburg, including Victoria’s first electric vehicle ‘Fast Charge’ station and in 2013, 27 we hosted an electric GoGet share car
as part of the State Government’s Electric Vehicle Trial. 28 Moreland also participated in Transport for Victoria’s ‘Bus Your
Bike’ trial, with the ability to carry bicycles on front- mounted racks on buses on routes 510 and 512. 29

We appreciate that being a true zero- emission community would require a shift to renewable power sources for our transport,
including our electricity supply. As a city, we are heading in the right direction. In 2017, plans were announced to power the
Melbourne’s tram network by solar energy. 30

The City of Moreland’s Council Plan has a goal of shifting towards zero-carbon emissions for the municipality by 2040. The
Moreland Zero Carbon 2040 Framework recognises that “everyone in Moreland is responsible for climate change, everyone
is vulnerable to the impacts and everyone must be part of the solution”. Consistent with these existing policies, many of the
strategies and actions in MITS seek to reduce the production of greenhouse gas emissions which are driving climate change
and halt the rising burden of carbon emissions and the impact of global warming on future generations. 20

Health
What is the challenge?
Many studies have confirmed the importance of recreation and physical activity to health and well -being. Organisations such
as the Heart Foundation have also pointed out the link between urban form and physical activity – i.e. higher-density areas
tend to be associated with higher rates of walking and cycling, while lower density, outer suburban areas have been found

                                                                     V132700 // 25/03/19
                                                                     Final // Issue: B
                                                                     Moreland Integrated Transport Strategy 2019, Appendix        3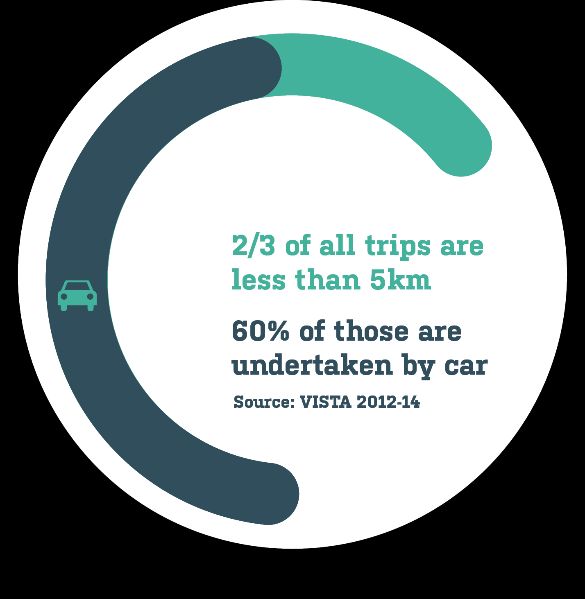
to be associated with more sedentary lifestyles, with certain groups in the community being more susceptible to sedentary
behaviour than others.31

More than 60 per cent of Australian adults and 25 per cent of Australian children are overweight or obese and coronary heart
disease continues to be our single greatest cause of death. 32 Australians spend more than $4,000 per person on health every
year,33 with cardiovascular disease amongst the highest burden on the health system.

Almost half of Australian adults do not meet activity requirements to maintain good health. 32 People in the lowest average
household income areas tend to be overrepresented in these figures. For example, people living in disadvantaged areas are
2.6 times more likely to have diabetes and 2.2 times more likely to have a coronary heart disease. People in lower
socioeconomic areas are also twice as likely to not undertake physical exercise compared to those in the highest
socioeconomic areas. 34 People with disabilities are significantly more likely to be obese or undertake inadequate physical
exercise.32

In a world where people are increasingly ‘time poor’, swapping to more active modes of travel (such as walking and cycling)
is an easy way to increase physical exercise every day and decrease risk factors associated with major health issues. People
need 30 minutes of moderate-intensity exercise five times a week to realise the health benefits of physical activity. 35 We need
not go to the gym or participate in a team sport to hit our target - the health benefits of choosing active travel for our everyday
trips are comparable to those of formal exercise programs. 34
How can MITS address this challenge?
In Moreland, many short trips are currently undertaken by car, particularly over shorter distances. 36 Many of these trips could
be undertaken on foot or by bicycle, or a combination of these modes and public transport.

Studies have shown that people commuting by more active modes (walking, cycling and public transport) tend to have a
lower body mass index and lower percentage body fat than those who drive. 37 Commuters who walk and cycle also report
significantly higher satisfaction than those who drive or take public transport. 38

Community feedback identified high speed traffic, limited crossing points and the need to cross multiple lanes of traffic as
key barriers to walking, along with poor quality footpaths and large distances between homes and key destinations. Concerns
were also raised about cars pulling out of driveways on busy streets, creating safety conflicts. For cycling, consultation
identified traffic speeds, risk of dooring, road rage and congested traffic as key barriers, along with busy shared paths,
unmaintained bicycle paths and disappearing bicycle lanes.

Acting on these barriers to can help create an environment which is conducive to active travel and a healthier lifestyle.

                                                                       V132700 // 25/03/19
                                                                       Final // Issue: B
                                                                       Moreland Integrated Transport Strategy 2019, Appendix          4
Safety
What is the challenge?
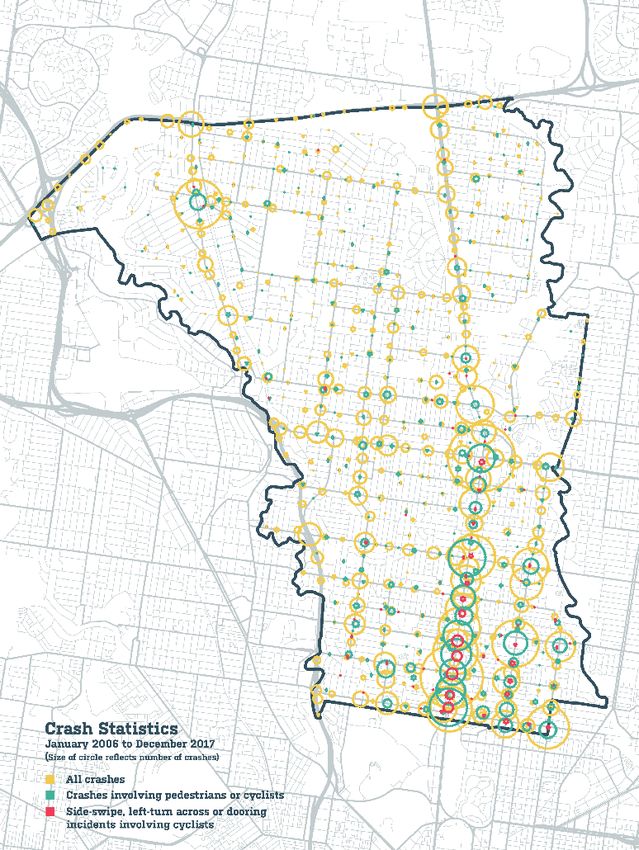
There have been almost 5,000 reported crashes Figure 3: Crash Statistics for Moreland, VicRoads 39
in Moreland since 2006, with almost one-in-five
crashes involving a cyclist and 15 per cent
involving a pedestrian. Almost one third of
crashes resulted in a serious injury, requiring
hospitalisation. Most crashes occurred during the
day and when conditions were dry. 39
Some of the densest corridors for crashes
involving cyclists in Moreland are located along
Sydney Road and Lygon Street, particularly at the
southern end of Moreland. 39 These corridors are
overrepresented for dooring incidents, side-swipe
or incidents where cars turn left across the path of
bikes (or vice versa). They are also
overrepresented in incidents which resulted in
serious injury, requiring hospitalisation. Most fatal
or serious injury crashes involving cyclists were
caused by either cyclists or cars turning right
across through traffic. 39 Dooring incidents
represented one- in-eight crashes involving bikes
in Moreland, while one-in-five crashes were the
result of a right-turn-across conflict.
The densest concentrations of crashes involving
pedestrians on the road are also along the same
corridors of Sydney Road and Lygon Street, as
well as localised high-pedestrian areas in Coburg
and Glenroy.39
Consultation identified unsafe environments as a major barrier to walking and cycling. Many parents do not feel comfortable
allowing their child to walk or cycle to school because it is perceived as unsafe. In Australia’s car -dominant culture, there is
a tendency to protect children from the dangers of car traffic by keeping them in cars. 41 As a result, in absolute terms, an
Australian child is four times more likely to be killed as a car passenger than as a cyclist and nearly twice as likely to be killed
in a car than as a pedestrian. 40 Similar results were found in other Australian data which showed 59 per cent of transport-
related deaths of children occur when the child is a car passenger, compared to 6 per cent on a bike and 26 per cent as a
pedestrian.42 Children are allowed to cycle on footpaths until age 12 43 and are often accompanied by adults.
Adults are also approximately five to ten times higher in risk of injury walking and cycling compared to driving a car.44 In
relative terms, fatality risks are generally higher for pedestrians and cyclists than car passengers. Council is committed to
improving conditions for vulnerable road users to reduce the risk of active travel and make walking and cycling attractive an d
accessible for everyone.
“I frequently ride with my young children, to their school and to local shops and to visit friends and with better infrastructure
this could also be much safer” – Community consultation
Themes of personal security were also prevalent throughout the community consultation. Blind spots and poor lighting were
raised as barriers to both walking and cycling. For public transport, community consultation identified ‘feeling unsafe at the
V132700 // 25/03/19
Final // Issue: B
Moreland Integrated Transport Strategy 2019, Appendix 5stop or station’ as the greatest barrier to tram use and amongst the highest barriers to train use in Moreland. ‘Poor waiting
facilities’ and ‘stop seems unsafe’ were listed amongst the barriers to bus use.
How can MITS address this challenge?
Countries applying best practice for pedestrian and cyclist safety demonstrate a strong commitment to establishing a safe
and comfortable active travel environment, including through the provision of infrastructure, safety education, speed reduction
measures, traffic management and training. 45 Council will continue to improve the safety and accessibility of walking and
cycling routes, including committing not to install any new roundabouts due to poor safety and accessibility outcomes for
pedestrians and cyclists.
Community responses suggested that reducing speed limits to 40 kilometres per hour (or lower) for vehicles and increased
separation of cyclists from other modes (including pedestrians) would improve safety for all users. Broader feedback also
identified a preference for reducing speed limits to encourage walking and cycling.
Reducing speed limits are a significant measure Council can pursue on many roads to create a safer environment for all road
users. Research undertaken by the International Transport Forum for the Organisation of Economic Cooperation and
Development (OECD) found a direct link between vehicle speed and crash occurrence and severity. A 10 per cent increase
in average speed (for example, from 50 kilometres per hour to 55 kilometres per hour) can lead to a 40 per cent increase in
fatal crashes, a 30 per cent increase in serious crashes and a 20 per cent increase in crashes which result in an inju ry.46
The impact force of a vehicle colliding with a pedestrian at 30 kilometres per hour is enough to be fatal, 47 with the risk of
injury or death rapidly increasing with higher speeds. 48
Research by the World Health Organisation Figure 4: Chance of Fatal Outcome, TAC 47
has found that a decrease in travelling
speed by even 1 kilometre per hour can
lead to a 2 to 3 per cent reduction in road
crashes.49
Trials in the UK found that decreasing
speed limits resulted in an increase in
walking and cycling trips. 50 Other trials in
the UK found that reducing speed limits
resulted in more people cycling to school,
more people walking regularly, more
residents feeling safe for their children to
walk to school and more primary school
children allowed to play unsupervised on
the street.51
Around the world, cities and towns are making the shift to 30km/h zones to make their stre ets safer, quieter and calmer.
Locally, some shopping strips in Melbourne and Perth have applied 30km/h speed limits. In 2017, the City of Yarra announced
a trial for a 30km/h speed limit on local streets in Fitzroy and Collingwood. 50 The City of Melbourne is also contemplating the
introduction of 30km/h speed limits in central Melbourne under their revised Transport Strategy. 60
Reducing speed limits are not expected to significantly impact on travel time for car drivers, with some studies showing
increases in vehicle journey times of seconds, rather than minutes. 50,60 Initial studies in advance of the City of Yarra trial
indicated that motorists would be delayed by less than 12 seconds per kilometre travelling at 30 kilometres per hour per hour
compared to 40 kilometres per hour. 60 These delays may be partially absorbed by congestion or other stoppages, such as at
traffic lights. Reducing speed limits will help make everyone, especially children and the elderly, feel confident to travel on
foot and bike to service their daily needs and make streets easier to cross. 52
V132700 // 25/03/19
Final // Issue: B
Moreland Integrated Transport Strategy 2019, Appendix 6With respect to personal security, Council will take actions to create safer spaces for all women and men, day and night,
including by normalising walking and cycling and putting more ‘eyes on the street’,
Air Quality
What is the challenge?
In Melbourne, motor vehicles contributed to almost three quarters of carbon monoxide and nitrogen oxide emissions and
almost a third of all small particle and volatile organic compound emissions, 53 which can cause a range of health
complications.54
Diesel exhaust has been called “more carcinogenic than cigarette smoke.” 55 Exhaust from diesel fuel contains more than
forty air contaminants, including confirmed or suspected carcinogenic substances. Some of the most vulnerable members of
our society have the highest sensitivity to diesel exhaust, including children, the elderly and those suffering from health
complications. The microscopic particles released in exhaust can enter the lungs, eyes, nose and throat, causing a range of
health implications from irritation to chronic respiratory issues and increased risks of lung cancer. 56 Exposure to diesel
particles can also make asthma and allergy sufferers more susceptible to symptoms.
How can MITS address this challenge?
Moreland has comparatively limited vegetation to provide shading, evaporative cooling and to combat air pollution. 57 In recent
years, Council has planted more than 5,000 street trees each year to contribute to the greening of Moreland. 58
“In addition to offering shade, they reduce ambient temperatures in hot weather, absorb rainwater and tailpipe emissions,
provide UV protection and limit the effects of wind. Trees also slow cars and improve the sense of enclosure by ‘necking
down’ the street space with their canopies. A consistent cover of trees can go a long way toward making up for an otherwise
nasty walk”.59 – Walkable City, Jeff Speck
More broadly, Council will encourage a shift away from fossil-fuel reliant vehicles to more efficient modes of travel, zero-
emission transport and active travel alternatives.
Equal Access
What is the challenge?
Almost one in five Australians report living with a disability, 61 which can have wide-ranging implications on liveability and
accessibility. Those with disabilities are less likely to work, more likely to have lower levels of income and less likely to have
a Year 12 education (or equivalent) than those without a disability. 62
We can only be a successful city if we maximise access to daily destinations for all of our people, and minimise ‘transport
disadvantage’. For Moreland, this means ensuring that everyone has access to a range of transp ort choices that empower
and provide independence. It also means accommodating the needs of all forms of disability, be it vision impairment, impaired
hearing, mental health, intellectual disability or a physical disability.
Moreland’s Disability Working Group highlighted the inaccessibility of trams as a key barrier to their use. The limited range
of accessible platforms and older trams mean that users with disabilities either cannot access services or cannot disembark
at their desired destinations. Other users with limited mobility (including the elderly) or with prams often have difficulty
accessing and disembarking the high steps on older trams. Narrow station platforms and entrances and footpaths introduce
challenges to manoeuvrability. Some feedback indicated that poorly maintained footpaths, poor access for those with
disabilities, dangerous crossing facilities and a lack of footpath links or crossings as key access barriers in Moreland. Broader
consultation also reiterated the findings of the Working Group, with difficult access to tram stops and poor shelter and facilities
(including seats) for disabled users.
“I would like the option of using trams but most of the trams and/or tram stops are not wheelchair -accessible, which rules
trams out most of the time for me” – Community consultation
V132700 // 25/03/19
Final // Issue: B
Moreland Integrated Transport Strategy 2019, Appendix 7“I am disabled and cannot cycle or walk far, so rely more on other forms of transport which can be disappointing.” As we
evolve, we need to ensure our streets are designed with all users in mind – when we accommodate for those with higher
needs, we accommodate everyone” – Community consultation
More broadly, roads, freeways and railway lines can all introduce impediments to travel, where other users (such as walkers
and cyclists) are required to travel out of their way in order to cross. Other impediments, such as parked cars, kerbs without
ramps, stairs and overpasses or underpasses can also interrupt access for a range of users, including those with disabilities ,
prams, cyclists or limited mobility.
In Moreland, major arterial roads like Bell Street and Sydney Road, as well as railway lines and natural constraints like cre eks
are often considered to create severance effects on communities and introduce barriers to access for many users .
Severance
The presence (or absence) of transport infrastructure can have an impact on the way people live, move and behave.
‘Severance’ occurs when there is interference with the “ability of individuals to access goods, services or personal networks ”
. A common example is the barrier caused by physical transport infrastructure (such as roads, railways, structures and parking
lanes) which inhibit the ability for pedestrians to access services and facilities beyond. The presence of other barriers, su ch
as the speed or volume of passing traffic, restricted access routes (such as freeways) or access limitations for some users
(such as stairs or kerbs) also create severance effects. While the introduction of footbridges and underpasses are often well-
intended, these can also cause severance by creating longer journey times for users compared to at - grade crossings and
often insufficiently cater for people with mobility restrictions. 63
In community consultation, walkers and cyclists alike identified ‘dangerous crossing’, ‘too long to wait to cross at signal’,
‘limited time to cross at signal’ and ‘cars ignoring traffic signals’, ‘speeding traffic’ and ‘cars blocking footpath’ as iss ues in
Moreland. ‘No crossing facilities’ was identified as the number one barrier to walking in Moreland. ‘Speeding traffic’ was also
the number one car issue identified in consultation.
Safer crossing points, shared zones, removal of on-street car parking, increased number of crossing points, increased
crossing time for pedestrians, additional crossing bridges across the railway lines and creeks, more road space for
pedestrians, automated pedestrian crossings and more accessible crossing points were identified as potential enablers to
walking by the community.
Similarly, more crossing points, reduced speeds on cycling routes, removal of car parking on cycling routes, removal of level
crossings and automated bicycle crossings were identified as potential enablers to cycling.
How can MITS address this challenge?
Council will work to ensure everyone has access to a range of transport choices that empower and provide independence.
The higher needs of our community are not limited to mobility. Council will work to ensure its infrastructure provides access
to a range of transport choices for users of every level of ability, including expanding the number of accessible (disabled)
parking bays. Council will also advocate to other levels of government to continue to improve the accessibility of transport
services throughout the municipality.
More broadly, Council will work to provide pedestrian crossings in locations where they are sought, based on understanding
of desire lines. Council will also continue to pursue initiatives which prioritise pedestrians and cyclists.
V132700 // 25/03/19
Final // Issue: B
Moreland Integrated Transport Strategy 2019, Appendix 81.3. Summary of Key Changes
1.3.1. Smarter parking management
What is the situation?
Background
During consultation, we asked the community to identify their level of support for two car parking scenarios – one which
provided an abundance of free car parking on-site and at activity centres, and another which provided reduced (and paid)
car parking where there was good access by public transport, walking and cycling. The community response was evenly
divided across the two options, with support for both scenarios.
Responses from the north of Moreland favoured the scenario with more and free car parking, while responses from the south
slightly favoured lower car parking provision in areas of good alternative transport access. This highlights the higher
dependence on the car in the north of Moreland, where high-frequency public transport and access to walking and cycling
are less prevalent. In these areas, people are likely to use their car to access key services and destinations due to a lack of
viable alternative options, or distance between homes and activity centres. Due to car reliance, respondents in the north are
likely to see car parking as a necessity and given higher car ownership, are likely to favour more car parking in apartment
buildings.
By contrast, respondents in the south are more likely to have access to daily needs by other modes, including by higher -
frequency trams, walking and cycling. As a result, respondents in the south are more likely to appreciate car parking as an
inefficient use of space and favour a reduction in actions which support car use in areas where alternatives are available.
The community told noted that different responses to parking were required for different areas across Moreland, recognising
the different contexts.
Car Parking Provisions
Current planning laws in Moreland require a certain (minimum) number of car parking spaces to be provided for every new
development in the municipality, based on its scale and type of use. If a developer wishes to provide less than this minimum
level, they must seek approval from Council, even if the site is very near good-quality public transport, walking and cycling
links, shops or on a road that is heavily congested. This current arrangement is called a “minimum parking provision”, because
it sets a minimum level of car parking that must be provided.
A London study found that planning regulations forcing developers to provide a set minimum rate of car parking actually
resulted in an oversupply of parking that was underutilised. 64 When this requirement was removed, parking continued to be
provided, but at a rate approximately 40 per cent lower. The surplus that was initially required was an inefficient use of sp ace,
as well as an avoidable increase to housing cost.
State Government Car Parking Levy
In 2005, Melbourne introduced a congestion levy to off-street car parks in the central city area to reduce traffic congestion
and encourage drivers to use alternative modes to access the CBD. Owners and operators of car park spaces in the
congestion levy zones are required to pay an annual fee for all non-exempt car parking spaces. 65 Exemptions apply for
spaces which are exclusively provided for disabled users, residents, visitors, hotel guests, loading, emergency vehicles or
employees of specific organisations such as charities and hospitals. 66
In 2015, the car parking congestion levy was extended to other areas of inner Melbourne, including parts of Moreland to the
south of Dawson Street/Glenlyon Road. In 2018, owners and operators of car parking spaces are required to pay $1,000
annually for every non-exempt off-street car parking space. This cost can be passed on to the person using the parking
space.65 The revenue from the scheme is returned to the state government, with the City of Melbourne receiving a lump sum
V132700 // 25/03/19
Final // Issue: B
Moreland Integrated Transport Strategy 2019, Appendix 9annual payment to be spent on transport initiatives. 67 At present, state revenue collected from the levy is not returned directly
to Moreland or necessarily used for improvements in the area.
What is the solution?
Car Parking Provisions
MITS proposes to introduce a ‘maximum parking provision’ in ‘Activity Centres’ where there is generally good access to
walking, cycling and public transport, as well as the ability to service many daily needs nearby. The Activity Centres are
generally located along major commercial strips in Brunswick, Coburg and Glenroy. This means the planning scheme will set
the maximum number of car parking that can be provided in a new development and developers can then provide any amount
of car parking between zero and the maximum limit as of right. If a developer wishes to provide more than the maximum limit,
they must seek approval from Council. This approach limits oversupply of car parking, controls congestion in the area and
provides new residents with a choice about a level of car parking to suit their needs.
The case for introducing maximum car parking provision includes:
• Consideration of maximum rates under the former Moreland Zero Carbon Evolution Strategy (now the Moreland
Zero Carbon 2040 Framework).13
• In 2004, car parking maximums were implemented across London which led to a 15 per cent reduction in trips by
car in Councils that have similar public transport access and housing density to Moreland (Brent and Greenwich) 68
• Recent research suggest that parking maximums help restore the attractiveness of inner cities and promote smart
growth69
• Policy analysis by RMIT shows that the historical intention of car parking minimums does not align with the
objectives for MITS 70
Introducing maximum car parking rates also allows a greater mix of housing affordability, with the flexibility to construct some
(or all) housing with or without car parking. The Real Estate Institute of Victoria estimates that a car space can add more
than $100,000 to the price of a one-bedroom apartment in central Melbourne, compared to an apartment with no parking. 71
In Moreland, a one- bedroom apartment in Brunswick or Coburg can cost $40,000 - $60,000 more to buy than a similar
apartment with no car space. 72 Given this is similar to the cost of constructing basement car parking, 73 providing a lower level
of car parking does not necessarily represent profit for the developer – the savings can be passed on to the purchaser.
Generally, it would be expected that some degree of parking would be provided, dictated by market appetite. For example,
car parking is still provided in Melbourne CBD, where there is no minimum requirement and a maximum car parking rate
applies instead. Maximum car parking rates also exist in other areas of Melbourne’s central city and surrounds (including
Carlton, Southbank, Docklands and Fishermans Bend), Footscray Major Activity Centre and in London. 64
MITS also proposes to introduce restrictions to on-street spaces in the surrounding area to ensure that development does
not simply seek to benefit from surrounding parking supply while not contributing to the supply in any form. This also provides
many existing residents, eligible for resident parking permits, with greater opportunity to continue to use local on-street
parking where they have no other alternative. Per current policy, new developments would not be able to access on-street
car parking permits in lieu of providing car parking on-site. At the same time, Council will expand the number of accessible
(disabled) parking bays, particularly in areas where parking restrictions are being applied.
Paid Car Parking
To manage demand, Council will seek to extend paid on-street car parking in appropriate and strategic locations (such as
activity centres) to encourage the turnover of vehicles, more fairly price the use of roads and encourage visitors t o use other
modes to access their daily needs, while also providing opportunities for all-day parking. The locations, fees and timing of
delivery will be assessed and extended periodically. Introducing paid parking as a demand management measure will also
support the objectives of maximum car parking rates, which together aim to reduce car ownership and dependence. Revenue
raised from the introduction of paid parking, as well as from transport-related permit schemes such as residential and
V132700 // 25/03/19
Final // Issue: B
Moreland Integrated Transport Strategy 2019, Appendix 10business car parking permits will be returned into sustainable transport investment for Moreland or improvements to the local
area.
Council will also ensure that use of its public space by private enterprises is also appropriately valued. At present, car sh are
companies pay a nominal fee to use on-street parking areas to provide their services. Council will review the cost of the
space used for car share and similar privately-operated transport schemes to ensure they represent value for money to
Council and are priced to reflect use of public space.
State Car Parking Levy
As part of MITS, Council will also advocate for state government car parking levy revenue to be shared with the Councils in
which the levy is collected, consistent with recent Infrastructure Victoria recommendations. 67
Summary
In summary, the key directions of MITS are:
• Permitting less parking in new developments to allow people to choose a lower level of parking to suit their needs
• Expanding parking restrictions to protect local streets from changes to parking requirements in new developments
• Using paid parking in some areas for all-day parking
Further actions can be found in the Implementation Plan chapter of MITS.
Reallocating of road space & creating safer, quieter streets
What is the situation?
Recognising the value of space as a limited resource in urban areas, we need to shift the way we view our streets to capture
the two key functions they play in our community: 74
• A corridor for movement – where streets function as conduits in moving people.
• A place for people – where the community is encouraged to linger and spend time.
In Moreland, our streets take up a significant proportion of our
Figure 5: Occupational Space Required per
urban space, with roads, footpaths and nature strips presently
Occupant, Global Street Design Guide 98
making up more than one fifth of our community’s land. 75
Some of our older streets are relatively narrow and we do not
have many road reserves available to widen our streets,
meaning any expansion of our road space would require
expensive and complex land acquisition. This generally does
not reflect the best use of Council’s limited funding or
resources. Giving greater priority to sustainable transport
modes (including walking and cycling) means more people can
travel along our limited road space.
Moreland is fortunate to have a relatively flat topography
across most of the municipality, ideal for walking and cycling.
Household survey data shows that approximately two-thirds of
trips originating in Moreland are less than five kilometres in
length, with 60 per cent of these trips undertaken by private
vehicle.76 This represents a significant opportunity to
encourage mode shift to walking and cycling. Walking and
cycling make up a quarter of all trips 77 in Moreland but for
travel to work, active travel comprises just 10 per cent of journeys, 78 potentially due to longer commuting distances.
V132700 // 25/03/19
Final // Issue: B
Moreland Integrated Transport Strategy 2019, Appendix 11Current walking and cycling uptake is typically higher in suburbs in the
south of Moreland, where there is a denser fabric of walking and cycling
routes and a diverse mix of land uses close to higher-density housing,
enabling residents to live locally. The southern suburbs are also central
to key employment areas for Morelanders, including the CBD, inner
north (Carlton, Parkville) and within Moreland (Brunswick, Coburg).
Community consultation reflected these realities, with ‘travel time’ and
‘distance’ raised as barriers to walking and cycling more often in the
north of Moreland than in the south of Moreland.
Travelling by foot and bicycle are environmentally-sustainable modes of
travel, generating zero pollution or emissions, no demand for fossil fuels
during use and no noise impact. They are also amongst the most reliable
modes of travel for many local trips and can be a time-competitive choice
for short distance trips, particularly considering the time it takes to park
a car and walk to the final destination. Walking and cycling have a very
low space requirement, meaning valuable urban space can be used to
move more people, more efficiently.
Cycling, and in particular e-bikes, can help ease topographical
challenges in hillier areas, such as near creeks, in Pascoe Vale and
when travelling to neighbouring areas like Moonee Valley. E-bikes make
it easier for people with lower fitness levels, the elderly or physically
impaired individuals to choose cycling as a genuine form of transport.
They increase the distance that a cyclist can travel (compared to a
traditional bicycle) and make other applications for the bicycle (such as
transporting children or goods) more viable. 79
During the community engagement conducted in February and March
2018, we asked the community to consider two scenarios to understand
the level of support for a walking and cycling- friendly environment
against a car- oriented environment. Of the hundreds of Morelanders
who responded, there was strong support for improvements for
pedestrians and cyclists, even where this might decrease convenience
for car users, such as lower speeds or longer waits at intersections.
There was strong support for this scenario across both northern and
southern suburbs of Moreland, and also among car users, not just
people who only use public transport, cycling and walking. The feedback
reflected support for lower speed limits, traffic management measures,
more crossings and greater pedestrian and cyclist priority. It also
showed a preference for allocating a greater share of our road space to Figures 6 & 7: Current Mode Share, VISTA 36
wider footpaths and more bicycle lanes.
We also asked the community to consider two scenarios which tested the level of support for various levels of public transpor t
priority. Again, there was overwhelming support for giving public transport the highest priority over cars, including tram and
bus lanes, priority at traffic lights and restrictions on turning movements so cars don’t hold up public transport services. This
support was again consistent across both the north and the south of Moreland and across current drivers, passengers, cyclists
and public transport users alike.
V132700 // 25/03/19
Final // Issue: B
Moreland Integrated Transport Strategy 2019, Appendix 12Many community consultation responses sought stronger pedestrian
priority, with more road space given to pedestrian uses in activity centres,
longer crossing times and more accessible and regular crossing points.
Consultation responses suggested road closures and improved and
widened footpaths to improve access and establish a sense of place.
From a cycling perspective, safety was identified the most significant
concern, particularly in the south of Moreland. Feedback reaffirmed the
need to create a ‘low-stress’ cycling network that gets people from A-to-B
safely and conveniently. This requires an extended and integrated bicycle
network that provides access to a wide range of areas, needs and
services, improved capacity on key routes, separation from other users
(including pedestrians and dog-walkers) where possible and removal of
risks to cyclists, such as ‘dooring’ risks introduced by parked vehicles and
other obstructions in bicycle lanes. Designing a safe, low- stress
environment will enable access for more of the community to cycle,
including underrepresented groups such as women, children and the
elderly.80
Community consultation also identified that traffic rat-running and hooning
through local streets is an issue. Research undertaken on behalf of
Infrastructure Victoria found that more than two-in- five peak hour
travellers will regularly take shortcuts on local streets in response to
congestion. In addition, more than a quarter of peak hour travellers
experience congestion on local streets and ‘back streets’. 81
What is the solution?
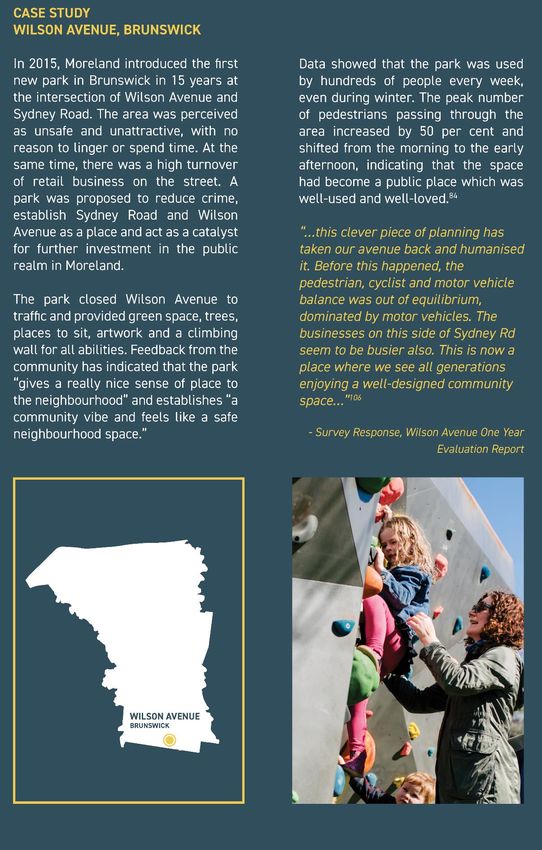
Council are open to removing car parking where it will benefit sustainable
transport or create a greater sense of place, for example by providing
widened footpaths, bicycle lanes, public transport priority or improved
streetscapes. Council will support a net loss in car parking where this
improves sustainable transport or place outcomes.
Council will also take steps to protect local streets through strategic road
closures, which reduce through-traffic volumes and rat-running. As the
case studies below demonstrate, this can improve safety outcomes and
perceptions of safety in terms of both road safety and personal safety.
V132700 // 25/03/19
Final // Issue: B
Moreland Integrated Transport Strategy 2019, Appendix 13V132700 // 25/03/19 Final // Issue: B Moreland Integrated Transport Strategy 2019, Appendix 14
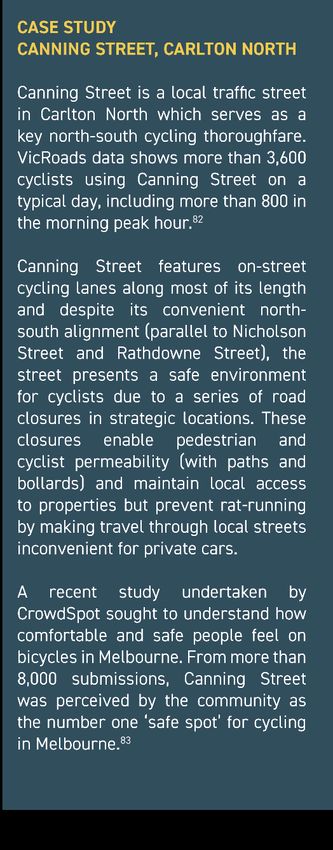
Fostering a walking and cycling environment has been shown to contribute
                                                                               Figure 8: Retail Spend Share, Yen et al. 97
to the economic prosperity of activity centres. For example, one study
of Lygon Street, Carlton found that each square metre of bicycle parking
generated five times more customer retail spending than one square
metre of car parking space. This means that if shopping strips can
attract more cyclists and fewer car drivers, it may assist in stimulating
retail activity.96 Another study in Brisbane showed that restaurateurs
overestimated (by more than double) the mode share and revenue
share of people driving to their venues, with the highest revenue share
generated by customers who walked or took public transport. 97

More broadly, the key directions in MITS are to:

     •    Reallocate space from cars and car parking to walking,
          cycling and public transport
     •    Reallocate space for greener, more pleasant streets
     •    Create more pedestrian crossings
     •    Continue to roll out 40km/h limits on all local roads
     •    Reduce speed limits on arterial roads near places like schools, hospitals and activity centres
     •    Conduct a 12-month trial of 30km/h limits in selected areas
     •    Close some local roads to through traffic

Further actions can be found in the Implementation Plan chapter of MITS.

In implementing these measures, Council will prioritise:

     •    High volume pedestrian and cyclist areas, such as activity centres, around hospitals, schools and community
          facilities
     •    Areas of high pedestrian and cyclist casualties, such as activity centres in Glenroy, Coburg and Brunswick
     •    Areas on the Principal Pedestrian Network and Strategic Cycling Corridors
     •    Key walking and cycling routes to schools
     •    Streets with strong year-on-year traffic volume growth due to rat-running
     •    Areas with a high ‘place’ function

Advocating for better public transport
What is the situation?
Public transport is one of the most effective ways to move a large number of people in a small amount of road space,
particularly over longer distances and where services are given priority. 85 Public transport services can move people more
efficiently than by car, even when co-mingled with traffic.

Melbourne’s public transport system is estimated to remove 540,000 cars from the road network in peak periods every day. 86
In Moreland, more than 70 per cent of surveyed households live within a 10-minute walk of the nearest public transport
service,87 with analysis showing areas in the north of Moreland more likely to be outside of walking distance of public transport
than the south.88

Studies show that in general, travel on a full public transport service is significantly less energy-intensive (on a per passenger
kilometre basis) than travel by private car. 89 On average, in urban Victoria, electric trains and trams are less greenhouse gas
intensive than private cars (per passenger-kilometre), while buses are, on average, more intensive.90 This could be mitigated
by the implementation of electric buses, particularly those powered by renewable energy sources. It is important to note that
public transport services are provided for a broader range of reasons, including to meet social, accessibility, equity and
agglomeration needs, rather than solely environmental or economic reasons.

                                                                       V132700 // 25/03/19
                                                                       Final // Issue: B
                                                                       Moreland Integrated Transport Strategy 2019, Appendix         15
In summary, when well-utilised, public transport modes can represent a more sustainable alternative t o private vehicle travel,
in terms of reducing emissions per passenger kilometre and also tackling congestion on our roads. However, at present,
public transport comprises almost one-in-ten of all Moreland trips and a quarter of all journeys to work – there is significant
scope for greater use of public transport in our municipality for many trips. Council will work with the state government and
transport providers to improve the public transport experience for Morelanders, with stronger network integration enabling
people to get around with smoother transfers between different modes.
“Trains through Coburg do not run frequently enough and are always too full. To go into the city, I’d rather take the tram as
while it takes longer, it’s more comfortable and accessible” – Community consultation
Bus
In Moreland, community consultation showed waiting time, travel time and inconvenience to be the biggest barriers to taking
the bus. Travel time, reliability and a lack of bus routes to desired destinations was a particular issue in the north of Moreland.
People also expressed frustration with existing bus services as a viable mode of transport, telling us that buses do not run
often enough, nor in all the hours they are needed. Many were also dissatisfied with the reliability of buses, which are often
late due to congested traffic.
Analysis shows that bus services in the north are generally infrequent, even in peak periods. Once on board, residents in the
far north (such as Fawkner and Gowanbrae) cannot travel as far on public transport in a given timeframe as those living in
the southern suburbs. 91
On weekends, the quality of public transport services deteriorates even further. Across Moreland, bus services generally run
at half-hour intervals or longer on weekends (with the exception of a handful of routes operating at 20-minute frequency),
while some areas are serviced by only one bus every hour (or longer). Many services which provide the only public transport
options in the far north of Moreland (including in Gowanbrae and parts of Glenroy and Hadfield) do not operate on Sundays,
cutting connectivity in areas where transport accessibility is already strained. In these areas, a heavy dependence on cars i s
evident – Gowanbrae has the highest car ownership in Moreland and approximately 90 per cent of residents drive to work. 91
Many east- west services in the south of Moreland are also discontinued on the weekend, creating further barriers to lateral
movement across the municipality.
“Frequency is too low to make it a primary mode of transport... during the busiest times, which is also when I would most like
to take the bus, it does not appear to run to any discernible schedule. This makes planning to take the bus impossible” –
Community consultation
Tram
VicRoads data shows that roads with trams carry more people (per lane per hour) than those without trams. 47 Tram
movements could be even more efficient with improved prioritisation or separation from general traffic. Trams which co-
mingle with car traffic have lower average travel speeds than those which are separated, with the highest average travel
speeds achieved in a ‘light-rail’ environment.92
Waiting times and travel times were also identified as challenges for tram uptake in Moreland, with trams co -mingling with
on-street traffic introducing delays and experiences of overcrowding in peak hours.
Market research for Yarra Trams shows the focus for tram improvements should revolve around travel time reliability,
accessibility to services and targeted improvements to frequency and capacity. 93
Train
Community consultation identified distinct differences in the needs and challenges for train travel in the north of Moreland,
compared to the south. In Moreland’s southern suburbs, waiting time was the most significant barr ier to travel by train,
reflective of overcrowded trains in peak periods, perceptions of service infrequency and experiences with trains skipping
stops or “short shunting” (terminating before the end of the line) when they are running late.
V132700 // 25/03/19
Final // Issue: B
Moreland Integrated Transport Strategy 2019, Appendix 16Distance to train stations was also a significant barrier for train travel in the south of Moreland, with many identifying that
trains are not within walking distance of home and did not travel where they needed to go. By comparison, waiting time and
destinations were considered less of a barrier in the north of Moreland, and safety was a much greater concern to residents
compared to the south.
“...I have also found the Upfield line to be unreliable and often there are delays or cancellations and when there is only a
train every 20 mins every delay or cancellation causes great disruption” – Community consultation
What is the solution?
Council does not have direct control over public transport in our municipality, but can advocate to relevant authorities and
agencies on behalf of the community Council is more likely to achieve state government investment and positive public
transport outcomes for the community if it focuses its advocacy efforts on a smaller number of priority outcomes and
consistently supports state government-led improvements.
The key directions in MITS are to advocate for:
• Improved frequency and span of hours for bus services, particularly in the north of Moreland and running east -
west, including that buses should run from first train and tram to last train and tram in a 24-hour period
• Improved reliability for bus, tram and train services, including supporting removal of car parking if this improves
public transport priority
• More capacity on trains and trams
• Increased frequency of night time trams and trains
• Improved accessibility to public transport services
• Better connectivity between transport modes
Further actions can be found in the Implementation Plan chapter of MITS.
Fostering partnerships for sustainable transport
What is the situation?
Emerging and Future Technology
Intelligent transport systems are likely to start re-shaping how we travel within the next decade. Vehicles themselves will start
‘talking’ to one another, and to roadside infrastructure, potentially improving safe ty for all road users, including pedestrian
and cyclists. We may begin to see the introduction of automated vehicles that may enable more people to give up owning
cars of their own. Both driverless shuttles and taxis have the potential to better support ‘f irst- and-last-mile’ travel. However,
this technology may also increase vehicle travel through increased uptake and the empty -running of vehicles.
We will also likely see continued demand for ride-sharing and the continuing introduction of ‘disruptive’ personal mobility
devices (such as motorised scooters). These modes, and other emerging technologies and trends, will open the door to
potential integrated solutions, such as mobility- as-a-service.
However, while ride-sharing services do give residents an alternative to owning cars and service users who cannot use other
modes, evidence is emerging from around the world that the operation of these services could potentially increase overall
car travel, by drawing people away from public transport, walking and cycling.94
Throughout the delivery of emerging and future technologies, Council will continue to recognise mass transit as a reliable,
sustainable and efficient way of moving large volumes of people.
Looking forward, there are many unknowns in the timing, nature, intensity, consumer response and drivers for various
emerging technologies. In many cases, the introduction and rollout will fall under the domain of other government agencies
and private entities.
V132700 // 25/03/19
Final // Issue: B
Moreland Integrated Transport Strategy 2019, Appendix 17You can also read