CENTRAL AFRICAN REPUBLIC - CLIMATE RISK COUNTRY PROFILE
←
→
Page content transcription
If your browser does not render page correctly, please read the page content below
CLIMATE RISK COUNTRY PROFILE

   CENTRAL AFRICAN
      REPUBLIC
COPYRIGHT
© 2021 by the World Bank Group
1818 H Street NW, Washington, DC 20433
Telephone: 202-473-1000; Internet: www.worldbank.org

This work is a product of the staff of the World Bank Group (WBG) and with external contributions. The opinions, findings,
interpretations, and conclusions expressed in this work are those of the authors and do not necessarily reflect the views or the
official policy or position of the WBG, its Board of Executive Directors, or the governments it represents.

The WBG does not guarantee the accuracy of the data included in this work and do not make any warranty, express or implied,
nor assume any liability or responsibility for any consequence of their use. This publication follows the WBG’s practice in
references to member designations, borders, and maps. The boundaries, colors, denominations, and other information shown
on any map in this work, or the use of the term “country” do not imply any judgment on the part of the WBG, its Boards, or the
governments it represents, concerning the legal status of any territory or geographic area or the endorsement or acceptance
of such boundaries.

The mention of any specific companies or products of manufacturers does not imply that they are endorsed or recommended
by the WBG in preference to others of a similar nature that are not mentioned.

RIGHTS AND PERMISSIONS
The material in this work is subject to copyright. Because the WBG encourages dissemination of its knowledge, this work may
be reproduced, in whole or in part, for noncommercial purposes as long as full attribution to this work is given.

Please cite the work as follows: Climate Risk Profile: Central African Republic (2021): The World Bank Group.

Any queries on rights and licenses, including subsidiary rights, should be addressed to World Bank Publications, The World Bank
Group, 1818 H Street NW, Washington, DC 20433, USA; fax: 202-522-2625; e-mail: pubrights@worldbank.org.

Cover Photos: © Flore de Preneuf / World Bank, “Timber is floated on Congo river to deport” May18, 2013 via Flickr, Creative
Commons CC BY-NC-ND 2.0. © Dominic Chavez/World Bank, “Students raise their hands to answer a question” May 20, 2013
via Flickr, Creative Commons CC BY-NC-ND 2.0.

Graphic Design: Circle Graphics, Reisterstown, MD.

CLIMATE RISK COUNTRY PROFILE: CENTRAL AFRICAN REPUBLIC                                                                        ii
ACKNOWLEDGEMENTS
This profile is part of a series of Climate Risk Country Profiles developed by the World Bank Group (WBG). The country profile
synthesizes most relevant data and information on climate change, disaster risk reduction, and adaptation actions and policies
at the country level. The country profile series are designed as a quick reference source for development practitioners to better
integrate climate resilience in development planning and policy making. . This effort is managed and led by Veronique Morin
(Senior Climate Change Specialist, WBG) and Ana E. Bucher (Senior Climate Change Specialist, WBG).

This profile was written by MacKenzie Dove (Senior Climate Change Consultant, WBG). Additional support was provided by
Jason Johnston (Operations Analyst, WBG) and Yunziyi Lang (Climate Change Analyst, WBG).

Climate and climate-related information is largely drawn from the Climate Change Knowledge Portal (CCKP), a WBG online
platform with available global climate data and analysis based on the latest Intergovernmental Panel on Climate Change (IPCC)
reports and datasets. The team is grateful for all comments and suggestions received from the sector, regional, and country
development specialists, as well as climate research scientists and institutions for their advice a

CLIMATE RISK COUNTRY PROFILE: CENTRAL AFRICAN REPUBLIC                                                                        iii
CONTENTS

FOREWORD  .  .  .  .  .  .  .  .  .  .  .  .  .  .  .  .  .  .  .  .  .  .  .  .  .  .  .  .  .  .  .  .  .  .  .  . 1

COUNTRY OVERVIEW .   .   .   .   .   .   .   .   .   .   .   .   .   .   .   .   .   .   .   .   .   .   .   .   .   .   .   .   .   .   .  2

CLIMATOLOGY  .   .   .   .   .   .   .   .   .   .   .   .   .   .   .   .   .   .   .   .   .   .   .   .   .   .   .   .   .   .   .   .   .   .   5
   Climate Baseline .  .  .  .  .  .  .  .  .  .  .  .  .  .  .  .  .  .  .  .  .  .  .  .  .  .  .  .  .  .  .  .  .  .  .  .  .  .  .  . 5
      Overview  .  .  .  .  .  .  .  .  .  .  .  .  .  .  .  .  .  .  .  .  .  .  .  .  .  .  .  .  .  .  .  .  .  .  .  .  .  .  .  .  .  . 5
      Key Trends .  .  .  .  .  .  .  .  .  .  .  .  .  .  .  .  .  .  .  .  .  .  .  .  .  .  .  .  .  .  .  .  .  .  .  .  .  .  .  .  . 7
   Climate Future .  .  .  .  .  .  .  .  .  .  .  .  .  .  .  .  .  .  .  .  .  .  .  .  .  .  .  .  .  .  .  .  .  .  .  .  .  .  .  .  . 8
      Overview  .  .  .  .  .  .  .  .  .  .  .  .  .  .  .  .  .  .  .  .  .  .  .  .  .  .  .  .  .  .  .  .  .  .  .  .  .  .  .  .  .  . 8
      Key Trends .  .  .  .  .  .  .  .  .  .  .  .  .  .  .  .  .  .  .  .  .  .  .  .  .  .  .  .  .  .  .  .  .  .  .  .  .  .  .  .  . 10

CLIMATE RELATED NATURAL HAZARDS .   .   .   .   .   .   .   .   .   .   .   .   .   .   .   .   .   .   .   .   .   . 12
   Overview .  .  .  .  .  .  .  .  .  .  .  .  .  .  .  .  .  .  .  .  .  .  .  .  .  .  .  .  .  .  .  .  .  .  .  .  .  .  .  .  .  .  . 12
   Key Trends .  .  .  .  .  .  .  .  .  .  .  .  .  .  .  .  .  .  .  .  .  .  .  .  .  .  .  .  .  .  .  .  .  .  .  .  .  .  .  .  .  . 13
   Implications for DRM .  .  .  .  .  .  .  .  .  .  .  .  .  .  .  .  .  .  .  .  .  .  .  .  .  .  .  .  .  .  .  .  .  .  .  .  .  . 15

CLIMATE CHANGE IMPACTS TO KEY SECTORS .   .   .   .   .   .   .   .   .   .   .   .   .   .   .   .   .   .   . 15
   Agriculture  .  .  .  .  .  .  .  .  .  .  .  .  .  .  .  .  .  .  .  .  .  .  .  .  .  .  .  .  .  .  .  .  .  .  .  .  .  .  .  .  .  . 16
   Water  .  .  .  .  .  .  .  .  .  .  .  .  .  .  .  .  .  .  .  .  .  .  .  .  .  .  .  .  .  .  .  .  .  .  .  .  .  .  .  .  .  .  .  . 18
   Forestry  .  .  .  .  .  .  .  .  .  .  .  .  .  .  .  .  .  .  .  .  .  .  .  .  .  .  .  .  .  .  .  .  .  .  .  .  .  .  .  .  .  .  . 21
   Energy  .  .  .  .  .  .  .  .  .  .  .  .  .  .  .  .  .  .  .  .  .  .  .  .  .  .  .  .  .  .  .  .  .  .  .  .  .  .  .  .  .  .  .  . 22
   Health .  .  .  .  .  .  .  .  .  .  .  .  .  .  .  .  .  .  .  .  .  .  .  .  .  .  .  .  .  .  .  .  .  .  .  .  .  .  .  .  .  .  .  . 24

ADAPTATION .   .   .   .   .   .   .   .   .   .   .   .   .   .   .   .   .   .   .   .   .   .   .   .   .   .   .   .   .   .   .   .   .   .   . 27
   Institutional Framework for Adaptation .  .  .  .  .  .  .  .  .  .  .  .  .  .  .  .  .  .  .  .  .  .  .  .  .  .  .  .  .                      27
   Policy Framework for Adaptation  .  .  .  .  .  .  .  .  .  .  .  .  .  .  .  .  .  .  .  .  .  .  .  .  .  .  .  .  .  .  .  .                   28
   Recommendations .  .  .  .  .  .  .  .  .  .  .  .  .  .  .  .  .  .  .  .  .  .  .  .  .  .  .  .  .  .  .  .  .  .  .  .  .  .                  28
      Research Gaps .  .  .  .  .  .  .  .  .  .  .  .  .  .  .  .  .  .  .  .  .  .  .  .  .  .  .  .  .  .  .  .  .  .  .  .  .  .  .              28
      Data and Information Gaps .  .  .  .  .  .  .  .  .  .  .  .  .  .  .  .  .  .  .  .  .  .  .  .  .  .  .  .  .  .  .  .  .                    29
      Institutional Gaps  .  .  .  .  .  .  .  .  .  .  .  .  .  .  .  .  .  .  .  .  .  .  .  .  .  .  .  .  .  .  .  .  .  .  .  .  .              29

CLIMATE RISK COUNTRY PROFILE: CENTRAL AFRICAN REPUBLIC                                                                                               iv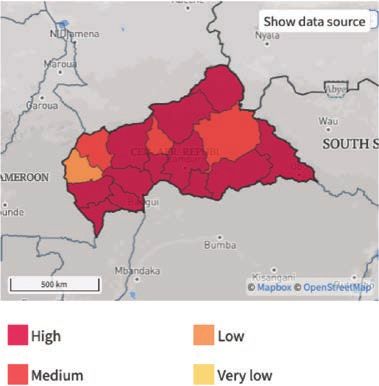
FOREWORD

Climate change is a major risk to good development outcomes, and the World Bank Group is committed to playing
an important role in helping countries integrate climate action into their core development agendas. The World
Bank Group is committed to supporting client countries to invest in and build a low-carbon, climate-resilient future,
helping them to be better prepared to adapt to current and future climate impacts.

The World Bank Group is investing in incorporating and systematically managing climate risks in development
operations through its individual corporate commitments.

A key aspect of the World Bank Group’s Action Plan on Adaptation and Resilience (2019) is to help countries
shift from addressing adaptation as an incremental cost and isolated investment to systematically incorporating
climate risks and opportunities at every phase of policy planning, investment design, implementation and evaluation
of development outcomes. For all IDA and IBRD operations, climate and disaster risk screening is one of the
mandatory corporate climate commitments. This is supported by the Bank Group’s Climate and Disaster Risk
Screening Tool which enables all Bank staff to assess short- and long-term climate and disaster risks in operations
and national or sectoral planning processes. This screening tool draws up-to-date and relevant information from
the World Bank’s Climate Change Knowledge Portal, a comprehensive online ‘one-stop shop’ for global, regional,
and country data related to climate change and development.

Recognizing the value of consistent, easy-to-use technical resources for client countries as well as to support
respective internal climate risk assessment and adaptation planning processes, the World Bank Group’s Climate
Change Group has developed this content. Standardizing and pooling expertise facilitates the World Bank Group in
conducting initial assessments of climate risks and opportunities across sectors within a country, within institutional
portfolios across regions, and acts as a global resource for development practitioners.

For developing countries, the climate risk profiles are intended to serve as public goods to facilitate upstream
country diagnostics, policy dialogue, and strategic planning by providing comprehensive overviews of trends
and projected changes in key climate parameters, sector-specific implications, relevant policies and programs,
adaptation priorities and opportunities for further actions.

It is my hope that these efforts will spur deepening of long-term risk management in developing countries and our
engagement in supporting climate change adaptation planning at operational levels.

Bernice Van Bronkhorst
Global Director
Climate Change Group (CCG)
The World Bank Group (WBG)

CLIMATE RISK COUNTRY PROFILE: CENTRAL AFRICAN REPUBLIC                                                               1
COUNTRY OVERVIEW

T
        he Central African Republic, herein CAR, is a landlocked country in Central Africa, located between 2° and
        11° latitude north, and 13° and 27° longitude east. It has a total land area of 623,000 km2 and shares
        borders to the north with Chad, to the northeast with Sudan, to the east with South Sudan, in the south by the
Congo and Democratic Republic of Congo, and to the west with Cameroon.1 The country’s terrain consists of a vast
peneplain dominated by two mountain ranges at the eastern and western ends. These are joined by a central ‘spine’,
which separates the two principal drainage sources for the country: the Chari-Longue Basin in the north, and Congo
Basin in the south. Due to the country’s location,
CAR has a relatively favorable climate conditions,
that are primarily hot and humid, characterized by          FIGURE 1.  Elevation of Central African Republic5
a dry and rainy season. CAR has a high degree of
biological diversity and is composed of five large
phytogeographic zones, each characterized by a
specific fauna: the Guinean forest zone of dense
humid forests in the south; the Sudano-Ubangian
zone, sheltering dense semi-humid, as well as open
and dry forests; the Sudano-Guinean and Sudano-
Sahelian zones, composed of various types of
savannahs; and the Sahelian zone, consisting of
steppes in the north (Figure 1).2 The country is
endowed with rich agricultural lands and enormous
natural resources, such as wood, gold, and diamonds,
the exploitation of which remains rudimentary and
artisanal,3 however intense poverty, conflict, and a
stagnated economy has resulted in CAR ranked
188 out of 189 countries on the UNDP’s Human
Development Index (2019).4

CAR is a least-developed country and one of the poorest countries in the world and continues to be impacted by
its long history of conflict, poor governance, weak institutions. It is still recovering from the latest series of conflicts
that broke out in 2013. The country held its first democratic elections in 1993 with the accession of Ange Félix
Patassé and the establishment of the country’s new National Assembly. However, the country continues to be
plagues by violence, conflict and internal displacement. At the time of writing, it is estimated that, there are currently
over 729,000 internally displaced persons in the Central African Republic6 and 575,000 refugees in neighboring

1
    UNDP (2019). Central African Republic — Climate Change Adaptation Overview. URL: https://www.adaptation-undp.org/explore/
    middle-africa/central-african-republic
2
    Central African Republic (2016). Nationally-Determined Contributions. URL: https://www4.unfccc.int/sites/ndcstaging/
    PublishedDocuments/Central%20African%20Republic%20First/INDC_R%C3%A9publique%20Centrafricaine_EN.pdf
3
    UNDP (2019). Central African Republic — Climate Change Adaptation Overview. URL: https://www.adaptation-undp.org/explore/
    middle-africa/central-african-republic
4
    UNDP (2020). Human Development Reports — Human Development Index. URL: http://hdr.undp.org/en/data
5
    World Bank (2019). Internal Climate Migration Profile — CAR.
6
    UNHCR (20201). Operational Porta — Central African Republic Regional Response. Data accessed May 2021. URL: https://www.
    worldbank.org/en/country/centralafricanrepublic/overview

CLIMATE RISK COUNTRY PROFILE: CENTRAL AFRICAN REPUBLIC                                                                          2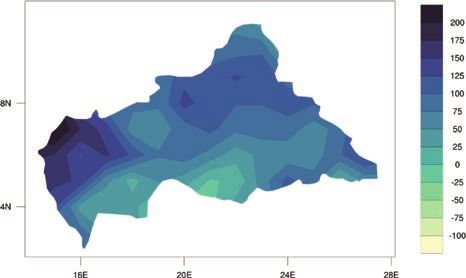
countries. Conflict and political instability continue to undermine the country’s development agenda. On February 6,
2019, the Government of the Central African Republic signed an African Union-mediated peace agreement with
14 armed groups.7

CAR has a population of just over 4.7 million people (2019) with an annual population growth rate of 1.7%.8 The
country has a Gross Domestic Product (GDP) of $2.2 billion (2019) and a current annual growth rate of 3.0%
(2019) (Table 1).9 Approximately 41.4% of the population currently lives in urban areas. This is projected to increase
to 48% and 60% of the population by 2030 and 2050, respectively.10 Despite its relatively recent positive growth,
poverty remains pervasive and elevated and as of 2019 it is estimated that approximately 71% of the population
lives below the extreme poverty rate (
The ND-GAIN Index14 ranks 181 countries using
a score which calculates a country’s vulnerability to                  FIGURE 2.  ND-GAIN Index for the Central
climate change and other global challenges as well                     African Republic
as their readiness to improve resilience. This Index                          37

aims to help businesses and the public sector better
                                                                              35
identify vulnerability and readiness in order to better
prioritize investment for more efficient responses to                         33

global challenges. Due to a combination of political,

                                                                      Score
                                                                              31
geographic, and social factors, Central African
                                                                              29
Republic is recognized as highly vulnerable to climate
change impacts, ranked 180 out of 181 countries                               27

in the 2020 ND-GAIN Index. The more vulnerable a
                                                                              25
country is the lower their score, while the more ready                             1995   1998     2001    2004   2007   2010   2013   2016
                                                                                      Central African Republic
a country is to improve its resilience the higher it will
be. Norway has the highest score and is ranked 1st.
Figure 2 is a time-series plot of the ND-GAIN Index
showing the CAR’s progress over time.

The CAR submitted its Nationally-Determined Contribution to the UNFCCC in 2016 and its Second National
Communication to the UNFCCC (2015), which outlines the country’s vision in building an economy that is diversified
and sustainable, which also adheres to the country’s needs to protect its environmental resources. It is focused
on a low-carbon development approach to build and diversify the country’s economy, committed to technological
innovation. Key adaptation priorities include the country’s agricultural, forestry, livestock, land use planning, energy
security, water resources management, and public health sectors.15

Green, Inclusive and Resilient Recovery
The coronavirus disease (COVID-19) pandemic has led to unprecedented adverse social and economic impacts.
Further, the pandemic has demonstrated the compounding impacts of adding yet another shock on top of
the multiple challenges that vulnerable populations already face in day-to-day life, with the potential to create
devastating health, social, economic and environmental crises that can leave a deep, long-lasting mark. However,
as governments take urgent action and lay the foundations for their financial, economic, and social recovery, they
have a unique opportunity to create economies that are more sustainable, inclusive and resilient. Short and long-
term recovery efforts should prioritize investments that boost jobs and economic activity; have positive impacts on
human, social and natural capital; protect biodiversity and ecosystems services; boost resilience; and advance the
decarbonization of economies.

14
     University of Notre Dame (2020). Notre Dame Global Adaptation Initiative. URL: https://gain.nd.edu/our-work/country-index/
15
     Central African Republic (2016). Nationally-Determined Contributions. URL: https://www4.unfccc.int/sites/ndcstaging/
     PublishedDocuments/Central%20African%20Republic%20First/INDC_R%C3%A9publique%20Centrafricaine_EN.pdf

CLIMATE RISK COUNTRY PROFILE: CENTRAL AFRICAN REPUBLIC                                                                                        4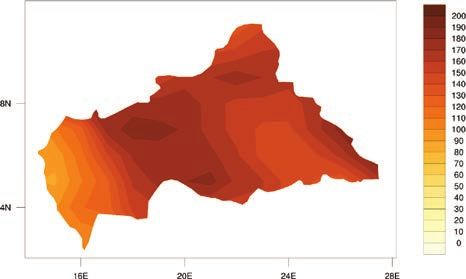
CLIMATOLOGY

Climate Baseline
Overview
CAR has a tropical, humid equatorial climate in the south and a Sahelo-Sudanian climate in the north. The country
experiences hot, dry winters and mild to hot, wet summers (June to August). Only the northernmost part of the
country, near the borders to Chad and Sudan, have a hot semi-arid climate. CAR is a relatively homogenous territory,
which receives abundant rainfall. Across the country, annual average temperatures range from 23°C in the south to
26°C in the north. The country’s altitude does play a role in temperature variation. Highest temperatures are typically
observed in march and the lowest in July during the rainy season.16 Two high pressure zones are responsible for
the alternation between rainy and dry seasons in CAR. In winter (December to March) the Libyan anticyclone in
the north brings dry air to the country together with the north-east wind (Harmattan). In the northern summer, the
St. Helena high pressure zone pushes moist air from south-west to north-east across the country, bringing
decreasing amounts of rainfall towards the north-east. The dry season is typically from November to February but
is longer in the north, and with little to no rainfall from October to April. The rainy season varies in length from over
300 days in the south to about 125 days in the north-east.17

CAR has five main regions, with differing climate characteristics. The Guinean forest zone is characterized in the
western band, with nine months of rainy season and one dry season. In its eastern band total precipitation is almost
everywhere higher than 1,600 mm. This area has the area of largest forest coverage. The Sudano-Ubangian zone
occupies a narrow band between Bossembélé and Baboua and a small section of Bambari and Yalinga. The area
has semi-humid forests with less coverage. The Sudano-Guinean zone is dominated by savannas and a noticeable
deterioration of the rainy season. The Sudano-Sahelian zone extends from Paoua to Ouadda-Djallé, is characterized
by relative humidity and more annual sunshine. It is dominated by the country’s savanna. And the Sahel zone centers
around Birao and is experiences longer dry seasons than rainy seasons, with rainfall less than 700 mm per year.18
Climate variability and longer-term change are likely to exacerbate the country’s existing vulnerabilities of high
poverty rates, food insecurity, political instability and conflict. Food security is of primary concern as the majority of
the country’s agriculture is rain-fed and produced by small-holder farmers.19

16
     Ministry of Environment, Ecology and Sustainable Development (2015). Second National Communication to the UNFCCC — Central
     African Republic. URL: https://unfccc.int/sites/default/files/resource/cafnc2.pdf
17
     GERICS (2015). Climate-Fact-Sheet, Central African Republic.
18
     Ministry of Environment, Ecology and Sustainable Development (2015). Second National Communication to the UNFCCC — Central
     African Republic. URL: https://unfccc.int/sites/default/files/resource/cafnc2.pdf
19
     Central African Republic (2016). Nationally-Determined Contributions. URL: https://www4.unfccc.int/sites/ndcstaging/
     PublishedDocuments/Central%20African%20Republic%20First/INDC_R%C3%A9publique%20Centrafricaine_EN.pdf

CLIMATE RISK COUNTRY PROFILE: CENTRAL AFRICAN REPUBLIC                                                                       5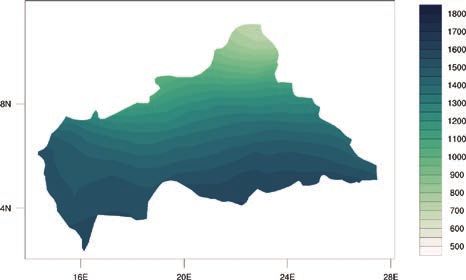
Analysis of data from the World Bank Group’s Climate Change Knowledge Portal (CCKP) (Table 2) shows historical
 information for 1901–2020. Mean annual temperature for CAR is 25.1°C, with average monthly temperatures
 ranging between 27 (August). Mean annual precipitation is 1,369.6 mm. Most significant rainfall is experienced in
 the country from May to October as shown in the seasonal cycle for the country’s latest climatology, 1991–2020
 (Figure 3).20 Figure 4 shows the spatial variation of observed average annual precipitation and temperature
 across CAR.

 TABLE 2.  Data snapshot: Summary statistics

        Climate Variables                                                               1901–2020
        Mean Annual Temperature (°C)                                                         25.1°C
        Mean Annual Precipitation (mm)                                                  1396.6 mm
        Mean Maximum Annual Temperature (°C)                                                 31.6°C
        Mean Minimum Annual Temperature (°C)                                                 18.6°C

 FIGURE 3.  Average monthly temperature and rainfall for CAR, 1991–202021
                    30                                                                                300
Temperature (°C)

                    27                                                                                200
                                                                                                            Rainfall (mm)

                    24                                                                                100

                    21                                                                                0
                         Jan   Feb   Mar    Apr   May    Jun   Jul   Aug   Sep   Oct   Nov     Dec

                                                  Rainfall      Temperature

 20
                   WBG Climate Change Knowledge Portal (CCKP, 2021). CAR. URL: https://climateknowledgeportal.worldbank.org/country/
                   central-african-republic/climate-data-historical
 21
                   WBG Climate Change Knowledge Portal (CCKP, 2021). CAR. URL: https://climateknowledgeportal.worldbank.org/country/
                   central-african-republic

 CLIMATE RISK COUNTRY PROFILE: CENTRAL AFRICAN REPUBLIC                                                                                6
FIGURE 4. Map of average annual temperature (°C) (left); annual precipitation (mm) (right) of CAR
for 1991–202022
Key Trends
Temperature
Since the 1970s, mean annual temperature has significantly increased at a rate of 0.35°C per decade (Figure 5).
In the south-western areas of the country, significant increase in maximum temperature has been observed since
the 1950s.23 Between 1955 and 2006, warming trends were observed across the central regions. Very hot days
were observed to have increased by 0.25°C per decade with very hot nights increasing by 0.21°C per decade.24
FIGURE 5. Observed temperature for Central African Republic, 1901–202025
26
Temperature (°C)
25.5
25
24.5
24
1901 1911 1921 1931 1941 1951 1961 1971 1981 1991 2001 2011 2020
Annual mean Smoothed
22
WBG Climate Change Knowledge Portal (CCKP, 2021). CAR, Historical Climate. URL: https://climateknowledgeportal.worldbank.org/
country/central-african-republic/climate-data-historical
23
GERICS (2015). Climate-Fact-Sheet, Central African Republic.
24
Sonwa, D. et al. (2014). Climate Change and Adaptation in Central Africa: Past, Scenarios and Options for the Future. URL: https://
www.researchgate.net/publication/268871188_Climate_change_and_Adaptation_in_Central_Africa_Past_Scenarios_and_Options_
for_the_Future
25
WB Climate Change Knowledge Portal (CCKP, 2021). Central African Republic URL: https://climateknowledgeportal.worldbank.org/
country/central-african-republic/climate-data-historical
CLIMATE RISK COUNTRY PROFILE: CENTRAL AFRICAN REPUBLIC 7Precipitation
CAR’s precipitation regime is variable and while over the last century, there has been no substantial observed
increase in precipitation trends, however over the last 30 years precipitation has been observed to have increased
approximately 8%.26 Reduction in the number of consecutive days with 1 mm of precipitation has decreased and
the number of days with precipitation of 10 mm has increased. This indicates not only an increase in precipitation
received, but an increase of rainfall received through intense and extreme rainfall events.27 Multiple significant flood
events have occurred in CAR over the past decade and while many go unreported, the most commonly reported
flood events occur around the capital city of Bangui. Heavy, near continuous rains in August — September of 2012,
affected nearly 14,000 people and destroyed property and infrastructure and farmland in five localities surrounding
Bangui and Begoua.28 2017 flooding destroyed homes and infrastructure in Kouango (415 km form Bangui) and
destroyed over 350 houses, affecting mover 1,750 people.29 Most recent flooding occurred in August 2019 near
the city of Paoua and Poumadji village causing significant material and human damage. Perhaps most impactful is
the destruction of water and sanitation infrastructure resulting in the damage or complete destruction of 94 water
wells and 107 latrines.30
Climate Future
Overview
The main data source for the World Bank Group’s CCKP is the CMIP5 (Coupled Inter-comparison Project
Phase5) data ensemble, which builds the database for the global climate change projections presented in the
Fifth Assessment Report (AR5) of the Intergovernmental Panel on Climate Change (IPCC). Four Representative
Concentration Pathways (i.e. RCP2.6, RCP4.5, RCP6.0, and RCP8.5) were selected and defined by their total
radiative forcing (cumulative measure of GHG emissions from all sources) pathway and level by 2100. The RCP2.6
for example represents a very strong mitigation scenario, whereas the RCP8.5 assumes business-as-usual scenario.
For more information, please refer to the RCP Database. For simplification, these scenarios are referred to as a
low (RCP2.6); a medium (RCP4.5) and a high (RCP8.5) emission scenario in this profile. Table 3 provides CMIP5
projections for essential climate variables under high emission scenario (RCP 8.5) over 4 different time horizons.
Figure 6 presents the multi-model (CMIP5) ensemble of 32 Global Circulation Models (GCMs) showing the
projected changes in annual precipitation and temperature for the periods 2040–2059 and 2080–2099.
26
GERICS (2015). Climate-Fact-Sheet, Central African Republic.
27
Sonwa, D. et al. (2014). Climate Change and Adaptation in Central Africa: Past, Scenarios and Options for the Future. URL: https://
www.researchgate.net/publication/268871188_Climate_change_and_Adaptation_in_Central_Africa_Past_Scenarios_and_Options_
for_the_Future
28
UNHCR (2020). UNHCR assisting displaced families affected by floods in the Sahel. [24 September, 2020]. URL: https://www.
unhcr.org/en-us/news/press/2020/9/5f6b79f44/unhcr-assisting-displaced-families-affected-floods-sahel.html
29
OCHA Services (2019). Humanitarian Response — Central African Republic. URL: https://www.humanitarianresponse.info/ru/
disaster/fl-2017-000134-caf
30
IFRC (2019). Emergency Plan of Action — Central African Republic: Floods in Paoua. URL: https://reliefweb.int/sites/reliefweb.int/
files/resources/CAR_2.pdf
CLIMATE RISK COUNTRY PROFILE: CENTRAL AFRICAN REPUBLIC 8TABLE 3. Data snapshot: CMIP5 ensemble projection
Cmip5 Ensemble Projection 2020–2039 2040–2059 2060–2079 2080–2099
Annual Temperature Anomaly (°C) +0.7 to +1.5 +1.4 to +2.7 +2.3 to +4.2 +3.1 to +5.7
(+1.1°C) (+1.9°C) (+2.8°C) (+3.8°C)
Annual Precipitation Anomaly (mm) -18.4 to +21.9 -21.0 to +29.6 -21.5 to +38.5 -28.2 to +50.4
(0.8 mm) (1.7 mm) (5.5 mm) (6.6 mm)
Note: The table shows CMIP5 ensemble projection under RCP8.5. Bold value is the range (10th–90th Percentile) and values in parentheses
show the median (or 50th Percentile).
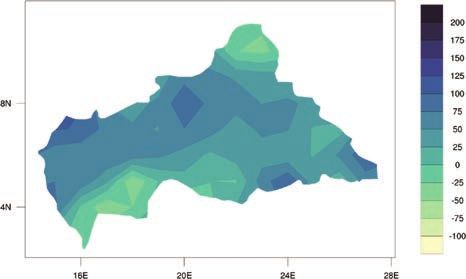
FIGURE 6. Multi-model (CMIP5) ensemble projected changes (32 GCMs) in annual temperature
(top) and precipitation (bottom)by 2040–2059 (left) and by 2080–2099 (right), relative to
1986–2005 baseline under RCP8.531
31
WBG Climate Change Knowledge Portal (CCKP, 2021). Central African Republic Projected Future Climate. URL: https://climatedata.
worldbank.org/CRMePortal/web/agriculture/crops-and-land-management?country=CAF&period=2080-2099
CLIMATE RISK COUNTRY PROFILE: CENTRAL AFRICAN REPUBLIC 9Key Trends
Temperature
Temperatures across CAR are expected to increase and projections show a change in annual mean temperature
from 3.1°C to 5.7°C by end of the century. An increase in the number of hot days, extreme temperatures are
projected as well as a strong increase in the duration of heat waves; a significant decrease in cold spell length is
projected.32 The projected change in the duration of long-lasting heat waves is expected to be an additional 7 to
81 days by 2085, with cold spells likely to decrease by 1 to as much as 13 days.33
Across all emission scenarios, temperature increase for CAR are projected throughout the end of the century.
As seen in Figure 7, under a high-emission scenario, average temperatures are expected to increase rapidly by
mid-century. An increase is also expected for the change in the number of hot days (Tmax >35°C), and the change
in number of days across the seasonal cycle. The most significant increase in the number of hot days (Figure 8)
are expected to come in the late summer and fall, a time coinciding with rainfall and planting seasons for much of
the country. Increased heat and extreme heat conditions will result in significant implications for human and animal
health, agriculture, and ecosystems. The increasing number of hot days (Tmax >35°C) are expected to be most
pronounced in the northern and central regions of the country (Figure 9).
FIGURE 7. Historical and projected average FIGURE 8. Projected Change in hot day
temperature for CAR from 1986 to 2099 (Tmax >35°C) (RCP8.5, Reference Period,
(Reference Period, 1986–2005)34 1986–2005)35
31 30
30 25
29
20
Temperature (°C)
28
Days
15
27
10
26
25 5
24 0
1980 2000 2020 2040 2060 2080 2100 Jan Feb Mar Apr May Jun Jul Aug Sep Oct Nov Dec
Year
Historical RCP 2.6 RCP 4.5 RCP 6.0 RCP 8.5
32
Dosio, A. (2016). Projection of temperature and heat waves for Africa with an ensemble of CORDEX Regional Climate Models.
Climate Dynamics. 49. pp. 493–519. URL: https://link.springer.com/article/10.1007/s00382-016-3355-5
33
GERICS (2015). Climate-Fact-Sheet, Central African Republic.
34
WBG Climate Change Knowledge Portal (CCKP, 2021). CAR Agriculture Dashboard. URL: https://climatedata.worldbank.org/
CRMePortal/web/agriculture/crops-and-land-management?country=CAF&period=2080-2099
35
WBG Climate Change Knowledge Portal (CCKP, 2021). CAR Climate Data — Projections. URL: https://climateknowledgeportal.
worldbank.org/country/central-african-republic/climate-data-projections
CLIMATE RISK COUNTRY PROFILE: CENTRAL AFRICAN REPUBLIC 10FIGURE 9. Projected change in the number of hot days (Tmax >35°C) in CAR for the period
2040–2059 and 2080–2099, against the baseline 1986–2005, under RCP8.536
Precipitation
Meteorological observations and meteorological station networks across CAR are scarce, providing limited information
and making projections on future rainfall levels more difficult. However, it is generally understood that although
annual total precipitation amounts for CAR are not likely to change dramatically, however rainfall is projected to
become substantially more variable and with a likely increase in frequency and intensity of extreme rainfall events.
The country’s drought risk will decrease.37 This is expected to significantly impact agriculture, water, energy, forestry,
and health sectors, as well as agricultural land and freshwater resources and ecosystems.38
While precipitation trends in CAR are highly variable, mean annual rainfall is expected increase across the country
throughout the end of the century. More rainfall amounts are expected to be received through these intense and
more frequent rainfall events. According to analysis from the German Climate Service Center (GERICS) of 32 Global
Climate Models (GCMs), rainfall is expected to increase by 12% to as much as 19% by the end of the century.
However, the projected change in precipitation throughout the year does not have a clear trend. Only for the dry
months of November and December is a distinct increase tendency shown. There is also a likely increase in the
intensity of heavy rain events, which are also likely to lead to increased flood events.39 Heavy precipitation events
are expected to coincide with an additional occurrence of extreme rainfall and extreme events with flooding are
36
WBG Climate Change Knowledge Portal (CCKP, 2021). CAR Climate Data — Projections. URL: https://climateknowledgeportal.
worldbank.org/country/central-african-republic/climate-data-projections
37
Ahmadalipour, A. et al. (2019). Future drought risk in Africa: Integrating vulnerability, climate change, and population growth.
Science of the Total Environment. 662. pp. 672–686. DOI: https://doi.org/10.1016/j.scitotenv.2019.01.278
38
Serge, S.B. et al. (2017). Impacts of Climate change in Central African Republic. Journal of Science and Engineering Technology. 5,
pp. 52–63. E-ISSN: 2311-8741/17
39
GERICS (2015). Climate-Fact-Sheet, Central African Republic.
CLIMATE RISK COUNTRY PROFILE: CENTRAL AFRICAN REPUBLIC 11expected to impact rivers and surface water runoff
during the summer rainy seasons. Natural disasters FIGURE 10. Annual average precipitation
due to the increase in the frequency and intensity of in CAR for 1986 to 2099 (Reference Period,
floods and droughts are also expected to increase. The 1986–2005)41
Figure 10 shows the projected average precipitation 2200
in CAR across all emission scenarios, through the end 2000
of the century. Water routing and storage and other
Precipitation (mm)
1800
management options, are often very different if the
1600
precipitation input comes as many weak or a series of
1400
heavy rainfall events.40 While precipitation is expected
to increase across all scenarios, under the highest 1200
emissions scenario, RCP8.5, precipitation rates are 1000
1980 2000 2020 2040 2060 2080 2100
projected to increase, but at a slower rate than lower Year
Historical RCP 2.6 RCP 4.5 RCP 6.0 RCP 8.5
emission scenarios.
CLIMATE RELATED NATURAL HAZARDS
Overview
The Central African Republic is at risk to numerous natural hazards, which are dominated by floods, wildfires and
droughts. Vulnerability to these hazards is exacerbated in the country by poverty and political insecurity. This has
also heightened the country’s vulnerability and ability to recover from natural disasters. Excess rainfall is expected
to be strongest felt in the central and southern areas of the country.42 Heavy rainfall is also expected to result in
flooding, causing riverbank erosion and/or overflows, landslides and waterlogging of agricultural fields leading
to likely crop failures. Recent disasters from floods in the southwest areas surrounding the urban areas of the
capital city Bangui left over 14,500 people homeless in 2009 and is estimated to have cost $6 million, with losses
estimated at $2.6 million.
Increased food insecurity is also of specific concern following disasters which result in land and infrastructure
degradation due to erosion, direct crop failure due to floods and heavy rains, and possible nutrient leaching and
fungal growth due to increased humidity.43 Water availability will be affected by possible periods of drought in
40
Balogun, R. A. et al. (2019). Intra-seasonal and seasonal variability of convective properties of monsoon precipitation systems over
West and Central Africa. Theoretical and Applied Climatology. 137. pp. 1715–1728. URL: https://link.springer.com/article/10.1007/
s00704-018-2692-1
41
WBG Climate Change Knowledge Portal (CCKP, 2021). CAR Water Dashboard. URL: https://climateknowledgeportal.worldbank.org/
country/central-african-republic/climate-sector-water
42
UNHCR (2020). UNHCR assisting displaced families affected by floods in the Sahel. [24 September, 2020]. URL: https://www.unhcr.org/
en-us/news/press/2020/9/5f6b79f44/unhcr-assisting-displaced-families-affected-floods-sahel.html
43
GFDRR (2019). Central African Republic — Floods. URL: https://www.gfdrr.org/en/central-african-republic-2009-subsequent-
floods-bangui-which-left-14500-people-homeless-gfdrr
CLIMATE RISK COUNTRY PROFILE: CENTRAL AFRICAN REPUBLIC 12southern zones, but no serious water stress is expected for agriculture. While the country is focused on increasing
infrastructure for water access, increasing population density combined with erratic rainfall does make these efforts
at wider coverage more challenging.44
Data from the Emergency Event Database: EM-Dat,45 presented in Table 4, shows the country has endured various
natural hazards, including floods, landslides, wildfires, and storms.
TABLE 4. Natural Disasters in CAR, 1900–2020
Natural Hazard Events Total Total Damage
1900–2020 Subtype Count Deaths Total Affected (’000 USD)
Drought Drought 1 0 0 0
Bacterial Disease 7 607 3,580 0
Epidemic
Viral Disease 4 307 2,609 0
Flash Flood 3 3 15,873 0
Flood
Riverine Flood 6 6 77,990 0
Storm Convective Storm 8 5 32,246 0
Wildfire Forest Fire 2 1 835 0
Key Trends
Climate change trends in CAR are expected to increase the risk and intensity of flooding, increase the amount of
heavy rainfall received during heavy rainfall events as well as increase the likelihood of aridity water scarcity for
some areas, particularly the country’s northeast zones. Increased incidence of extreme rainfall may also result in soil
erosion and water logging of crops, thus decreasing yields and increasing food insecurity. Increases in temperature
is also likely to increase the periods of extreme heat in northern areas. Importantly, higher temperatures and aridity
threatens to reduce water storage capacities. This may result in significant economic losses, damage to agricultural
lands and infrastructure as well as human casualties.46 Land degradation and soil erosion, exacerbated by recurrent
flood adversely impacts agricultural production, disproportionately affecting the livelihoods of the rural poor. The
country’s underpinning political instability and poverty will further exacerbate these issues with potential to also
exacerbate potential for violence and conflict.47
Climate change, deforestation, watershed degradation, land use, urbanization and poor management of settlements,
and slash and burn agricultural techniques have exacerbated issues and impacts from flooding and droughts and
increased the risk of wildfires. Heavy rainfall can also trigger riverine and flash floods. Heavy rainfall and flash floods
44
World Bank (2011). Water Supply and Sanitation in Central African Republic — Turning finance into services for 2015 and beyond.
URL: https://openknowledge.worldbank.org/bitstream/handle/10986/17754/7240900REPLACE0box00PUBLIC00CSO0CAR.
pdf?sequence=1&isAllowed=y
45
EM-DAT: The Emergency Events Database — Universite catholique de Louvain (UCL) — CRED, D. Guha-Sapir, Brussels, Belgium.
URL: http://emdat.be/emdat_db/
46
Serge, S.B. et al. (2017). Impacts of Climate change in Central African Republic. Journal of Science and Engineering Technology. 5,
pp. 52–63. E-ISSN: 2311-8741/17
47
IFRC (2019). Central African Republic. URL: https://www.ifrc.org/what-we-do/disaster-management/responding/ongoing-operations/
central-african-republic/
CLIMATE RISK COUNTRY PROFILE: CENTRAL AFRICAN REPUBLIC 13are common in the country’s mountain areas and can also trigger landslides and mudslides.48 Additionally, in CAR
water stress during the traditional dry periods (November-February) may be further exacerbated with competing
demands from household consumption and agriculture. Infrastructure projects are being developed to enable the
construction of dams and irrigation networks. Increased heat will further strain existing water resources and impacts
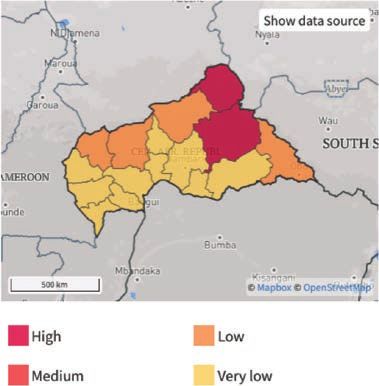
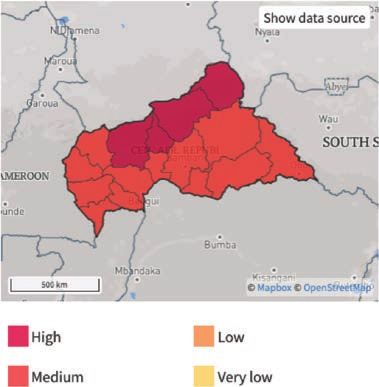
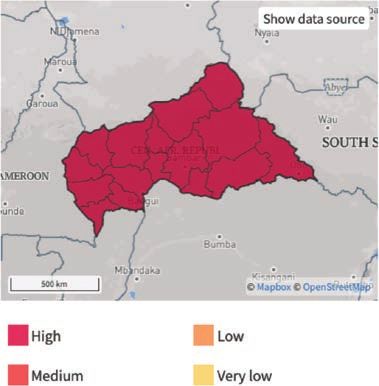
from changing rainfall patterns.49 Figure 11 below shows different risk ratings from river flooding, water scarcity,
extreme heat, and wildfires respectively.
FIGURE 11. Risk of river flood (top left); risk of water scarcity (top right);50
risk of extreme heat (bottom left); risk of wildfires (bottom right)51
48
Ngulmalet, C.R. (2018). Comparison of community-based adaptation strategies for droughts and floods in Kenya and the Central
African Republic. Water International. 43(2). pp. 183–204. URL: https://www.tandfonline.com/doi/full/10.1080/02508060.2017.1393713
49
World Bank (2011). Water Supply and Sanitation in Central African Republic — Turning finance into services for 2015 and beyond.
URL: https://openknowledge.worldbank.org/bitstream/handle/10986/17754/7240900REPLACE0box00PUBLIC00CSO0CAR.
pdf?sequence=1&isAllowed=y
50
ThinkHazard! (2020). CAR Water Scarcity. URL: http://thinkhazard.org/en/report/49-central-african-republic/DG
51
ThinkHazard! (2020). CAR Wildfires. URL: http://thinkhazard.org/en/report/49-central-african-republic/WF
CLIMATE RISK COUNTRY PROFILE: CENTRAL AFRICAN REPUBLIC 14Implications for DRM
The government of the Central African Republic does not have a specific disaster risk management entity wholly
responsible for disaster preparedness, response and recovery. Following the 2009 Bangui floods, the government
established a team across different government departments under the leadership of the Ministry of Planning,
Economy and International Cooperation. CAR has also partnered with the World Bank and received resources from
the Global Facility for Disaster Reduction and Recovery (GFDRR) which has helped to develop and conduct risk
assessments and institutional capacity building efforts to improve the country’s ability to prepare for and respond
to natural disasters, especially floods. A primary element of this work is the implementation of short- and medium-
term flood mitigation programs which combines community education measures with infrastructure works and
public management reforms across key urban areas.52 CAR would also greatly benefit from the improved quality
of hydro-meteorological services through the expansion of observation and forecasting infrastructure, which can
increase the accuracy and quality of forecasted natural disaster events.53 As part of the country’s adaptation efforts,
CAR has committed to integrating climate change related activities into development plans and strategies, including
its disaster risk management efforts. To increase its capacity to prepare for and respond to natural disasters, the
country has committed to implementing a national early warning program, flood and drought management programs,
riverbank development projects and a national investment program for agriculture to improve the country’s food
security situation, especially after disaster events.54
CLIMATE CHANGE IMPACTS TO KEY SECTORS
T
he CAR is highly vulnerable to seasonal variability and long-term climate change. Increasing vulnerability
is expected to result in cumulative impacts across the country’s political, security, social, economic, and
environmental structures. Heavy rainfall and floods in particular are likely to have significant consequences
on the environment, society, food security situation, and the wider economy. Significant impacts are expected
for the country’s water resources, agriculture, health, and forestry sectors. Extreme heat, flooding, increased
aridity, and soil erosion puts both urban and rural communities at risk, particularly for poor and vulnerable groups.
Environmental degradation, impacted water resources, and loss of biodiversity and ecosystem services constitute
serious obstacles to the country’s continued development and responsible management of its natural resources.
In addition, the increase in temperature will also have a negative impact on key parts of the economy, e.g. forestry,
agriculture and livestock. Changes in precipitation parameters can have far-reaching consequences for ecosystems
and biodiversity, food production, the water industry and rivers.55
52
GFDRR (2019). Central African Republic. URL: https://www.gfdrr.org/en/central-african-republic-2009-subsequent-floods-bangui-
which-left-14500-people-homeless-gfdrr
53
Ngulmalet, C.R. (2018). Comparison of community-based adaptation strategies for droughts and floods in Kenya and the Central
African Republic. Water International. 43(2). pp. 183–204. URL: https://www.tandfonline.com/doi/full/10.1080/02508060.2017.1393713
54
Central African Republic (2016). Nationally-Determined Contributions. URL: https://www4.unfccc.int/sites/ndcstaging/
PublishedDocuments/Central%20African%20Republic%20First/INDC_R%C3%A9publique%20Centrafricaine_EN.pdf
55
World Bank (2013). Deforestation Trends in the Congo Basin — Reconciling Economic Growth and Forest Protection. URL: https://
openknowledge.worldbank.org/bitstream/handle/10986/12477/9780821397428.pdf?sequence=1&isAllowed=y
CLIMATE RISK COUNTRY PROFILE: CENTRAL AFRICAN REPUBLIC 15Projected trends of climate variability and longer-term change are likely to exacerbate these concerns, as the
majority of agricultural production is rainfed, and provides livelihoods for the majority of the population.56 Increased
temperatures and variable rainfall will also impact the country’s forests, also critical to livelihoods and ecosystem
services, which are already under threat from land use change and growing demand for charcoal and tropical forest
products. More extreme weather events such as intense rainfall after prolonged dry spells can lead to erosion and
flash flooding, damage roads and infrastructure, wipe out crops and put additional lives at risk.57
Gender
An increasing body of research has shown that climate-related disasters have impacted human populations in many
areas including agricultural production, food security, water management and public health. The level of impacts
and coping strategies of populations depends heavily on their socio-economic status, socio-cultural norms, access
to resources, poverty as well as gender. Research has also provided more evidence that the effects are not gender
neutral, as women and children are among the highest risk groups. Key factors that account for the differences
between women’s and men’s vulnerability to climate change risks include: gender-based differences in time use;
access to assets and credit, treatment by formal institutions, which can constrain women’s opportunities, limited
access to policy discussions and decision making, and a lack of sex-disaggregated data for policy change.58
Agriculture
Overview
The agricultural sector is critical to CAR’s economy and food security situation and is considered to be one of the
most vulnerable sectors to projected climate change trends. The agricultural sector accounts for employment of
approximately 72% of the country’s population and is the primary source of income and food sourcing for most
people. Agricultural activities are mainly rainfed and subsistence, combining farming, hunting/gathering/fishing
and small animal husbandry. Crop production varies by region, with beans, maize and cassava considered major
staples.59 Of the approximately 15 million hectares of suitable agricultural land in the country, only an estimated
7,000 km2 are cultivated each year. The pastoral area of 160,000 km2 is recognized to be significantly underutilized.
The country’s primary agriculture zone is concentrated in the south-west due to the drier the north-east and central
Savannah areas. Less than 5% of this area is occupied by smallholder farms, which average 1.7 hectares per
household of 5 people. Food crops represent 75% of cultivated areas and are typically self-consumed.60
56
Baoto, S., Song, S. and Fagariba, C. (2018). Climate Change Adaptation and Agricultural Development in Central Africa Republic-
Evidence of North-West. J. of Food Processing and Technology. 9(11). DOI: 10.4172/2157-7110.1000761
57
USAID (2018). Climate Risks in the Central African Regional Program for the Environment (CARPE) and Congo Basin. URL: https://
www.climatelinks.org/sites/default/files/asset/document/20180604_USAID-ATLAS_ClimateRiskProfile_CARPE.pdf
58
World Bank Group (2016). Gender Equality, Poverty Reduction, and Inclusive Growth. URL: http://documents1.worldbank.org/
curated/en/820851467992505410/pdf/102114-REVISED-PUBLIC-WBG-Gender-Strategy.pdf
59
USAID (2018). Climate Risks in the Central African Regional Program for the Environment (CARPE) and Congo Basin. URL: https://
www.climatelinks.org/sites/default/files/asset/document/20180604_USAID-ATLAS_ClimateRiskProfile_CARPE.pdf
60
Serge, S.B. et al. (2017). Impacts of Climate change in Central African Republic. Journal of Science and Engineering Technology. 5,
pp. 52–63. E-ISSN: 2311-8741/17
CLIMATE RISK COUNTRY PROFILE: CENTRAL AFRICAN REPUBLIC 16Armed conflict remains a major driver for food insecurity in CAR and a major disruption to the country’s agricultural
potential. Basic services are dysfunctional or non-existent in many areas and the disruption of already limited
services further hinders people’s access to livelihood opportunities. Trans-human movements remain difficult,
particularly in northwestern areas, generating tensions between pastoralists and farmers. This has exacerbated
existing intercommunal tensions; leading to armed conflict. As households and communities have been unable to
engage in agricultural and livestock activities it has resulted in a depletion of food stocks, rising prices, the adoption
of negative coping mechanisms by nearly half of the population and increased dependency on food aid.61
Climate Change Impacts
Projected climate change trends for the region are expected to result in increased rainfall through more frequent
and intense extreme rainfall events as well as prolonged dry spells and rising temperatures, which will impact
crop selection and productivity, alter farming practices and put increased pressure on farmers to expand their
cropland into forests.62 Rising temperatures may also alter pest and pathogen existence, with particular concern
for the cassava mosaic virus. Additionally, increasing temperatures and humidity may negatively impact the ability
to effectively process agricultural products and
safely store seeds, grains and other perishable
products.63 Damage to the region’s already severely
FIGURE 12. Average daily max temperature
limited ground transportation infrastructure from
for CAR (RCP8.5, Reference Period,
floods and heavy rains (as well as political instability
1986–2005)65
and conflict) is likely to lead to increased erosion,
8
raising transport costs and/or prevent products
7
from reaching market before spoilage, negatively
6
impacting farmers. Increased and/or prolonged
Temperature (°C)
5
dry spells are also likely to alter planting timelines.64
4
Figure 12 shows the average daily max-temperature
3
across seasonal cycles. These higher temperatures
2
have implications for impacts to soil moisture and crop
1
growth. Precipitation is also expected to increase, but Jan Feb Mar Apr May Jun Jul Aug Sep Oct Nov Dec
marginally, in the southern and southeast areas.
61
FAO (2019). Central African Republic — Situation Report, July 2019. URL: http://www.fao.org/fileadmin/user_upload/emergencies/
docs/FAOCARsitrep_July2019.pdf
62
Baoto, S., Song, S. and Fagariba, C. (2018). Climate Change Adaptation and Agricultural Development in Central Africa Republic-
Evidence of North-West. J. of Food Processing and Technology. 9(11). DOI: 10.4172/2157-7110.1000761
63
USAID (2018). Climate Risks in the Central African Regional Program for the Environment (CARPE) and Congo Basin. URL: https://
www.climatelinks.org/sites/default/files/asset/document/20180604_USAID-ATLAS_ClimateRiskProfile_CARPE.pdf
64
World Bank (2018). Breaking down barriers to regional agricultural trade in Central Africa. URL: https://openknowledge.worldbank.org/
bitstream/handle/10986/30397/127883-REPORT-CEMAC-Agriculture.pdf?sequence=1&isAllowed=y
65
WBG Climate Change Knowledge Portal (CCKP, 2021). CAR Agriculture Dashboard. URL: https://climateknowledgeportal.
worldbank.org/country/central-african-republic/climate-sector-agriculture
CLIMATE RISK COUNTRY PROFILE: CENTRAL AFRICAN REPUBLIC 17Adaptation Options
Both the sensitivity of the agricultural sector to the climate and the high reliance of this sector on rainfall and water
resources have important implications for the CAR’s farmers, livestock owners, fisheries, its wider economy, and
political stability. The structure of the economy, which is fragile and based mainly on natural resources, particularly
agriculture (80% of the active population, 50% of GDP and 95% of food sources) and forests, depends heavily
on variability and climate change. Improved development and implementation of environment and agricultural
protection policies should be put in place. Improved financing mechanisms can help small-scale farmers and
commercial industries re-start investment and production following displacement and conflict. The sector would
benefit from targeted research to increase knowledge on specific climate change related impacts to the agriculture
sector. Improved access to seasonal information is necessary to better inform farmers regarding planting. The sector
should target the preservation of the natural ecosystems in relation to its various functions: habitats for flora and
fauna, support for agriculture, maintenance for soil conservation and fertility. Improved training and awareness raising
of local farmers can be used to improve sowings, and soil enrichment techniques; increased agricultural support
should be provided through increased and reinforced agricultural extension programs. Increased involvement from
local communities, including farmers, should be sought in the improved management of local forest ecosystems.
Improved roads and transport networks can improve market access.66 CAR has also committed to improving the
resilience of its agriculture sector through the introduction of new varieties more suited to climate extremes,
diversifying its crops and varieties grown, establishing a seed bank, promoting more sustainable soil management
that is linked with forest management systems which can also support the reforestation of degraded landscapes.67
Water
Overview
The CAR has a dense hydrological network spread throughout the country, which are distributed primarily between
the two watersheds, the Eastern Logone basin to the west and the Chari in the center and east. The Central African
Basin of Chari covers 202,351 km2. The Congolese watershed covers the southern two-thirds of the country
and consists of two major sub-basins: Oubangui and Sangha. The main rivers in the Chari-Logone basin are, the
Pendé, the Lim and the Ngou which, flow in to Mount Ngaoui. The Central African basin of Chari, which covers
202,351 km2 is subdivided into two parts, the Ouham and its tributaries, and the Aouk-Bamingui complex and
their tributaries, with the western branch of the Chari consisting of the Ouham-Bahr Sara and the Eastern Chari
from Gribingui Bamingui and Bahr Aouk. The Congolese hydrographic basin, covers the southern two-thirds of the
country on 404,004 km2. It is made up of two major sub-basins, those of the Ubangi and the Sangha. The basin of
Ubangui occupies more than three quarters of the Congo Basin. It stretches from east to west over 350,684 km2,
up to the DRC with Uélé which is the main contributor. The Ubangi is made up of the union of the Uélé and Mbomou
66
Ministry of Environment, Ecology and Sustainable Development (2015). Second National Communication to the UNFCCC — Central
African Republic. URL: https://unfccc.int/sites/default/files/resource/cafnc2.pdf
67
Central African Republic (2016). Nationally-Determined Contributions. URL: https://www4.unfccc.int/sites/ndcstaging/
PublishedDocuments/Central%20African%20Republic%20First/INDC_R%C3%A9publique%20Centrafricaine_EN.pdf
CLIMATE RISK COUNTRY PROFILE: CENTRAL AFRICAN REPUBLIC 18downstream from the city of Ouango. Upstream to downstream, the Central African part of this basin includes major
tributaries, such as the Mbomou, Kotto, Ouaka, Kémo, Ombella, M’Poko and Lobaye.68 However, despite the large
availability of water resources, the country has little institutionalized water supply infrastructure, impacting urban
and rural supply as well as water sanitation and hygiene for local populations.69
Climate Change Impacts
Most of the CAR’s population depends on groundwater and local springs largely located in dense gallery and
equatorial forests for drinking water. However, the changing characteristics of annual and seasonal precipitation is
expected to alter the Congo Basin’s dynamics across the central African region, also impacting CAR, could affect
water availability for both household and commercial consumption. The reliability of existing and potential irrigation
schemes (although currently limited) may be affected given climate impacts on the hydrological system, especially
in savannas and in drier zones. Additionally, the increased frequency of intense rainfall events can exacerbate poor
water quality, especially in urban areas, and increase the risk of flooding in rivers, streams and drainage ditches. The
pollution and contamination of drinking water is also a significant public health concern.70 Furthermore, floods on
navigable rivers can be dangerous and disrupt transportation of people and goods.71 For CAR increased aridity and
drought is also expected to result in land degradation a loss in biodiversity and surface water, adverse impacts to
crop production (including yield and quality) and increase the likelihood of wildfires. Heavy rainfall events are also
expected to lead to increased flooding and water logging in agricultural areas, impacting crop production, especially
for tuber crops (cassava, taro, yam) with changing rainfall patterns.72
Changes in rainfall and evaporation translate directly to changes in surface water infiltration and groundwater
re-charge. This has the potential for further decreased reliability of unimproved groundwater sources and surface
water sources during droughts or prolonged dry seasons. Increased strain on pumping mechanisms leading to
breakdowns if maintenance is neglected and the potential for falling water levels in the immediate vicinity of well
or borehole, particularly in areas of high demand. Additionally, temperature increases have the potential to result in
increased soil moisture deficits even under conditions of increasing rainfall. The figure below shows the projected
annual Standardized Precipitation Evapotranspiration Index (SPEI) for drought through the end of the century.
The SPEI is an index which represents the measure of the given water deficit in a specific location, accounting for
contributions of temperature-dependent evapotranspiration and providing insight into increasing or decreasing
68
Ministry of Environment, Ecology and Sustainable Development (2015). Second National Communication to the UNFCCC — Central
African Republic. URL: https://unfccc.int/sites/default/files/resource/cafnc2.pdf
69
Ministry of Environment, Ecology and Sustainable Development (2015). Second National Communication to the UNFCCC — Central
African Republic. URL: https://unfccc.int/sites/default/files/resource/cafnc2.pdf
70
Kamba, F. and Sangija, F. (2016). Impact of Water Pollution on Human Health in the Central African Republic. Advances in Social
Sciences Research Journal. 3(1). DOI: 10.14738/assrj.31.1764
71
USAID (2018). Climate Risks in the Central African Regional Program for the Environment (CARPE) and Congo Basin. URL: https://
www.climatelinks.org/sites/default/files/asset/document/20180604_USAID-ATLAS_ClimateRiskProfile_CARPE.pdf
72
Serge, S.B. et al. (2017). Impacts of Climate change in Central African Republic. Journal of Science and Engineering Technology. 5,
pp. 52–63. E-ISSN: 2311-8741/17
CLIMATE RISK COUNTRY PROFILE: CENTRAL AFRICAN REPUBLIC 19You can also read