Field observations of soil hydrological flow path evolution over 10 millennia - HESS
←
→
Page content transcription
If your browser does not render page correctly, please read the page content below
Hydrol. Earth Syst. Sci., 24, 3271–3288, 2020
https://doi.org/10.5194/hess-24-3271-2020
© Author(s) 2020. This work is distributed under
the Creative Commons Attribution 4.0 License.

Field observations of soil hydrological flow path evolution
over 10 millennia
Anne Hartmann1 , Ekaterina Semenova2 , Markus Weiler2 , and Theresa Blume1
1 Section   Hydrology, GFZ German Research Centre for Geosciences, Potsdam, Germany
2 Chair   of Hydrology, University of Freiburg, Freiburg, Germany

Correspondence: Anne Hartmann (aha@gfz-potsdam.de)

Received: 20 January 2020 – Discussion started: 24 January 2020
Revised: 18 April 2020 – Accepted: 17 May 2020 – Published: 25 June 2020

Abstract. Preferential flow strongly controls water flow and       the soil, in combination with a very high water storage ca-
transport in soils. It is ubiquitous but difficult to character-   pacity of the organic top layer and low hydraulic conductiv-
ize and predict. This study addresses the occurrence and the       ity of the deeper soil. In general, we found an increase in
evolution of preferential flow during the evolution of land-       water storage with increasing age of the moraines, based on
scapes and here specifically during the evolution of hill-         our observations of the reduction in infiltration depth as well
slopes. We targeted a chronosequence of glacial moraines in        as laboratory measurements of porosity. Preferential flow is,
the Swiss Alps to investigate how water flow paths evolve          however, not only caused by macropores, but especially for
along with the soil-forming processes. Dye tracer irrigation       the medium-age moraine, it seems to be mainly initiated by
experiments with a Brilliant Blue FCF solution (4 g L−1 )          soil surface characteristics (vegetation patches and microto-
were conducted on four moraines of different ages (30, 160,        pography).
3000, and 10 000 years). At each moraine, three dye tracer
experiments were conducted on plots of 1.5 m ×1.0 m. The
three plots at each moraine were characterized by differ-
ent vegetation complexities (low, medium, and high). Each          1   Introduction
plot was further divided into three equal subplots for the ap-
plication of three different irrigation amounts (20, 40, and       The ability of soil to store and to transport water is essen-
60 mm) with an average irrigation intensity of 20 mm h−1 .         tial for its ecosystem services such as nutrient cycling or wa-
The day after the experiment five vertical soil sections were      ter and gas balances (Clothier et al., 2008; Amundson et al.,
excavated, and the stained flow paths were photographed.           2015; Hatfield et al., 2017; Shang et al., 2018). Thus, the in-
Digital image analysis was used to derive average infiltra-        teraction of water and soil is an elementary foundation for
tion depths and flow path characteristics such as the volume       the existence and functioning of terrestrial ecosystems. This
and surface density of the dye patterns. Based on the volume       interaction is part of a large network of interactions of vari-
density, the observed dye patterns were assigned to specific       ous ecosystem components (flora, fauna, material and energy
flow type categories. The results show a significant change        fluxes, geomorphological conditions, and climate), which are
in the type of preferential flow paths along the chronose-         also necessary for the existence and functioning of ecosys-
quence. The flow types change from a rather homogeneous            tems. Soil filters the percolating water, redistributes it to
matrix flow in coarse material with high conductivities and        groundwater or stream water, or holds it against gravity and
a sparse vegetation cover at the youngest moraine to a het-        makes it available for plants.
erogeneous infiltration pattern at the medium-age moraines.           The soil functions are influenced and controlled by soil
Heterogeneous matrix and finger flow are dominant at these         properties, which can vary spatially on the small (Hu et al.,
intermediate age classes. At the oldest moraine only macro-        2008) and large scales (vertically along the profile and hor-
pore flow via root channels was observed in deeper parts of        izontally across landscapes; Bevington et al., 2016), as well
                                                                   as temporally. These properties include soil texture and struc-

Published by Copernicus Publications on behalf of the European Geosciences Union.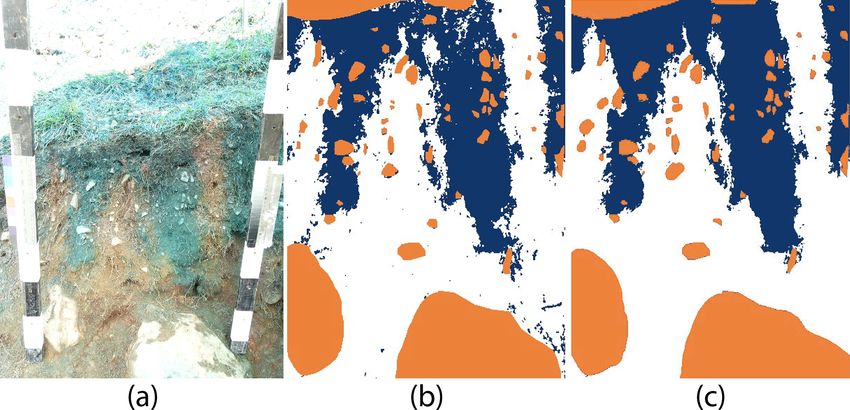
3272                                          A. Hartmann et al.: Field observations of soil hydrological flow path evolution

ture, i.e., the pore and grain size distributions, which in turn    layer. The younger soil was coarse textured with high satu-
control the storage and transport capacity of the soil. Addi-       rated hydraulic conductivities along the profile and a rather
tional factors influencing soil functions are climate, topogra-     low field capacity, whereas the older soil revealed a higher
phy, and vegetation. In undisturbed natural systems these fac-      field capacity and a distinct reduction in saturated hydraulic
tors are usually assumed to be constant at the observational        conductivity throughout the profile due to clay accumulation.
timescale, and the inherent system dynamics only become             Yoshida and Troch (2016) observed a major change in flow
apparent on long timescales.                                        paths from deep groundwater flow to shallow subsurface flow
   Preferential flow, which is defined according to Hendrickx       in volcanic catchments of ages between 200 000 and 82 mil-
and Flury (2001) as a phenomenon “where water and so-               lion years. Thus, the change of major flow paths with time
lutes move along certain pathways, while bypassing a frac-          has already been studied at the timescale on the order of
tion of the porous matrix”, has impacts on water storage (Rye       100 000 to millions of years, but little is known about how
and Smettem, 2017) and thus plant water availability. It fur-       flow paths change during these first 10 000 years of landscape
thermore affects the transport of nutrients and contaminants        development.
(Jarvis, 2007) throughout the vadose zone and consequently             Areas with receding glaciers have been shown to be suit-
also soil chemistry (Jin and Brantley, 2011; Bundt et al.,          able for soil development studies (Crocker and Dickson,
2000) and groundwater quality. Allaire et al. (2009) attribute      1957; Douglass and Bockheim, 2006; He and Tang, 2008;
rapid flow and mass transport to flow through earthworm bur-        Egli et al., 2010; Dümig et al., 2011; Vilmundardóttir et al.,
rows, cracks in soil, and flow paths resulting from soil layer-     2014; D’Amico et al., 2014). In the cool and humid climate
ing and hydrophobicity. They defined four types of preferen-        regions of former glacial areas, the soils develop from min-
tial flow: crack flow, burrow flow (created by soil fauna), fin-    eral soils to soils with a highly organic topsoil. These organic
ger flow, and lateral flow along layer interfaces, where flow in    soil types are less intensively studied with regard to their soil
burrows and cracks is also often classified as macropore flow.      hydraulic behavior compared to mineral soils (Carey et al.,
We will in the following distinguish flow in macropores ac-         2007). It is known that these soils differ in their soil hydraulic
cording to their origin as crack flow and biopore flow, where       properties from mineral soils (high total porosity – up to 90 %
the latter includes channels by activities of roots and soil        – and a low bulk density; Carey et al., 2007), but little is
fauna. Preferential flow in the form of macropore flow occurs       known about how this development impacts water flow paths.
mostly in fine-textured soils, whereas finger and funnel flow       Therefore, this study addresses the occurrence and the evolu-
rather occurs in soils with a coarse texture (Hendrickx and         tion of preferential flow during the first 10 000 years of land-
Flury, 2001). General factors which can cause preferential          scape evolution in glacial moraines in the Swiss Alps. More
flow paths are surface structure and properties such as vege-       specifically, we test the hypotheses that (1) vertical subsur-
tation cover, microtopography or hydrophobicity, as well as         face flow path types and vertical extent of flow paths change
subsurface soil properties such as soil structure and soil type,    through the millennia as (2) the proportion of macropore flow
subsurface heterogeneities, flow instabilities, and plant root      will increase due to the development of biopores, (3) the soil
activities (Weiler and Naef, 2003; Clothier et al., 2008; Bach-     develops from a homogeneously mixed material into a depth-
mair et al., 2009; Jarvis, 2007; van Schaik, 2009; Wang et al.,     differentiated soil system, and (4) physical weathering leads
2018). Soil water conditions were also found to have an in-         to a reduction in particle size and an increase in porosity.
fluence on the preferential flow path characteristics (Gimbel          Dye tracer experiments and an analysis of soil texture and
et al., 2016; Hardie et al., 2011; Bogner et al., 2008).            soil physical properties were used to investigate how wa-
   Many preferential flow-influencing properties such as soil       ter flow paths evolve with hillslope age. The hydropedo-
structure, soil texture, or vegetation cover change during          logical approach (Lin, 2003) that links pedon (Quisenberry
landscape evolution (e.g., Vilmundardóttir et al., 2014; Egli       et al., 1993), landscape (Cammeraat and Kooijman, 2009),
et al., 2010; Dümig et al., 2011) and thus also lead to a           and hydrologic process studies has already been applied to
change in the soil hydraulic behavior (Lohse and Dietrich,          the preferential flow phenomenon (Jarvis et al., 2012). Dye
2005), which in turn has a direct impact on the surface and         tracer experiments combined with digital image processing
subsurface water transport. We therefore assume that the age        have been applied successfully to study preferential infiltra-
of the soil has an influence on the prevailing preferential flow    tion in soils (Weiler, 2001; Bogner et al., 2008; Blume et al.,
paths and thus the type and also the depth extent of the pref-      2008; Laine-Kaulio et al., 2015; Hardie et al., 2011; Cheng
erential flow paths can change over time. Especially root ac-       et al., 2014). In our study we use this method to identify
tivities can lead to the generation of preferential flow paths in   how flow paths change during the coevolution of soil, veg-
deeper layers, which was found by Cheng et al. (2014) based         etation, and topography. Understanding the changes in pref-
on a comparison of young and older forest plantations. On a         erential flow paths as a result of the natural coevolution of
large timescale of several million years, Lohse and Dietrich        landscape-forming factors can provide valuable knowledge
(2005) found a transition from mainly vertical water trans-         on how these systems can also change as a result of human
port in younger volcanic soils in the Hawaiian Islands to lat-      intervention (Richter and Mobley, 2009).
eral water transport along the boundary of a subsurface clay

Hydrol. Earth Syst. Sci., 24, 3271–3288, 2020                                        https://doi.org/10.5194/hess-24-3271-2020
A. Hartmann et al.: Field observations of soil hydrological flow path evolution                                               3273

2     Material and methods                                          and shrubs was present. The youngest moraine still shows
                                                                    only a sparse vegetation cover with mainly grass, moss,
2.1    Study site                                                   forbs, and a few shrubs.

The study area is located in the foreland of the Stein glacier      2.2   Field experiments
above the tree line in the central Swiss Alps, south of
the Sustenpass in the Urner Alps (approximately 47◦ 430 N,          The dye tracer experiments were conducted between mid
8◦ 250 E). Elevations range from 1900 to 2100 m a.s.l. The          July and mid August 2018. We used Brilliant Blue FCF as
area lies in the polymetamorphic Erstfeld gneiss zone, which        dye tracer due to its good visibility, high mobility, and non-
is part of the Aar massif (Blass et al., 2003). The geology         toxicity. We used a concentration of 4 g L−1 , at which the
is defined by metamorphosed pre-Mesozoic metagranitoids,            tracer shows good sorption and visibility (Weiler and Flüh-
amphibolites, and gneisses (Heikkinen and Fogelberg, 1980;          ler, 2004). Three study plots were selected at each moraine,
Schimmelpfennig et al., 2014); thus the material is mainly          based on the degree of vegetation complexity (low, medium,
acidic and rich in silicate. The closest official weather station   and high complexity). Vegetation complexity is characterized
is located 18 km away at Grimsel Hospiz (46◦ 340 N, 8◦ 190 E)       by vegetation coverage, the number of species, and the plant
at an elevation of 1980 m a.s.l. For the norm period from           functional diversity. The functional diversity is calculated
1981 to 2010, the station recorded an annual mean tempera-          based on specific leaf area, nitrogen content, leaf dry mat-
ture of 1.9 ◦ C and an annual precipitation of 1856 mm. The         ter content, Raunkiær’s life form, seed mass, clonal growth
precipitation distribution throughout the year is fairly uni-       organ, root type, and growth form. The collection of the re-
form with a slight increase in the winter months (Schweiz-          quired data and calculation of the vegetation complexity was
erische Eidgenossenschaft, 2016). The glacier foreland con-         done by the geobotany group of the University of Freiburg
sists of moraines with unconsolidated glacial till. The humid       and is described in more detail in Maier et al. (2019).
and cool climate together with the nutrient-poor substrate and         The size of each study plot was 1.5 m ×1.0 m. The dis-
a relative high water permeability of the glacial till favor the    tances between the three study plots at each moraine ranged
formation of podsolic soils and humus in this area (Heikki-         from 10 to 100 m. Each plot was further divided into three
nen and Fogelberg, 1980).                                           equal subplots of 0.5 m ×1.0 m. Figure 2 shows the exper-
   The moraines of the Stein glacier were exposed due to            imental design at each moraine and illustrates the irrigation
its retreat to the south. Four moraines were selected for           procedure.
this study (see Fig. 1). Schimmelpfennig et al. (2014) con-            The subplots were irrigated with three different amounts
ducted a detailed dating study of the Stein glacier moraines,       of dyed water (20, 40, and 60 mm) and an irrigation intensity
based on high-sensitivity beryllium-10 moraine dating and           of 20 mm h−1 . The irrigation intensity is relatively high with
found that the ages of three moraines range between 160 to          a return period of 2.8 years (Fukutome et al., 2017). In prepa-
10 000 years. The age of a fourth moraine was dated to 30           ration of the tracer application, large vegetation in the form
years based on maps and aerial photos.                              of shrubs and bushes was cut off to a height of a few cen-
   The oldest moraine with an age of 10 000 years is fac-           timeters to reduce interception. The tracer was applied with a
ing northeast. The second oldest moraine with an age be-            hand-operated sprayer connected to a battery-powered pump
tween 2000 and 3000 years is the only one facing south. The         which guaranteed a constant pressure for a uniform flow rate
two youngest moraines were exposed in the years 1860 and            of 60 L h−1 . For a time-efficient irrigation of the three sub-
1980–1990 and thus have an age of 160 and 30 years, respec-         plots with three irrigation amounts, the irrigation procedure
tively. Both moraines are facing northeast and are located          was divided into three steps. In the first step, all three sub-
closer to the glacier tongue at a distance of approximately         plots were irrigated simultaneously for 60 min in a sequence
1 km from the oldest moraines. Both moraines are south of           of 5 min of irrigation and a 5 min break. This provides an ap-
the glacial lake Steinsee (1930 m a.s.l.), which is a proglacial    plication of 20 mm to all three subplots. After finishing the
lake that was formed by the glacier retreat in 1924 (Blass          first step the first subplot was covered to avoid any additional
et al., 2003).                                                      water input. In a second step, the other two subplots were si-
   The vegetation of the moraines was mapped in summer              multaneously irrigated for an additional 60 min in a sequence
2017 (Maier et al., 2019). Pronounced differences in vege-          of 5 min of irrigation and 10 min breaks. This provides an
tation coverage and species distributions were found among          application of an additional 20 mm to each of the two re-
the four age classes. The vegetation of the oldest moraine          maining subplots. In the last step, only the third subplot was
was dominated by a variety of prostrate shrubs together             irrigated for 60 min in a sequence of 2 min of irrigation and
with small trees and several grasses. On the 3000-year-             10 min breaks, while the other two plots remained covered
old moraine, a grassland cover with fern, mosses, sedges,           providing an additional 20 mm to this subplot. After the end
and forbs was found. The two youngest moraines however              of tracer application, the entire plot was covered to avoid any
showed a lower degree of vegetation complexity. On the 160-         disturbance by natural rainfall.
year-old moraine, a combination of grasses, lichen, forbs,

https://doi.org/10.5194/hess-24-3271-2020                                        Hydrol. Earth Syst. Sci., 24, 3271–3288, 2020
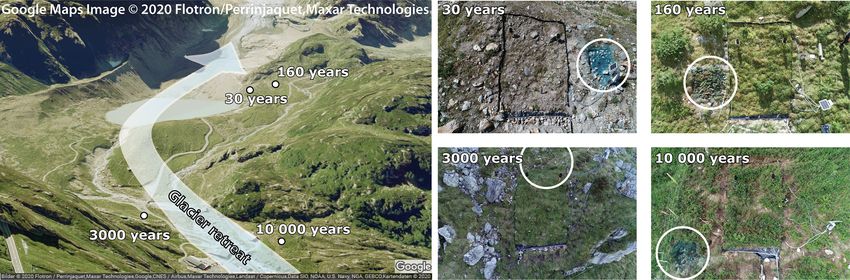
3274                                            A. Hartmann et al.: Field observations of soil hydrological flow path evolution

Figure 1. Location (left) and surface cover (right) of the four selected proglacial moraines of the Stein glacier. White circles show locations
of one of the three Brilliant Blue experiment plots per age class. Photo of the location is provided by © Google (2020). Photos of the 30-,
160-, and 10 000-year-old moraines were taken after the Brilliant Blue experiment (photos taken by Florian Lustenberger).

Figure 2. Illustration of the experimental design and soil sampling scheme at each moraine.

   The next day each subplot was excavated in up to five pro-             the frame (Fig. 3) for later color adjustment were included in
files of 7 to 10 cm. After the profile cuts were made with                the photographs. Since dye tracer experiments only provide
pickaxes, spades, and hand shovels, the profile walls were                snapshots of flow patterns at 24 h after the irrigation, we can-
cleaned. Hanging roots were cut off, and rocks were not re-               not exclude the possibility that initial preferential flow paths
moved but made visible. The profiles of each subplot were                 were obliterated by a later downward movement of the infil-
photographed with a Panasonic Lumix DMC-FZ18 camera                       tration front. However, as the probability of this special case
and at a resolution of 2248 pixels ×3264 pixels. A big um-                is relatively low, we assume that these snapshots are a viable
brella was used to provide a uniform light distribution in the            basis for the comparison of characteristic flow patterns along
photographs and to avoid direct sunlight. A wooden frame                  the moraine ages.
for geometric correction and a grayscale (Kodak) attached to

Hydrol. Earth Syst. Sci., 24, 3271–3288, 2020                                               https://doi.org/10.5194/hess-24-3271-2020
A. Hartmann et al.: Field observations of soil hydrological flow path evolution                                                      3275

Figure 3. Exemplary image analysis procedure for the 40 mm irrigated subplot at the 3000-year-old moraine. (a) Photograph of the vertical
soil profile with a wooden frame and an attached grayscale. (b) Software-generated tricolor image of the photograph. (c) Manually corrected
tricolor image. Blue indicates stained soil; white indicates unstained soil; and orange indicates rocks.

2.3   Image analysis                                                    els per depth and is calculated as the average of all excavated
                                                                        profiles per plot. The surface area density in one dimension
                                                                        is calculated by using the intercept density, which describes
The image analysis procedure by Weiler (2001) was used to               the number of intercepts between stained and unstained pix-
generate tricolor images of the photographs showing stained             els divided by the horizontal width of the soil profile. The
and unstained areas (Fig. 3). A detailed description of the             profile of the surface area density describes the amount of
method can be found in Weiler and Flühler (2004). Instead               intercepts per depth and is then also averaged over all pho-
of using the original IDL (Interactive Data Language) soft-             tographed profiles per plot. Volume density provides no in-
ware package, a similar Python version was used. Basically,             formation about whether the stained area is the sum of many
geometric correction, background subtraction, and color ad-             small fragments or a few large ones; thus the volume den-
justment were carried out to correct differences in image illu-         sity alone should not be used to characterize flow patterns,
mination and changes in the spectral composition of daylight.           and the surface area density should be used as a supplemen-
The delineation of rocks and plants was done manually. In the           tary parameter. A high surface area density indicates a large
resulting tricolor image, the horizontal and vertical length of         number of small features.
a pixel correspond to 1 mm. Due to poor lighting conditions                Following the method described by Weiler (2001), the re-
or a heterogeneous background color distribution in the soil            sulting dye patterns were next classified into flow type cat-
caused by material transitions, small stones, or organic mat-           egories based on the proportions of three selected stained
ter, the image analysis software was not able to recognize all          path width classes (stained path width < 20, 20–200 mm, and
large dye stains as coherent objects. Thus, a manual correc-            > 200 mm) relative to the volume density. The stained path
tion of the images using the photographs was necessary (see             width is equal to the horizontal extent of a stained flow path
Fig. 3).                                                                (Weiler, 2001). This classification method distinguishes be-
   For a quantitative comparison of the dye patterns, the max-          tween five flow types: (1) macropore flow with low interac-
imum infiltration depth, the volume density, and surface area           tion, (2) mixed macropore flow (low and high interaction),
density, as well as the stained path width, were calculated.            (3) macropore flow with high interaction, (4) heterogeneous
These parameters are frequently used for an objective com-              matrix flow and finger flow, and (5) homogeneous matrix
parison and description of the dye patterns (Weiler and Flüh-           flow. Dye patterns which cannot be classified as one of these
ler, 2004; Bachmair et al., 2009; Laine-Kaulio et al., 2015;            flow types are categorized as undefined. The classification
Cheng et al., 2014; Gimbel et al., 2016; Laine-Kaulio et al.,           method based on proportions of the classes of stained path
2015; Mooney and Morris, 2008; Öhrström et al., 2002).                  width is illustrated in Fig. 4.
Volume and surface area density are originally steorologi-                 This method is based on the assumption that the dye pat-
cal parameters which are used to relate three-dimensional               terns are mainly controlled by certain preferential flow pro-
structures to measured two-dimensional parameters (Weibel,              cesses and that each flow process creates a characteristic dye
1979). The volume density corresponds to the dye coverage               pattern that can be described by the extent and distribution of
and can be derived from one-dimensional information by cal-             stained features.
culating the fraction of stained pixels for each depth. The vol-
ume density profile is defined by the fraction of stained pix-

https://doi.org/10.5194/hess-24-3271-2020                                             Hydrol. Earth Syst. Sci., 24, 3271–3288, 2020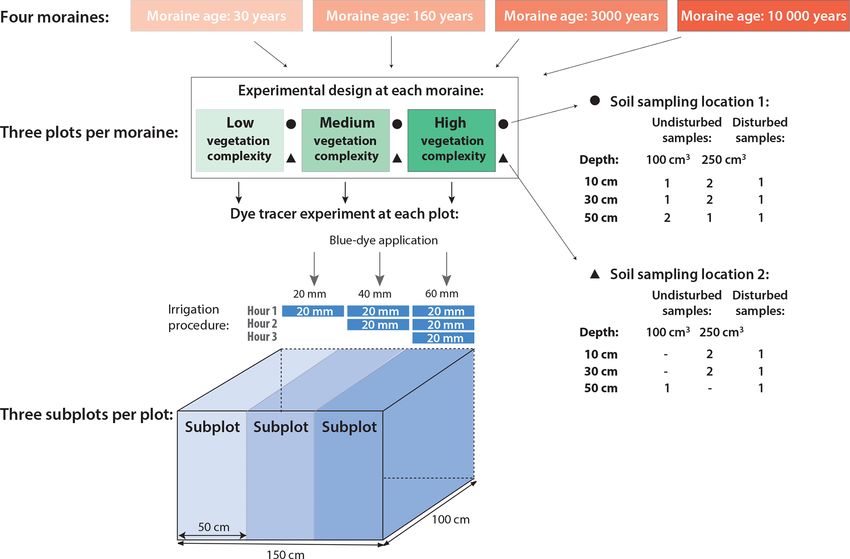
3276                                            A. Hartmann et al.: Field observations of soil hydrological flow path evolution

Figure 4. Ternary diagram for flow type classification based on the proportion of the three stained path width classes (after Weiler, 2001).

   This method was proven to be suitable for the investiga-              dye coverage of the available permeable matrix space (pro-
tion of Weiler (2001) and Weiler and Flühler (2004) and was              file width minus the sum of stone widths per row). If at least
also used in a variety of additional studies (Bachmair et al.,           95 % of the permeable space is stained by blue dye, the flow
2009; Gimbel et al., 2016; Mooney and Morris, 2008). How-                type is classified as matrix flow between rocks.
ever, an extension of the flow type categorization was needed
for our study site with soils of different ages, texture, and            2.4    Soil sampling and laboratory analysis
additionally a high stone content. In the extended classifi-
cation, we avoid a clear differentiation between macropore               Soil samples were taken during August and September of
flow and finger flow. The original classification assigns fin-           2018 close to each dye tracer plot. For grain size analy-
ger flow only when both classes of the medium-sized stained              sis, two disturbed bulk soil samples per depth were taken
path width (20–200 mm) and the biggest stained path width                at 10, 30, and 50 cm depth at each plot. The total of 72
(> 200 mm) account for approximately half of the dye cover-              samples was analyzed in the laboratory between Novem-
age. This implies that finger flow is only prevalent when the            ber 2018 and January 2019 by using a combination of dry
dye pattern is characterized by a majority of broader stained            sieving (grain sizes > 0.063 mm) and sedimentation analy-
path widths, ignoring the fact that the size of the finger-like          sis (grain sizes < 0.063 mm) with the hydrometer method
flow paths can vary over a broad range (Wang et al., 2018).              (Casagrande, 1934). Organic matter removal was only possi-
Thus, we argue that while finger flow and macropore flow                 ble by floating off the lighter fractions prior to grain size anal-
are caused by different properties and flow mechanisms, they             ysis. Since three plots were selected per moraine for the Bril-
can lead to similar dye patterns and distributions of stained            liant Blue experiments, six samples per depth and age class
path width classes. This is especially the case for macrop-              (a total of 18 samples for each moraine) were available for
ore flow with high interaction, which creates broader stained            the grain size analysis. Grain sizes between 2 and 0.063 mm
paths that could also be assigned to finger flow. Therefore,             were classified as sand, between 0.063 and 0.002 mm as silt,
both flow types were considered in the extended classifica-              and smaller than 0.002 mm as clay. Grain size fractions of
tion for this class. Furthermore, it was observed that the pres-         particles < 2 mm were calculated as weight percentages of
ence of rocks within the image analysis interrupts homoge-               total weight of particles < 2 mm, thus excluding gravel and
neous blue stained areas and thus leads to smaller stained               stones to avoid single larger stones shifting or dominating
path widths. Using the original classification scheme on a               the distribution. The gravel and stone fraction was calculated
soil profile with high stone content suggests a heterogeneous            separately as a weight percentage of the entire soil sample.
flow pattern, which can be classified as heterogeneous ma-                  For the analysis of the structural parameters, soil sam-
trix flow, finger flow, or macropore flow depending on the               ples were taken with sample rings to provide undisturbed
abundance of rocks. Therefore, an additional class has been              cores which preserve the natural soil structure. At each plot,
introduced, which is used when homogeneous matrix flow                   two 250 cm3 and one 100 cm3 undisturbed soil samples were
between rocks takes place. The classification rule for the ad-           taken at a depth of 10 and 30 cm. Three samples of 100 cm3
ditional flow type class is based on the proportion of blue-             were taken at 50 cm depth. Thus, per age class, nine sam-
                                                                         ples per depth were available for the determination of the

Hydrol. Earth Syst. Sci., 24, 3271–3288, 2020                                               https://doi.org/10.5194/hess-24-3271-2020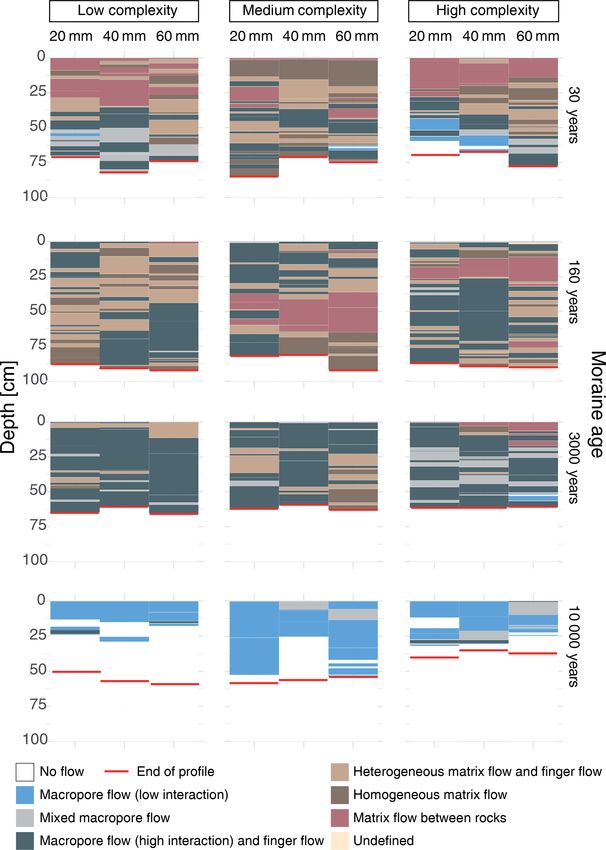
A. Hartmann et al.: Field observations of soil hydrological flow path evolution 3277
structural parameters of porosity and bulk density. A detailed
overview of the sampling scheme at each plot is given in
Fig. 2.
The porosity was determined in the lab using the water
saturation method. For this method, sample weights were
recorded at saturation and after drying at 105 ◦ C. For satu-
ration, the samples were placed in a small basin. The water
level in the basin was increased stepwise by 1 cm d−1 . When
the water level reached the top of the soil sample and the sam-
ple was fully saturated, the bottom of the sample was sealed,
and the weight at saturation was measured. Bulk density was
determined by relating the dry mass after drying at 105 ◦ C to
the sample volume. The loss on ignition is a measure of the
organic substance in the soil and describes the proportion of
the organic substance that was oxidized during annealing for
24 h at 550 ◦ C. The loss on ignition was determined by dry-
ing subsamples (4–6 g) for at least 24 h at 105 ◦ C and then
at 550 ◦ C. The ignition loss is then calculated by relating the
weight loss after drying at 550 ◦ C to the sample weight after
drying at 105 ◦ C.
2.5 Statistical analysis Figure 5. (a) Profile-averaged grain size fractions for the four
moraines. Fractions are percentages of the fine earth fraction (<
The nonparametric Kruskal–Wallis test was used to test the 2 mm). (b) Profile-averaged gravel content (> 2 mm) calculated as
significance of the differences in the soil texture among the the percentage of the entire sample weight. Each average is based
four moraines of differing age classes. It can be applied when on 18 samples.
the assumption of a normal distribution cannot be made and
is also valid for small sample sizes. We applied the test to
each grain size fraction across the four age classes. Average parameters of porosity and bulk density also show a clear
values were based on 18 samples per age class. The grain trend with age, with porosity increasing and bulk density de-
size distribution at 10 cm depth of the oldest moraine was creasing (Fig. 6).
excluded from consideration, since due to the high organic The porosity observed at the youngest moraine ranges be-
content not all organic matter could be removed, and the re- tween 0.22 and 0.37, with no pronounced differences among
sults may therefore be erroneous. the three soil depths. The 160-year-old moraine has a higher
porosity in the upper 10 cm than the 30-year-old moraine. Af-
3 Results ter 3000 years the increase in porosity continues but is now
also visible in 30 and 50 cm, but with much higher values
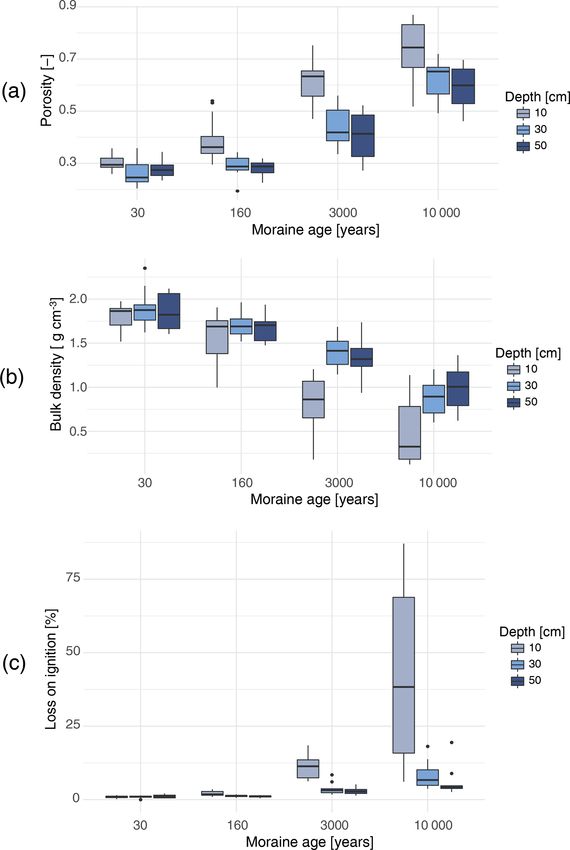
3.1 Soil texture and structural parameters at 10 cm (Fig. 6a). After 10 000 years the porosity at 10 cm
ranges from 0.6 to up to more than 0.8. The other two depths
Comparing the depth-averaged soil texture over the mil- also experienced a further increase in porosity. The decrease
lennia, we find that while the soil texture at the youngest in bulk density is also most pronounced in the top layer of
moraine mainly consists of sand, the grain sizes decrease the soil (Fig. 6b). While after 30 years the bulk density in
over the millennia with silt being the largest fraction af- the upper 10 cm ranges around 1.7 g cm−3 , the bulk density
ter 10 000 years (Fig. 5). Clay content increased with age after 10 000 years is much smaller and ranges between 0.2
for the three older moraines, with the youngest moraine be- and 0.7 g cm−3 . After 3000 years the trend is also visible at
ing the exception (having the second-highest clay content). 30 and 50 cm.
The Kruskal–Wallis test with a 0.05 confidence level showed The loss on ignition, as a measure for the organic matter
that differences in grain size fractions among the four age content, shows an increase throughout the first 10 millennia
classes were statistically significant (p values < 0.05; sand of soil development, which is most pronounced in the upper
of p = 0.0013, silt of p = 0.0006, and clay of p = 0.0018). soil layer (see Fig. 6c). At the two youngest moraines, the
A significant reduction in grain size over time was ob- organic matter content is still very low (< 2 wt %; percent-
served, which is most pronounced between 3000 and 10 000 age by weight). At these two age classes, the organic matter
years of soil development. The gravel and stone fraction is content is homogeneously distributed over the profile, with
roughly the same at the three younger moraines and signif- a slight tendency to higher values in the topsoil at the 160-
icantly lower at the oldest moraine (Fig. 5b). The structural year-old moraine. The 3000-year-old moraine shows a strong
https://doi.org/10.5194/hess-24-3271-2020 Hydrol. Earth Syst. Sci., 24, 3271–3288, 2020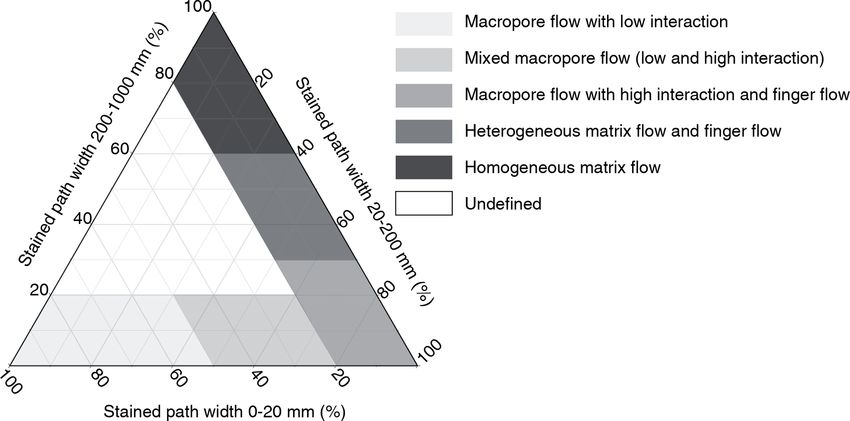
3278                                                    A. Hartmann et al.: Field observations of soil hydrological flow path evolution

Table 1. Linear rates of change in porosity, bulk density, and grain size between adjacent age classes calculated based on median values.
Mass fraction: mf %.

                                 Porosity (yr−1 )                       Bulk density (g cm−3 yr−1 )                   Grain size (mf % yr−1 )
                        10 cm            30 cm          50 cm          10 cm           30 cm          50 cm          sand           silt          clay
  Period (years)
  30–160            5.1 × 10⁻⁴     3.2 × 10⁻⁴       1.1 × 10⁻⁴   −1.3 × 10⁻³   −1.4 × 10⁻³     −9.1 × 10⁻⁴     2.5 × 10⁻²   1.5 × 10⁻²     −2.0 × 10⁻²
  160–3000         9.s5 × 10−5     4.6 × 10⁻⁵       4.4 × 10⁻⁵   −2.9 × 10⁻⁴   −9.7 × 10⁻⁵     −1.4 × 10⁻⁴    −3.2 × 10⁻³   3.2 × 10⁻³      3.1 × 10⁻⁴
  3000–10 000       1.6 × 10⁻⁵     3.3 × 10⁻⁵       2.6 × 10⁻⁵   −7.6 × 10⁻⁵   −7.4 × 10⁻⁵     −4.5 × 10⁻⁵    −3.3 × 10⁻³   2.4 × 10⁻³      3.2 × 10⁻⁴

                                                                                    Even though the differences in soil physical characteris-
                                                                                 tics between 30 and 160 years are comparatively small, the
                                                                                 rates of change during this initial phase are highest (Table 1).
                                                                                 Between 160 and 3000 years, the rates of change are signif-
                                                                                 icantly reduced and remain in a similar range between 3000
                                                                                 and 10 000 years.

                                                                                 3.2     Vertical-dye pattern analysis

                                                                                 Flow patterns traced with Brilliant Blue dye changed consid-
                                                                                 erably with moraine age (Fig. 7). The volume density profile
                                                                                 is a measure of the amount of blue dye per depth. The pro-
                                                                                 file patterns of volume and surface area density show distinct
                                                                                 differences among age groups, while differences between the
                                                                                 vegetation complexity levels are not as clear (Figs. 7 and 8).
                                                                                    The volume density of the blue dye was classified in three
                                                                                 selected groups of stained path width (Weiler, 2001). Addi-
                                                                                 tionally, the volume density of rocks was also classified in
                                                                                 three groups (Fig. 7).
                                                                                    An analysis of the average or maximum infiltration depth
                                                                                 based on the dye profiles was not possible because not all
                                                                                 profiles could be excavated up to the maximum infiltration
                                                                                 depth. In most cases, large boulders prevented further exca-
                                                                                 vation or the infiltration depth was more than 1 m. The latter
                                                                                 was mostly the case at the youngest moraines. Only at the
                                                                                 oldest moraine could a maximum infiltration depth be deter-
                                                                                 mined based on the dye profiles.
                                                                                    Combining the volume density profiles with the surface
                                                                                 area density profiles, it is possible to derive whether the
                                                                                 stained area described by the volume density is made up
                                                                                 of many small flow paths or few large ones. The shapes of
Figure 6. Evolution of soil porosity (a), bulk density (b), and loss             the volume density profiles and the surface area density of
on ignition (c) in 10, 30, and 50 cm depth.                                      the youngest moraine are all very similar across the vegeta-
                                                                                 tion complexity levels and irrigation amounts. The youngest
                                                                                 moraine has a higher volume density of flow paths in the
increase in the organic matter content in the surface layer.                     top half of the soil profile than all other moraines (Fig. 7).
At the oldest moraine, the trend of increasing organic matter                    There are almost no unstained areas. Beginning from approx-
continues in all three depths. Here, the organic matter con-                     imately 30 cm depth, the volume density declines. The sur-
tent in the topsoil makes up to two thirds of the soil material.                 face area density profiles show an opposite pattern (Fig. 8).
However, the organic matter content varies distinctly with a                     The surface area density is smaller in the upper half and in-
minimum of 6 wt % and a maximum of 87 wt %. In deeper                            creases in the lower half of the profile. The combination of
depths, the organic content also increases compared to the                       both parameters indicate a homogeneous staining in the top
3000-year-old soil but remains below 20 wt %.                                    half, where interruptions of stained areas are only caused by
                                                                                 rocks. In the lower part of the soil profiles the flow paths

Hydrol. Earth Syst. Sci., 24, 3271–3288, 2020                                                         https://doi.org/10.5194/hess-24-3271-2020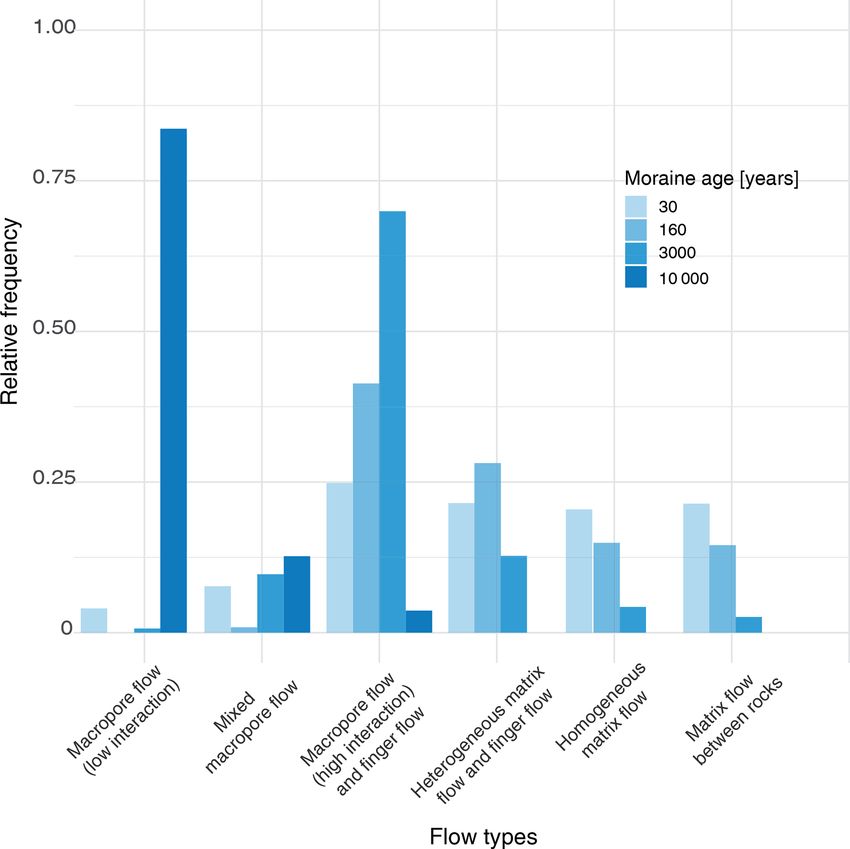
A. Hartmann et al.: Field observations of soil hydrological flow path evolution                                                       3279

Figure 7. Volume density profiles per age class, vegetation complexity, and irrigation amount. The volume density is the fraction of stained
pixels, here colored by flow path width (stained path width; SPW) and rock sizes.

are subdivided, which is indicated by the increase in surface           controlled by the position of the clay layer or is deeper than
area density (apparent at the plots at 30 cm depth for low,             the profile depth and therefore cannot be determined.
25 cm depth for medium, and 50 cm depth for high vegeta-                   Comparing the 160-year-old moraine to the youngest
tion complexity). This combined with a decline in volume                moraine, we find that the volume density is lower and the
density indicates a narrowing of the flow paths. For the plots          surface density is higher in the upper part of the profile. Also
of low and high vegetation complexity, the change in flow               unstained areas (colored white in Fig. 7) are visible, which
paths coincides with a layer of higher clay and silt content.           indicates that the higher surface density is not caused by the
This layer does not exist at the plot of medium vegetation              existence of rocks that split up a homogeneously stained area
complexity. In this case, the narrowing and splitting up of             as was the case for the youngest moraine. In this case there
flow paths is caused by large rocks. No clear differences are           is no total dye coverage of the permeable soil, and the pref-
visible between the different irrigation amounts. The propor-           erential flow paths are initialized already near or at the soil
tion of classes of the stained path width is controlled by the          surface. The surface density profiles show a decrease in the
existence of rocks. The maximum infiltration depth is either            lower half of the soil profile, which either goes along with

https://doi.org/10.5194/hess-24-3271-2020                                             Hydrol. Earth Syst. Sci., 24, 3271–3288, 2020
3280 A. Hartmann et al.: Field observations of soil hydrological flow path evolution
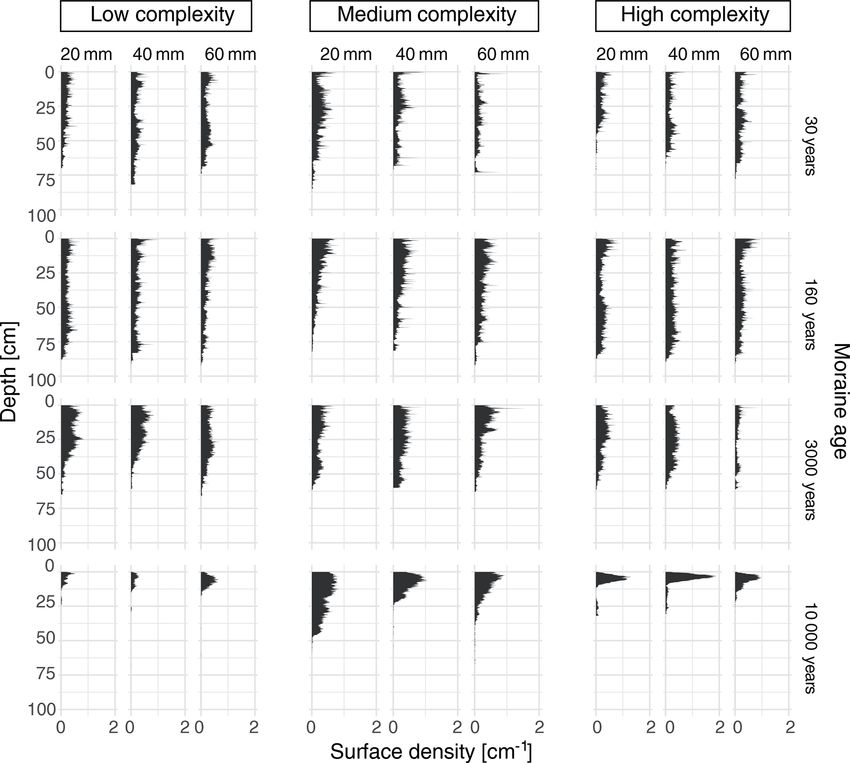
Figure 8. Surface area density profiles per age class, vegetation complexity, and irrigation amount (20, 40, and 60 mm). A high surface area
density indicates a large number of small features.
a decrease in the blue-dye coverage and an increase in the The oldest moraine with an age of 10 000 years shows the
stone coverage or an increase in the blue-dye coverage with- highest surface area density and the lowest volume density
out a significant change in stone coverage. Both indicate a re- combined with the lowest infiltration depths. The surface and
duction in the amount of separate flow paths and an increase volume density profiles show the same pattern: after a peak
in flow path widths, even if the permeable space is reduced close to the soil surface, both density profiles show a decrease
due to an increase in rock content. Also the fraction of stained with soil depth. This means that the dyed water is only trans-
path width (SPW) bigger than 200 mm increases, which in- ported deeper into the soil via a few individual flow paths.
dicates that the dye plumes widen in deeper soil depths.
Compared to the two youngest moraines, the moraine of 3.3 Flow type classification
3000 years shows in general a higher surface area density and
a lower dye coverage combined with a higher fraction of an
Using the information in the volume density profiles and the
unstained permeable soil matrix. This indicates that similar
stained path widths to characterize flow types (Weiler, 2001),
to the 160-year-old moraine, water is transported in individ-
we found a trend from a rather homogeneous flow pattern
ual flow paths, but here there are more flow paths, and they
with matrix flow in a fast-draining coarse-textured soil at the
have a smaller width. This can also be seen in the less fre-
youngest moraine to a more heterogeneous flow pattern with
quent appearance of stained path width higher than 200 mm
a mix of heterogeneous matrix flow and finger flow at both
(Fig. 7). Similar to the 160-year-old moraine, preferential
medium-age moraines (Fig. 9). While the flow characteris-
flow paths are already initialized at the top of the soil dur-
tics of both the 160- and 3000-year-old moraine are domi-
ing infiltration (apparent from the white-colored areas across
nated by finger flow with smaller stained path widths, this
the profile in Fig. 7).
is much more pronounced in the 3000-year-old moraine. By
Hydrol. Earth Syst. Sci., 24, 3271–3288, 2020 https://doi.org/10.5194/hess-24-3271-2020A. Hartmann et al.: Field observations of soil hydrological flow path evolution 3281
Figure 10. Relative frequency distribution of flow types of the four
moraine age classes. Basically all observations fit into the six flow
type categories. The fraction of observations categorized as “unde-
fined flow type” is negligible.
4 Discussion
4.1 Evolution of soil texture and structure
Figure 9. Profiles of flow types per age class, vegetation complex-
ity, and irrigation amount. The observation of bulk density, porosity, and soil texture
show significant differences between the age groups as well
as some clear trends with age. A detailed description of this
contrast, the oldest moraine stands out clearly from the other data set can be found in (Hartmann et al., 2020).
age groups. Here, only the macropore flow is predominant.
For the deeper soil layers, this was confirmed during the 4.1.1 The early years: 30–160
field experiments, since the few macropore flow paths were
clearly visible. For the topsoil, the result is less certain, as The 30-year-old soil is characterized by coarse material, with
the blue areas were very difficult to identify during the im- a soil texture composed of almost three quarters of sand. The
age analysis due to the very dark color of the organic layer. soil texture observed at the 160-year-old moraine does not
The relative frequency distribution of the flow types per differ strongly from the 30-year-old moraine, whereas slight
moraine age class derived from the results in Fig. 9 shows a changes are already evident in porosity and bulk density.
clear shift in the flow type distribution along the age classes These findings are similar to findings by Dümig et al. (2011),
(Fig. 10). At the youngest moraine, all types of finger flow who found no specific trend in grain size distribution for soils
and matrix flow are present, and the frequency distribution in the range of 15 to 140 years at a soil chronosequence in the
does not show a distinct peak at any flow type. With increas- foreland of the retreating Damma glacier (Switzerland). They
ing age, macropore flow becomes more and more important, furthermore found a high variability in grain size distribution
and the peaks in the frequency distribution become more and within the single age classes. However, in the same study a
more pronounced (Fig. 10). slight decrease in variability with increasing age and a no-
ticeable higher clay content were found at the reference site
with an age of more than 700 years. He and Tang (2008) also
revealed a nonlinear increase in the maximum clay content
for soils up to 180 years at a glacier foreland in a monsoon
temperate region in southwestern China.
https://doi.org/10.5194/hess-24-3271-2020 Hydrol. Earth Syst. Sci., 24, 3271–3288, 20203282 A. Hartmann et al.: Field observations of soil hydrological flow path evolution
After 160 years of soil development, the porosity in the decreased even further, and this development is now also vis-
top layer increased, and bulk density decreased. In general, ible in deeper soil depths. The continuous increase in poros-
these changes could be linked to changes in grain sizes, ity and reduction in bulk density can be attributed to the con-
as the breakdown of particles leads to an increase in to- tinuing change in soil texture on the one hand and on the
tal pore space (porosity) and thus to a reduction in bulk other hand to the pronounced vegetation development. Espe-
density (Arvidsson, 1998). However, since changes in grain cially the latter, with the resulting accumulation of soil or-
sizes were only marginal, the vegetation development, which ganic matter (see Fig. 6c) and the growth of an even denser
includes an increase in the root activities, litter accumula- root network that is now over 35 cm deep, is the main cause
tion, and biological activities in the root zone, is likely the for the pronounced changes in the topsoil.
main cause for changes in bulk density and porosity (Neris
et al., 2012; Carey et al., 2007). The vegetation coverage of 4.1.3 The late stage: 10 000 years
both moraines differs significantly (Maier et al., 2019). The
youngest moraine still shows only low vegetation cover with The oldest moraine shows a significantly higher silt content
only single plants (mainly grasses and forbs) and little root and porosity compared to the 3000-year-old moraine and a
mass with an observed maximum rooting depth of 15 cm (oc- significantly lower bulk density. The change is visible at all
casionally up to 30 cm), whereas the 160-year-old moraine soil depths, with the porosity in the uppermost depth being
already has a relatively closed vegetation cover with a com- distinctly higher than the other depths. These differences in
bination of shrubs and smaller plants like forbs and grasses soil properties between the soil layers also indicate a progres-
forming a loose root network with roots up to a maximum sive formation of distinct horizons in the soil.
diameter of 5–6 mm and a maximum depth of 35 cm (as ob- The significantly higher porosity in the upper layer of the
served during the excavation of the soil profiles). oldest moraine is caused by its thick organic layer (thick-
Similar findings in bulk density evolution were also ob- ness up to 20 cm), which is characterized by porosity of up
served by Crocker and Major (1955), who found a decrease to 90 % (this was also found by Nyberg, 1995, in sandy–silty
in the bulk density over the first 200 years of soil devel- till on the western coast of Sweden and Carey et al., 2007, in
opment from more than 1.4 g cm−3 to less than 0.8 g cm−3 organic soils in a permafrost region in northwestern Canada).
for glacial till in southeastern Alaska. A less pronounced Musso et al. (2019) investigated the evolution of pore
reduction was also found by Crocker and Dickson (1957). sizes in the top 5 cm at the same soil chronosequence and
He and Tang (2008) found a reduction for the time span of found an increase in the number of small soil pores and a
180 years from approximately 1.42 to 0.95 g cm−3 that was decrease in the relative proportion of macropores (pore di-
also more distinct in the upper horizon. Vilmundardóttir et al. ameter > 0.05 mm) between 160 and 10 000 years. Thus the
(2014) revealed at a glacier foreland in southeastern Iceland high porosity in the organic top layer at the oldest moraine is
under maritime climate conditions a reduction from 1.36 to mainly composed of small pores. The top layer therefore has
1.07 g cm−3 for a time span of 120 years. All studies men- an increased water storage and water holding capacity. Due
tioned above linked this decrease in bulk density to the veg- to the finer soil texture and higher porosity, the total water
etation development with time. storage capacity of the oldest moraine is larger than that of
the younger moraines.
4.1.2 Intermediate stage: 3000 years An investigation of the saturated hydraulic conductivity
evolution of the near surface (in 0–5, 5–20, and 20–40 cm) at
At 3000 years of soil development we observe a distinct in- the same chronosequence by Maier et al. (2019) found a de-
crease in silt and a reduction in sand content, and this devel- crease with increasing moraine age and soil depth. Saturated
opment continues, as observed in the 10 000-year moraine, conductivity was found to be negatively correlated with the
where the silt content now makes up the largest share. These fraction of fine particles. The decrease in gravel content and
findings agree with findings by Douglass and Bockheim the increase in silt seem to have an even a stronger effect on
(2006), who studied several moraines in Buenos Aires with the saturated conductivity than the root network development
ages ranging from 16 000 years to 1 000 000 years and found (Maier et al., 2019).
an accumulation of clay-sized particles with increasing age,
but with a decrease in the accumulation rate over the years. 4.1.4 Soil heterogeneity and vegetation complexity
A high fraction of silt is very common for soils in mountain
areas (Ellis, 1992). Physical weathering due to high fluctu- It is well known that soil properties are spatially heteroge-
ations between day and night temperature and freezing cy- neous (Bevington et al., 2016; Hu et al., 2008). As it was not
cles (Birse, 1980) leads to a reduction in grain size, without possible to account for this variability with a large sample
changing the particle mineralogy (Ellis, 1992). size, i.e., with a large number of experiments, we decided
The soil material at the 30-year-old moraine showed a rela- to take a different approach. Assuming that vegetation cover
tively uniform porosity and bulk density throughout the pro- and subsurface flow paths are strongly linked, we took the
file. After 3000 years, porosity increases, and bulk density variability in vegetation cover as a proxy and used it in an at-
Hydrol. Earth Syst. Sci., 24, 3271–3288, 2020 https://doi.org/10.5194/hess-24-3271-2020A. Hartmann et al.: Field observations of soil hydrological flow path evolution 3283
tempt to bracket this variability: per moraine three locations After 160 years, the derived predominant flow types shift
that differ in their vegetation complexity (low, medium, and to heterogeneous matrix flow and finger flow. The observed
high) were chosen for soil sampling and the dye tracer exper- widening of the dye plumes in deeper soil depths might be
iments. The analysis of the structural soil properties shows caused by a change in material or a reduction of hydropho-
that there is a slight increase in spatial heterogeneity with bicity with soil depth where the influence of plants and or-
age, especially in the topsoil (increase in the interquartile ganic material decreases (Blume et al., 2009). The dye cov-
ranges for all properties in the top layer in Fig. 6), but occa- erage images show unstained soil areas starting also at the
sionally also individual depths show a higher heterogeneity, top of the soil profile, which indicates that preferential flow
irrespective of age. paths are initialized already at the soil surface or in the near-
The flow path analysis differentiated according to the veg- surface layer. This was also observed during the irrigation,
etation complexity showed no systematic influence of the where we saw that the irrigated water often mainly infiltrated
complexity level on the results. Heterogeneities within the in depressions. Grass patches also tend to inhibit infiltration.
individual experimental subplots were taken into account by It was observed that in the presence of dense grass patches,
averaging the volume density and surface area density across the water infiltrated only next to the patches, leaving the area
the five vertical profiles per subplot instead of relying on in- below the patches unstained.
dividual profiles. We therefore assume that the results of the
flow path analysis are sufficiently representative to investi-
4.2.2 Intermediate stage: 3000 years
gate their evolution across the chronosequence.
4.2 Evolution of flow paths Similar observations were made at the 3000-year-old
moraine. The image analysis revealed that preferential flow
The flow type classification by Weiler (2001) was used to paths start at the soil surface and thus are initiated by veg-
classify the volume density patterns into flow type categories. etation and microtopography causing a heterogeneous in-
A comparison between the observations made during the ex- filtration pattern. Field observations also revealed that het-
cavation and the derived flow types showed that in this case erogeneous infiltration was not only created due to dense
an adaptation of the flow type classification was necessary. grass patches but also occurred under relatively homoge-
On the one hand, this adaptation involved the treatment of neous grass cover. A laboratory test of the water drop pen-
rocks to prevent misclassification, and, on the other hand, etration time (DeBano, 1981; Doerr et al., 2000) on a soil
we introduced the possibility of finger-like flow paths with sample of the upper soil material showed that the organic
smaller widths. After these adaptations the derived flow types layer is highly water repellent in dry conditions (air dried for
correspond well with the observations made in the field. 2 weeks; water drop penetration time > 10 min). An increase
The observed staining patterns and derived flow types in the hydrophobicity index (Tillman et al., 1989) with in-
show a significant difference between the age groups, creasing moraine age was also found by Maier et al. (2019).
whereas no significant difference was observed with respect Thus, we conclude that the hydrophobicity of the organic
to vegetation complexity and irrigation amount. top layer has a big impact on infiltration and the initiation
of unstable flow. Unstable flow occurs when horizontal wet-
4.2.1 The early years: 30–160
ting fronts break into fingers or preferential flow paths dur-
At the 30-year-old moraine, the water infiltrates homoge- ing the downward movement (Hendrickx and Flury, 2001).
neously into the soil, probably due to the very low vegeta- Compared to the 160-year-old moraine, the 3000-year-old
tion coverage and the coarse material texture. The dye pattern moraine is characterized by a higher number of narrower
showed a mainly homogeneous staining of the soil material; preferential flow paths.
thus derived flow types are mainly matrix flow in the form of The derived dominant flow type class at the 3000-year-old
homogeneous and heterogeneous matrix flow as well as ma- moraine is macropore flow with high interaction and finger
trix flow between rocks. Also finger flow occurs at the bound- flow. Of both possible flow types, finger flow is the preva-
ary to the clay layer or is caused by large blocks of rock, lent flow process causing the dye pattern. Several studies
which are surrounded by clay. The determined macropore linked the formation of finger-like flow paths to hydrophobic
flow takes place only within the clay layer at a depth below properties of the soil (Wallach and Jortzick, 2008; Dekker
50 cm. In the clay layer, no significant biopores were identifi- and Ritsema, 2000; Ritsema and Dekker, 1994; Blume et al.,
able, which is why it is assumed that the water is transported 2008; Wang et al., 2018; Hardie et al., 2011). It is assumed
in cracks or along material interfaces. The upper coarse soil that hydrophobic compounds that are released during the de-
material with large pores and a low water holding capacity cay of litter (Reeder and Jurgensen, 1979) or by root activity
causes the water to be transported quickly deeper into the (Doerr et al., 1998) coat soil particles or are deposited in the
soil. pore space and thus create a hydrophobic soil matrix (Doerr
et al., 2000). The humid and cool climate of former glacial
areas leads to a slow decomposition of vegetation and thus
https://doi.org/10.5194/hess-24-3271-2020 Hydrol. Earth Syst. Sci., 24, 3271–3288, 20203284 A. Hartmann et al.: Field observations of soil hydrological flow path evolution
to an accumulation of hydrophobic compounds (Doerr et al., At the medium-age moraines, flow paths are mainly con-
2000). trolled by vegetation shielding, microtopography, and hy-
drophobicity. The latter is assumed to have an increased im-
4.2.3 The late stage: 10 000 years pact at the 3000-year-old moraine. After 10 000 years of hill-
slope evolution, subsurface water transport is highly prefer-
At the oldest moraine, we saw a distinctly shallower infiltra- ential and controlled by flow paths caused by root channels
tion depth (Fig. 7). During the experiment, no surface runoff or boundaries of textural classes. Water storage in the or-
was observed. Most of the water was stored in the organic ganic layer which is also the main rooting horizon increases
top layer. The soil beneath the top layer was almost com- strongly.
pletely unstained, and water was transported only via a few
macropores into deeper layers. A dense network of roots was
only observed in the organic top layer, which included the 5 Conclusions
thicker roots of the alpenrose (Rhododendron ferrugineum).
The root network in the soil underneath was less dense with Using Brilliant Blue dye experiments and soil sampling, we
roots of smaller diameters but extended to a depth of more investigated the evolution of water transport paths along soil-
than 50 cm. Although the vegetation cover has been reduced forming processes. To our knowledge, this is the first study
to decrease interception, the interception storage capacity at examining flow path evolution across the millennia in such
the oldest moraine is still comparatively high. Thus, a reduc- detail. The evolution of the grain size distribution shows that
tion in the water available for infiltration cannot be ruled out. grain size decreases with increasing age. The biggest changes
are in the sand and silt fraction. Furthermore, water flow-
4.2.4 Impact of rocks defining structural parameters such as porosity and bulk den-
sity change during soil development, resulting in an increas-
The rock content at the 30-, 160-, and 3000-year-old ing water storage capacity with age. The depth-dependent
moraines is relatively high, with especially large rocks evolution of these parameters supports our hypothesis that
(widths > 20 mm) in deeper parts of the soil (Figs. 5b and the soil material develops with increasing age from a ho-
7). The large rocks lead to a reduction of the permeable mogeneously mixed material to a depth-differentiated soil
area and thus can cause funnel flow (Hendrickx and Flury, system with vertical gradients in flow and storage defining
2001). This type of preferential flow was especially observed soil properties. Changes in these flow-defining parameters
at the youngest moraine, where large boulders (> 25 cm) lo- are caused by the evolution of grain size distribution and veg-
cated at deeper soil depths were surrounded by unstained etation.
fine-textured material. Smaller-sized rocks in the upper part The derived flow types also support our hypothesis that
seemed not to have an influence on water transport (apart vertical subsurface flow path types and their vertical extent
from reducing the flow-through volume), since these rocks change through the millennia. Flow types change from a ho-
and the surrounding soil were completely stained. mogeneous matrix flow in a fast-draining coarse-textured soil
A splitting of flow paths caused by rocks was also ob- to a heterogeneous matrix and finger flow over the first 100–
served a few times at the 160- and 3000-year-old moraines. 3000 years. At very young moraines, the water is homoge-
In this case, water flowing past the sides of medium-to-large- neously distributed within the soil matrix. However, the wa-
sized rocks creates a type of finger flow that is not caused by ter storage capacity is relatively low due to the coarse mate-
water repellency or air entrapment. The tendency of higher rial, and water is transported quickly deeper into the soil due
rock contents to increase the number of flow paths was also to the high drainability. At the medium-age moraines, water
found by Bogner et al. (2014). is transported preferentially via finger-like flow paths deeper
into the soil by leaving parts of the soil dry. With increasing
4.2.5 Flow path controls along the age gradient hillslope age, we expected macropores induced by root ac-
tivities to become more important. After 10 000 years, where
Integrating all of our findings on soil structural parameters, the amount of soil matrix macropores decreased significantly,
texture, vegetation cover, and flow path patterns provides an the macropore flow along roots plays an important role but is
overview over their coevolution and highlights the derived not very pronounced. Only a few roots reach beyond the or-
major flow path controls (Fig. 11). ganic top layer. However, this allows for a fast transport of
Along the coevolution of soil and vegetation over 10 000 water from the upper layer into deeper soil. The organic top
years the major controls of subsurface flow paths change. layer has a pronounced influence on the soil water budget,
At the youngest moraine flow paths are only controlled by by storing a significant amount of water. The increase in wa-
soil texture. The coarse material leads to the deep downward ter storage with increasing age of the moraines also caused a
movement of the infiltration front. Preferential flow paths reduction in infiltration depth.
only occur at the interfaces between coarse and finer mate- The proportion of preferential flow paths increases with
rial. soil age. Preferential flow is, however, not only caused by
Hydrol. Earth Syst. Sci., 24, 3271–3288, 2020 https://doi.org/10.5194/hess-24-3271-2020You can also read


