Reviewing global estimates of surface reactive nitrogen concentration and deposition using satellite retrievals
←
→
Page content transcription
If your browser does not render page correctly, please read the page content below
Atmos. Chem. Phys., 20, 8641–8658, 2020
https://doi.org/10.5194/acp-20-8641-2020
© Author(s) 2020. This work is distributed under
the Creative Commons Attribution 4.0 License.

Reviewing global estimates of surface reactive nitrogen
concentration and deposition using satellite retrievals
Lei Liu1 , Xiuying Zhang2 , Wen Xu3 , Xuejun Liu3 , Xuehe Lu2 , Jing Wei4,5 , Yi Li6 , Yuyu Yang1 , Zhen Wang2 , and
Anthony Y. H. Wong7
1 College of Earth and Environmental Sciences, Lanzhou University, Lanzhou, 730000, China
2 InternationalInstitute for Earth System Science, Nanjing University, Nanjing, 210023, China
3 College of Resources and Environmental Sciences, National Academy of Agriculture Green Development,

China Agricultural University, Beijing, 100193, China
4 State Key Laboratory of Remote Sensing Science, College of Global Change and Earth System Science,

Beijing Normal University, Beijing, China
5 Department of Atmospheric and Oceanic Science, Earth System Science Interdisciplinary Center,

University of Maryland, College Park, MD, USA
6 Chief Technology Officer SailBri Cooper Inc., Beaverton, OR 97008, USA
7 Department of Earth and Environment, Boston University, Boston, MA 02215, USA

Correspondence: Lei Liu (liuleigeo@lzu.edu.cn)

Received: 31 January 2020 – Discussion started: 24 February 2020
Revised: 18 June 2020 – Accepted: 29 June 2020 – Published: 22 July 2020

Abstract. Since the industrial revolution, human activities       centration and deposition based on recent works, and sum-
have dramatically changed the nitrogen (N) cycle in natural       marize the existing challenges for estimating surface Nr con-
systems. Anthropogenic emissions of reactive nitrogen (Nr )       centration and deposition using the satellite-based methods.
can return to the earth’s surface through atmospheric Nr de-      We believe that exploiting satellite data to estimate Nr depo-
position. Increased Nr deposition may improve ecosystem           sition has a broad and promising prospect.
productivity. However, excessive Nr deposition can cause
a series of negative effects on ecosystem health, biodiver-
sity, soil, and water. Thus, accurate estimations of Nr de-
position are necessary for evaluating its environmental im-       1   Introduction
pacts. The United States, Canada and Europe have succes-
sively launched a number of satellites with sensors that allow    Nitrogen (N) exists in three forms in the environment, in-
retrieval of atmospheric NO2 and NH3 column density and           cluding reactive nitrogen (Nr ), organic nitrogen (ON) and ni-
therefore estimation of surface Nr concentration and deposi-      trogen gas (N2 ) (Canfield et al., 2010). N2 is the main com-
tion at an unprecedented spatiotemporal scale. Atmosphere         ponent of air, accounting for 78 % of the total volume of air,
NH3 column can be retrieved from atmospheric infra-red            but it cannot be directly used by most plants. Nr refers to the
emission, while atmospheric NO2 column can be retrieved           general term of N-containing substances in the atmosphere,
from reflected solar radiation. In recent years, scientists at-   plants, soils and fertilizers that are not combined with car-
tempted to estimate surface Nr concentration and deposi-          bon. Nr (such as NO−             +
                                                                                          3 and NH4 ) is the main form of N that
tion using satellite retrieval of atmospheric NO2 and NH3         can be directly used by most plants, but the content of Nr in
columns. In this study, we give a thorough review of recent       nature is much lower compared with ON and N2 (Vitousek
advances of estimating surface Nr concentration and deposi-       et al., 1997; Nicolas and Galloway, 2008). The supply of Nr
tion using the satellite retrievals of NO2 and NH3 , present a    is essential for all life forms and contributes to the increase
framework of using satellite data to estimate surface Nr con-     in agricultural production, thus providing sufficient food for
                                                                  the growing global population (Galloway et al., 2008, 2014b;

Published by Copernicus Publications on behalf of the European Geosciences Union.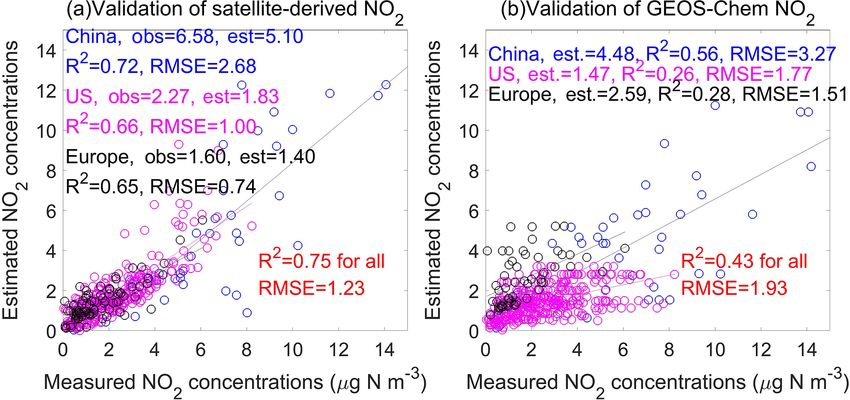
8642                                     L. Liu et al.: Reviewing global estimates of surface reactive nitrogen concentration

David et al., 2013; Erisman et al., 2008). Before the indus-         based methods and then present a detailed framework of us-
trial revolution, Nr mainly came from natural sources such as        ing satellite observation to estimate dry and wet Nr depo-
biological N fixation, lightning and volcanic eruption (Gal-         sition (including both oxidized and reduced Nr ). Next, we
loway et al., 2004a). Since the industrial revolution, human         review the recent advances of the satellite-based methods of
activities (e.g., agricultural development, combustion of fos-       estimating Nr deposition. Finally, we discuss the remaining
sil energy) have greatly perturbed the N cycle in natural sys-       challenges for estimating surface Nr concentration and depo-
tems (Canfield et al., 2010; Kim et al., 2014; Lamarque et al.,      sition using satellite observation.
2005).
   Nr (NOx and NH3 ) emitted to the atmosphere will return
to the earth’s surface through atmospheric deposition (Liu et        2     Methods for estimating surface Nr concentration and
al., 2011). Atmospheric Nr deposition refers to the process                deposition
in which Nr is removed from the atmosphere, including wet
(rain and snow) and dry (gravitational settling, atmospheric         2.1    Ground-based monitoring
turbulence, etc.) deposition (Xu et al., 2015; Zhang et al.,
2012; Pan et al., 2012). The input of Nr over terrestrial natu-      Ground-based monitoring of Nr deposition can be divided
ral ecosystems primarily comes from the Nr deposition (Shen          into two parts: wet and dry Nr deposition monitoring. Since
et al., 2013; Sutton et al., 2001; Larssen et al., 2011). In the     the 1970s, there have been large-scale monitoring networks
short term, atmospheric Nr deposition can increase the Nr            focusing on the wet Nr deposition. The main large-scale re-
input to ecosystems, which promotes plant growth and en-             gional monitoring networks include the Canadian Air and
hances ecosystem productivity (Erisman et al., 2008). How-           Precipitation Monitoring Network (CAPMoN), Acid Depo-
ever, excessive atmospheric Nr deposition also causes a se-          sition Monitoring Network in East Asia (EANET), European
ries of environmental problems (X. Liu et al., 2017). Due            Monitoring and Evaluation Program (EMEP), United States
to the low efficiency of agricultural N application, plenty of       National Atmospheric Deposition Program (NADP), World
Nr is lost through runoff, leaching and volatilization, caus-        Meteorological Organization Global Atmosphere Watch Pre-
ing serious environmental pollution. Excessive Nr deposition         cipitation Chemistry Program, and Nationwide Nitrogen De-
may aggravate the plant’s susceptibility to drought or frost,        position Monitoring Network in China (NNDMN) (Tan et al.,
reduce the resistance of the plant to pathogens or pests, and        2018; Vet et al., 2014). The detailed scientific objectives of
further affect the physiology and biomass distribution of veg-       the wet Nr deposition observation networks vary, but most
etation (ratio of roots, stems and leaves) (Stevens et al., 2004;    of the observation networks mainly concentrate on the spa-
Nadelhoffer et al., 1999; Bobbink et al., 2010; Janssens et al.,     tiotemporal variation of wet deposition of ions including Nr
2010). Excessive Nr leads to eutrophication and related algal        compounds, the long-term trends of ions in precipitation, and
blooms over aquatic ecosystems, reducing water biodiversity          the evaluation of ACTMs.
(Paerl et al., 2014), while excessive Nr in drinking water also         Compared with wet Nr deposition monitoring, dry Nr de-
poses a threat to human health (Zhao et al., 2013; Wei et al.,       position monitoring started late, due to the limitation of mon-
2019). Therefore, monitoring and estimation of surface Nr            itoring technology since it is more difficult to be quanti-
concentration and deposition on the global scale are of great        fied (affected greatly by surface roughness, air humidity, cli-
importance and urgency.                                              mate and other environmental factors) (Liu et al., 2017c).
   The methods of estimating atmospheric Nr deposition               Dry Nr deposition observation networks include the US
can be divided into three categories: ground-based monitor-          ammonia monitoring network (AMoN), CAPMoN, EANET
ing, atmospheric chemical transport modeling (ACTM) and              and EMEP. The monitoring methods of dry Nr deposition
satellite-based estimation. Ground-based monitoring is con-          are mainly divided into direct monitoring (such as dynamic
sidered to be the most accurate and quantitative method,             chambers) and indirect monitoring (such as inferential meth-
which can effectively reflect the Nr deposition in local ar-         ods). The inferential model is widely applied in ground-
eas. ACTM can simulate the processes of Nr chemical reac-            based monitoring networks (such as EANET and NNDMN),
tion, transport, and deposition, as well as the vertical distribu-   mainly because this method is more practical and simpler. In
tion of Nr . Satellite-based estimation establishes empirical,       inferential models, dry deposition is divided into two parts:
physical or semi-empirical models by connecting the ground-          surface Nr concentrations and the deposition velocity (Vd )
based Nr concentrations and deposition with satellite-derived        of Nr (Nowlan et al., 2014). Vd can be estimated by mete-
Nr concentration. This study focuses on reviewing the recent         orology, land use types of the underlying surface as well as
development of satellite-based methods to estimate Nr de-            the characteristics of each Nr component itself using resis-
position. Since the estimation of Nr concentrations is just          tance models (Nemitz et al., 2001). Thus, dry Nr deposition
a part of the estimation of dry Nr depositions, we here              monitoring networks only need to focus on the quantification
mainly reviewed the progress of dry Nr depositions using             of surface concentration of individual Nr components. The
the satellite observation. We firstly give a brief introduc-         Nr components in the atmosphere are very complex, includ-
tion to the progress of ground-based monitoring and ACTM-            ing N2 O5 , HONO, NH3 , NO2 , HNO3 and particulate NH+       4

Atmos. Chem. Phys., 20, 8641–8658, 2020                                               https://doi.org/10.5194/acp-20-8641-2020
L. Liu et al.: Reviewing global estimates of surface reactive nitrogen concentration                                         8643

and NO−  3 . Most monitoring networks include the major Nr         perience), SCIAMACHY (SCanning Imaging Absorption
species such as gaseous NH3 , NO2 , HNO3 and the particles         SpectroMeter for Atmospheric ChartographY), OMI (Ozone
of NH+ 4 and NO3 .
                  −
                                                                   Monitoring Instrument), and GOME-2 (Global Ozone Mon-
   Efforts of ground-based Nr deposition monitoring are            itoring Experience-2). Some scholars applied satellite NO2
mostly concentrated on wet Nr deposition, while observa-           columns to estimate the surface NO2 concentration and then
tions of dry Nr deposition are relatively scarce, especially       dry NO2 deposition by combining the surface NO2 concen-
for surface HNO3 and NH+               −
                            4 and NO3 . Second, most obser-        tration and modeled Vd . Cheng et al. (2013) established a
vation networks focus on a few years or a certain period of        statistical model to estimate the surface NO2 concentration
time, leading to the lack of long-term continuously monitor-       based on the SCIAMACHY NO2 columns and then esti-
ing on both wet and dry Nr deposition. More importantly, the       mated the dry deposition of NO2 over eastern China (Cheng
global Nr deposition monitoring network has not been estab-        et al., 2013). This method used the simple linear model and
lished, and the sampling standards in different regions are not    did not consider the vertical profiles of NO2 (Cheng et al.,
unified. These outline the potential room for improvement of       2013). Lu et al. (2013) established a multivariate linear re-
ground-based Nr deposition monitoring.                             gression model based on the SCIAMACHY and GOME NO2
                                                                   columns, meteorological data and ground-based monitoring
2.2   Atmospheric Chemistry Transport Model (ACTM)                 Nr deposition and then estimated the global total Nr depo-
      simulation                                                   sition (Lu et al., 2013). Lu et al. (2013) could not distin-
                                                                   guish the contribution of dry and wet Nr deposition using the
An ACTM can simulate Nr deposition at regional or global           multivariate linear regression model (Lu et al., 2013). Jia et
scales by explicitly representing the physical and chemical        al. (2016) established a simple linear regression model based
processes of atmospheric Nr components (Zhao et al., 2017;         on OMI tropospheric NO2 column and ground-based surface
Zhang et al., 2012). Wet Nr deposition flux is parameterized       Nr concentration and then estimated the total amounts of dry
as in-cloud, under-cloud and precipitation scavenging (Amos        Nr deposition (Jia et al., 2016). Jia et al. (2016) used the
et al., 2012; Levine and Schwartz, 1982; Liu et al., 2001;         OMI tropospheric NO2 column to estimate the dry deposi-
Mari et al., 2000), while dry deposition flux can be obtained      tion of reduced Nr deposition (NH3 and NH+      4 ), which could
as the product of surface Nr concentration and Vd , which is       also bring great errors since the OMI NO2 column could not
typically parameterized as a network of resistances (Wesely        indicate the NH3 emission. These studies highlight the prob-
and Hicks, 1977). Based on the integrated results of 11 mod-       lem of using only NO2 columns to derive total Nr deposition:
els of HTAP (hemispheric transport of air pollution), Tan et       that NO2 columns give us highly limited information about
al. (2018) found that about 76 %–83 % of the ACTM’s simu-          the abundance of reduced Nr (NH3 and NH+       4 ).
lation results were ±50 % of the monitoring values, and the           Lamsal et al. (2008) first used the relationship between the
modeling results underestimated the wet deposition of NH+     4    NO2 column and surface NO2 concentration at the bottom
and NO−  3 over Europe and East Asia and overestimated the         layer simulated by an ACTM to convert the OMI NO2 col-
wet deposition of NO−  3 over the eastern US (Tan et al., 2018).   umn to surface NO2 concentration (Lamsal et al., 2008). A
Though regional ACTMs can be configured at very high hor-          series of works (Lamsal et al., 2013; Nowlan et al., 2014;
izontal resolution (e.g., 1 × 1 km2 ) (Kuik et al., 2016), the     Kharol et al., 2018) have effectively estimated the regional
horizontal resolutions of global ACTMs are relatively coarse       and global surface NO2 concentration using the satellite NO2
(1◦ × 1◦ –5◦ × 4◦ ) (Williams et al., 2017), which cannot indi-    column combined with the ACTM-derived relationship be-
cate the local pattern of Nr deposition. On the other hand, the    tween the NO2 column and surface NO2 concentration sim-
Nr emission inventory used to drive an ACTM is highly un-          ulated. It is worth mentioning that Nowlan et al. (2014) ap-
certain, with the uncertainty of the NOx emission at about         plied the OMI NO2 column to obtain the global dry NO2 de-
±30 %–40 % and that of NH3 emission at about ±30 %–                position during 2005–2007 for the first time (Nowlan et al.,
80 % (Zhang et al., 2009; Cao et al., 2011).                       2014). However, using the satellite NO2 column and ACTM-
                                                                   derived relationship between the NO2 column and surface
2.3   Satellite-based estimation of surface Nr                     NO2 concentration may lead to an underestimation of sur-
      concentration and deposition                                 face NO2 concentration. Kharol et al. (2015) found that the
                                                                   satellite-derived surface NO2 concentration using the above
Satellite observation has wide spatial coverages and high          method is only half of the observed values (Kharol et al.,
resolution and is spatiotemporally continuous. Atmospheric         2015). To resolve such potential underestimation, Larkin et
NO2 and NH3 columns can be derived from satellite mea-             al. (2017) established a statistical relationship between the
surements with relatively high accuracy (Van Damme et al.,         satellite-derived and ground-measured surface NO2 concen-
2015; Boersma et al., 2011), providing a new perspective           tration and then calibrated the satellite-derived surface NO2
about atmospheric Nr abundance.                                    concentration using the established relationship (Larkin et
   Satellite instruments that can monitor NO2 in the at-           al., 2017).
mosphere include GOME (Global Ozone Monitoring Ex-

https://doi.org/10.5194/acp-20-8641-2020                                            Atmos. Chem. Phys., 20, 8641–8658, 2020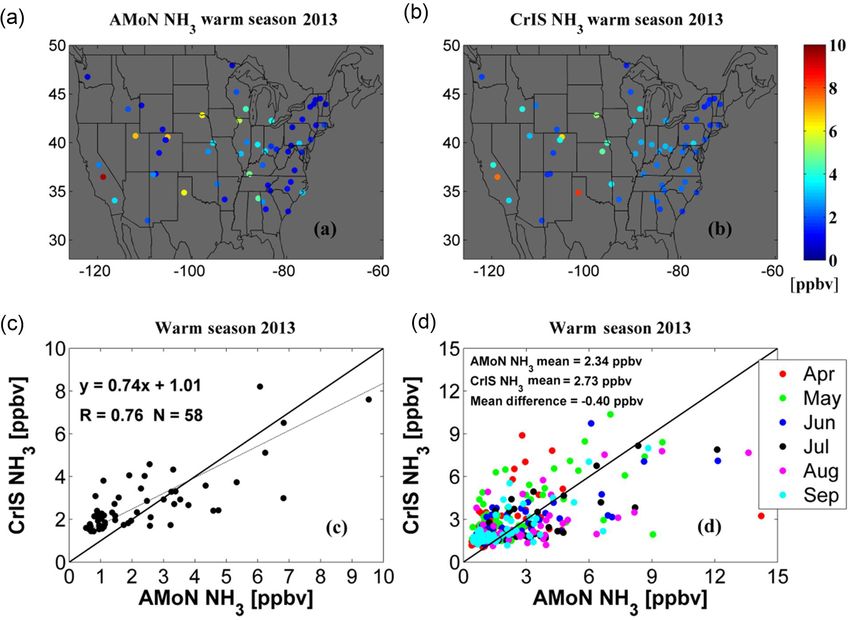
8644                                     L. Liu et al.: Reviewing global estimates of surface reactive nitrogen concentration

   Some researchers also estimated other Nr components               not consistent, presenting a barrier to integrating different re-
(such as particulate NO−  3 ) based on the satellite NO2 column.     gional monitoring data. Large uncertainties exist in the Nr
Based on the linear model between NO2 , NO−         3 , and HNO3     emission inventory used to drive the ACTMs, and the spa-
obtained by ground-based measurements, Jia et al. (2016)             tial resolution of the modeled Nr deposition by ACTMs is
calculated the surface NO−    3 and HNO3 concentration using         coarse. Using satellite monitoring data to estimate surface Nr
satellite-derived surface NO2 concentration and their rela-          concentration and deposition is still in its infancy, especially
tionship (Jia et al., 2016). Geddes et al. (2016) reconstructed      for reduced Nr .
the NOx emission data by using the satellite NO2 column and             Some scholars tried to use the satellite NO2 and NH3 col-
then estimated the global NOx deposition by an ACTM, but             umn to estimate the surface Nr concentration and dry Nr de-
the spatial resolution of global NOx deposition remains low          position. However, there are relatively few studies on esti-
(2◦ ×2.5◦ ), failing to exploit the higher resolution of satellite   mating wet Nr deposition. In addition, the development of
observation (Geddes and Martin, 2017).                               satellite monitoring for NH3 in the atmosphere is relatively
   Compared with NO2 , the development of satellite NH3              late (compared with NO2 ). At present, IASI NH3 data have
monitoring is relatively late. Atmospheric NH3 was first de-         been widely used, while the effective measurements of TES
tected by the TES in Beijing and Los Angeles (Beer et al.,           are less than IASI; CrIS and AIRS NH3 column products are
2008). The IASI sensor also detected atmospheric NH3 from            still under development. There are three main concerns in
a biomass burning event in Greece (Coheur et al., 2009).             high-resolution estimation of surface Nr concentration and
Subsequently, many scholars began to develop more reliable           deposition based on satellite Nr observation. (1) How to ef-
satellite NH3 column retrievals (Whitburn et al., 2016; Van          fectively couple the satellite high-resolution NO2 and NH3
Damme et al., 2015), validate the satellite-retrieved NH3 col-       column data with the vertical profiles simulated by an ACTM
umn with the ground-based observation (Van Damme et al.,             and then estimate the surface Nr concentrations? This step is
2015; Dammers et al., 2016; Li et al., 2017), and compare the        the key to simulating the dry Nr deposition. (2) How to con-
satellite NH3 column with the aircraft-measured NH3 col-             struct a model for estimating dry Nr deposition including all
umn (Van Damme et al., 2014; Whitburn et al., 2016). In re-          major Nr species based on the satellite NO2 and NH3 col-
cent years, some scholars have carried out the works of esti-        umn and then for estimating the dry Nr deposition at a high
mating surface NH3 concentration based on the satellite NH3          spatial resolution? (3) How to combine the high-resolution
column. Liu et al. (2017) obtained the satellite-derived sur-        satellite NO2 and NH3 column data and ground-based mon-
face NH3 concentration in China based on the IASI NH3 col-           itoring data to construct wet Nr deposition models and then
umn coupled with an ACTM and deepened the understanding              estimate the wet Nr deposition at a high spatial resolution?
of the spatial pattern of surface NH3 concentration in China
(Liu et al., 2017b). Similarly, Van der Graaf et al. (2018) car-
ried out the relevant work in Europe based on the IASI NH3           3     Framework of estimating surface Nr concentration
column coupled with an ACTM and estimated the dry NH3                      and deposition using satellite observation
deposition in western Europe (Van der Graaf et al., 2018).
                                                                     Previous studies using satellite observation to estimate sur-
Jia et al. (2016) first constructed the linear model between
                                                                     face Nr concentration and deposition only focused on one
surface NO2 and NH+     4 concentration based on ground moni-        or several Nr components, but did not include all Nr com-
toring data and then calculated the NH+   4 concentration using      ponents, which were decentralized, unsystematic and incom-
the satellite-derived surface NO2 concentration and their re-
                                                                     plete. Here we give a framework of using satellite observa-
lationship (Jia et al., 2016). However, as the emission sources
                                                                     tion to estimate surface Nr concentration and deposition as
of NOx (mainly from the transportation and energy sectors)
                                                                     shown in Fig. 1 based on recent advances.
and NH3 (mainly from the agricultural sector) are different
(Hoesly et al., 2018), the linear model between surface NO2          3.1    Conversion of the satellite NO2 and NH3 column to
and NH+   4 concentration may lead to large uncertainties in                surface Nr concentration
estimating the global NH+     4 concentration. There is still no
report about the satellite-derived dry and wet-reduced Nr de-        An ACTM can simulate the vertical profiles of NO2 and NH3
position using the satellite NH3 column at a global scale. As        with multiple layers from the surface to the troposphere. For
reduced Nr plays an important role in total Nr deposition,           example, the GEOS-Chem ACTM includes 47 vertical lay-
satellite NH3 should be better utilized to help estimate re-         ers from the earth’s surface to the top of the stratosphere.
duced Nr deposition.                                                 Most previous studies estimated the ratio of surface Nr con-
                                                                     centration (at the first layer) to total columns by an ACTM
2.4    Problems in estimating global Nr deposition                   and then multiply the ratio by satellite columns to estimate
                                                                     satellite-derived surface concentration (Geddes et al., 2016;
The spatial coverage of ground monitoring sites focusing on          Van der Graaf et al., 2018; Nowlan et al., 2014).
Nr deposition is still not adequate, and the monitoring stan-
dards and specifications in different regions of the world are

Atmos. Chem. Phys., 20, 8641–8658, 2020                                                https://doi.org/10.5194/acp-20-8641-2020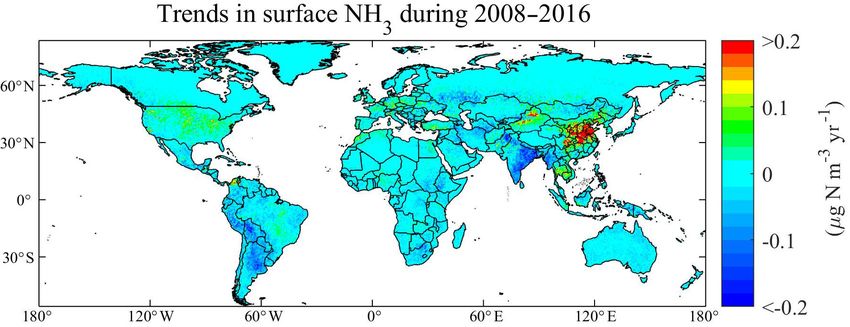
L. Liu et al.: Reviewing global estimates of surface reactive nitrogen concentration                                                         8645

Figure 1. Schematic diagram of dry and wet Nr deposition. (a) indicates the satellite-observed NO2 and NH3 column and the vertical profiles
by an ACTM; (b) shows dry and wet Nr deposition including the major Nr species (gaseous NO2 , HNO3 , NH3 , particulate NO−                   +
                                                                                                                                   3 and NH4 ,
as well as wet NO−        +
                 3 and NH4 in precipitation); (c) illustrates atmospheric vertical structures including the troposphere (satellite observation),
atmospheric boundary layer (ABL), and interfacial sub-layer; (d) and (e) represent procedures of calculating the dry and wet Nr deposition.

   Another approach tries to fit general vertical profiles of                   al., 2016)
NO2 and NH3 (Zhang et al., 2017; Liu et al., 2017b, c) and
                                                                                                     Z−Z0 2

                                                                                             −
then estimate the ratio of Nr concentration at any height to to-                ρ = ρmax e            σ
                                                                                                              ,                               (1)
tal Nr columns and finally multiply the ratio by satellite NO2
and NH3 columns. This approach has an advantage compared                        where Z is the height of a layer in the ACTM; ρmax ,
with the previous one because NO2 and NH3 concentration                         Z0 and σ are the maximum NO2 concentration, the cor-
at all altitudes included in ACTM simulations can be esti-                      responding height with the maximum NO2 concentra-
mated. Satellite NO2 and NH3 column data had no vertical                        tion and the thickness of the NO2 concentration layer (1
profiles. Surface NO2 and NH3 concentration was estimated                       standard error of the Gaussian function).
by modeled NO2 and NH3 vertical profiles from the CTM.                          There are two basic forms of profile shapes of NO2 :
The Gaussian model was constructed to fit the multiple lay-                     (1) NO2 concentration reaches the maximum concen-
ers’ NO2 and NH3 concentrations with the altitude. The con-                     tration when reaching a certain height (Zo 6 = 0). As the
structed Gaussian model has general rules, appropriate for                      height increases, the NO2 concentration begins to de-
converting satellite columns to surface concentration simply.                   cline; (2) NO2 concentration is basically concentrated
   Taking the estimation of surface NO2 concentration using                     on the earth’s surface (Zo = 0). These two cases are the
the latter approach as an example, the methods and steps are                    ideal state of the vertical distribution of NO2 concentra-
introduced in the following.                                                    tion. In reality, single Gaussian fitting may not capture
                                                                                the vertical distribution of NO2 well. To improve the ac-
  – Step 1: calculate the monthly mean NO2 concentrations                       curacy of fitting, the sum of multiple Gaussian functions
    at all layers simulated by an ACTM.                                         can be used (Liu et al., 2019):
                                                                                                                       Z−Z         2
                                                                                          Xn                                  0,i
                                                                                                                  −
  – Step 2: construct the vertical profile function of NO2 .                    ρ(Z) =           ρ      e                σi
                                                                                                                                         .    (2)
                                                                                              i=1 max,i
    Multiple Gaussian functions are used to fit the vertical
    distribution of NO2 based on the monthly NO2 con-                        – Step 3: calculate the ratio of NO2 concentration at the
                                                                                                                 Rh
    centrations at all layers calculated in Step 1, in which                   height of hG to total columns ( 0 trop ρ(Z)dx) and then
    the independent variable is the height (altitude) and the                  multiply the ratio by the satellite column (Strop ). The
    dependent variable is NO2 concentration at a certain                       satellite-derived Nr concentration at the height of hG
    height.                                                                    can be calculated as
     The basic form of the single Gaussian function is                                                 ρ (hG )
                                                                               SG_NO2 = Strop × R h              .                   (3)
                                                                                                     trop
     (Zhang et al., 2017; Liu et al., 2017b, c; Whitburn et                                        0      ρ(Z)dx

https://doi.org/10.5194/acp-20-8641-2020                                                     Atmos. Chem. Phys., 20, 8641–8658, 2020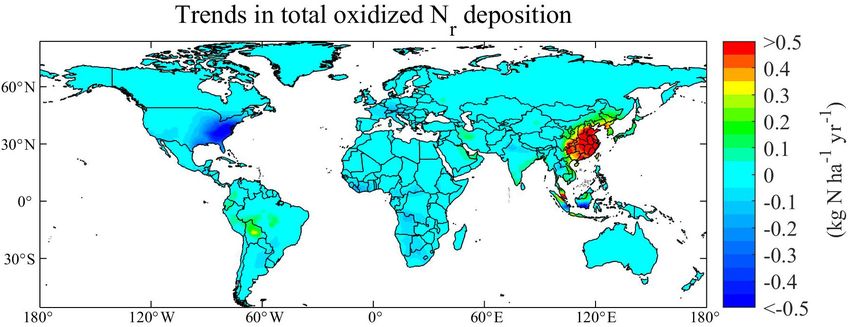
8646 L. Liu et al.: Reviewing global estimates of surface reactive nitrogen concentration
– Step 4: convert the instantaneous satellite-derived sur- The calculation of Co is very complex, including the leaf
face NO2 concentration (SG_NO2 ) to the daily average stomatal and soil emission potentials related to the meteo-
∗
(SG_NO2 ) using the ratio of average surface NO2 con- rological factors, the plant growth stage and the canopy type.
centration (G1−24
ACTM ) to that at satellite overpass time
The satellite-based methods usually neglected this complex
overpass process and set Co as zero (Van der Graaf et al., 2018; Kharol
(GACTM ) by an ACTM (Liu et al., 2020):
et al., 2018) or set fixed values in each land use type based
∗= G1−24
ACTM on ground-based measurements (Jia et al., 2016).
SG_NO2 overpass × SG_NO2 . (4)
GACTM
3.4 Wet deposition of Nr
The method for estimating the surface NH3 concentra-
∗
tion (SG_NH3 ) is similar to that for estimating the surface The satellite-based estimation of wet Nr deposition can be
NO2 concentration. simplified as the product of the concentration of Nr (C),
precipitation (P ) and scavenging coefficient (w) (Pan et al.,
3.2 Estimating surface concentrations of other Nr 2012). Satellite NO2 and NH3 can be used to indicate the
species oxidized Nr and reduced Nr ; precipitation (P ) can be ob-
tained from ground monitoring data or reanalysis data (such
At present, only the NO2 and NH3 column can be retrieved as NCEP). However, the scavenging coefficient (w) is usu-
reliably, and there are no reliable satellite retrievals of HNO3 , ally highly uncertain. To improve the accuracy of estimation,
NH+ −
4 and NO3 . For example, the IASI HNO3 product is still a mixed-effects model (Liu et al., 2017a; Zhang et al., 2018)
in the stage of data development and verification (Ronsmans is proposed to build the relationship between satellite NO2
et al., 2016). Previous studies firstly derive the relationship and NH3 , precipitation and ground monitoring wet Nr depo-
between Nr species by an ACTM or by ground-based mea- sition:
surements and then use the relationship to convert satellite-
derived surface NO2 and NH3 concentration (S∗G_NH3 ) to WetNij = αj + βi × Pij × (SABL )ij + εij , (9)
HNO3 , NH+ −
4 and NO3 concentrations:
R ABL
ρ(Z)dx
GACTM_NO3
SABL = Strop × R0h . (10)
∗ trop
GS_NO3 = SG_NO2 × GACTM_NO2 , ρ(Z)dx
0
∗ G
GS_HNO3 = SG_NO2 × GACTM_HNO3 , (5)
GS_NH4 = S ∗
ACTM_NO2
GACTM_NH4 WetNij is wet NO− +
3 N or NH4 –N deposition at month i and
G_NH3 × GACTM_NH3 .
site j ; (SABL )ij is the atmospheric boundary layer (ABL)
GACTM_NO3 GACTM_HNO3 GACTM_NH4 NO2 or NH3 columns at month i and site j ; Pij is precip-
GACTM_NO2 , GACTM_NO2 , and GACTM_NH3 are the estimated ra- itation at month i and site j ; βi and αj are the slope and
tios between NO2 and NO−
3, NO2 and HNO3 , and NH3 and intercept of random effects, representing seasonal variabil-
NH+ 4. ity and spatial effects, and εij represents the random error at
month i and site j . The mixed-effects models were appropri-
3.3 Dry deposition of Nr ate for estimating both wet NO− +
3 and NH4 deposition using
the satellite observations.
The resistance of dry Nr deposition mainly comes from three
The scavenging process of wet Nr deposition usually starts
aspects: aerodynamic resistance (Ra ), quasi laminar sub-
from the height of rainfall rather than the top of the tropo-
layer resistance (Rb ) and canopy resistance (Rc ). The Vd can
sphere, so it is more reasonable to use the NO2 and NH3
be expressed as
column below the height of rainfall to build the wet Nr de-
1 position model. The NO2 and NH3 column within the ABL
Vd = + vg . (6)
Ra + Rb + Rc is used to build the wet deposition model since precipitation
height is close to the height of the ABL (generally less than
Vg is gravitational settling velocity. For gases, the Vg is neg-
2–3 km).
ligible (Vg = 0).
Dry NO2 , NO− +
3 , HNO3 , and NH4 deposition can be cal-
culated by 4 Satellite-derived surface Nr concentration and
deposition
F = GS × Vd . (7)
Unlike the above species, NH3 is bi-directional, present- 4.1 Surface NO2 concentration and oxidized Nr
ing both upward and downward fluxes. There is a so-called deposition
“canopy compensation point” (Co ) controlling dry NH3 de-
position. Dry NH3 deposition can be calculated by The spatial resolutions of global ACTMs and therefore mod-
eled surface Nr concentration are very coarse (for example,
F = (GS_NH3 − Co ) × Vd . (8) the spatial resolution of the global version of GEOS-Chem
Atmos. Chem. Phys., 20, 8641–8658, 2020 https://doi.org/10.5194/acp-20-8641-2020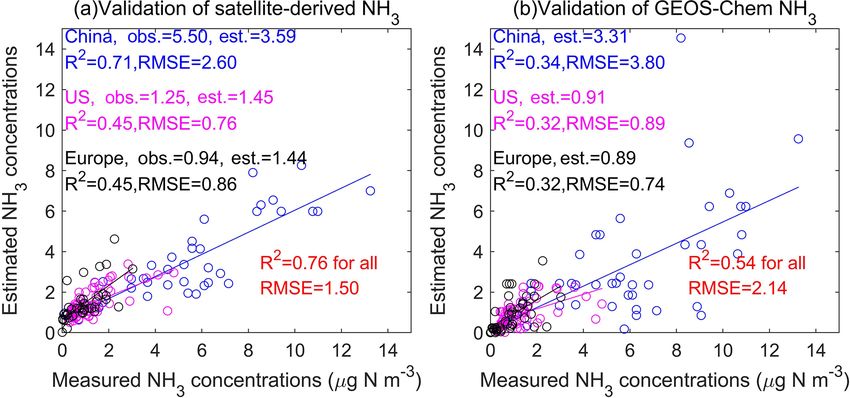
L. Liu et al.: Reviewing global estimates of surface reactive nitrogen concentration 8647
is 2◦ × 2.5◦ ). Thus it can be hard to estimate surface Nr con- captured 54 % of global NO2 variation, with an absolute error
centration and deposition at a fine resolution at a global scale of 2.32 µg N m−3 .
by ACTMs alone. Instead, the satellite Nr retrievals have a Zhang et al. (2017) followed the framework in Sect. 3
high spatial resolution and can reveal more spatial details to estimate the OMI-derived surface NO2 concentration (at
than ACTM simulations. ∼ 50 m) in China and found good agreement with ground-
Cheng et al. (2013) and Jia et al. (2016) established a lin- based surface NO2 concentration from the NNDMN at a
ear model between the surface NO2 concentration and NO2 yearly scale (slope = 1.00, R 2 = 0.89) (Zhang et al., 2017).
column by assuming the ratio of the surface NO2 concentra- The methods by Zhang et al. (2017) can also generate OMI-
tion to the tropospheric NO2 column to be fixed, then used derived NO2 concentration at any height by the constructed
the linear model to convert satellite NO2 columns to surface NO2 vertical profile (Zhang et al., 2017). Zhang et al. (2017)
NO2 concentration, and finally estimated dry NO2 deposition also estimated dry NO2 deposition using the OMI-derived
using the inferential method (Cheng et al., 2013; Jia et al., surface NO2 concentration by combining the modeled Vd
2016). However, these statistical methods are highly depen- during 2005–2016 (Zhang et al., 2017). Based on Zhang’s es-
dent on the ground-based measurements, and the established timates, the Gaussian function can well simulate the vertical
linear models may be ineffective over regions with few mon- distribution of NO2 from an ACTM (MOZART) (Emmons et
itoring sites. al., 2010), with 99.64 % of the grids having R 2 values higher
A comprehensive study (Nowlan et al., 2014) estimated than 0.99. This suggests that the ACTM-simulated vertical
global surface NO2 concentration during 2005–2007 by mul- distribution of NO2 has a general pattern, which can be emu-
tiplying OMI tropospheric NO2 columns by the ACTM- lated by Gaussian functions. Once a vertical profile has been
modeled ratio between the surface NO2 concentration and constructed, it can be easily used to estimate NO2 concentra-
tropospheric column (Fig. 2). Nowlan et al. (2014) also es- tion at any height.
timated dry NO2 deposition using the OMI-derived surface In this study, we used the framework in Sect. 3 to estimate
NO2 concentration by combining the modeled Vd during the OMI-derived surface NO2 concentration globally. To val-
2005–2007 (Nowlan et al., 2014). This approach followed idate the OMI-derived surface NO2 concentrations, ground-
an earlier study (Lamsal et al., 2008) that focused on North measured surface NO2 concentration in China, the US and
America. As reported by Lamsal et al., the satellite-derived Europe in 2014 was collected (Fig. 4). The total number of
surface NO2 concentration was generally lower than ground- NO2 observations in China, the US and Europe are 43, 373
based NO2 observations, ranging from −17 % to −36 % in and 88, respectively. The OMI-derived annual average for all
North America (Lamsal et al., 2008). Kharol et al. (2015) sites was 3.74 µg N m−3 , which was close to the measured
used a similar method and found the satellite-derived surface average (3.06 µg N m−3 ). The R 2 between OMI-derived sur-
NO2 concentration was only half of the ground-measured face NO2 concentrations and ground-based NO2 measure-
values in North America (Kharol et al., 2015). ments was 0.75 and the RMSE was 1.23 µg N m−3 (Fig. 5),
Geddes et al. (2016) followed previous studies and used which is better than the modeling results by the GEOS-
the NO2 column from GOME, SCIAMACHY, and GOME-2 Chem ACTM (R 2 = 0.43, RMSE = 1.93 µg N m−3 ). We did
to estimate surface NO2 concentration (Geddes et al., 2016). not simply use the relationship between the NO2 column and
Although Geddes et al. (2016) did not evaluate their results surface NO2 concentration from the CTM. As presented in
with ground-based observation (Geddes et al., 2016), it is the methods, we can estimate surface NO2 concentration at
obvious that their surface NO2 estimates were higher than any height by using the Gaussian function. We used the sur-
Nowlan’s estimates based on OMI (Nowlan et al., 2014) face NO2 concentration at a certain height (∼ 60 m) which
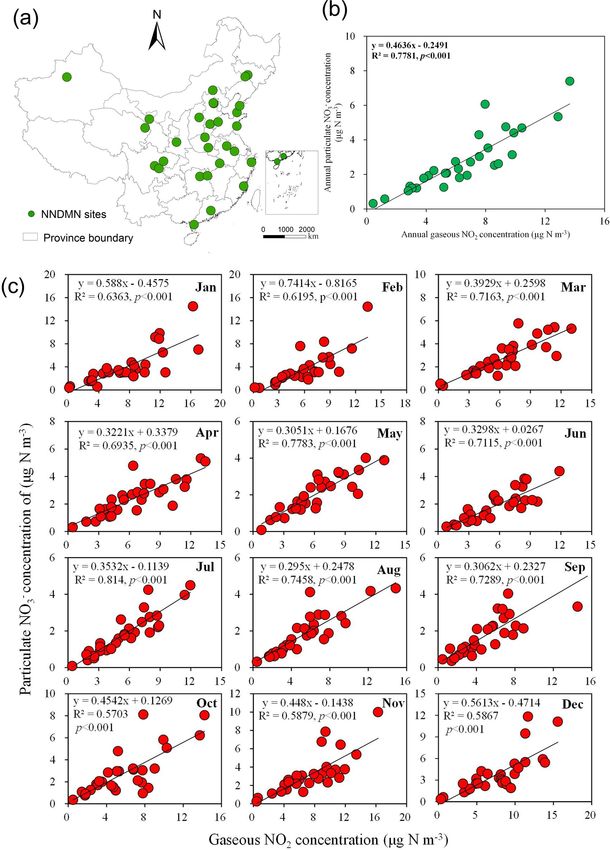
(Fig. 2). This may be because the OMI-derived NO2 column best matched with the ground-based measurements. Satellite-
is much lower than that derived by GOME, SCIAMACHY, based methods have the advantages of spatiotemporally con-
and GOME-2, especially over polluted regions. For example, tinuous monitoring Nr at a higher resolution, which helps al-
in China, the OMI NO2 column is about 30 % lower than that leviate the problem of the coarse resolution of ACTMs in
of SCIAMACHY and GOME-2 consistently (Fig. 3). estimating Nr concentration and deposition. The readers can
Larkin et al. (2017) established a land use regression use any satellite data (GOME, SCIAMACHY, GOME2 or
model to estimate global surface NO2 concentration by com- OMI) combining the Gaussian function to estimate surface
bining satellite-derived surface NO2 concentration by Ged- NO2 concentrations. They can use surface NO2 concentra-
des et al. (2016) and ground-based annual NO2 measure- tions at a certain height which best matched with the ground-
ments (Geddes et al., 2016; Larkin et al., 2017). The study based measurements. The key is not selecting which satellite
by Larkin et al. (2017) can be considered to use the ground- data we should use, but determining which height of surface
based annual measurements to adjust the satellite-derived NO2 concentrations better matched with the ground-based
surface NO2 concentration by Geddes et al. (2016), which measurements by a Gaussian function.
helped reduce the discrepancy between satellite-derived and For NO− 3 and HNO3 , previous studies firstly constructed
ground-measured NO2 concentration. The regression model the relationship between NO2 , NO− 3 and HNO3 and found a
relatively high linear relationship between NO2 , NO− 3 , and
https://doi.org/10.5194/acp-20-8641-2020 Atmos. Chem. Phys., 20, 8641–8658, 2020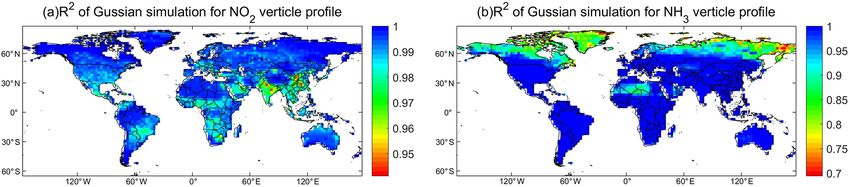
8648                                     L. Liu et al.: Reviewing global estimates of surface reactive nitrogen concentration

Figure 2. Satellite-derived surface NO2 concentration during 2005–2007 by Nowlan et al. (2014) (a) and by Geddes et al. (2016) (b). We
gained the surface NO2 concentration by Nowlan et al. (2014) and by Geddes et al. (2016) at the website: http://fizz.phys.dal.ca/~atmos/
martin/?page_id=232, last access: 17 July 2020.

Figure 3. An example of the time series of the monthly NO2 column retrieved by GOME, SCIAMACHY, GOME2 and OMI in China. We
obtained the GOME, SCIAMACHY, GOME2 and OMI data from http://www.temis.nl/airpollution/no2.html, last access: 17 July 2020.

HNO3 at a monthly or yearly scale. For example, Jia et                trate deposition over China (R = 0.83, RMSE = 0.72) (Liu
al. (2016) found a linear relationship between NO2 , NO−     3,       et al., 2017a).
and HNO3 concentration at an annual scale (R 2 = 0.70) (Jia
et al., 2016). Similarly, based on the ground-based measure-          4.2   Surface NH3 concentration and reduced Nr
ments in the NNDMN, a high correlation was found between                    deposition
surface NO2 and NO−    3 concentration at monthly or annual
timescales (Fig. 6) (Liu et al., 2017c). Using these linear re-
                                                                      With the development of atmospheric remote sensing of
lationships and satellite-derived surface NO2 concentration,
                                                                      NH3 , some scholars have estimated surface NH3 concentra-
the annual mean surface NO−    3 and HNO3 can be estimated.           tion and dry NH3 deposition based on the satellite NH3 col-
Alternatively, the relationship of NO2 , NO−  3 and HNO3 can          umn data. Assuming the ratio between the surface NH3 con-
also be modeled by an ACTM. For example, a strong rela-
                                                                      centration to the NH3 column was fixed, Yu et al. (2019) ap-
tionship of the tropospheric NO2 , NO−   3 and HNO3 column            plied a linear model to convert satellite NH3 columns to sur-
was simulated over all months by an ACTM, with the corre-
                                                                      face NH3 concentration and estimated dry NH3 deposition
lation ranging from 0.69 to 0.91 (Liu et al., 2017a). But, over
                                                                      in China using the inferential method (Yu et al., 2019). But
shorter timescales, the relationship between NO2 , NO−   3 and        Yu et al. (2019) did not consider the spatial variability of the
HNO3 may be nonlinear, which we should be cautious about
                                                                      vertical profiles of NH3 (Yu et al., 2019), which may cause a
when estimating surface NO−   3 and HNO3 concentration from           large uncertainty in estimating surface NH3 concentration.
NO2 concentration.
                                                                         In western Europe, Van der Graaf et al. (2018) used the ra-
   For the wet Nr deposition, Liu et al. (2017a) followed the
                                                                      tio of the surface NH3 concentration (in the bottom layer) to
framework in Sect. 3 to estimate wet nitrate deposition using
                                                                      total NH3 column from an ACTM to convert the IASI NH3
ABL NO2 columns derived from an OMI NO2 column and
                                                                      column to surface NH3 concentration and then estimated dry
NO2 vertical profile from an ACTM (MOZART), and pre-
                                                                      NH3 deposition by combining the modeled deposition ve-
cipitation by a mixed-effects model showing the proposed
                                                                      locity and IASI-derived surface NH3 concentration (Van der
model can achieve high predictive power for monthly wet ni-
                                                                      Graaf et al., 2018). Similarly, in North America, Kharol et
                                                                      al. (2018) estimated the dry NH3 deposition by the CrIS-

Atmos. Chem. Phys., 20, 8641–8658, 2020                                                  https://doi.org/10.5194/acp-20-8641-2020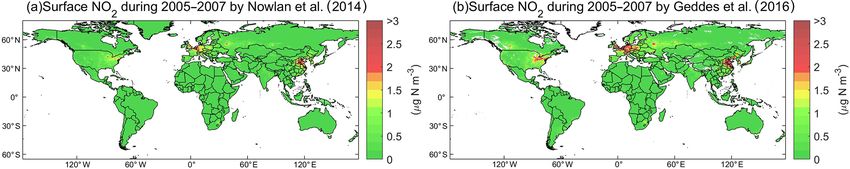
L. Liu et al.: Reviewing global estimates of surface reactive nitrogen concentration                                            8649

Figure 4. Spatial distribution of measured surface NO2 and NH3 concentrations in 2014. For NO2 (a), the measured data in China, the US
and Europe were obtained from the NNDMN, US-EPA and EMEP, respectively; for NH3 (b), the measured data in China, the US and Europe
were obtained from the NNDMN, US-AMoN and EMEP, respectively.

Figure 5. Comparison between annual mean satellite-derived and ground-measured surface NO2 concentrations (a) and comparison between
annual mean modeled (by an ACTM as GEOS-Chem) and ground-measured surface NO2 concentrations (b). The ground-based monitoring
sites are shown in Fig. 4.

derived surface NH3 concentration and deposition velocity of         ter accuracy (R 2 = 0.76, RMSE = 1.50 µg N m−3 ) than an
NH3 (Kharol et al., 2018). They found a relatively high cor-         ACTM (GEOS-Chem, R 2 = 0.54, RMSE = 2.14 µg N m−3 ).
relation (R = 0.76) between the CrIS-derived surface NH3             The satellite NH3 retrievals were affected by the detec-
concentration and AMoN measurements during warm sea-                 tion limits of the satellite instruments and thermal contrast.
sons (from April to September) in 2013 (Fig. 7). Over China,         Higher correlation over China than other regions for the
Liu et al. (2017b) found a higher correlation (R = 0.81)             satellite estimates was linked to the detection limits by the
between IASI-derived surface NH3 concentrations and the              instruments and thermal contrast (Liu et al., 2019). Higher
measured surface NH3 concentrations than those from an               accuracy could be gained with higher thermal contrast and
ACTM (R = 0.57, Fig. 8) (Liu et al., 2017b).                         NH3 abundance. Instead, the uncertainties of NH3 retrievals
   Liu et al. (2019) followed the framework in Sect. 3               would be higher with lower thermal contrast and NH3 abun-
to estimate the IASI-derived surface NH3 concentration               dance.
(at the middle height of the first layer by an ACTM)                    The proposed methods (Liu et al., 2019) can also estimate
(Fig. 9) and found a good agreement with ground-based                NH3 concentration at any height using the constructed verti-
surface NH3 concentration (Liu et al., 2019). The corre-             cal profile function of NH3 . The Gaussian function can well
lation between the measured and satellite-derived annual             emulate the vertical distribution of NH3 from an ACTM out-
mean surface NH3 concentrations over all sites was 0.87              put, with 99 % of the grids having R 2 values higher than 0.90
as shown in Fig. 10, while the average satellite-derived             (Fig. 11). This means, for regional and global estimation, the
and ground-measured surface NH3 concentrations were 2.52             vertical distribution of NH3 concentration has a general pat-
and 2.51 µg N m−3 in 2014 at the monitoring sites, re-               tern, which can be mostly emulated by the Gaussian function.
spectively. The satellite-derived estimates achieved a bet-          Once a global NH3 vertical profile was simulated, it can be

https://doi.org/10.5194/acp-20-8641-2020                                               Atmos. Chem. Phys., 20, 8641–8658, 2020
8650                                    L. Liu et al.: Reviewing global estimates of surface reactive nitrogen concentration

Figure 6. Correlation between surface NO2 and particulate NO− 3 concentration in the NNDMN at annual and monthly scales, which were
adopted from our previous study (Liu et al., 2017c). (a) indicates the spatial locations of monitoring sites in the NNDMN; (b) and (c)
represent yearly and monthly relationships between surface NO2 and particulate NO− 3 concentration, respectively.

Atmos. Chem. Phys., 20, 8641–8658, 2020                                                https://doi.org/10.5194/acp-20-8641-2020
L. Liu et al.: Reviewing global estimates of surface reactive nitrogen concentration                                           8651

Figure 7. Comparisons of the measured surface NH3 concentration by the AMoN and CrIS-derived surface NH3 concentration in the US
during the warm season (April–September) in 2013 (Kharol et al., 2018). (a) and (b) indicate measured and CrIS-derived surface NH3
concentration at the AMoN sites, respectively; (c) represents the comparison of averaged surface NH3 concentration during warm months
between CrIS-derived estimates and measurements, while (d) indicates the comparison of monthly surface NH3 concentration between
CrIS-derived estimates and measurements.

Figure 8. Comparisons of the measured surface NH3 concentration with IASI-derived surface NH3 concentration at the NNDMN sites over
China (Liu et al., 2017b). (a) indicates the comparison of measured and modeled surface NH3 concentration from an ACTM (MOZART),
and (b) represents the comparison of the measured and IASI-derived surface NH3 concentration.

https://doi.org/10.5194/acp-20-8641-2020                                              Atmos. Chem. Phys., 20, 8641–8658, 2020
8652 L. Liu et al.: Reviewing global estimates of surface reactive nitrogen concentration
inventory to drive an ACTM to simulate the long-term ox-
idized Nr deposition globally (Geddes and Martin, 2017).
They found oxidized Nr deposition from 1996 to 2014 de-
creased by 60 % in the eastern US, doubled in eastern China,
and declined by 20 % in western Europe (Fig. 12). We use
the datasets by Geddes et al. (2016) to calculate the trends
of total oxidized Nr deposition during 1996–2014 (Geddes
and Martin, 2017). It is obvious that two completely oppo-
site trends exist: (1) in eastern China with a steep increase of
higher than 0.5 kg N ha−1 yr−1 and (2) in eastern US with a
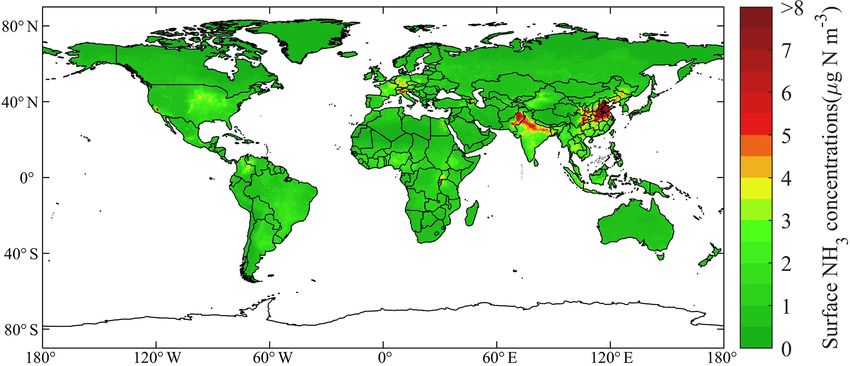
Figure 9. Spatially satellite-based surface NH3 estimates in 2014 steep decrease of lower than −0.5 kg N ha−1 yr−1 . Although
(Liu et al., 2019). The global surface NH3 concentration datasets
it is not a direct way to use satellite Nr observation to estimate
have been released on the website: https://zenodo.org/record/
3546517#.Xj6I4GgzY2w, last access: 17 July 2020.
Nr deposition, the method of estimating trends of Nr deposi-
tion by Geddes et al. (2016) can be considered effective since
it took account of the changes in both NOx emission and cli-
easily used to estimate satellite-derived NH3 concentration at mate by an ACTM (Geddes and Martin, 2017).
any height. We can also estimate dry NH3 deposition using Some researchers developed a more direct way to infer the
the IASI-derived surface NH3 concentration combining the trends of surface Nr concentration and deposition. Geddes et
modeled Vd . For the dry deposition, the uncertainty mainly al. (2016) presented a comprehensive long-term global sur-
came from the satellite-derived estimates using the modeled face NO2 concentration estimate (at 0.1◦ resolution using an
vertical profiles. The uncertainty of vertical profiles modeled oversampling approach) between 1996 and 2012 by using
by the ACTM mainly resulted from the chemical and trans- the NO2 column from GOME, SCIAMACHY, and GOME-
port mechanisms. We recommend using the Gaussian func- 2 (Geddes et al., 2016). The surface NO2 concentration in
tion to determine the height of surface NO2 and NH3 concen- North America (the US and Canada) decreased steeply, fol-
trations that best matched with the ground-based measure- lowed by western Europe, Japan and South Korea, but ap-
ments. There may exist systematic biases by simply using proximately tripled in China and North Korea (Geddes et al.,
the relationship of NO2 columns and surface concentration to 2016). Jia et al. (2016) established a simple linear regression
estimate satellite surface NO2 concentrations. To date, there model based on the OMI NO2 column and ground-based sur-
are still no studies developing satellite-based methods to es- face Nr concentration and then estimated the trends of dry Nr
timate the wet reduced Nr deposition on a regional scale. deposition globally between 2005 and 2014 (Jia et al., 2016).
They found that dry Nr deposition in eastern China increased
rapidly, while in the eastern US, western Europe, and Japan
5 Trends of surface Nr concentration and deposition by dry Nr deposition has decreased in recent decades.
satellite-based methods We used the proposed framework to estimate the long-term
surface NO2 concentrations by OMI during 2005–2016. Note
The Nr concentration and deposition modeled by ACTMs that the simulated profile function has a general rule, which
are highly dependent on the accuracy of input Nr emissions. can be well simulated by a Gaussian function for any year
The methods commonly used to estimate anthropogenic Nr (for our case during 2005–2016). The emission inventories
emissions are based on the data of human activities and should not affect the vertical profile shapes using a Gaus-
emission factors, which can be highly uncertain. The ACTM sian function, but the transport and chemical mechanism in
methods driven by the Nr emission inventory have relatively the CTM may affect the accuracy of the vertical profile dis-
poor timeliness and have limitations in monitoring the recent tribution. The satellite-based methods did not need to rely
trends of Nr deposition. on the accuracy of the statistical emission data. We split the
Satellite-based methods provide a simple, fast and rela- time span of 2005–2016 into two periods, 2005–2011 and
tively objective way to monitor Nr deposition at a high reso- 2011–2016, as surface NO2 concentration shows the oppo-
lution and are less susceptible to the errors in the assumptions site trend in China in these two periods. The magnitudes of
that emission inventories are based on, particularly the lack both growth and decline in surface NO2 concentration in
of reliable data on developing countries (Crippa et al., 2018). China are most pronounced worldwide in the two periods
With such advantages, researchers developed the satellite- (Fig. 13). During 2005–2011, apart from eastern China with
based methods to estimate surface Nr concentration, depo- the largest increase in surface NO2 concentration, there are
sition and even emissions. Satellite-based methods have ad- also several areas with increasing trends, such as northwest-
vantages in monitoring the recent trends of Nr deposition. ern and eastern India (New Delhi and Orissa), western Rus-
Geddes et al. (2016) used the NO2 column from GOME, sia, eastern Europe (northern Italy), western US (Colorado
SCIAMACHY, and GOME-2 to estimate satellite-derived and Utah), northwestern US (Seattle and Portland), south-
NOx emissions and then used the calibrated NOx emission western Canada (Vancouver, Edmonton, Calgary), northeast-
Atmos. Chem. Phys., 20, 8641–8658, 2020 https://doi.org/10.5194/acp-20-8641-2020L. Liu et al.: Reviewing global estimates of surface reactive nitrogen concentration 8653
Figure 10. Comparison between yearly satellite-based and measured surface NH3 concentrations (a) and comparison between yearly mod-
eling (by an ACTM as GEOS-Chem) and measured surface NH3 concentrations (b) (Liu et al., 2019). The ground-based monitoring sites
are shown in Fig. 4.
Figure 11. Spatial distributions of R 2 for a Gaussian function by simulating NH3 and NO2 vertical profiles. This is an example of Gaussian
fitting using 47 layers’ NH3 and NO2 concentration from an ACTM (GEOS-Chem).
ern Pakistan and northwestern Xinjiang (Urumqi). Notably,
the biggest decreases in surface NO2 concentration dur-
ing 2005–2011 occurred in the eastern US and western EU
(North France, southern England, and western Germany).
During 2011–2016, due to the strict control of NOx emis-
sions, eastern China had the largest decrease in surface NO2
concentration than elsewhere worldwide, followed by west-
ern Xinjiang, western Europe and some areas in western Rus-
sia.
Liu et al. (2019) estimated surface NH3 concentration
globally during 2008–2016 using satellite NH3 retrievals by
Figure 12. Gridded annual changes in total oxidized Nr de- IASI (Liu et al., 2019). A large increase in surface NH3 con-
position simulated by GEOS-Chem constrained with GOME, centrations was found in eastern China, followed by north-
SCIAMACHY, and GOME-2 NO2 retrievals during 1996–2014 ern Xinjiang Province in China during 2008–2016 (Fig. 14).
(Geddes and Martin, 2017). We gained the generated datasets Satellite-based methods have been proven as an effective and
(http://fizz.phys.dal.ca/~atmos/martin/?page_id=1520, last access: unique way to monitor the trends of global Nr concentration
17 July 2020) by Geddes et al. (2016) and calculated the trends and deposition. To date, there are still few studies report-
using the linear methods. ing the satellite-derived trends of reduced Nr deposition on
a global scale.
https://doi.org/10.5194/acp-20-8641-2020 Atmos. Chem. Phys., 20, 8641–8658, 20208654 L. Liu et al.: Reviewing global estimates of surface reactive nitrogen concentration
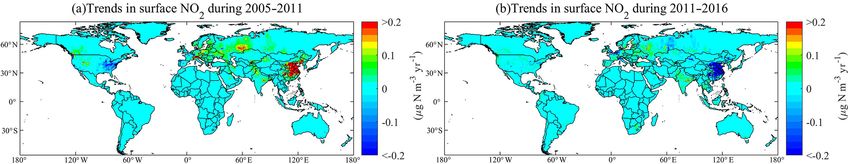
Figure 13. Gridded annual changes in surface NO2 concentrations gained by OMI retrievals during 2005–2011 (a) and during 2011–2016
(b) in this study. We have released the global surface NO2 concentrations during 2005–2016 available at the website: https://zenodo.org/
record/3546517#.Xj6I4GgzY2w, last access: 17 July 2020.
spatial resolution of satellite observation, but this is not as vi-
able for global ACTMs (e.g., MOZART, GEOS-Chem) due
to differences in model structures and computational cost.
The modeled ratio of surface Nr concentration to the Nr col-
umn may have variability at spatial scales finer than the hor-
izontal resolution of global ACTMs. The impact of such a
scale effect (at different spatial scales) on estimated surface
Nr concentration should be further studied.
Third, the satellite observation can only obtain a reliable
Figure 14. Gridded annual changes in surface NH3 concentra- NO2 and NH3 column presently, and there are no avail-
tions gained by IASI retrievals during 2008–2016 (Liu et al., able high-resolution and reliable direct HNO3 , NO−
2019). We have released the global surface NH3 concentrations dur- 3 , and
NH+ 4 retrievals. For HNO 3 , NO −
3 , and NH+
4 concentrations,
ing 2008–2016 at the website: https://zenodo.org/record/3546517#
.Xj6I4GgzY2w, last access: 17 July 2020.
the satellite-based methods often applied the satellite-derived
NO2 and NH3 concentration and the relationship between Nr
species from an ACTM (or ground-based measurements) to
estimate surface HNO3 , NO− +
3 , and NH4 concentration. With
6 Remaining challenges for estimating Nr deposition
the development of satellite technology, more and more Nr
using satellite observation
species can be detected, such as HNO3 . However, at present,
First, the reduced Nr deposition makes an important contri- satellite HNO3 products are not mature, and the spatial res-
bution to total Nr deposition. NH3 exhibits bi-directional air– olution is low. Direct, high-resolution and reliable satellite
surface exchanges. The NH3 compensation point (Farquhar monitoring of more Nr species is critical to further devel-
et al., 1980) is also an important and highly variable factor oping the use of atmospheric remote sensing to estimate Nr
controlling dry NH3 deposition (Schrader et al., 2016; Zhang deposition at global and regional scales.
et al., 2010). However, the current existing satellite-based Fourth, estimating wet Nr deposition using the satellite
methods did not consider this bi-directional air–surface ex- NO2 and NH3 column remains relatively uncommon. Further
change. It is important to better parameterize the NH3 com- studies should focus on how to combine the high-resolution
pensation point and assess the effects of bi-directional air– satellite NO2 and NH3 column and the ground-based moni-
surface exchanges on estimating the dry NH3 deposition. toring data to build wet Nr deposition models to estimate wet
Second, the existing satellite-based methods to estimate Nr Nr deposition at a higher spatiotemporal resolution. The pro-
deposition used the ratio of the surface Nr concentration to posed scheme to estimate the wet Nr deposition in Sect. 3
the Nr column by an ACTM to convert satellite Nr column to is statistical. As far as we know, previous studies using the
surface Nr concentration. However, the calculated ratio (by satellite NO2 and NH3 column to estimate wet Nr deposi-
an ACTM) and the satellite Nr column have different spatial tion used a statistical way, and no studies were done from a
resolutions, and previous studies usually applied the modeled mechanism perspective. The wet Nr deposition includes the
ratio directly or interpolated the ratio into the resolution of scavenging processes of in-cloud, under-cloud and precipita-
the satellite Nr column. This method assumes the relationship tion. Processed-level knowledge and models can benefit the
at coarse resolution by an ACTM can also be effective at fine estimation of wet Nr deposition using the satellite NO2 and
resolution, as the satellite indicated. When regional studies NH3 column.
are conducted, regional ACTMs coupled with another mete-
orological model (e.g., WRF-Chem, WRF-CMAQ) (Grell et
al., 2005; Wong et al., 2012) can be configured to match the
Atmos. Chem. Phys., 20, 8641–8658, 2020 https://doi.org/10.5194/acp-20-8641-2020L. Liu et al.: Reviewing global estimates of surface reactive nitrogen concentration 8655
7 Conclusions Competing interests. The authors declare that they have no conflict
of interest.
The recent advances of satellite-based methods for estimat-
ing surface Nr concentration and deposition have been re-
viewed. Previous studies have focused on using the satellite Acknowledgements. This study is supported by the National Nat-
NO2 column to estimate surface NO2 concentrations and dry ural Science Foundation of China (nos. 41471343, 41425007, and
NO2 deposition both regionally and globally. The research 41101315) and the Chinese National Programs on Heavy Air Pollu-
on calculating surface NH3 concentration and reduced Nr tion Mechanisms and Enhanced Prevention Measures (Project no. 8
deposition by satellite NH3 data is just beginning, and some in the 2nd Special Program). The analysis in this study is supported
by the Supercomputing Center of Lanzhou University.
scholars have carried out estimations of surface NH3 concen-
tration and dry NH3 deposition on different spatial and tem-
poral scales, but the research degree is still relatively low. We
Financial support. This research has been supported by the Na-
present a framework of using the satellite NO2 and NH3 col-
tional Natural Science Foundation of China (grant nos. 41471343,
umn to estimate Nr deposition based on recent advances. The 41425007, and 41101315).
proposed framework of using a Gaussian function to model
vertical NO2 and NH3 profiles can be used to convert the
satellite NO2 and NH3 column to surface NO2 and NH3 con- Review statement. This paper was edited by Eliza Harris and re-
centration at any height simply and quickly. The proposed viewed by two anonymous referees.
framework of using the satellite NO2 and NH3 column to
estimate wet Nr deposition is a statistical way, and further
studies should be done from a mechanism perspective. Fi- References
nally, we summarized current challenges of using the satellite
NO2 and NH3 column to estimate surface Nr concentration Amos, H. M., Jacob, D. J., Holmes, C. D., Fisher, J. A., Wang,
and deposition, including a lack of considering NH3 bidi- Q., Yantosca, R. M., Corbitt, E. S., Galarneau, E., Rutter, A. P.,
rectional air–surface exchanges and the problem of different Gustin, M. S., Steffen, A., Schauer, J. J., Graydon, J. A., Louis,
spatial scales between an ACTM and satellite observation. V. L. St., Talbot, R. W., Edgerton, E. S., Zhang, Y., and Sunder-
land, E. M.: Gas-particle partitioning of atmospheric Hg(II) and
its effect on global mercury deposition, Atmos. Chem. Phys., 12,
Data availability. OMI NO2 datasets are available at http://www. 591–603, https://doi.org/10.5194/acp-12-591-2012, 2012.
temis.nl/airpollution/no2.html, last access: 17 July 2020. IASI NH3 Atmospheric Spectroscopy Group at Université libre de Bruxelles:
datasets are available at https://cds-espri.ipsl.upmc.fr/etherTypo/ available at: https://cds-espri.ipsl.upmc.fr/etherTypo/index.php?
index.php?id=1700&L=1, last access: 17 July 2020. Surface NO2 id=1700&L=1, last access: 17 July 2020.
concentration during 2005–2007 obtained by Nowlan et al. (2014) Atmospheric Composition Analysis Group at Dalhousie University:
and long-term estimates (1996–2012) by Geddes et al. (2016) available at: http://fizz.phys.dal.ca/~atmos/martin/?page_id=232
are available at http://fizz.phys.dal.ca/~atmos/martin/?page_id= and http://fizz.phys.dal.ca/~atmos/martin/?page_id=1520, last
232, last access: 17 July 2020. Total oxidized Nr deposition simu- access: 17 July 2020.
lated by GEOS-Chem constrained with GOME, SCIAMACHY, and Beer, R., Shephard, M. W., Kulawik, S. S., Clough, S. A., Elder-
GOME-2 NO2 retrievals during 1996–2014 (Geddes and Martin, ing, A., Bowman, K. W., Sander, S. P., Fisher, B. M., Payne, V.
2017) is available at http://fizz.phys.dal.ca/~atmos/martin/?page_ H., Luo, M., Osterman, G. B., and Worden, J. R.: First satellite
id=1520, last access: 17 July 2020. A database of atmospheric observations of lower tropospheric ammonia and methanol, Geo-
Nr concentration and deposition from the nationwide monitoring phys. Res Lett., 35, 1–5, https://doi.org/10.1029/2008GL033642,
network in China is available at https://www.nature.com/articles/ 2008.
s41597-019-0061-2, last access: 17 July 2020. Measured Nr con- Bobbink, R., Hicks, K., Galloway, J., Spranger, T., Alkemade, R.,
centration and deposition datasets in the United States are avail- Ashmore, M., Bustamante, M., Cinderby, S., Davidson, E., Den-
able on the website: https://www.epa.gov/outdoor-air-quality-data, tener, F., Emmett, B., Erisman, J.-W., Fenn, M., Gilliam, F.,
last access: 17 July 2020. Measured surface NO2 and NH3 con- Nordin, A., Pardo, L., and De Vries, W.: Global assessment of
centration datasets in Europe are available at https://www.nilu.no/ nitrogen deposition effects on terrestrial plant diversity: a synthe-
projects/ccc/emepdata.html, last access: 17 July 2020. Global sur- sis, Ecol. Appl., 20, 30–59, https://doi.org/10.1890/08-1140.1,
face NO2 and NH3 concentration data used to calculate the long- 2010.
term trends in Fig. 13 and Fig. 14 have been released on the web- Boersma, K. F., Eskes, H. J., Dirksen, R. J., van der A, R. J.,
site: https://zenodo.org/record/3546517#.Xj6I4GgzY2w, last ac- Veefkind, J. P., Stammes, P., Huijnen, V., Kleipool, Q. L., Sneep,
cess: 17 July 2020. M., Claas, J., Leitão, J., Richter, A., Zhou, Y., and Brunner, D.:
An improved tropospheric NO2 column retrieval algorithm for
the Ozone Monitoring Instrument, Atmos. Meas. Tech., 4, 1905–
1928, 10.5194/amt-4-1905-2011, 2011.
Author contributions. LL designed this study. LL, YYY and WX
Canfield, D. E., Glazer, A. N., and Falkowski, P. G.: The evolu-
conducted the data analysis. All the co-authors contributed to the
tion and future of Earth’s nitrogen cycle, Science, 330, 192–196,
revision of the paper.
2010.
https://doi.org/10.5194/acp-20-8641-2020 Atmos. Chem. Phys., 20, 8641–8658, 2020You can also read