The effect of COVID19 pandemic restrictions on an urban rodent population
←
→
Page content transcription
If your browser does not render page correctly, please read the page content below
www.nature.com/scientificreports
OPEN The effect of COVID19 pandemic
restrictions on an urban rodent
population
Miguel A. Bedoya‑Pérez 1,2,3*, Michael P. Ward 4
, Max Loomes 1,2
, Iain S. McGregor
1,2,5
& Mathew S. Crowther 3
Shortly after the enactment of restrictions aimed at limiting the spread of COVID-19, various local
government and public health authorities around the world reported an increased sighting of rats.
Such reports have yet to be empirically validated. Here we combined data from multi-catch rodent
stations (providing data on rodent captures), rodent bait stations (providing data on rodent activity)
and residents’ complaints to explore the effects of a six week lockdown period on rodent populations
within the City of Sydney, Australia. The sampling interval encompassed October 2019 to July 2020
with lockdown defined as the interval from April 1st to May 15th, 2020. Rodent captures and activity
(visits to bait stations) were stable prior to lockdown. Captures showed a rapid increase and then
decline during the lockdown, while rodent visits to bait stations declined throughout this period.
There were no changes in the frequency of complaints during lockdown relative to before and after
lockdown. There was a non-directional change in the geographical distribution of indices of rodent
abundance suggesting that rodents redistributed in response to resource scarcity. We hypothesize
that lockdown measures initially resulted in increased rodent captures due to sudden shortage of
human-derived food resources. Rodent visits to bait stations might not show this pattern due to
the nature of the binary data collected, namely the presence or absence of a visit. Relocation of bait
stations driven by pest management goals may also have affected the detection of any directional
spatial effect. We conclude that the onset of COVID-19 may have disrupted commensal rodent
populations, with possible implications for the future management of these ubiquitous urban
indicator species.
Commensal rodents are abundant and pervasive pest species that cause vast damage to infrastructure, destroy
crops, and spread diseases1–5. In urban areas, when a rodent pest becomes overabundant they contaminate food,
damage infrastructure, increase risk of fire by gnawing on electrical wiring and pose a risk to public health as
diseases carriers2,5–14. Annually, pest rodents cost billions of dollars in losses of food15,16. In many cases, pest
rodents have become dependent on humans for food and harborage. Changes in human behaviors are known
to affect commensal rodent populations17. Rodent abundance in cities is closely linked to socioeconomic con-
ditions, accessibility to structures that offer nesting places, and human-derived food resources17,18. For these
reasons, rodent control methods commonly include strategies to limit access to public garbage containers and
potential nesting places19.
Previous studies indicate that changes in human behavior following natural catastrophes can result in changes
opulations20–22. For example, large storms such as hurricanes, often cause large spikes in rodent abundance
in rat p
in urban environments21,22, perhaps due to a process known as counter-urbanization23–25. Natural disasters typi-
cally cause emigration of the urban human population which increases the abandonment of idle or degraded
infrastructure and thus increases the availability of habitat for pest species26. For example, abandonment of urban
environments in New Orleans following Hurricane Katrina appeared to drive an increase in the commensal
rodent populations25. This increase in commensal rodent abundance can potentially increase the risk of zoonotic
diseases transmission in the area (e.g. hantavirus disease and bartonellosis)10–12.
1
Brain and Mind Centre, The University of Sydney, Sydney, NSW 2050, Australia. 2School of Psychology, The
University of Sydney, Faculty of Science, Sydney, NSW 2006, Australia. 3School of Life and Environmental
Sciences, The University of Sydney, Faculty of Science, Sydney, NSW 2006, Australia. 4Sydney School of Veterinary
Science, The University of Sydney, Faculty of Science, Sydney, NSW 2570, Australia. 5Lambert Initiative for
Cannabinoid Therapeutics, The University of Sydney, Sydney, NSW 2050, Australia. *email: miguel.bedoyaperez@
sydney.edu.au
Scientific Reports | (2021) 11:12957 | https://doi.org/10.1038/s41598-021-92301-0 1
Vol.:(0123456789)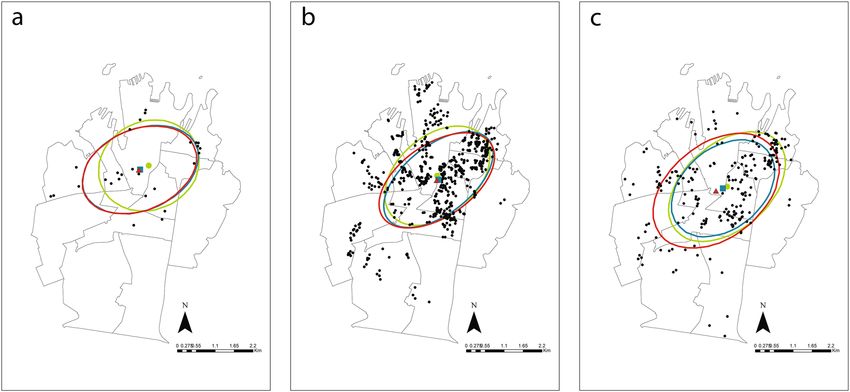
www.nature.com/scientificreports/
The appearance and rapid spread of SARS-CoV-2 in the human population during 2020 and 2021 is another
form of natural disaster with profound effects on human behavior, particularly in urban environments. Some
animal species may benefit from such a reduction in human activity, while others experience negative impacts
from what has been called the “anthropause”27. The abrupt manifestation of COVID-19 in early 2020, forced
governments around the world to enact preventative measures aimed at limiting the spread of SARS-CoV-2.
These included mandatory social distancing, mandatory confinement to home (“lockdown”), and the closure or
restricted operation of cafés, pubs, clubs, restaurants and supermarkets. Urban-dwelling species that are highly
dependent on discarded or provided human food stuffs are expected to struggle under such conditions27. Thus,
unsurprisingly, shortly after restrictions were enacted, reports from various local governments and public health
authorities linked the closures of restaurants and food-related venues to increased sightings of rats28–34. Some
of these reports described rodents engaging in atypical behaviors, such as rats being active during the day and
in close proximity to h umans35–37, as well as rats consuming conspecifics (e.g. muricide or cannibalism)31,38. A
perceived increase in the abundance of rats is an unwelcome phenomenon for most city dwellers with adverse
effects on the mental health of vulnerable individuals39. Given the multiplicity of significant implications for
public health7–9,35–37,40, it is important to better understand how urban rodent populations have been impacted
by COVID-19.
Parsons et al. released a preprint in which they investigated how stay-at-home measures affected rat sightings
in various urbanized environments. They analyzed rat-related public complaints in New York City and Tokyo and
surveyed pest control companies in the United States, Canada, Japan and Poland41. They reported that the two
cities displayed a different patterns of rat-related public requests, with increases in Tokyo and decreases in New
York City41. Importantly, they reported a positive association between rat sightings and food service establish-
ments in both cities, with the formation of new rat sighting hotspots during the lockdown period41. Parsons et al.
argued that the strong association between rat sightings and cafes or restaurants, as well as the development of
new rat sightings hotspots, suggested mass movements of rats had been triggered by lockdown. Moreover, they
suggest that this pattern was not observed in Warsaw, Poland due to the lack of clustering of restaurants41. An
important limitation of Parsons et al.41 was that it used public perception as a proxy for rodent abundance and
movements. Although there can be a reliable relationship between public complaints and rodent abundance42,
this has not been validated during abnormal times such as COVID-19. It could be, for example, that public
perceptions of rodent abundance are affected by cognitive and observational biases potentiated by COVID-19
restrictions and the increased use of social m edia39,43,44.
Here we aimed to more objectively determine how the COVID-19 pandemic restrictions affected pest rodent
abundance over time within the City of Sydney Local Government Area, New South Wales, Australia. From Janu-
ary 2020, the New South Wales State Government enacted a series of preventative measures to limit the spread
of COVID-19. These preventative measures included limits on the number of attendees at social gatherings,
mandatory 14 days self-quarantine of all travelers entering Australia, mandatory closure of all non-essential
businesses, restrictions for restaurant and cafes to only operate as “take-away”, as well as border closures with
other Australian States and Territories. Similar to other parts of the world, shortly after these measurements were
put in place, different media outlets started to anecdotally report an increase in rodent s ightings31–33. The City of
Sydney Council routinely traps and poisons rodents as part of their pest monitoring and control program and
also compiles resident complaints. Here we used data from three sources to determine whether the enactment
of COVID-19 preventative measures affected objective measures of the rodent pest population. These measures
were (1) number of captures of rodents across up to 60 Flick SMART Multi-Catch rodent stations deployed by
Council, (2) visitation by rodents at up to 942 bait stations deployed by Council, and (3) the number of rodent
related residents’ complaints made to Council.
Given the unprecedented circumstances around COVID-19 restrictions, it is difficult to predict the exact
effects they would have on urban pest rodent populations. Based on counter-urbanization studies20–22, 24, and
recent hypotheses advanced by the scientific c ommunity27, we constructed the following predictions. We pre-
dicted that the pest rodent population inhabiting the City of Sydney Council would have suffered a significant
reduction in numbers and activity during the COVID-19 restrictions, and that these effects might be reflected in
the number of resident’s rodent related complaints received by the council during this period. We hypothesized
that the anecdotal reports of increases in rodent sightings by media outlets31,45,46 might be a consequence of a
reduction in food resources, in turn driving animals to engage in “bold” behaviors during foraging leading to
increased captures and visits to bait s tations47–50. Finally, based on Parsons et al.41, we predicted spatial shifts in
rodent captures, activity, and rodent related complaints during lockdown.
Results
Trapping success. Results are reported across the three periods under consideration, namely Pre-lockdown
(October 1st, 2019 to March 31st, 2020), Lockdown (April 1st to May 15th, 2020) and Post-Lockdown (May 16th
to July 31st, 2020). The mean number of active Multi-Catch rodent stations per day during the entire sampling
period (1st October 2019 to 31st July 2020) was 36.96 ± SE: 0.91 (Pre-lockdown 25.90 ± SE: 0.63; Lockdown
59.00 ± SE: 0.21; Post-lockdown 50.38 ± SE: 0.93). A total of 38 locations were sampled across all three periods;
22 locations were sampled during two of the three periods and only four were sampled during a single period.
A total of 851 rodents were captured during 305 days of deployment (mean: 2.79 ± SE: 0.469 per trap day).
Overall, trapping success (i.e. number of captures and probability of capture) was affected by Period (i.e. Pre-
lockdown, Lockdown and Post-lockdown) (χ22 = 8.580; P = 0.014; Table 1). However, the overall number of rats
caught per trap day did not differ between periods (Tukey’s HSD: Pre-lockdown vs Lockdown, P = 0.881; Pre-
lockdown vs Post-lockdown, P = 0.288; and Lockdown vs Post-lockdown, P = 0.165; Table 1, Fig. 1a).
Scientific Reports | (2021) 11:12957 | https://doi.org/10.1038/s41598-021-92301-0 2
Vol:.(1234567890)www.nature.com/scientificreports/
Conditional model fixed effects Estimate SE z P
(Intercept) − 2.639 0.325 − 8.110 < 0.0001
Lockdown 4.497 2.286 1.967 0.049
Post-lockdown − 5.133 2.372 − 2.164 0.031
Pre-lockdown (date) − 0.001 0.002 − 0.523 0.601
Lockdown (date) − 0.023 0.011 − 2.089 0.037
Post-lockdown (date) 0.020 0.009 2.274 0.023
Zero-inflation model fixed effects
(Intercept) − 2.013 1.326 − 1.518 0.129
Lockdown 35.800 11.520 3.108 0.002
Post-lockdown − 2.771 3.715 − 0.746 0.456
Pre-lockdown (date) 0.004 0.006 0.700 0.484
Lockdown (date) − 0.179 0.060 − 2.990 0.003
Post-lockdown (date) 0.019 0.013 1.410 0.158
Analysis of deviance table (Type III Wald chi-square tests)
Fixed factors d.f. Wald-χ2 P
(Intercept) 1 65.778 < 0.0001
Period 2 8.580 0.014
Period (date) 3 9.810 0.020
Post-hoc Tukey adjusted pairwise comparison on the conditional model
Period contrast Ratio SE d.f. t ratio P
Pre-lockdown/lockdown 1.113 0.249 5251 0.480 0.881
Pre-lockdown/post-lockdown 0.716 0.159 5251 − 1.507 0.288
Lockdown/post-lockdown 0.643 0.156 5251 − 1.815 0.165
Post-hoc Tukey adjusted pairwise comparison on the zero-inflated model
Period contrast Odds ratio SE d.f. t ratio P
Pre-lockdown/lockdown 4.671 6.051 5251 1.190 0.459
Pre-lockdown/post-lockdown 0.176 0.149 5251 − 2.055 0.100
Lockdown/post-lockdown 0.038 0.043 5251 − 2.881 0.011
Table 1. Model summary, analysis of deviance (Wald Chi-squared tests) and Post-hoc Tukey adjusted pairwise
comparisons for the model constructed to test trapping success per Multi-Catch Rodent station and day
according to date and COVID-19 restriction period. Model structure: Captures ~ Period + Period(Date) + offset
(Log (Active Traps)) + Random (Location); Zero-inflation: ~ Period + Period(Date); Family: Negative Binomial.
Data comprised daily captures from 20 to 60 multi-catch rodent stations deployed across the Council of the
City of Sydney from October 2019 to July 2020. Bold values represent statistical significance (P < 0.05).
The probability of capture per trap day was highest Post-lockdown and lowest during Lockdown (Tukey’s
HSD: Pre-lockdown vs Lockdown, P = 0.459; Pre-lockdown vs Post-lockdown, P = 0.100; and Lockdown vs Post-
lockdown, P = 0.011; Table 1, Fig. 1b). Trapping success was also affected by date within each period (χ23 = 9.810;
P = 0.020; Table 1). Captures per trap and probability of capture per trap remained stable over Pre-lockdown
(Conditional model: z = − 0.523; P = 0.601; Zero-inflated model: z = 0.700; P = 0.484; Table 1, Fig. 2a); and
decreased over time during Lockdown (Conditional model: z = 7.000; P = 0.037; Zero-inflated model: z = − 2.990;
P = 0.003; Table 1, Fig. 2a). During Post-lockdown, only captures per trap, but not the probability of capture
per trap, increased over time (Conditional model: z = 2.274; P = 0.023; Zero-inflated model: z = 1.410; P = 0.158;
Table 1, Fig. 2a).
Rodent visitation to bait stations. Results are reported across the three periods under consideration,
namely Pre-lockdown (October 2nd, 2019 to March 31st, 2020), Lockdown (April 1st to May 15th, 2020) and
Post-Lockdown (May 16th to August 11th, 2020). Note the sampling period is slightly longer for bait station data
than for trapping data. The bait stations employed by council provided only binary data on whether there had
been a visit during the intervening period since the station was last checked. With routine bait station relocations
by the Council’s pest management contractors, a total of 661 unique locations were recorded during the entire
sampling period. The mean number of rodent bait stations checked per day during the entire sampling period
was 51.45 ± SE: 1.68 (54.66 ± SE: 2.05 Pre-lockdown; 41.30 ± SE: 3.93 during Lockdown; and 45.18 ± SE: 4.01
Post-lockdown). There were 376 locations sampled across all three periods; 50 locations were sampled only dur-
ing two of the three periods and 235 were sampled during only a single period. Average rodent visitation per bait
station per day, over 345 days of deployment was recorded as 0.516 ± SE: 0.052 (0 = Not visited and 1 = Visited).
Rodent visitation per bait station per day was affected by period (χ22 = 46.502; P < 0.0001; Table 2). The high-
est visitation per bait station per day was recorded Pre-lockdown (Tukey’s HSD, P < 0.0001, Table 2, Fig. 1c), the
lowest Post-lockdown (Tukey’s HSD, P < 0.0001, Table 2, Fig. 1c), with visitation per bait station per day during
Lockdown at an intermediate level (Tukey’s HSD, P < 0.0001, Table 2, Fig. 1c). Rodent visitation was also affected
Scientific Reports | (2021) 11:12957 | https://doi.org/10.1038/s41598-021-92301-0 3
Vol.:(0123456789)www.nature.com/scientificreports/
Figure 1. Rodent captures per trap day (a), probability of rodent captures per trap day (b), rodent visitation at
bait stations (c) and rodent related residents’ complaints (d) recorded by the Council of the City of Sydney, prior
during and post COVID-19 restrictions and social distancing measures imposed by the New South Wales State
government (Mean ± SE). Superscripts represent Tukey-adjusted pairwise comparisons (α = 0.05).
by date within each period (χ23 = 68.014; P < 0.0001; Table 2). Pre-lockdown, rodent visitation per bait station
remained stable over time (z = 1.724; P = 0.085; Table 2, Fig. 2b); and decreased over time during Lockdown and
Post-lockdown (z = − 7.639; P < 0.0001; and z = − 2.624; P = 0.009, respectively; Table 2, Fig. 2b).
Rodent related residents’ complaints. Residents’ complaints are reported across the three periods
under consideration, namely Pre-lockdown (January 7th, 2019 to March 31st, 2020), Lockdown (April 1st to
May 15th, 2020) and Post-Lockdown (May 16th to July 31st, 2020). Note the sampling period is slight longer
than for both bait station and trapping data. The City of Sydney Council received 242 rodent related complaints
during the entire interval under consideration; mean: 0.423 ± SE: 0.031 complaints per day. There were 161
(66.5%) complaints received through the Councils website, 72 (29.8%) through emails, and 9 (3.7%) by phone.
Across the 33 suburbs and 23 localities within the Council, complaints were received from only 22 suburbs (Pre-
lockdown 18 suburbs; Lockdown 10 suburbs; Post-lockdown 12 suburbs). Complaints were received from five
suburbs during all three periods, eight suburbs during two periods and nine suburbs during a single period. The
number of complaints per day received by the Council was not affected by period (χ22 = 1.207; P = 0.547; Table 3,
Fig. 1d) or date within period (χ23 = 1.612; P = 0.657; Table 3, Fig. 2c).
Spatial analysis of trapping success, rodent visitation and residents’ complaints. Multi-Catch
rodent stations were operated within seven of the eleven Statistical Areas Level 2 (SA2) that contain the Council,
whereas rodent bait stations were operated in all eleven SA2. Rodent related residents’ complaints were made in
all SA2 (Fig. 3). For all three measures of rodent activity (trapping, bait station visitation and complaints) their
mean centers and directional ellipses were approximately equivalent during the Pre-lockdown, Lockdown and
Post-lockdown periods (Fig. 4a–c). The spatial distribution of trapping success did not differ (i.e. significant cor-
relation) between Pre- versus Post-lockdown periods (rSP 0.829, P = 0.021), but was different (i.e. correlation not
significant) during Lockdown relative to both Pre- (rSP 0.270, P = 0.558) and Post-lockdown (rSP 0.679, P = 0.094).
The spatial distribution of rodent visitation differed (i.e. correlation not significant) across all periods: Pre-lock-
down relative to Lockdown ( rSP 0.582, P = 0.060) and Post-lockdown ( rSP 0.591, P = 0.056); and Lockdown rela-
Scientific Reports | (2021) 11:12957 | https://doi.org/10.1038/s41598-021-92301-0 4
Vol:.(1234567890)www.nature.com/scientificreports/
Figure 2. Estimated rodent captures per trap (a), rodent visitation per bait station (b), and rodent related
complaints (c), received by the Council of the City of Sydney over time. The shaded grey area represents
the standard error of the mean (SE). Dashed vertical lines represent the start and end points of COVID-19
restrictions and social distancing measures imposed by the New South Wales State Government.
tive to Post-lockdown (rSP 0.518, P = 0.102). The spatial distribution of rodent related residents’ complaints did
not change (i.e. significant correlation) from Pre-lockdown relative to both Lockdown (rSP 0.791, P = 0.004)
and Post-lockdown (rSP 0.709, P = 0.015) periods. However, the spatial distribution of rodent related residents’
complaints did change (i.e. correlation not significant) from Lockdown to Post-lockdown ( rSP 0.431, P = 0.186).
Finally, the spatial distribution of the three measures (trapping, bait station visitation and complaints) were not
correlated, except for trapping success and rodent visitation during Pre-lockdown ( rSP − 0.775, P = 0.041).
Discussion
The current study used datasets supplied by the City of Sydney Council to examine the impact of a 6-week lock-
down on three different measures of rodent activity, namely rodent captures, bait station visitation and resident
complaints. The general trends for these three measures differed quite markedly (Tables 1, 2 and 3; Fig. 1). All
three measurements were quite stable prior to COVID-19 restrictions (Fig. 2) but the introduction of Lock-
down seemed to reduce captures and bait station visitation. These two measures then separated Post-lockdown
Scientific Reports | (2021) 11:12957 | https://doi.org/10.1038/s41598-021-92301-0 5
Vol.:(0123456789)www.nature.com/scientificreports/
Fixed effects Estimate SE z P
(Intercept) 0.105 0.067 1.571 0.116
Lockdown 8.539 1.252 6.819 < 0.0001
Post-lockdown − 0.003 0.760 − 0.004 0.997
Pre-lockdown (date) 0.001 0.000 1.724 0.085
Lockdown (date) − 0.041 0.005 − 7.639 < 0.0001
Post-lockdown (date) − 0.007 0.003 − 2.624 0.009
Analysis of deviance table (Type III Wald Chi-square tests)
Fixed factors d.f Wald-χ2 P
(Intercept) 1 2.469 0.116
Period 2 46.502 < 0.0001
Period (date) 3 68.014 < 0.0001
Post-hoc Tukey adjusted pairwise comparison
Period contrast Odds ratio SE d.f. z ratio P
Pre-lockdown/lockdown 3.160 0.234 Inf 15.571 < 0.0001
Pre-lockdown/post-lockdown 7.950 0.580 Inf 28.447 < 0.0001
Lockdown/post lockdown 2.510 0.234 Inf 9.925 < 0.0001
Table 2. Model summary, Analysis of Deviance (Wald Chi-squared tests) and Post-hoc Tukey adjusted
pairwise comparisons for the model constructed to test rodent activity scores from bait stations according to
date and COVID-19 restriction period. Model structure: Activity Score ~ Period + Period (Date) + Random
(Location); Family: Binomial. Data comprised rodent activity score (i.e. low = 0 or high = 1) from 942 bait
stations deployed across the Council of the City of Sydney from September 2019 to August 2020. Bold values
represent statistical significance (P < 0.05).
Fixed effects Estimate SE d.f t value P
(Intercept) 0.029 0.030 224 0.966 0.335
Lockdown 1.389 1.410 224 0.985 0.326
Post-lockdown − 0.556 1.144 224 − 0.486 0.628
Pre-lockdown (date) 0.000 0.000 224 0.677 0.499
Lockdown (date) − 0.003 0.003 224 − 0.957 0.340
Post-lockdown (date) 0.001 0.002 224 0.488 0.626
Analysis of deviance
table (Type III Wald
Chi-square tests)
Fixed factors d.f Wald-χ2 P
(Intercept) 1 0.933 0.334
Period 2 1.207 0.547
Period (date) 3 1.612 0.657
Table 3. Model summary, Analysis of Deviance (Wald Chi-squared tests) and Post-hoc Tukey adjusted
pairwise comparisons for the model constructed to test number of rodent related residents’ complaints,
received by the Council of the City of Sydney, according to date and COVID-19 restriction period. Model
structure: Log (Complaints) ~ Period + Period (Date) + Random (Suburb); Family: Gaussian. Data comprised
the number of rodent related residents’ complaints received by the Council from January 2019 to August 2020.
with rodent captures increasing while bait station visitation continued to decrease (Tables 1 and 2; Fig. 2a,b).
Interestingly, the dynamic relationship between rodent captures and bait station visitation was not due to actual
number of rodents captured per trap day, which remained the same between periods (Table 1; Fig. 1a). Instead,
this relationship was based on the probability of capture per trap day (Table 1; Fig. 1b,c). These might be due to
the high variability in the measures across the duration of each period, shown by the over time effects detected
within each period (Tables 1, 2; Fig. 2), as well as the nature of the measurement and our analyses.
Due to the over representation of zeros and overdispersion of the Multi-Catch rodent station data, the use
of a Zero-inflated model was w arranted51,52. This type of model allowed us to detect any effects of COVID-19
restrictions on the number of rats caught in a particular trap per day, as well as the probability of capture of at
least one rat in a given day. These two measurements might differ under certain circumstances. For example,
if a small proportion of traps record high capture rates, while most record no captures, the mean number of
captures per trap night might be the same as if most traps recorded a number of captures closer to the mean,
and just a minority recorded no captures. Meanwhile, in this same example, the probability of capture would
be low in the first scenario, since most traps did not record captures, and higher in the second scenario, since
Scientific Reports | (2021) 11:12957 | https://doi.org/10.1038/s41598-021-92301-0 6
Vol:.(1234567890)www.nature.com/scientificreports/
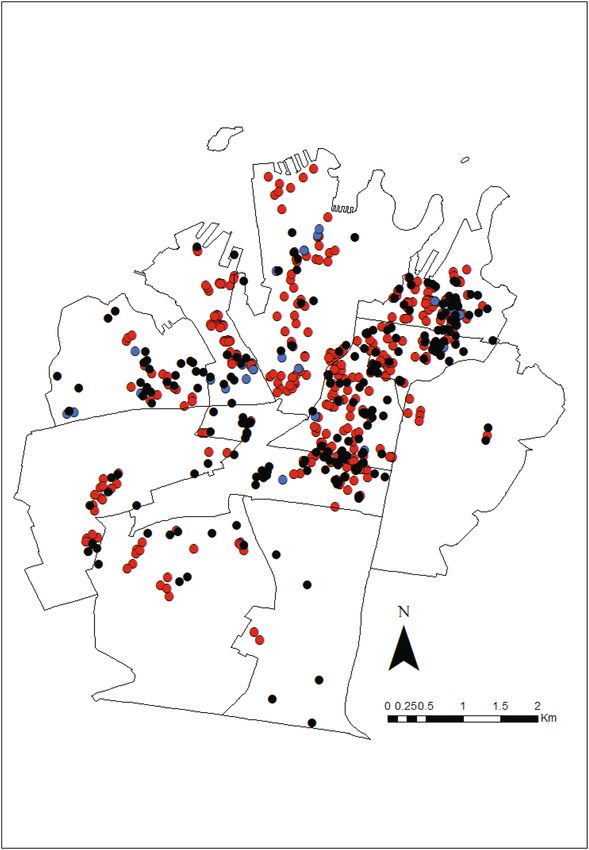
Figure 3. Locations of multi-catch rodent stations ( ), rodent bait stations ( ) and residents’ rodent
complaints ( ) within the Council of the City of Sydney. The eleven Statistical Area 2 (SA2) which make up the
City of Sydney are shown. Map generated using ArcGIS Desktop v10.588.
most traps recorded at least one capture. This might explain the patterns we described across all three periods
(i.e. Pre-lockdown, Lockdown and Post-lockdown) where the number of rats captured per trap per day did not
change, but the probability of capture did (Table 1; Fig. 1a). Further supporting this idea is our spatial distribu-
tion analyses, where we recorded a slight change in the spatial distribution of rodent captures during Lockdown
in comparison to Pre-lockdown and Post-lockdown (Fig. 4a), which seems to suggest that some traps recorded
higher trapping rates, while most recorded very low trapping rates.
Scientific Reports | (2021) 11:12957 | https://doi.org/10.1038/s41598-021-92301-0 7
Vol.:(0123456789)www.nature.com/scientificreports/
Figure 4. Distribution of trapping success (a), rodent bait stations visitation (b) and residents’ rodent
complaints (c) within the Council of the City of Sydney and their mean centers and associated directional
ellipses during pre-lockdown ( ), lockdown ( ) and post-lockdown ( ) periods. Maps generated using
ArcGIS Desktop v10.588.
With the exception of rodent captures, our findings seem to contradict observations of rodent population
after hurricanes21,22. We hypothesize that this might be due to the undeniable temporal and physical differences
between a climatic event and a pandemic. Climatic events are short-lived, with vast physical effects on the land-
scape, shifts in habitat characteristics, and increasing landscape heterogeneity2,53. In contrast, social restrictions
were limited to closure of restaurants, cafes and other food venues54, causing a reduction in human-derived food
resources where they have been plentiful before.
Rodent captures per trap showed an abrupt spike during Lockdown, followed by a steep and rapid decline and
a slow recovery during Post-lockdown (Table 1, Fig. 2a). In contrast, Lockdown seemed to have triggered a steep
decline in rodent activity that continued Post-lockdown (Table 2, Fig. 2b). We found no temporal changes in the
number of rodent related complaints received by the council (Table 3, Fig. 4). We found no directional spatial
changes for any of the measurements between Pre-lockdown, Lockdown and Post-lockdown periods (Fig. 4).
However, the distribution of trapping success and rodent visitation at bait stations Pre-lockdown appeared spa-
tially related, but this relationship was disrupted during Lockdown and continued to be disrupted Post-lockdown.
Since the spatial distribution of trapping success only changed during Lockdown, relative to Pre- and Post-
lockdown spatial distributions, the disruption in the relationship between trapping success and rodent visitation
seems to be due to the change in spatial distribution in rodent visitation during Post-lockdown. Rodent visitation
spatial distribution changing across all periods, seems to suggest that this measure of rodent abundance did not
recover from the disruption suffered during Lockdown.
Commensal rodents show high levels of neophobia55,56 and taste a version2,53 resulting in high levels of ‘trap-
shyness’57,58 and low bait a cceptance59,60. However, a reduction in food resources might have driven animals
to engage in “bold” behaviors during foraging whilst in a lower physiological s tate61,62. These hunger-driven
behaviors might explain reports of rats feeding in close proximity to humans31,45,46 as well cannibalism31,38.
Ultimately, hunger might have caused these animals to overcome their neophobia and taste aversion, resulting
in a decrease in trap shyness potentially driving an increase in mortality by electrocution. However, under this
premise, we expected that rodent activity at bait station would reflect captures and spike, yet we did not find
that. One possibility is that the reduction in food resources was not enough for animals to overcome their taste
aversion towards the commonly used rodenticides at the bait station. In contrast, Multi-Catch rodent stations
are baited with non-toxic food attractants, thus taste aversion might be unlikely. Another possibility is the dif-
ference in resolution of the data between Multi-Catch rodent stations and bait stations. Rodent visitation at bait
station was recorded as “not visited” or “visited”, collapsing the potential variability present in rodent visitation
in a binary measure. Thus, a record for a peak in visitation (e.g. increase signs of rodents and higher levels of
bait taken from the bait stations) could have effectively being lost by grouping them at the same level as reduced,
yet present, visitation (e.g. limited signs of rodents and bait taken). However, this does not explain why rodent
related residents’ complaints did not change between periods or over time within each period.
Rodent related residents’ complaints seem to be completely disassociated from rodent captures and activity,
remaining stable over time and between periods, except for a change in spatial distribution observed Post-lock-
down. This is contrary to what has been reported during periods of no d isturbance42; and during COVID-1941.
One possible explanation is that, during the Lockdown period, most people remained home social distancing,
with many leaving the Council to neighboring areas, similar to counter-urbanizations20. With less people within
the Council, the chances of rats sightings would have been reduced, thus the lack of change in the number of
Scientific Reports | (2021) 11:12957 | https://doi.org/10.1038/s41598-021-92301-0 8
Vol:.(1234567890)www.nature.com/scientificreports/
rodent related complaints might not reflect the rodent population, but might be an artefact of less people com-
muting and occupying public spaces. Furthermore, a decrease in resources by the closure of restaurants and
cafes, might have driven rodents to move from public spaces to private residences where food waste was still
available. People that then experienced an increased in rodents’ sightings within their residence, might have
contacted pest controllers directly and not the Council. Similarly, prior to COVID-19 restrictions, a single rat
sighted around a restaurant café or public space, could have been reported by a high number of customers and
residents. In contrast, during the Lockdown period, several rats sighted within a resident would incite a single
complaint to the Council. Previous research on the relationship between the number of rodent related residents’
complaints and the actual rodent population, show a direct relationship between the two42, but do not account
for disruptions in human behavior such as the ones brought up by COVID-19. More complex responses in
rodent related residents’ complaints, in relationship with COVID-19, have been reported r ecently41 and are in
concordance with our findings.
A higher mortality due to a decrease in carrying capacity might explain the activity decline that we found dur-
ing the lockdown period and in captures later on during the same p eriod63,64. It is highly unlikely that the peaks
in rodent captures would be due to an increase in the rodent population, given that the lockdown period lasted
only 45 days. It is also important to note that we classified lockdown as the short period during which COVID-19
restrictions were at their peak, with cancellations of all social gatherings, mandatory closure of all non-essential
businesses including restaurant and cafes54. Both the pre-lockdown and the post-lockdown periods encompassed
the gradual increase and decrease of these restrictions over several weeks54. Therefore, even rats, which are known
for their prolific reproduction65,66, would not be able to reproduce and mature in such a limited time frame and
even less with disruptions on human behavior still present. The recovery in the population is therefore expected
to be more gradual, like the steady but slow increase in rodent captures we found in the post-lockdown period.
Interestingly, rodent activity again did not mirror the rodent captures data post-lockdown. As argued above, this
difference might be a consequence of the nature of the data collected. If the peak in rodent activity was indeed
due to abnormal foraging behavior caused by starvation followed by a population reduction, it is highly possible
that the lockdown acted as a genetic bottleneck. Previous research has shown that, after such a mortality event,
the genetic variation within the remaining population could be up to 90% lower than the original population67.
Given that our data did not cover several years, we were unable to account for natural seasonal cycles in the
rodent population. Several studies have shown that urban rodent populations follow a seasonal gradient that
reflect both human changes in behaviors and temperature17,42,68,69. Colder months seem to trigger lower rodent
activity, that then increase towards spring and peaks in s ummer42,68,69. During harsh winters, rats have been
reported to move from outdoors to indoors in search of food and w armth70, and this behavior has been linked
17,71
to an increase in rodent related resident’s c omplaints . Our Pre and Post-lockdown multi-catch station data
seems to support this, but not so our bait station data. However, the lowest temperatures recorded during this
study, were recorded in July during Post-lockdown (i.e. 7 °C72), when trapping success was not the lowest and was
instead steadily increasing. It is possible that in a subtropical City such as Sydney (average minimum temperature
15.7 °C72) the effect of seasonal changes in temperature might not be as strong as that detected in laboratory
studies68,69 and more temperate cities42. Additionally, it has been well documented that cities are “heat islands”
that experience significantly milder winters than surrounding areas73. This might be more pronounced in coastal
cities like Sydney. Seasonal changes in rat activity have also been linked to changes in human behavior, and not
solely a respond to the change in temperature, with people spending more time outdoors during the warmer
weather, thus increasing sightings and resource availability17,42. Thus, the abrupt reduction in human activity
during the lockdown, might have acted as an early onset of winter. Moreover, the expected seasonal changes in
rodent activity cannot explain the abrupt increase and decline in captures, nor the accelerated decline in rodent
visitation during Lockdown. Therefore, we argue that the effects we report are solely due to the changes in human
behaviors, and unintended effects on the rodent population, elicited by the COVID-19 restrictions.
We found no evidence of directional spatial changes driven by the Lockdown. This supports the findings
Parsons et al. reported from Warsaw, Poland but contrast with their results from New York City and Tokyo41. They
suggested that COVID-19 Lockdown measures trigger an increase in rodent movement and potential massive
migrations, based on the increased association of rats and food service establishments and the formation of new
hotspots of rat sightings in New York C ity41. However, the level of rodent migration Parsons et al.41 suggests—i.e.
tenths of kilometers—is difficult to reconcile base on the well-known site fidelity pest rodents species s how74.
However, this does not negate the possibility that rodents might have move from areas of normally abundant
resources that were suddenly reduced—i.e. restaurants and cafes—to areas where some limited level of resources
remained—e.g. private residences. In fact, although we did not detect any directional spatial changes, we did
detect changes in the spatial distributions of our rodent abundance measures. Parsons et al.41, suggest that the
pattern of movement reported, was not recorded in Warsaw, potentially because of the lack of restaurant clusters
in that city, a situation that may be similar to the one in Sydney. The City of Sydney Council is not comprised
by distinct clusters of offices and residents, with most buildings being of “dual use”, with business at ground
floor and residential apartments above. Without distinct residential and business suburbs within the City of
Sydney Council, rats might move very short distances to small pockets within the surrounding area in search of
resources, thus long-distance directional migration would not be detected. Moreover, is crucial to recognize the
limitations of the data we used. Both Multi-Catch and bait rodent stations were sometimes removed or relocated
to target “problem” areas within the Council based of the Council’s pest management objectives. This process
might have removed any spatial effect. Therefore, although we did not detect any obvious directional shifts in
spatial distribution, if such shifts did occur, they were most likely subtle, and we were unable to detect them.
Although the risks of commensal rodents to be infected or transmit SARS-CoV-2 are low75, we know that
these animals pose other health risks2,7–14. Thus, an increase in rodent-human interactions has the potential to
place further strains on health systems around the world. Fortunately, our data seems to suggest the increase
Scientific Reports | (2021) 11:12957 | https://doi.org/10.1038/s41598-021-92301-0 9
Vol.:(0123456789)www.nature.com/scientificreports/
in rodent–human interactions, as reported by the media, might be an overstatement. Undoubtedly, the onset
of COVID-19 might have disrupted not only human behavior, but also commensal rodent populations, yet the
implications for the future management of these species is still uncertain. The disruptions caused by COVID-
19 restrictions to the rodent population seem to differ depending on the measured used. Our data illustrates
how two different control methods (i.e. lethal traps and bait stations) can show similar patterns, and potentially
have similar efficacy, during normal conditions. However, an abrupt change in human behavior can disrupt this
efficacy and possibly change the characteristics of the individuals targeted by each method. Although it is too
early to determine if these disruptions would have long term effects on management outcomes, the different
patterns reported for lethal traps and bait stations highlights the need to follow integrated pest management
(IPM) frameworks that do not rely on a single control m ethods76.
Materials and methods
Study area. The City of Sydney Council (hereafter Council) is the largest city, by population, in Australia,
with 240,229 residents77. It comprises a highly urbanized part of the Greater Sydney region and includes the
Central Business District of Sydney and many of Sydney’s major tourist attractions (e.g. the Opera House). It
borders Port Jackson in the north, the Woollahra Municipal Council area and Randwick City in the east, the
Bayside Council area in the south, and the Inner West Council area in the west77. Sydney has a humid subtropi-
cal climate (average maximum = 21.3 °C; average minimum = 15.7 °C;72. The Council is composed of 33 suburbs
and 23 localities. In Australia, suburbs are defined as geographical subdivisions used for address purposes and
refer to portions of a city that can include inner-city, outer-metropolitan, and industrial areas. The Australian
definition of suburb is more alike the American and British definitions of “district” or “neighborhood”. Localities
are defined as historically unrecognized geographical units that due to common informal used, and later govern-
ment decree; official boundaries were established and are currently recognized geographical features.
Data sourcing. All data used in this research were obtained from the Council. As part of Council’s ongo-
ing rodent control operations, pest management contractors have deployed multi-catch rodent stations as well
as rodent bait stations across the Council. The Council conducts pest management operations only on Council
property and outdoors. Rodent captures and activity are recorded regularly, and the data are stored by the Coun-
cil. The Council also receives residents’ complaints through phone calls, emails or through electronic complaint
forms found on the Council’s website. These complaints are compiled and stored by the Council.
Rodent pest management by the Council targets brown rats (Rattus norvegicus), and black rats (R. rattus); the
former being the most common species found in the urban environment. Common house mice (Mus musculus)
are also found within the council, but they seldom occur outside of buildings, and their control is considered the
responsibility of property owners and managers. Due to unreliable identification by pest management contractors
and general public, the records used for this study do not include species specific data (i.e. R. rattus vs R. nor-
vegicus). A subsample of 95 rat carcasses obtained from live trapping and multi-catch rodent stations across the
Council suggests R. norvegicus to be the dominant species within the council (i.e. 88 R. norvegicus and 7 R. rattus).
Multi‑catch rodent stations dataset. Flick SMART Multi-Catch rodent station is an internationally
patented rodent trap design78. This trap consists of a trigger mechanism that kills the animal by an electric cur-
rent. The trap has a built-in programmable computer with a SIM card, enabling it to communicate via the mobile
network when it has been activated. This trap can catch multiple animals (eight maximum), before it needs to
be serviced.
Under a pest management contract between the Council and Flick Anticimex Pty Ltd, 20–60 multi-catch
rodent stations were deployed outdoors on public places and Council own land from October 2019 to July 2020.
Deployment was non-random and guided by strategic pest management priority zoning. Multi-catch rodent
stations were sometimes removed or relocated, whenever they were damaged or if trapping success did not reflect
the Council’s pest management goals (i.e. zero captures for 4 weeks). These stations were baited with barbeque
grease and commercially available rodent attractants The Council received monthly reports from Flick Antici-
mex Pty Ltd over the deployment interval that contained the number of traps active, the location in latitude and
longitude coordinates of each station and the number of captures per day per each trap.
Rodent bait stations dataset. Additionally, 942 bait stations (PROTECTA EVO Ambush and PRO-
TECTA LP, Bell Laboratories, Inc.) were deployed outdoors on public places and Council own land from Sep-
tember 2019 to August 2020. Deployment was non-random and guided by strategic pest management priority
zoning. Bait stations were sometimes removed or relocated, whenever they were damaged or if rodent activity
did not reflect the Council’s pest management goals (i.e. low to no activity for 4 weeks). These stations were baited
with commercial poisoned baits (Bromadiolone: Contrac Blox and Contrac Soft Bait; Brodifacoum: Ditrac Blox;
Difethialone: Generation Block and Rodilon Soft Block; Flocoumafen: Storm Secure Block and Storm Soft Bait).
Baits were randomly rotated at each station, to prevent rodents developing aversion to any bait. Each station was
checked regularly (mean: 10.56 Days ± SE: 0.06) and scored according to the rodent visitation i.e. low: no bait
consumed and no visual signs; or high: bait consumed and visual signs present. Following strategic pest manage-
ment principles, bait station with consistent low activity score were relocated. The location for each bait station
was recorded in UTM coordinates to facilitate spatial analyses.
Rodent related residents’ complaints dataset. Murray, et al.42 previously showed that the number of
rodent related residents’ complaints can be used as an estimate of rat relative abundance across diverse urban
landscapes. Later Parsons et al.41 used rat-related public complaints and surveyed pest control companies to
Scientific Reports | (2021) 11:12957 | https://doi.org/10.1038/s41598-021-92301-0 10
Vol:.(1234567890)www.nature.com/scientificreports/
estimate changes in rodent pest populations during COVID-19 restrictions. However, the relationship between
rodent related residents’ complaints has not been validated during disruptions in human behavior such as the
ones created by the COVID-19 pandemic. Therefore, we accessed all rodent related complaints made to the
Council from January 2019 to August 2020 and included these data in our analyses.
Complaints were received through phone calls, emails or through electronic complaint forms found on the
Council’s website. All complaints contained the date and street address. Identifying information was removed
from the complaint dataset, with street address transformed to UTM coordinates to facilitate spatial analyses,
and suburb used for statistical analyses.
COVID‑19 pandemic restrictions. Following the rapid increase in COVID-19 cases at the beginning of
2020, the New South Wales State Government enacted a series of preventative measures to limit the spread of
the disease. These preventative measures included limits in the number of attendees at social gatherings, manda-
tory closure of all non-essential businesses, restrictions to only operate as “take-away” for restaurant and cafes,
and border closures with other Australian States and Territories. We used the publicly available timeline of these
measures54, to classify the datasets into three “Periods”. Pre-lockdown was defined as the period prior to March
31st, 2020; the Lockdown was defined as the period from the April 1st to May 15th, 2020; and Post-lockdown was
defined as the period from May 16th onwards.
Statistical analyses. To explore whether there was any effect of COVID-19 restrictions overall on pest
rodent population and residents’ perception within the Council, we performed statistical analyses in R 4.0.279.
Each dataset had a different distribution and were at slightly different spatial scales, hence the need for different
models.
Due to the over representation of zeros and overdispersion, the Multi-Catch rodent station dataset was
analyzed by a Zero-inflated Generalized Linear Mixed Model (GLMM) using the function glmmTMB from the
package “glmmTMB” version 1.0.2.180 with a negative binomial error distribution. Zero-inflated models are
used for count data that are over dispersed and are characterized by an excess of zeros51,52. The data distribution
used for zero-inflated models combines the negative binomial or Poisson error distributions and the logit error
distribution functions, effectively modelling count values separately from the excess zeros which are treated
as binomial data (i.e. 0 or 1)51,52. Therefore, model outputs for zero-inflated models include analyses of count
data, in our case number of animals captured, and binomial data, in our case probability of capture. The rodent
bait station dataset was analyzed by a GLMM with a binomial error distribution, using the function glmer from
the package “lme4” version 1.1.2381. The rodent related residents’ complaints dataset was analyzed by another
GLMM, using the functions lmer, from the package “lme4” version 1.1.2381. With the exception of the models
constructed to test the rodent bait station dataset, residual plots and the Pearson’s dispersion test were used to
odel82.
identify the best distribution and link for each m
Each model aimed to test the effects of COVID-19 restrictions on the number of rodent captures per day
(Multi-Catch rodent stations), the level of rodent visitation (Rodent bait stations) and residents’ reporting of
rodent activity (number of complaints). Period (i.e. Pre-lockdown, Lockdown and Post-lockdown), numerical
date (day as integer starting at 1 to last sampling day per data set, when each data point was collected), and
numerical date nested within period (as each date value only occurred within a particular period) were included
as fixed factors. The model testing the number of rodent related residents’ complaints initially included the mean
of communication (i.e. email, council website or phone call) as a covariate, due to lack of significance (P > 0.50)
this covariate was later removed in order to simplify the m odel83.
To account for intrinsic differences in rodent captures, visitation and number of complaints based on loca-
tion, each model included location (i.e. trap or bait station coordinates, or the suburb where complaint was
received from) as the only random factor. Additionally, in the case of the Multi-Catch rodent station and rodent
bait stations, to account for differences in sampling effort due to variable number of stations deployed across the
sampling period, the number of active Multi-Catch rodent station or bait stations checked per day were included
in the models as offsets.
To generate P-values, Wald Chi-square tests were applied to all models using the function Anova from the
package “car” version 3.0.984. Post-hoc pairwise comparisons with Tukey adjustments were carried out by the
functions emmeans, and pairs from the package “emmeans” version 1.5.085, and the function cld from the package
“multcomp” version 1.4.1386. Graphs were constructed using package “ggplot2” version 3.3.287.
The spatial distribution of total rodent captures (Multi-Catch rodent stations), the level of rodent visitation
(Rodent bait stations with high visitation) and residents’ perceptions of rodent activity (total number of com-
plaints) were visualized by creating dot maps based on latitude and longitude or UTM and the Inner Sydney
and Eastern Suburbs-North polygons of the Statistical Areas Level 3 (SA3) dataset set 2016 (Geographic Datum
of Australia 1994). Data were projected in UTM 56S using ArcGIS 10.588. For each dataset overall and for the
three study periods, mean centers and directional ellipses were calculated (Spatial Statistics. ArcGIS 10.5. ESRI).
Rodent captures, visitation and complaints data were summed to SA2 areas: the 10 areas which make up Inner
Sydney SA3 and the adjacent Paddington-Moore Park SA2 which lies within SA3 Eastern Suburbs-North. The
correlations (rSP) between these data by SA2 were calculated on SPSS v 2489.
Data availability
ryad90 but restrictions apply to the
Most of the data that supports the findings of this study are available from D
availability of the rodent related residents’ complaints data, which were used under license for the current study,
and so are not publicly available. Data are however available from the authors upon reasonable request and with
permission of the Council of the City of Sydney.
Scientific Reports | (2021) 11:12957 | https://doi.org/10.1038/s41598-021-92301-0 11
Vol.:(0123456789)www.nature.com/scientificreports/
Received: 18 November 2020; Accepted: 3 June 2021
References
1. Tobin, M. E. & Fall, M. W. USDA National Wildlife Research Center-Staff Publications Vol. 67, 1–21 (USDA National Wildlife
Research Center-Staff Publications, 2006).
2. Meerburg, B. G., Singleton, G. R. & Kijlstra, A. Rodent-borne diseases and their risks for public health. Crit. Rev. Microbiol. 35,
221–270. https://doi.org/10.1080/10408410902989837 (2009).
3. Meerburg, B. G., Singleton, G. R. & Leirs, H. The Year of the Rat ends—Time to fight hunger!. Pest. Manag. Sci. 65, 351–352. https://
doi.org/10.1002/ps.1718 (2009).
4. Mills, J. N. The role of rodents in emerging human disease: Examples from the hantaviruses and arenaviruses. in Ecologically-
Based Rodent Management (eds Grant R. Singleton, Lyn A. Hinds, Herwig Leirs, & Zhibin Zhang) 134–160 (Australian Centre
for International Agricultural Research, 1999)
5. Barnett, S. A. The Story of Rats: Their Impact on Us, and Our Impact on Them (Allen & Unwin, 2001).
6. Almeida, A., Corrigan, R. M. & Sarno, R. The economic impact of commensal rodents on small businesses in Manhattan’s China-
town: Trends and possible causes. Suburban. Sustain. 1, 1–15. https://doi.org/10.5038/2164-0866.1.1.2 (2013).
7. Strand, T. M. & Lundkvist, Å. Rat-borne diseases at the horizon. A systematic review on infectious agents carried by rats in Europe
1995–2016. Infect. Ecol. Epidemiol. 9, 1553461–1553461. https://doi.org/10.1080/20008686.2018.1553461 (2019).
8. Firth, C. et al. Detection of zoonotic pathogens and characterization of novel viruses carried by commensal Rattus norvegicus in
New York City. MBio 5, e01933-e11914. https://doi.org/10.1128/mBio.01933-14 (2014).
9. Frye, M. J. et al. Preliminary survey of ectoparasites and associated pathogens from Norway rats in New York City. J. Med. Entomol.
52, 253–259. https://doi.org/10.1093/jme/tjv014 (2015).
10. Cross, R. W. et al. Old world hantaviruses in rodents in New Orleans, Louisiana. Am. J. Trop. Med. Hyg. 90, 897–901. https://doi.
org/10.4269/ajtmh.13-0683 (2014).
11. Peterson, A. C. et al. Rodent-borne Bartonella infection varies according to host species within and among cities. EcoHealth 14,
771–782. https://doi.org/10.1007/s10393-017-1291-4 (2017).
12. Rael, R. C. et al. Rat lungworm infection in rodents across post-katrina New Orleans, Louisiana, USA. Emerg. Infect. Dis. 24, 2176
(2018).
13. Bordes, F., Blasdell, K. & Morand, S. Transmission ecology of rodent-borne diseases: New frontiers. Integr. Zool. 10, 424–435.
https://doi.org/10.1111/1749-4877.12149 (2015).
14. Han, B. A., Schmidt, J. P., Bowden, S. E. & Drake, J. M. Rodent reservoirs of future zoonotic diseases. Proc. Natl. Acad. Sci. 112,
7039–7044. https://doi.org/10.1073/pnas.1501598112 (2015).
15. Stenseth, N. C. et al. Mice, rats, and people: The bio-economics of agricultural rodent pests. Front. Ecol. Environ. 1, 367–375.
https://doi.org/10.1890/1540-9295(2003)001[0367:MRAPTB]2.0.CO;2 (2003).
16. Pimentel, D., Zuniga, R. & Morrison, D. Update on the environmental and economic costs associated with alien-invasive species
in the United States. Ecol. Econ. 52, 273–288. https://doi.org/10.1016/j.ecolecon.2004.10.002 (2005).
17. Feng, A. Y. T. & Himsworth, C. G. The secret life of the city rat: A review of the ecology of urban Norway and black rats (Rattus
norvegicus and Rattus rattus). Urban Ecosyst. 17, 149–162. https://doi.org/10.1007/s11252-013-0305-4 (2014).
18. Himsworth, C. G., Parsons, K. L., Jardine, C. & Patrick, D. M. Rats, cities, people, and pathogens: A systematic review and narra-
tive synthesis of literature regarding the ecology of rat-associated zoonoses in urban centers. Vector-Borne Zoonotic Diseases 13,
349–359. https://doi.org/10.1089/vbz.2012.1195 (2013).
19. Lambropoulos, A. S., Fine, J. B., Perbeck, A. & Torres, D. Rodent control in urban areas: An interdisciplinary approach. J. Environ.
Health 61, 12 (1999).
20. Peterson, A. C. et al. Rodent assemblage structure reflects socioecological mosaics of counter-urbanization across post-hurricane
Katrina New Orleans. Landsc. Urban. Plann. 195, 103710. https://doi.org/10.1016/j.landurbplan.2019.103710 (2020).
21. Shiels, A. B., Lombard, C. D., Shiels, L. & Hillis-Starr, Z. Invasive rat establishment and changes in small mammal populations on
Caribbean Islands following two hurricanes. Glob. Ecol. Conserv. 22, e00986. https://doi.org/10.1016/j.gecco.2020.e00986 (2020).
22. Htwe, N. M., Singleton, G. R. & Nelson, A. D. Can rodent outbreaks be driven by major climatic events? Evidence from cyclone
Nargis in the Ayeyawady Delta, Myanmar. Pest. Manag. Sci. 69, 378–385. https://doi.org/10.1002/ps.3292 (2013).
23. Eskew, E. A. & Olival, K. J. De-urbanization and zoonotic disease risk. EcoHealth 15, 707–712. https://doi.org/10.1007/s10393-
018-1359-9 (2018).
24. Gulachenski, A., Ghersi, B. M., Lesen, A. E. & Blum, M. J. Abandonment, ecological assembly and public health risks in counter-
urbanizing cities. Sustainability 8, 491 (2016).
25. Rael, R. C., Peterson, A. C., Ghersi, B. M., Childs, J. & Blum, M. J. Disturbance, reassembly, and disease risk in socioecological
systems. EcoHealth 13, 450–455. https://doi.org/10.1007/s10393-016-1157-1 (2016).
26. LaDeau, S. L., Leisnham, P. T., Biehler, D. & Bodner, D. Higher mosquito production in low-income neighborhoods of Baltimore
and Washington, DC: Understanding ecological drivers and mosquito-borne disease risk in temperate cities. Int. J. Environ. Res.
Public Health 10, 1505–1526 (2013).
27. Rutz, C. et al. COVID-19 lockdown allows researchers to quantify the effects of human activity on wildlife. Nat. Ecol. Evolut. 4,
1156–1159. https://doi.org/10.1038/s41559-020-1237-z (2020).
28. Coronavirus: Why more rats are being spotted during quarantine. BBC News. https://w ww.b bc.c om/n ews/w orld-u s-c anada-5 2177
587 (2020).
29. Latest pest control news. Features and blog articles from British Pest Control Association. BPCA. https://bpca.org.uk/News-and-
Blog/advice-for-pest-professionals-operating-during-covid-19 (2020).
30. Rodent control. Centers For Disease Control and Prevention. https://w ww.c dc.g ov/c orona virus/2 019-n
cov/p hp/r odent s.h tml (2020).
31. Zhou, N. Sydney braces for rat ‘plague’ after Covid-19 forces hungry rodents to turn to cannibalism. in The Guardian. Australian
Edition. https://www.theguardian.com/australia-news/2020/may/28/sydney-braces-for-rat-plague-after-covid-19-forces-hungry-
rodents-to-turn-to-cannibalism (2020).
32. The Pest Control Sydney sector warns of increase of rat activity due to COVID-19 shuts down food supply. Safe Pest Control.
https://safepestcontrol.net.au/pest-control-sydney-sector-warns-increase-rat-activity-covid-19/ (2020).
33. Sutton, C. Rats on the rise as shutdown cuts their food supply. in Tweed Daily News. https://www.tweeddailynews.com.au/news/
covid-19-leads-to-rat-explosion/3989127/ (2020).
34. Mannix, L. The Age (Nine Entertainment Co., 2020).
35. Prokop, P., Fančovičová, J. & Fedor, P. Health is associated with antiparasite behavior and fear of disease-relevant animals in
humans. Ecol. Psychol. 22, 222–237. https://doi.org/10.1080/10407413.2010.496676 (2010).
36. Byers, K. A., Cox, S. M., Lam, R. & Himsworth, C. G. “They’re always there”: Resident experiences of living with rats in a disad-
vantaged urban neighbourhood. BMC Public Health 19, 853. https://doi.org/10.1186/s12889-019-7202-6 (2019).
37. German, D. & Latkin, C. A. Exposure to urban rats as a community stressor among low-income urban residents. J. Community
Psychol. 44, 249–262. https://doi.org/10.1002/jcop.21762 (2016).
Scientific Reports | (2021) 11:12957 | https://doi.org/10.1038/s41598-021-92301-0 12
Vol:.(1234567890)You can also read