Fruit bats in flight: a look into the movements of the ecologically important Eidolon helvum in Tanzania - One Health Outlook
←
→
Page content transcription
If your browser does not render page correctly, please read the page content below
Randhawa et al. One Health Outlook       (2020) 2:16
https://doi.org/10.1186/s42522-020-00020-9
                                                                                                                                 One Health Outlook

 RESEARCH                                                                                                                                             Open Access

Fruit bats in flight: a look into the
movements of the ecologically important
Eidolon helvum in Tanzania
Nistara Randhawa1* , Brian H. Bird1†, Elizabeth VanWormer2†, Zikankuba Sijali3, Christopher Kilonzo1,
Alphonce Msigwa4, Abel B. Ekiri5, Aziza Samson3, Jonathan H. Epstein6, David J. Wolking1, Woutrina A. Smith1,
Beatriz Martínez-López7, Rudovick Kazwala3 and Jonna A. K. Mazet1*

  Abstract
  Background: Many ecologically important plants are pollinated or have their seeds dispersed by fruit bats,
  including the widely distributed African straw-colored fruit bats (Eidolon helvum). Their ability to fly long distances
  makes them essential for connecting plant populations across fragmented landscapes. While bats have been
  implicated as a reservoir of infectious diseases, their role in disease transmission to humans is not well understood.
  In this pilot study, we tracked E. helvum to shed light on their movement patterns in Tanzania and possible contact
  with other species.
  Methods: Tracking devices were deployed on 25 bats captured in the Morogoro Municipal and Kilombero District
  area near the Udzungwa Mountains of Tanzania. Nightly flight patterns, areas corresponding to foraging bouts and
  feeding roosts, and new day roosts were determined from bat movement data and characterized according to their
  proximity to urban built-up and protected areas. Sites for additional environmental surveillance using camera traps
  were identified via tracking data to determine species coming in contact with fruits discarded by bats.
  Results: Tracking data revealed variability between individual bat movements and a fidelity to foraging areas. Bats
  were tracked from one to six nights, with a mean cumulative nightly flight distance of 26.14 km (min: 0.33, max: 97.57)
  based on data from high-resolution GPS tags. While the majority of their foraging locations were in or near urban
  areas, bats also foraged in protected areas, of which the Udzungwa Mountains National Park was the most frequented.
  Camera traps in fruit orchards frequented by tracked bats showed the presence of multiple species of wildlife, with
  vervet monkeys (Chlorocebus pygerythrus) observed as directly handling and eating fruit discarded by bats.
  Conclusions: Because we observed multiple interactions of animals with fruits discarded by bats, specifically with
  vervet monkeys, the possibility of disease spillover risk exists via this indirect pathway. With flight distances of up to 97
  km, however, the role of E. helvum in the seed dispersal of plants across both protected and urban built-up areas in
  Tanzania may be even more important, especially by helping connect increasingly fragmented landscapes during this
  Anthropocene epoch.
  Keywords: Bats, Eidolon helvum, Tracking, Movements, Urban areas, Protected areas

* Correspondence: nrandhawa@ucdavis.edu; jkmazet@ucdavis.edu
†
 Brian H. Bird and Elizabeth VanWormer contributed equally to this work.
1
 Karen C. Drayer Wildlife Health Center, One Health Institute, School of
Veterinary Medicine, University of California, 1089 Veterinary Drive, Davis, CA,
USA
Full list of author information is available at the end of the article

                                          © The Author(s). 2020 Open Access This article is licensed under a Creative Commons Attribution 4.0 International License,
                                          which permits use, sharing, adaptation, distribution and reproduction in any medium or format, as long as you give
                                          appropriate credit to the original author(s) and the source, provide a link to the Creative Commons licence, and indicate if
                                          changes were made. The images or other third party material in this article are included in the article's Creative Commons
                                          licence, unless indicated otherwise in a credit line to the material. If material is not included in the article's Creative Commons
                                          licence and your intended use is not permitted by statutory regulation or exceeds the permitted use, you will need to obtain
                                          permission directly from the copyright holder. To view a copy of this licence, visit http://creativecommons.org/licenses/by/4.0/.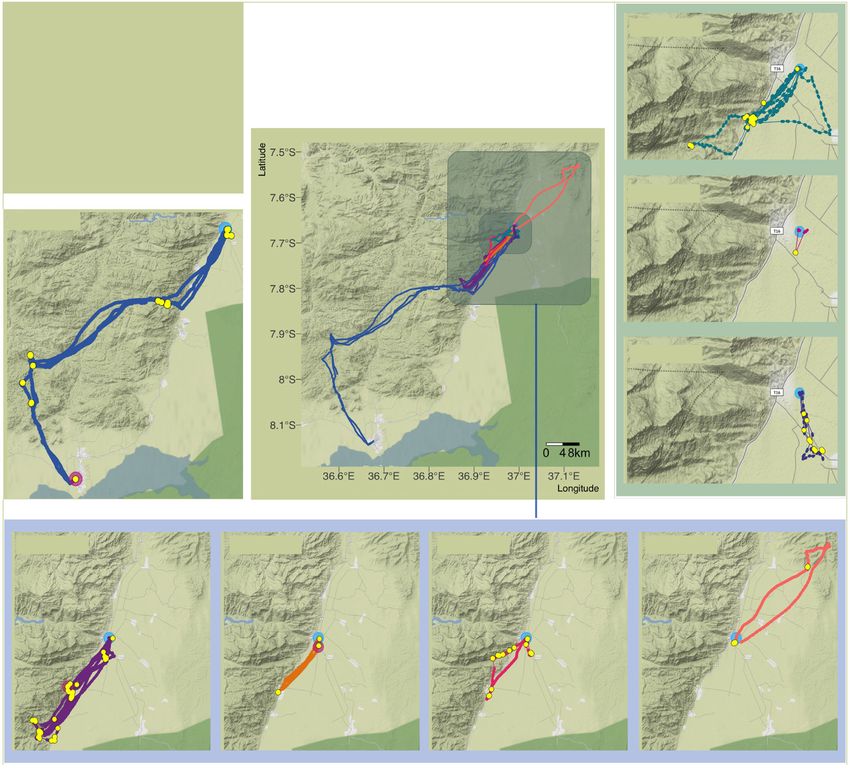
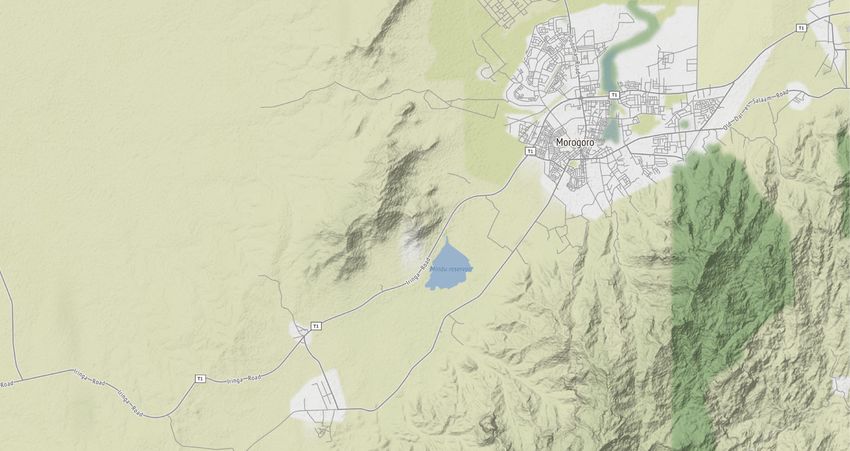
Randhawa et al. One Health Outlook   (2020) 2:16                                                                 Page 2 of 14

Background                                                      hosts for diverse viruses is likely associated with their
The chiropteran order is diverse with over a thousand           evolutionary age, genetic diversity, broad geographical
species of bats occupying different ecological niches and       distribution, and social, biological, and immunological
providing multiple ecosystem services. Fruit bats in par-       features [37–39]. With over 1000 recognized species,
ticular are important pollinators and seed dispersers for       bats are the second largest order of mammals, after ro-
many plants of ecological and economic importance [1–           dents, whose origins can be traced back to 50 million
5]. The ability of fruit bats to traverse great distances for   years ago [40, 41]. As social animals often living together
foraging or during migration helps connect plant popu-          in large numbers in close physical proximity, their col-
lations across fragmented landscapes to maintain gene           onies can facilitate the circulation and transmission of
flow [6–10]. Maintaining this connectivity is crucial due       viruses and even promote virus amplification during
to threats of on-going fragmentation and degradation of         bats’ breeding seasons [42]. Bats are unique in that they
forest ecosystems, leading to impeded movement of               are the only mammals capable of powered flight, and it
plant materials and animals among habitat patches [11–          is hypothesized that the immune and metabolic changes
13]. In addition, hunting and habitat loss are leading to       associated with flight facilitate the large diversity of zoo-
the extinction of many seed dispersers throughout the           notic viruses in bats as a result of altered host-virus in-
tropics, including birds, mammals, and reptiles, affecting      teractions [43, 44]. Despite the implication of bats as a
not only their numbers, but also the plants they disperse       source of disease outbreaks in humans, the role of bats
[14, 15]. The importance of fruit bats and the ecosystem        in disease emergence is not well understood; with not
services they provide is therefore magnified when land-         enough known about bat biology and insufficient mea-
scape fragmentation and declines in bird and mammal             sures having being put in place with respect to their
species facilitating seed dispersal are taken into consider-    conservation [45].
ation [15].                                                       Previous studies have looked at genetic and epidemio-
   Eidolon helvum, the straw-colored fruit bat, is an im-       logical connectivities among E. helvum populations in
portant long distance seed disperser in tropical Africa by      Africa, as well as their role as seed dispersers in
virtue of the diversity of plants upon which it forages         Tanzania [4, 46, 47]. While Tanzania has at least two
and pollinates and its ability to retain seeds in its gastro-   documented E. helvum colonies in Dar es Salaam and
intestinal tract for long periods of time and disperse          Morogoro [22, 48], little is known about the movements
them over distances greater than 70 km [16–18]. Straw-          of bats in these colonies. We aimed to understand the
colored fruit bats are gregarious, spending daytime rest        movement and foraging behavior of E. helvum in
periods in large social groups often exceeding 1000 to          Tanzania, using Global Positioning System (GPS) log-
5000 animals at centralized roosting locations. The             gers, and to investigate how this behavior relates to the
strong flight capabilities of E. helvum allow the species       connectivity of landscapes and the bats’ interactions with
to take advantage of distant resources during nighttime         other species, including humans. Our objectives were to
feeding forays and return to these day roosts daily over        explore the fine-scale movement ecology of E. helvum in
extended periods of time, rather than frequently moving         Tanzania and to also use this information to inform en-
colony roost locations nomadically in search of nutri-          vironmental surveillance of indirect contact of bats with
tional resources [17]. With colony numbers that can             other species. We hope that the insights gained from
reach a few thousand to several million bats [17, 19–22],       this work will contribute to the existing body of
their sheer numbers also enhance the extent of the eco-         knowledge on E. helvum and be helpful for both the
system services they provide. Numbers of E. helvum bats         conservation of fruit bats and for informing on the
in colonies vary across the year, likely in response to         reduction of bat-human interaction and pathogen
food availability [9, 21]. Movement patterns have also          transmission risk.
been found to change seasonally [17]. Eidolon helvum
bats have been observed to migrate over 2000 km across          Methods
many different habitat types including Zambezian wood-          Study sites and animals
land, forest-savanna mosaic, and lowland and riverine           We tracked the movements of straw-colored fruit bats
forests [23].                                                   (E. helvum) living in two colonies in Morogoro Region,
   Bats are also transmission hosts of zoonotic viruses         Tanzania in November 2016. The first site (−6.8233,
that can cause severe diseases in humans, such as Mar-          37.6662) comprised a bat colony in the Morogoro Muni-
burg virus, ebolaviruses, Nipah virus, Hendra virus, other      cipal area, with a population of 315,866 people [49],
paramyxoviruses, and coronaviruses, including Severe            while the second site (−7.6621, 36.9873) was in Kilo-
acute respiratory syndrome-like coronaviruses (SARS-            mbero District, by the Illovo Sugar Company near the
like CoVs) and Middle East respiratory syndrome cor-            Udzungwa Mountains National Park. The Kilombero site
onavirus (MERS-CoV) [24–36]. The suitability of bats as         was close to sugarcane plantations headquartered in
Randhawa et al. One Health Outlook   (2020) 2:16                                                                 Page 3 of 14

nearby Kidatu, which has a population of 32,589 people           after bats were released with affixed loggers. To
[49]. Both colony locations were amid human dwell-               download the GPS and associated acceleration data,
ings and a school. While a formal estimate of the                we walked at least once each day through the bat col-
population of bats at these colony sites was not car-            onies with the e-obs base station connected to a dir-
ried out, they were roughly estimated to be at least             ectional high-gain antenna. The base station
several thousand in number, and the Morogoro col-                automatically downloaded the data when it connected
ony’s roost size was previously estimated at 10,000              with a logger. We programmed the Argos satellite
[22]. The bats were captured with synthetic mist nets            tags at different intervals, starting with every 1.5 h in
suspended between two metal or wooden poles placed               the beginning of the study, to every 30 min, as our
near tree roosts, carefully removed from the nets, and           study progressed, in order to balance tag battery life
temporarily restrained in a closed cotton bag. Hand-             with the number of discrete GPS fixes recorded and
ling, sedation and reversal (dexmedetomidine/atipame-            with the days the tag remained attached to the bat.
zole), and release were performed in accordance with             Data from the Argos satellite tags were downloaded
the University of California, Davis, Institutional Ani-          remotely from the Argos website (http://www.argos-
mal Care and Use Committee (IACUC) (protocol                     system.org/).
number: 19300). Only adult male and female bats not
observed to be pregnant were considered for GPS-                 Analyses of movement data
logger attachment, in order to ensure that the weight            Estimation of foraging areas/feeding roost locations and
of the GPS-loggers did not exceed 5–10% of bat body              new day roosts
mass [50, 51]. All work in this study was conducted              The GPS points collected from e-obs tags were catego-
with approvals and permissions from the Tanzania                 rized as ‘flying’ or ‘not-flying’ based on the variances of
Wildlife Research Institute (2016–290-NA-2011-29).               their temporally corresponding acceleration bursts [16].
                                                                 Previous studies have differentiated acceleration bursts
GPS logger attachment                                            with higher variances in their Y- (backward-forward)
We used two types of GPS loggers: 15 g solar (e-obs,             and Z- (up-down) axes, corresponding to ‘flying’ behav-
Munich, Germany) and 3.5 g PinPoint Argos satellite              ior, from those with lower variances (‘not-flying’ behav-
tags (Lotek Wireless Inc.), and aimed to attach GPS log-         ior) by k-means clustering [16]. We compared the
gers to at least eight bats at each study site to collect suf-   classification of GPS points into ‘flying’ and ‘not-flying’
ficient movement data for analyses. This minimum                 behavior using XZ, YZ, and XYZ axes, and observed no
number was determined based on the percentages of                significant difference between them (Additional file 1:
successfully tracked E. helvum bats in previous studies          Figure S1 and Table S1). Using the GPS classification
(for tags attached to bats via adhesives) [16, 17, 23]. Tags     based on the YZ axes (Additional file 2: Figure S2), we
were attached to bats by clipping the hair between their         further subsetted sequential ‘not-flying’ GPS fixes
shoulder blades, applying Skin-Tac-H Adhesive wipe               within a radius corresponding to the distance a bat
(Torbot Group Inc.) on the clipped area, and then affix-         could travel at its average speed (determined by aver-
ing tags with cyanoacrylate glue [51]. To compare lon-           aging the ground speeds recorded for each GPS fix) and
gevity of tag application, we attached one Argos satellite       with a time interval greater than or equal to 30 s. These
tag using a collar tied with a degradable suture, Vicryl®        subsetted GPS fixes were considered to comprise both
(polyglactin 910), so that while the collar might stay on        foraging bouts (i.e. moving within a food tree) as well
longer than loggers attached with adhesive glue, it would        as night feeding roosts (Fig. 1). Points falling in the
eventually drop-off with no long-term adverse effects on         vicinity of the original colony where bats were tagged
bat health [16].                                                 were excluded from classification as foraging areas/
                                                                 feeding roosts or new day roosts. A day roost location
GPS logger setup                                                 was one where a bat was recorded as present between
The solar e-obs tags collected acceleration-informed             sunrise and sunset.
GPS fixes between 17:00–07:00, with acceleration data              The mean and range of cumulative distance flown
recorded upon 3-axes: X = left-right, Y = backward-for-          each night as well as each hour was determined. In
ward, and Z = up-down. We programmed tags to col-                addition, the maximum straight-line distance between
lect acceleration data all day at intervals of 60 s at a         day roosts and the most distant foraging sites from the
byte count of 1135 (16.67 Hz). GPS fixes were col-               colony location was determined. The utilization distribu-
lected at intervals of 45 min during GPS on-times,               tion of each bat was calculated and mapped using classic
unless the bat was moving at a speed of 50 cm/s or               kernel density estimation (KDE) with vertices set to 50
more, in which case collection intervals changed to              and 95% location probabilities respectively, using the
every 30 s. Loggers started collecting data immediately          adehabitatHR R package [52].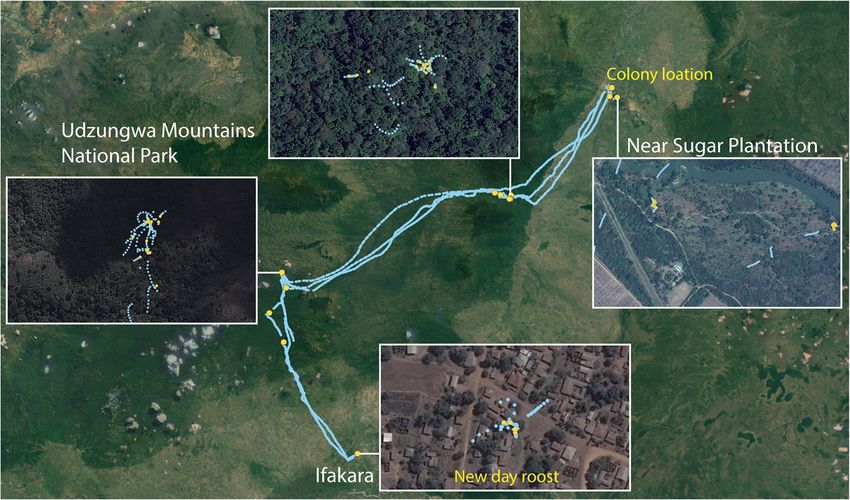
Randhawa et al. One Health Outlook          (2020) 2:16                                                                                      Page 4 of 14

 Fig. 1 Left: Classification of GPS fixes based on temporally associated acceleration bursts along Y- (backward-forward) and Z- (up-down) axes.
 Right: The GPS fixes corresponding to a bat’s third foraging night, classified as ‘Flying’ and ‘Not Flying’, and further subsetted into foraging areas/
 feeding roost locations

Distance of foraging areas/feeding roost locations from                        and to confirm whether there were any wild or domestic
urban built-up and protected areas                                             animals or signs of them at the sites. Where possible, we
We measured the distance of each foraging area/feeding                         talked with the local community members about their
roost location to its nearest urban built-up and protected                     observations on bat activity at these sites. Two remote-
area (national park or reserve) using GDAL v2.4.1 (https://                    triggered field camera traps (Reconyx™ Hyperfire
gdal.org) and GRASS GIS v7.0.5 (https://grass.osgeo.org)                       HC600) were set up at the horticultural garden at the
[53]. For determining urban built-up areas, we used the                        Sokoine University of Agriculture (SUA), Morogoro,
Global Urban Footprint (GUF), which is high resolution                         Tanzania (Fig. 6), in order to understand the potential for
human settlement/urban footprint data derived from                             other species to contact fruits discarded by bats at this for-
TerraSar-X satellite imagery [54, 55]. Originally at a reso-                   aging site. The SUA horticultural gardens were chosen be-
lution of 12 X 12 m, we aggregated urban built-up areas                        cause they were identified as being visited by the tracked
into grids of 100 X 100 m such that any larger grid con-                       bats, who fed upon mangoes at this site. Fruit bat activity
taining at least one smaller grid classified as built-up was                   at this site was confirmed by the presence of mangoes
assigned as urban [17]. In order to determine the distances                    eaten and subsequently discarded by the bats under the
of foraging locations from protected areas in Tanzania, we                     mango trees. The camera traps were fixed under mango
used data on game reserves, nature reserves, forest re-                        trees 20–30 cm from the ground to capture images of
serves, and national parks from the World Database of                          both domestic and wild animals. They were active 24 h a
Protected Areas (WDPA) [56]. The GUF and WDPA data                             day from 18th December 2017 to 2nd January 2018. Be-
were accessed in February 2016 and 2019, respectively.                         cause the bats were originally tracked in November 2016
  Unless otherwise noted, all analyses were performed with                     during the mango harvesting season, we waited for the
R v3.6.0 [52, 57–73]. The code used in the analyses is avail-                  next mango season (December 2017) to set up the camera
able at https://nistara.github.io/Tanzania-fruit-bat-study/.                   traps under circumstances similar to the tracking period.

Site characterization of foraging areas/feeding roost                          Results
locations and environmental surveillance                                       GPS logger data, foraging areas/feeding roost locations,
A convenience sample of locations identified as foraging                       and new day roosts
areas/feeding roosts (or in proximity with them) or new                        Twenty five E. helvum bats were tagged across the two
day roosts by the tracking data were visited to determine                      study sites: 15 bats in Kilombero (10 e-obs tags and five
types of trees at the site, presence of human dwellings,                       Argos satellite tags), and 10 bats in Morogoro (all Argos
Randhawa et al. One Health Outlook                (2020) 2:16                                                                                         Page 5 of 14

Table 1 Deployment summary, nights tracked, cumulative flight distances, and kernel density estimates of habitat utilization of
tracked bats
Bat            Location          Tag     Sex   Body           Date deployed      Nights with   No. of       Mean (min, max) nightly       KDE 50%       KDE 95%
                                               weight (g)     (in 2016)          fixes         GPS fixes    cumulative distance (km)      (ha)          (ha)
K5309          Kilombero         e-obs   M     284            14-Nov             5             9212         44.04 (37.65, 50.48)          3326.90       11,743.12
K5310          Kilombero         e-obs   M     310            14-Nov             5             10,806       55.83 (2.07, 97.57)           33,513.36     124,413.78
K5311          Kilombero         e-obs   M     272            14-Nov             2             1670         22.68 (22.31, 23.06)          1514.94       4861.94
K5312          Kilombero         e-obs   M     293            15-Nov             3             1957         12.48 (0.73, 28.82)           1527.30       6497.41
K5313          Kilombero         e-obs   M     271            14-Nov             6             3804         12.24 (7.93, 22.91)           142.25        1437.45
K5314          Kilombero         e-obs   M     276            15-Nov             –             –            –                             –             –
K5315          Kilombero         e-obs   M     293            15-Nov             1             340          2.92 (2.92, 2.92)             23.62         96.88
K5316          Kilombero         e-obs   M     281            15-Nov             –             –            –                             –             –
K5317          Kilombero         e-obs   F     271            15-Nov             4             2846         14.3 (0.33, 52.14)            4193.79       18,985.86
K5319          Kilombero         e-obs   M     300            15-Nov             2             1027         8.09 (5.58, 10.60)            118.16        469.22
K166357        Kilombero         Argos   M     310            16-Nov             –             –            –                                           –
K166359        Kilombero         Argos   M     276            16-Nov             1             11           5.13 (5.13, 5.13)             195.64        1193.77
K166361        Kilombero         Argos   F     261            16-Nov             2             8            0.1 (0, 0.20)                 196.62        1257.64
K166363        Kilombero         Argos   M     273            16-Nov             1             3            0.06 (0.06, 0.06)             –             –
K166366        Kilombero         Argos   M     263            16-Nov             1             12           0.77 (0.77, 0.77)             8.79          51.49
M166364        Morogoro          Argos   M     288            03-Nov             3             6            0.35 (0, 1.06)                2832.96       16,753.90
M166367        Morogoro          Argos   M     276            03-Nov             6             10           1.12 (0, 4.45)                7909.28       51,330.65
M166358        Morogoro          Argos   M     294            18-Nov             2             30           9.99 (9.84, 10.15)            868.67        4277.60
M166360        Morogoro          Argos   M     280            18-Nov             –             –            –                             –             –
M166362        Morogoro          Argos   M     200            18-Nov             1             4            0.66 (0.66, 0.66)             –             –
M166372        Morogoro          Argos   F     236            18-Nov             3             22           6.19 (0.01, 18.36)            2212.86       14,106.77
M166365        Morogoro          Argos   M     300            18-Nov             1             6            1.69 (1.69, 1.69)             22.34         109.96
M166369        Morogoro          Argos   F     193            18-Nov             1             18           2.62 (2.62, 2.62)             26.06         115.78
M166370        Morogoro          Argos   M     251            18-Nov             2             15           3.25 (1.99, 4.50)             565.31        2387.27
M166371        Morogoro          Argos   M     230            18-Nov             1             11           4.95 (4.95, 4.95)             36.61         242.45

Table 2 Number and characteristics of foraging areas/feeding roost locations and new day roosts for e-obs tagged bats
Bat       Forage/         Maximum straight-line      New day roosts      Maximum               Forage/feed roost     Forage/feed roost    Protected areas
          feed            distance to forage/        (corresponding      straight-line         fixes within 100 m    fixes within 100 m   where bat had
          roost GPS       feed roost sites (km)      no. of GPS fixes)   distance between      of built-up areas     of protected areas   forage/feed roost
          fixes                                                          day roosts (km)                                                  GPS fixes
K5309     150             19.83                      1 (30)              10.50                 26.67% (40/150)       54% (81/150)         Udzungwa Mountains
                                                                                                                                          National Park
K5310     84              62.63                      1 (30)              62.86                 11.90% (10/84)        69.05% (58/84)       Udzungwa Mountains
                                                                                                                                          National Park
K5311     25              11.03                      1 (55)              2.50                  84.00% (21/25)        0% (0/25)            –
K5312     45              11.17                      0                   –                     77.78% (35/45)        17.78% (8/45)        Udzungwa Mountains
                                                                                                                                          National Park
K5313     108             6.37                       0                   –                     91.67% (99/108)       4.63% (5/108)        Udzungwa Mountains
                                                                                                                                          National Park
K5315     12              0.97                       0                   –                     0% (0/12)             0% (0/12)            –
K5317     48              16.68                      0                   –                     0% (0/48)             25% (12/48)          Mikumi National Park
K5319     33              2.84                       0                   –                     81.82% (27/33)        0% (0/33)            –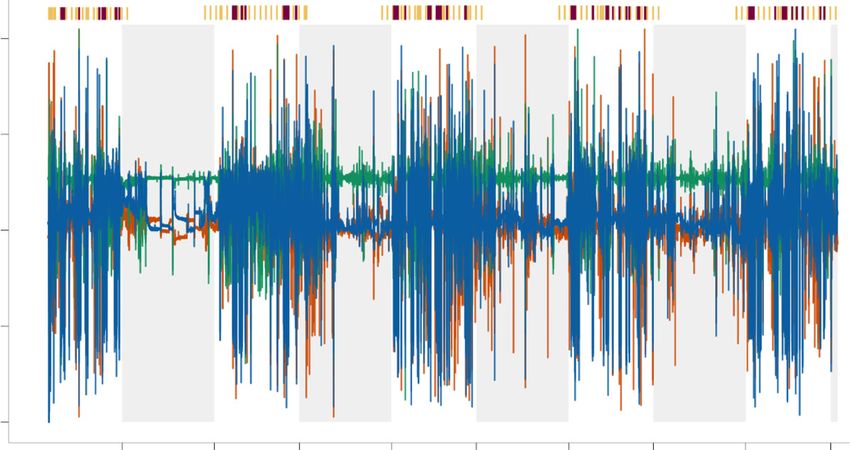
Randhawa et al. One Health Outlook        (2020) 2:16                                                                                 Page 6 of 14

satellite tags). Data was retrieved from 21 of these bats                  corresponded to 6 foraging nights. The number of GPS
(Kilombero: 8/10 e-obs tags and 4/5 Argos tags, Moro-                      fixes from e-obs tags (n: 31662) vastly outnumbered
goro: 9/10 Argos tags) (Table 1). The mean logger mass                     those by the Argos satellite tags (n: 156). We identified
of the tracked bats did not exceed 5.54% (mean ± SD:                       505 foraging areas/feeding roost locations and three new
2.92 ± 1.97, min: 1.13, max: 5.54) of bat body weight                      day roost locations from the high-resolution e-obs data
(271 ± 30 g). The bats were predominantly males (84%)                      (Table 2 and Fig. 2). In contrast to the e-obs tag data,
because their larger body mass kept the percent tag                        we were unable to classify Argos satellite tag fixes as for-
weight low and facilitated their inclusion in the study                    aging or not because of the inability to assess time spent
(males: 277 ± 25.8 g, females: 240 ± 34.8 g). The tag                      at each location and whether the bat was in flight or not.
affixed with a collar stayed on the bat for the longest                    Nonetheless, they still provided information on areas fre-
time period (14 days compared to a maximum of six days                     quented by bats (Fig. 3 and Additional file 3: Figure S3).
for tags attached by adhesives). We collected data for 1–                     The mean cumulative nightly flight distance observed
6 foraging nights per bat; even though the collared bat                    for e-obs tagged bats was 26.14 km (min: 0.33, max:
(M166367) was tracked for 14 days, its GPS fixes                           97.57). One male bat, K5310, flew cumulative nightly

 Fig. 2 Map of the tracking data obtained from eight out of ten e-obs tags attached on Eidolon helvum bats in the Kilombero District area
Randhawa et al. One Health Outlook        (2020) 2:16                                                                                Page 7 of 14

 Fig. 3 Map of the tracking data obtained from nine of the ten bats tagged with Argos satellite tags in Morogoro

distances of 96.46 and 97.57 km on two consecutive                        and Figure S4). He foraged in urban, semi-urban, and in-
nights, the longest nightly distances flown by any of the                 tact forest landscapes along his flight path. Bat K5310
tracked bats, connecting his roost location in the Kilo-                  also had the maximum hourly distance flown of any bat:
mbero site to a newly identified day roost in Ifakara,                    38.08 km flown between 1 and 2 am on the third tracked
Kilombero District (Fig. 4, Additional file 4: Table S4                   night (Additional file 5: Table S5.1 and Figure S5). The

 Fig. 4 The flight path of bat K5310, who frequented both protected and urban areas, flying a cumulative distance of up to 97.57 km during a
 single foraging night (yellow circles depict foraging areas/feeding roost locations)
Randhawa et al. One Health Outlook       (2020) 2:16                                                                    Page 8 of 14

 Fig. 5 Heatmap of the mean hourly distances (km) flown by individual bats on foraging nights

mean hourly distances flown by all bats is shown in Fig. 5               the majority (93%) of them in Udzungwa Mountains Na-
and presented in Additional file 5: Table S5.2. Home range               tional Park, followed by Mikumi National Park (Table
sizes varied between 51.49 and 124,413.78 ha based on                    2). Eleven GPS fixes from the Morogoro bats were
95% KDE (Table 1 and Additional file 6: Figure S6). The                  within 100 m of protected areas, all in the Nyandira
bats tended to visit the same sites on subsequent nights                 Reserve.
(Additional file 7: Figure S7), and while all male e-obs
tagged bats flew in a direction south of their roosting col-
ony, the only female e-obs tagged bat (K5317) flew in the                Site characterization and environmental surveillance
northern direction (Fig. 2).                                             We visited nine sites for habitat characterization and
                                                                         while we did not hone in directly on GPS fixes to iden-
                                                                         tify the exact trees visited by bats, we observed the gen-
Distance of foraging areas/feeding roost locations from                  eral diversity of trees present at these sites. Sixteen
urban built-up and protected areas                                       species of trees (Table 3) were identified and conversa-
Of the 505 identified foraging areas/feeding roost loca-                 tions with community members at these sites revealed
tions obtained from E. helvum bats tagged with e-obs                     that mangoes were a favorite of E. helvum. During
loggers in Kilombero, approximately 25% (126/505) were                   mango season (November–December), the bats were re-
in areas classified as built-up by the Global Urban Foot-                ported to feed on mango fruit and in addition to the
print while 46% (232/505) were within 100 m of built-up                  noise they made while feeding at night, they also caused
areas (Table 2) [54]. Even though we could not ascertain                 destruction of the mango harvest, scattering chewed-
foraging areas from the Argos satellite tags, distances of               upon mangoes on the ground. Five of the sites visited by
GPS fixes from urban areas excluding the tagging loca-                   us corresponded to newly identified day roost locations.
tion revealed that approximately 60% (84/139) of these                   We did not observe any new roosting colony, although
locations were within urban areas, and 77% (107/139)                     community members at the Ifakara site pointed out
were in proximity (within 100 m) to built-up landscapes.                 palm trees that served as colony roost locations in the
  In the case of protected areas, approximately 32%                      previous year (2015).
(164/505) of the Kilombero E. helvum foraging points                        At the horticulture garden in Sokoine University of
were in or within 100 m of a national park or reserve,                   Agriculture (SUA) in Morogoro, we directly observed
Randhawa et al. One Health Outlook (2020) 2:16 Page 9 of 14
Table 3 Characteristics of nine sites frequented by Eidolon helvum
No. Site (Lat, Long) Human Wild animals or Domestic animals Trees observed
dwellings/ signs of animals or their signs
buildings
1 Ifakara† (−8.136, 36.987) Yes None observed Chickens, dogs, cats Syzygium guineese,
Elaeis quineensis,
Muntingia
calabura,
Mangofera indica,
Musa spp.
2 Mang’ula, Udzungwa Mountains National No Non-human primates None observed Sorindea
Park (−7.799, 36.878) madagascarensis,
Psychotria
capensis,
Leptactina
platyphylla
3 Msolwa ujamaa, Udzungwa (−7.744, 36.929) Yes Non-human primates Chickens, ducks, goats, Cocos nucifera,
dogs, cats
Mangofera indica,
Azadirachta indica,
Ficus spp.,
Milicia excelsa
†
4, Udzungwa Yes Non-human primates None observed Syzygium guineese,
5
(−7.731, 36.929) Mangofera indica,
(−7.731, 36.922) Psidium guajava,
Anacardium
occidentale
6 Kidatu (−7.683, 36.966) Yes None observed Chickens, dogs, cats, Syzygium
goats, pigs guineese,
Mangofera indica,
Citrus spp.
(orange),
Ficus spp.,
Mishoki*
†
7, Kilombero, Illovo No None observed None observed Ficus spp.
8
(−7.673, 36.987)
(−7.673, 36.988)
9 Horticulture garden, Morogoro (−6.845, Yes Via camera traps: Non-human primates, None observed Mangofera indica
37.663) mongoose, rat, cat
*
Local name for tree not identified by common English names
†
These locations were also newly identified day roost sites
discarded mangoes that had been chewed and left be- workers, security guards, and visitors who were there to
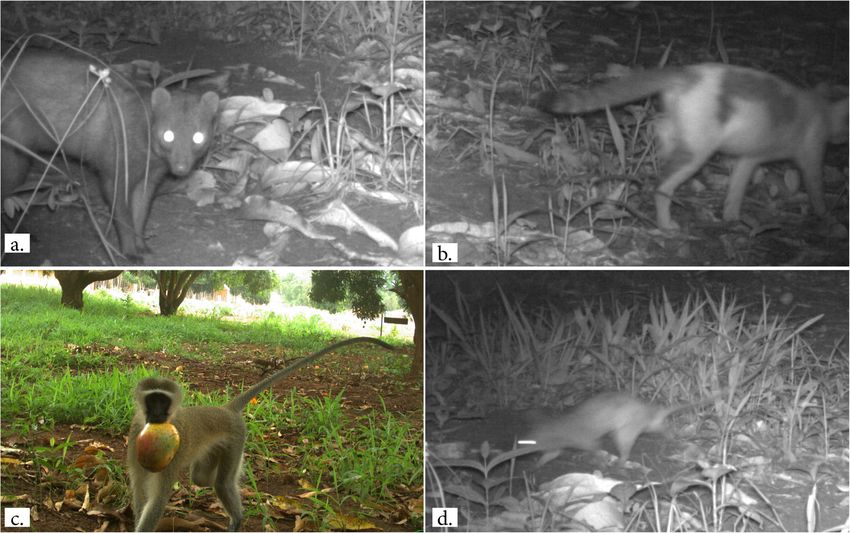
hind by fruit bats (Fig. 6). Camera-traps set up at this or- collect fallen mangoes.
chard showed visits by five mammals: vervet monkeys
(Chlorocebus pygerythrus), domestic cat (Felis catus), Discussion
common dwarf mongoose (Helogale parvula), Rattus Our study takes an integrative approach to better under-
rattus, and humans (Fig. 7). Vervet monkeys at the site stand E. helvum ecology in Tanzania, looking at both
were observed handling fallen or discarded mangoes and their movement patterns and identification of potential
putting them in their mouths (Fig. 7 and Add- pathways of pathogen transmission among bats and
itional file 8). The people observed at the camera trap- other species. In the first work of this kind in Tanzania,
ping site were predominantly adults, including farm results reveal that one straw-colored fruit bat, E. helvum,Randhawa et al. One Health Outlook (2020) 2:16 Page 10 of 14 Fig. 6 a. Site for setting up camera-traps, identified by tracking data. b. Worker harvesting mangoes at this site. c. Half-eaten mango discarded by foraging bats. d. Discarded mangoes on the ground under mango trees flew up to 97 km over a single foraging night, frequent- bats in the Morogoro site were tracked to within 100 m ing both urban built-up and protected areas. With max- of the Nyandira reserve, part of the Uluguru Mountain imum straight-line distances of 62 km from day roosts to range. Both UMNP and the Uluguru mountains are im- foraging areas/feeding roost locations, their foraging dis- portant areas for endemic species of vertebrates and tances enable E. helvum to connect land fragmented by trees in Africa [77], and therefore the seed dispersal human activities and provide valuable seed dispersal and services offered by fruit bats in these regions potentially pollination services across vast distances [16–18]. Seed also support the biodiversity contained within them. For- dispersal by E. helvum can help regenerate forests in de- ests no longer exist in the Nyandira reserve, due primar- graded landscapes and can also contribute to the local ily to clearance for new farmland, and it is possible that economy through support for the propagation of eco- tracked bats were foraging on human-cultivated plants nomically important plants and trees, e.g., African teak, or trees [78, 79]. The loss of natural food sources due to a valuable source of timber [74]. The African teak tree clearing of native forest and the subsequent shift by bats (Milicia excelsa) was among several tree species identi- to feeding on agricultural fruit crops can lead to a con- fied by us at sites visited by tracked bats, along with flict between bats and fruit-growers [80]. Perceptions of mango and cashew trees, which are important fruit trees E. helvum shared by community members at our study grown in Tanzania [74–76]. sites and identified foraging areas/feeding roost locations Protected areas like Udzungwa Mountains National revealed that bats were disliked and harassed by some Park (UMNP) are important for E. helvum for both community members. Farmers growing mangoes com- foraging and roosting activities. They provide native plained of fruit bats negatively impacting their mango sources of food to fruit bats, rather than introduced agri- harvest, while also being highly-vocal at night and dis- cultural fruit species like mangoes. In return, bats can rupting village households. Some community members help maintain forest tree composition and propagation drove the bats away with smoke from fires lit under tree in a mutually beneficial relationship [3]. Eidolon helvum roosts or by cutting down the trees themselves. Our
Randhawa et al. One Health Outlook        (2020) 2:16                                                                                Page 11 of 14

 Fig. 7 Pictures of species detected at the camera-trap site. a Common dwarf mongoose (Helogale parvula). b Domestic cat (Felis catus). c Vervet
 monkey (Chlorocebus pygerythrus). d Black rat (Rattus rattus)

findings support the suggestion that preserving natural                    contrast with bat-associated zoonotic disease outbreaks
forests or strategically planting native trees specifically                occuring elsewhere in east-central Africa [84, 85]. How-
for bat roosts could encourage and draw bats away from                     ever, factors such as roosting in urban colonies (our
fruit crops and human dwellings, thus lessening the po-                    study sites, [16, 17]), foraging in both urban and pro-
tential for bat-human conflict [81].                                       tected areas, and the possibility of being transmission
  Camera-traps set up at locations identified by tracking                  hosts of human diseases [32, 33] make tracking E. hel-
data helped us elucidate species interactions and provide                  vum movements important for understanding further
evidence that bats, non-human primates, and other                          exposure pathways and species interactions.
species may have common or shared virus exposure                             As a pilot study, we successfully explored new ways to
pathways. Due to viral shedding through oral secretions,                   collect data that can be used to inform disease surveil-
fruits discarded by bats could serve as vectors for dis-                   lance. Increasing the numbers and species of animals
ease transmission to other animals coming into contact                     tracked, as well as determining differences due to sex,
with the discarded chewed fruit, e.g. the vervet mon-                      season, or migratory patterns could further help our un-
keys pictured handling discarded mangoes [82], and                         derstanding of bat movement patterns and factors affect-
people, especially children who eat discarded fruits                       ing disease transmission and spread between bats and
from bats because of their sweetness and them having                       other species [9, 17, 23].
already been spoiled for sale at markets. Similarly, con-
taminated fecal droppings at foraging and roosting lo-                     Conclusions
cations could be another route of infection to humans                      Eidolon helvum bats play an important role in the pollin-
and other species. Bats connecting different landscapes                    ation and seed dispersal of plants within both protected
might possibly act as bridge species between relatively                    and urban areas in Tanzania; and the conservation of
undisturbed regions and urban areas, potentially trans-                    bats and protected areas is thus interdependent. Their
mitting novel pathogens to other species either directly                   movement patterns also suggest the possibility of indir-
or indirectly [83]. Currently, there are no known hu-                      ect contact among bats, non-human primates, livestock,
man outbreaks associated with bats in Tanzania, in                         and humans in bat foraging areas near human dwellings
Randhawa et al. One Health Outlook             (2020) 2:16                                                                                            Page 12 of 14

and in horticulture, as well as an opportunity for virus                          and supervised the study; contributed to the interpretation of the results,
sharing to occur between bats and other wild species in                           and co-wrote the paper. ZS, AM, CK, ABE, AJS collected the data and
                                                                                  reviewed and edited the manuscript. WS contributed to the study design
protected areas. Ensuring that bats have access to wild                           and reviewed and edited the manuscript. DJW, RRK, JHE contributed to the
food sources away from human dwellings or crop plan-                              study design and reviewed and approved the manuscript. BML contributed
tations should be explored as a potential intervention to                         to the interpretation of the results and reviewed and edited the manuscript.

mitigate conflict between fruit bats and humans, reduce
                                                                                  Funding
potential virus sharing, and foster a more amicable coex-                         This study was funded by the US Department of Defense’s Defense Threat
istence between species.                                                          Reduction Agency – Cooperative Biological Engagement Program (DTRA-
                                                                                  CBEP): Contract Number: HDTRA1–14-1-0052. The contents of this paper are
                                                                                  the responsibility of the authors and do not necessarily reflect the views of
Supplementary information                                                         DTRA-CBEP, or the United States Government.
Supplementary information accompanies this paper at https://doi.org/10.
1186/s42522-020-00020-9.
                                                                                  Availability of data and materials
                                                                                  The GPS unit data analyzed during the current study are available at https://
 Additional file 1 Table S1. Association between the classification of            osf.io/m3xks/.
 GPS fixes as Flying or Not Flying by different acceleration axes (XYZ, XZ,
 and YZ). Figure S1. Association between the classification of GPS fixes as       Ethics approval and consent to participate
 Flying or Not Flying by different acceleration axes (XYZ, XZ, and YZ).           Bats were captured and tagged under protocols approved by the UC Davis
 Additional file 2 Figure S2. Plots of acceleration axes readings and             Institutional Animal Care and Use Committee (IACUC #19300) and through
 associated GPS classification (Flying/Not Flying)                                permission granted by the Tanzania Wildlife Research Institute (2016–290-
 Additional file 3 Figure S3. Map of GPS tracks of bats tagged with               NA-2011-29).
 Argos tags in the Kilombero site.
                                                                                  Consent for publication
 Additional file 4 Table S4. Cumulative distances flown by individual
                                                                                  Not applicable.
 bats on each foraging night. Figure S4. Line plot of cumulative distances
 flown by individual bats on each foraging night.
                                                                                  Competing interests
 Additional file 5 Figure S5. Heatmap of mean hourly distances (km)
                                                                                  The authors declare that they have no competing interests.
 flown by bats during individual foraging nights. Table S5.1. Mean
 cumulative hourly distances (km) flown by bats during individual
                                                                                  Author details
 foraging nights. Table S5.2. Cumulative hourly distances (km) flown by           1
                                                                                   Karen C. Drayer Wildlife Health Center, One Health Institute, School of
 bats during foraging nights.
                                                                                  Veterinary Medicine, University of California, 1089 Veterinary Drive, Davis, CA,
 Additional file 6 Figure S6. Contours of 50 (darker) and 95 (lighter)            USA. 2School of Veterinary Medicine and Biomedical Sciences, School of
 percent probability of utilization for each bat. The white star represents       Natural Resources, University of Nebraska, Lincoln, NE, USA. 3Department of
 the tagging location/colony roost site.                                          Veterinary Medicine and Public Health, College of Veterinary Medicine and
 Additional file 7 Figure S7. Maps of GPS tracks of bats tagged with e-           Biomedical Sciences, Sokoine University of Agriculture, Morogoro, Tanzania.
                                                                                  4
 obs loggers in Kilombero. Each map is followed by a map with a nightly            Tanzania National Park, Burigi-Chato National Park, Karagwe-Kagera,
 breakdown of GPS tracks. The tracks are colored by individual bats, with         Tanzania. 5School of Veterinary Medicine, University of Surrey, Guildford, UK.
                                                                                  6
 the larger blue circle corresponding to colony location, the larger red cir-      EcoHealth Alliance, New York, NY, USA. 7Center for Animal Disease
 cle corresponding to new day roosts (if any), and foraging/feeding roost         Modeling and Surveillance, School of Veterinary Medicine, University of
 areas depicted with yellow circles.                                              California, Davis, CA, USA.
 Additional file 8. Pictures of camera traps and collected images.
                                                                                  Received: 3 October 2019 Accepted: 6 May 2020

Abbreviations
CoV: Coronavirus; GPS: Global Positioning System; GUF: Global Urban               References
Footprint; IACUC: Institutional Animal Care and Use Committee;                    1. Fujita MS, Tuttle MD. Flying foxes (Chiroptera: Pteropodidae): threatened
MERS: Middle East respiratory syndrome; SARS: Severe acute respiratory                animals of key ecological and economic importance. Conserv Biol. 1991;5(4):
syndrome; SUA: Sokoine University of Agriculture; UMNP: Udzungwa                      455–63. http://doi.wiley.com/10.1111/j.1523-1739.1991.tb00352.x.
Mountains National Park; WDPA: World Database of Protected Areas                  2. Muscarella R, Fleming TH. The role of frugivorous bats in tropical forest
                                                                                      succession. Biol Rev Camb Philos Soc. 2007;82(4):573–90. https://doi.org/10.
Acknowledgements                                                                      1111/j.1469-185X.2007.00026.x.
We are grateful to the Health for Animals and Livelihood Improvement              3. Kunz TH, Braun de Torrez E, Bauer D, Lobova T, Fleming TH. Ecosystem
Project (HALI) and local support teams who made our study possible,                   services provided by bats. Ann N Y Acad Sci. 2011;1223:1–38. https://doi.
especially Amani Zacharia and Nyambabi. We would like to thank Drs. Kirsten           org/10.1111/j.1749-6632.2011.06004.x.
Gilardi and Christine Kreuder Johnson for their insightful comments on our        4. Seltzer CE, Ndangalasi HJ, Cordeiro NJ. Seed dispersal in the dark: shedding
draft, and Marc Buentjen at e-obs for providing valuable advice and support           light on the role of fruit bats in Africa. Biotropica. 2013;45(4):450–6. https://
before, during, and after the study. We are also very thankful to our reviewers       doi.org/10.1111/btp.12029.
for their constructive feedback on this manuscript. Finally, we appreciate the    5. Scanlon AT, Petit S, Tuiwawa M, Naikatini A. High similarity between a bat-
support from the US Department of Defense’s Defense Threat Reduction                  serviced plant assemblage and that used by humans. Biol Conserv. 2014;
Agency – Cooperative Biological Engagement Program (DTRA-CBEP) and the                174:111–9. https://doi.org/10.1016/j.biocon.2014.03.023.
subsequent subcontract from Metabiota in funding this study.                      6. Nathan R. Long-distance dispersal of plants. Science. 2006;313(5788):786–8.
                                                                                      https://doi.org/10.1126/science.1124975.
Authors’ contributions                                                            7. Damschen EI, Brudvig LA, Haddad NM, Levey DJ, Orrock JL, Tewksbury JJ.
NR designed and performed the study, collected and analyzed data, and                 The movement ecology and dynamics of plant communities in fragmented
drafted the manuscript. EVW conceived, designed, and supervised the study;            landscapes. Proc Natl Acad Sci U S A. 2008;105(49):19078–83. https://doi.
contributed to the interpretation of the results; and reviewed and edited the         org/10.1073/pnas.0802037105.
manuscript. BB collected the data, contributed to the interpretation of the       8. Shilton LA, Altringham JD, Compton SG, Whittaker RJ. Old World fruit bats
results, and reviewed and edited the manuscript. JM conceived, designed,              can be long-distance seed dispersers through extended retention of viable
Randhawa et al. One Health Outlook (2020) 2:16 Page 13 of 14
seeds in the gut. Proc R Soc Lond Ser B Biol Sci. 1999. https://doi.org/10. 28. Goldstein T, Anthony SJ, Gbakima A, Bird BH, Bangura J, Tremeau-Bravard A,
1098/rspb.1999.0625. et al. The discovery of Bombali virus adds further support for bats as hosts
9. Richter HV, Cumming GS. Food availability and annual migration of the of ebolaviruses. Nat Microbiol. 2018;3(10):1084–9. https://doi.org/10.1038/
straw-colored fruit bat Eidolon helvum. J Zool. 2006;268(1):35–44. https:// s41564-018-0227-2.
doi.org/10.1111/j.1469-7998.2005.00020.x. 29. Thanapongtharm W, Linard C, Wiriyarat W, Chinsorn P, Kanchanasaka B, Xiao
10. Tsoar A, Nathan R, Bartan Y, Vyssotski A, Dell’Omo G, Ulanovsky N. Large- X, et al. Spatial characterization of colonies of the flying fox bat, a carrier of
scale navigational map in a mammal. Proc Natl Acad Sci U S A. 2011; Nipah virus in Thailand. BMC Vet Res. 2015;11:81. https://doi.org/10.1186/
108(37):E718–24. https://doi.org/10.1073/pnas.1107365108. s12917-015-0390-0.
11. Foley JA, Defries R, Asner GP, Barford C, Bonan G, Carpenter SR, et al. Global 30. Daszak P, Zambrana-Torrelio C, Bogich TL, Fernandez M, Epstein JH, Murray
consequences of land use. Science. 2005;309(5734):570–4. https://doi.org/ KA, et al. Interdisciplinary approaches to understanding disease emergence:
10.1126/science.1111772. the past, present, and future drivers of Nipah virus emergence. Proc Natl
12. Mayaux P, Holmgren P, Achard F, Eva H, Stibig H-J, Branthomme A. Tropical Acad Sci U S A. 2013;110(Suppl 1):3681–8. https://doi.org/10.1073/pnas.
forest cover change in the 1990s and options for future monitoring. Philos 1201243109.
Trans R Soc Lond Ser B Biol Sci. 2005;360(1454):373–84. https://doi.org/10. 31. Drexler JF, Corman VM, Gloza-Rausch F, Seebens A, Annan A, Ipsen A, et al.
1098/rstb.2004.1590. Henipavirus RNA in African bats. PLoS One. 2009;4(7):e6367. https://doi.org/
13. Bacles CFE, Lowe AJ, Ennos RA. Effective seed dispersal across a fragmented 10.1371/journal.pone.0006367.
landscape. Science. 2006;311(5761):628. https://doi.org/10.1126/science. 32. Baker KS, Todd S, Marsh GA, Crameri G, Barr J, Kamins AO, et al. Novel,
1121543. potentially zoonotic paramyxoviruses from the African straw-colored fruit
14. Cordeiro NJ, Howe HF. Forest fragmentation severs mutualism between bat Eidolon helvum. J Virol. 2013;87(3):1348–58. https://doi.org/10.1128/JVI.
seed dispersers and an endemic African tree. Proc Natl Acad Sci U S A. 01202-12.
2003;100(24):14052–6. https://doi.org/10.1073/pnas.2331023100. 33. Anthony SJ, Johnson CK, Greig DJ, Kramer S, Che X, Wells H, et al. Global
15. Corlett RT. Frugivory and seed dispersal by vertebrates in tropical and patterns in coronavirus diversity. Virus Evol. 2017;3(1):vex012. https://doi.
subtropical Asia: an update. Global Ecology and Conservation. 2017;11:1– org/10.1093/ve/vex012.
22. https://doi.org/10.1016/j.gecco.2017.04.007. 34. Li W, Shi Z, Yu M, Ren W, Smith C, Epstein JH, et al. Bats are natural
16. Abedi-Lartey M, Dechmann DKN, Wikelski M, Scharf AK, Fahr J. Long- reservoirs of SARS-like coronaviruses. Science. 2005;310(5748):676–9. https://
distance seed dispersal by straw-coloured fruit bats varies by season and doi.org/10.1126/science.1118391.
landscape. Global Ecology and Conservation. 2016;7:12–24. https://doi.org/ 35. Anthony SJ, Gilardi K, Menachery VD, Goldstein T, Ssebide B, Mbabazi R,
10.1016/j.gecco.2016.03.005. et al. Further evidence for bats as the evolutionary source of Middle East
17. Fahr J, Abedi-Lartey M, Esch T, Machwitz M, Suu-Ire R, Wikelski M, et al. respiratory syndrome coronavirus. MBio. 2017;8(2). https://doi.org/10.1128/
Pronounced seasonal changes in the movement ecology of a highly mBio.00373-17.
gregarious central-place forager, the African straw-coloured fruit bat 36. Ge X-Y, Li J-L, Yang X-L, Chmura AA, Zhu G, Epstein JH, et al. Isolation and
(Eidolon helvum). PLoS One. 2015;10(10):e0138985. https://doi.org/10.1371/ characterization of a bat SARS-like coronavirus that uses the ACE2 receptor.
journal.pone.0138985. Nature. 2013;503(7477):535–8. https://doi.org/10.1038/nature12711.
18. van Toor ML, O’Mara MT, Abedi-Lartey M, Wikelski M, Fahr J, Dechmann 37. Han H-J, Wen H-L, Zhou C-M, Chen F-F, Luo L-M, Liu J-W, et al. Bats as
DKN. Linking colony size with quantitative estimates of ecosystem services reservoirs of severe emerging infectious diseases. Virus Res. 2015;205:1–6.
of African fruit bats. Curr Biol. 2019;29(7):R237–8. https://doi.org/10.1016/j. https://doi.org/10.1016/j.virusres.2015.05.006.
cub.2019.02.033. 38. Kunz TH. Ecology of bats: Springer Science & Business Media; 2013.
19. Thomas DW. The annual migrations of three species of West African fruit 39. Teeling EC, Springer MS, Madsen O, Bates P, O’brien SJ, Murphy WJ. A
bats (Chiroptera: Pteropodidae). Can J Zool. 1983;61(10):2266–72. https:// molecular phylogeny for bats illuminates biogeography and the fossil record.
doi.org/10.1139/z83-299. Science. 2005;307(5709):580–4. https://doi.org/10.1126/science.1105113.
20. Hayman DTS, McCrea R, Restif O, Suu-Ire R, Fooks AR, Wood JLN, et al. 40. Wilson DE, Reeder DM. Mammal species of the world: a taxonomic and
Demography of straw-colored fruit bats in Ghana. J Mammal. 2012;93(5): geographic reference: JHU Press; 2005.
1393–404. https://doi.org/10.1644/11-MAMM-A-270.1. 41. Jepsen GL. Early Eocene bat from Wyoming. Science. 1966;154(3754):1333–
21. Webala PW, Musila S, Makau R. Roost occupancy, roost site selection and 9. https://doi.org/10.1126/science.154.3754.1333.
diet of straw-coloured fruit bats (Pteropodidae: Eidolon helvum) in western 42. Drexler JF, Corman VM, Wegner T, Tateno AF, Zerbinati RM, Gloza-Rausch F,
Kenya: the need for continued public education. Acta Chiropt. 2014;16(1): et al. Amplification of emerging viruses in a bat colony. Emerg Infect Dis.
85–94. https://doi.org/10.3161/150811014X683291. 2011;17(3):449–56. https://doi.org/10.3201/eid1703.100526.
22. Peel AJ, Wood JLN, Baker KS, Breed AC, Carvalho AD, Fernández-Loras A, 43. O’Shea TJ, Cryan PM, Cunningham AA, Fooks AR, Hayman DTS, Luis AD,
et al. How does Africa’s most hunted bat vary across the continent? et al. Bat flight and zoonotic viruses. Emerg Infect Dis. 2014;20(5):741–5.
Population traits of the straw-coloured fruit bat (Eidolon helvum) and its https://doi.org/10.3201/eid2005.130539.
interactions with humans. Acta Chiropt. 2017;19(1):77–92. https://doi.org/ 44. Dobson AP. What links bats to emerging infectious diseases? Science. 2005;
10.3161/15081109ACC2017.19.1.006. 310(5748):628–9. https://doi.org/10.1126/science.1120872.
23. Richter HV, Cumming GS. First application of satellite telemetry to track 45. Calisher CH, Childs JE, Field HE, Holmes KV, Schountz T. Bats: important
African straw-coloured fruit bat migration. J Zool. 2008;275(2):172–6. reservoir hosts of emerging viruses. Clin Microbiol Rev. 2006;19(3):531–45.
https://doi.org/10.1111/j.1469-7998.2008.00425.x. https://doi.org/10.1128/CMR.00017-06.
24. Amman BR, Carroll SA, Reed ZD, Sealy TK, Balinandi S, Swanepoel R, et al. 46. Peel AJ, Sargan DR, Baker KS, Hayman DTS, Barr JA, Crameri G, et al.
Seasonal pulses of Marburg virus circulation in juvenile Rousettus Continent-wide panmixia of an African fruit bat facilitates transmission of
aegyptiacus bats coincide with periods of increased risk of human infection. potentially zoonotic viruses. Nat Commun. 2013;4:2770. https://doi.org/10.
PLoS Pathog. 2012;8(10):e1002877. https://doi.org/10.1371/journal.ppat. 1038/ncomms3770.
1002877. 47. Helbig-Bonitz M, Rutten G, Kalko EKV. Fruit bats can disperse figs over
25. Towner JS, Amman BR, Sealy TK, Carroll SAR, Comer JA, Kemp A, et al. different land-use types on Mount Kilimanjaro, Tanzania. Afr J Ecol. 2014;
Isolation of genetically diverse Marburg viruses from Egyptian fruit bats. 52(1):122–5. https://doi.org/10.1111/aje.12090.
PLoS Pathog. 2009;5(7):e1000536. https://doi.org/10.1371/journal.ppat. 48. Hayman DTS, Peel AJ. Can survival analyses detect hunting pressure in a
1000536. highly connected species? Lessons from straw-coloured fruit bats. Biol
26. Ogawa H, Miyamoto H, Nakayama E, Yoshida R, Nakamura I, Sawa H, et al. Conserv. 2016;200:131–9. https://doi.org/10.1016/j.biocon.2016.06.003.
Seroepidemiological prevalence of multiple species of filoviruses in fruit 49. National Bureau of Statistics. Tanzania population and housing census;
bats (Eidolon helvum) migrating in Africa. J Infect Dis. 2015;212(Suppl 2): 2012.
S101–8. https://doi.org/10.1093/infdis/jiv063. 50. Sikes RS, Gannon WL, Animal Care and Use Committee of the American
27. Shears P, O’Dempsey TJD. Ebola virus disease in Africa: epidemiology and Society of Mammalogists. Guidelines of the American Society of
nosocomial transmission. J Hosp Infect. 2015;90(1):1–9. https://doi.org/10. Mammalogists for the use of wild mammals in research. J Mammal. 2011;
1016/j.jhin.2015.01.002. 92(1):235–53. https://doi.org/10.1644/10-MAMM-F-355.1.Randhawa et al. One Health Outlook (2020) 2:16 Page 14 of 14
51. O’Mara MT, Wikelski M, Dechmann DKN. 50 years of bat tracking: device 76. Msogoya JT, Kimaro SE. Assessment and management of post-harvest losses
attachment and future directions. Methods Ecol Evol. 2014;5(4):311–9. of fresh mango under small-scale business in Morogoro, Tanzania. Journal
https://doi.org/10.1111/2041-210X.12172. of Animal & Plant Sciences. 2011;11(1):1358–63.
52. Calenge C. The package adehabitat for the R software: tool for the analysis 77. Burgess ND, Butynski TM, Cordeiro NJ, Doggart NH, Fjeldså J, Howell KM,
of space and habitat use by animals. Ecol Model. 2006;197:1035. et al. The biological importance of the Eastern Arc Mountains of Tanzania
53. GRASS Development team. Geographic Resources Analysis Support System and Kenya. Biol Conserv. 2007;134(2):209–31. https://doi.org/10.1016/j.
(GRASS) Software. Open Source Geospatial Foundation. 2018. Available biocon.2006.08.015.
from: https://grass.osgeo.org. 78. Doggart N, Lovett J, Mhoro B, Kiure J, Burgess N. Biodiversity surveys in the
54. Esch T, Heldens W, Hirner A, Keil M, Marconcini M, Roth A, et al. Breaking forest reserves of the Uluguru Mountains. Technical paper for The Wildlife
new ground in mapping human settlements from space – the Global Conservation Society of Tanzania. 2004. Available from: http://www.
Urban Footprint. ISPRS J Photogramm Remote Sens. 2017;134:3042. https:// easternarc.or.tz/groups/webcontent/documents/pdf/Ulugurus%20draft%2
doi.org/10.1016/j.isprsjprs.2017.10.012. 0Part%201%20v.5.pdf.
55. Esch T, Schenk A, Ullmann T, Thiel M, Roth A, Dech S. Characterization of 79. Burgess N, Doggart N, Lovett JC. The Uluguru Mountains of eastern
land cover types in TerraSAR-X images by combined analysis of speckle Tanzania: the effect of forest loss on biodiversity. Oryx. 2002;36(2):140–52.
statistics and intensity information. IEEE Trans Geosci Remote Sens. 2011; https://doi.org/10.1017/S0030605302000212.
49(6):1911–25. https://doi.org/10.1109/TGRS.2010.2091644. 80. Aziz SA, Olival KJ, Bumrungsri S, Richards GC, Racey PA. The conflict
56. UNEP-WCMC. Protected area profile for United Republic of Tanzania from between pteropodid bats and fruit growers: species, legislation and
the world database of protected areas; 2018. Available from: www. mitigation. In: Bats in the anthropocene: conservation of bats in a changing
protectedplanet.net. world. Cham: Springer; 2016. p. 377–426.
57. R Development Core Team. R: a language and environment for statistical 81. Law B, Eby P, Somerville D. Tree-planting to conserve flying-foxes and
computing. Vienna: R Foundation for statistical Computing; 2008. Available reduce orchard damage. Managing the grey-headed flying-fox as a
from: http://www.R-project.org. threatened species. Sydney: Royal Zoological Society of New South Wales;
58. Kahle D, Wickham H. Ggmap: spatial visualization with ggplot2. The R 2002. p. 84–94. Available from: https://publications.rzsnsw.org.au/doi/pdf/1
Journal. 2013;5(1):144–61 Available from: https://journal.r-project.org/ 0.7882/FS.2002.041.
archive/2013-1/kahle-wickham.pdf. 82. Amman BR, Jones MEB, Sealy TK, Uebelhoer LS, Schuh AJ, Bird BH, et al. Oral
59. Harrison E, Drake T, Ots R. Finalfit: quickly create elegant regression results shedding of Marburg virus in experimentally infected Egyptian fruit bats
tables and plots when modelling; 2020. Available from: https://CRAN.R- (Rousettus aegyptiacus). J Wildl Dis. 2015;51(1):113–24. https://doi.org/10.
project.org/package=finalfit. 7589/2014-08-198.
60. Dowle M, Srinivasan A. Data.Table: extension of ‘data.frame’; 2019. Available 83. Caron A, Cappelle J, Cumming GS, de Garine-Wichatitsky M, Gaidet N.
from: https://CRAN.R-project.org/package=data.table. Bridge hosts, a missing link for disease ecology in multi-host systems. Vet
61. Kranstauber B, Smolla M, Scharf AK. Move: visualizing and analyzing animal Res. 2015;46:83. https://doi.org/10.1186/s13567-015-0217-9.
track data; 2019. Available from: https://CRAN.R-project.org/package=move. 84. Towner JS, Pourrut X, Albariño CG, Nkogue CN, Bird BH, Grard G, et al.
62. Wickham H, François R, Henry L, Müller K. “Dplyr”: a grammar of data Marburg virus infection detected in a common African bat. PLoS One. 2007;
manipulation; 2020. Available from: https://CRAN.R-project.org/package= 2(8):e764. https://doi.org/10.1371/journal.pone.0000764.
dplyr. 85. Pigott DM, Golding N, Mylne A, Huang Z, Weiss DJ, Brady OJ, et al. Mapping
63. Bivand R, Lewin-Koh N. Maptools: tools for handling spatial objects; 2019. the zoonotic niche of Marburg virus disease in Africa. Trans R Soc Trop Med
Available from: https://CRAN.R-project.org/package=maptools. Hyg. 2015;109(6):366–78. https://doi.org/10.1093/trstmh/trv024.
64. Grolemund G, Wickham H. Dates and times made easy with lubridate. J Stat
Softw. 2011;40(3):1–25 Available from: http://www.jstatsoft.org/v40/i03. Publisher’s Note
65. Xie Y. Knitr: a general-purpose package for dynamic report generation in R; Springer Nature remains neutral with regard to jurisdictional claims in
2020. Available from: https://yihui.org/knitr. published maps and institutional affiliations.
66. Wickham H, Henry L. Tidyr: tidy messy data; 2020. Available from: https://
CRAN.R-project.org/package=tidyr.
67. Wilke CO. Cowplot: streamlined plot theme and plot annotations for
‘ggplot2’; 2019. Available from: https://CRAN.R-project.org/package=
cowplot.
68. Rudis B. Hrbrthemes: additional themes, theme components and utilities for
‘ggplot2’; 2019. Available from: https://CRAN.R-project.org/package=
hrbrthemes.
69. Pebesma E. Simple features for R: standardized support for spatial vector
data. The R Journal. 2018;10(1):439–46. https://doi.org/10.32614/RJ-2018-
009.
70. Santos BO. Ggsn: north symbols and scale bars for maps created with
‘ggplot2’ or ‘ggmap’; 2019. Available from: https://CRAN.R-project.org/
package=ggsn.
71. Zhu H. kableExtra: construct complex table with ‘kable’ and pipe syntax.
2019; Available from: https://CRAN.R-project.org/package=kableExtra.
72. Bivand R, Keitt T, Rowlingson B. Rgdal: bindings for the ‘geospatial’ data
abstraction library; 2019. Available from: https://CRAN.R-project.org/
package=rgdal.
73. Bivand R, Rundel C. Rgeos: Interface to geometry engine - open source
(‘geos’); 2019. Available from: https://CRAN.R-project.org/package=rgeos.
74. Daïnou K, Laurenty E, Mahy G, Hardy OJ, Brostaux Y, Tagg N, et al.
Phenological patterns in a natural population of a tropical timber tree
species, Milicia excelsa (Moraceae): evidence of isolation by time and its
interaction with feeding strategies of dispersers. Am J Bot. 2012;99(9):1453–
63. https://doi.org/10.3732/ajb.1200147.
75. Mitchell D. Tanzania’s cashew sector: constraints and challenges in a global
environment, World Bank Africa region working paper series; 2004. p. 70.You can also read