Sudden changes in nitrogen dioxide emissions over Greece due to lockdown after the outbreak of COVID-19
←
→
Page content transcription
If your browser does not render page correctly, please read the page content below
Atmos. Chem. Phys., 21, 1759–1774, 2021
https://doi.org/10.5194/acp-21-1759-2021
© Author(s) 2021. This work is distributed under
the Creative Commons Attribution 4.0 License.

Sudden changes in nitrogen dioxide emissions over Greece due to
lockdown after the outbreak of COVID-19
Maria-Elissavet Koukouli1 , Ioanna Skoulidou1 , Andreas Karavias2 , Isaak Parcharidis2 , Dimitris Balis1 ,
Astrid Manders3 , Arjo Segers3 , Henk Eskes4 , and Jos van Geffen4
1 Laboratoryof Atmospheric Physics, Aristotle University of Thessaloniki, Thessaloniki, Greece
2 Department of Geography, Harokopio University, Athens, Greece
3 TNO, Climate, Air and Sustainability, Utrecht, the Netherlands
4 Royal Netherlands Meteorological Institute (KNMI), De Bilt, the Netherlands

Correspondence: Maria-Elissavet Koukouli (mariliza@auth.gr)

Received: 15 June 2020 – Discussion started: 27 July 2020
Revised: 29 December 2020 – Accepted: 31 December 2020 – Published: 9 February 2021

Abstract. The unprecedented order, in modern peaceful            with the remaining 3 weeks showing a positive average of
times, for a near-total lockdown of the Greek population         ∼ 10 %; this positive average was postulated to be due to
as a means of protection against severe acute respiratory        the uncertainty of the methodology, which is based on dif-
syndrome coronavirus 2, commonly known as COVID-19,              ferences. As a result this analysis, we conclude that the ef-
has generated unintentional positive side-effects with re-       fect of the COVID-19 lockdown and the restriction of trans-
spect to the country’s air quality levels. Sentinel-5 Precur-    port emissions over Greece is ∼ −10 %. As transport is the
sor/Tropospheric Monitoring Instrument (S5P/TROPOMI)             second largest sector (after industry) affecting Greece’s air
monthly mean tropospheric nitrogen dioxide (NO2 ) observa-       quality, this occasion may well help policymakers to enforce
tions show an average change of −34 % to +20 % and −39 %         more targeted measures to aid Greece in further reducing
to −5 % with an average decrease of −15 % and −11 % for          emissions according to international air quality standards.
March and April 2020 respectively, compared with the pre-
vious year, over the six larger Greek metropolitan areas; this
is mostly attributable to vehicular emission reductions. For
the capital city of Athens, weekly analysis was statistically    1   Introduction
possible for the S5P/TROPOMI observations and revealed a
marked decline in the NO2 load of between −8 % and −43 %         In this work, we aim to quantify the decline in tropo-
for 7 of the 8 weeks studied; this is in agreement with the      spheric nitrogen dioxide (NO2 ) levels over Greece dur-
equivalent Ozone Monitoring Instrument (OMI)/Aura obser-         ing the ongoing severe acute respiratory syndrome coron-
vations as well as the ground-based estimates of a multi-axis    avirus 2 (COVID-19) pandemic, as sensed by the space-
differential optical absorption spectroscopy ground-based in-    borne S5P/TROPOMI (hereafter referred to as TROPOMI)
strument. Chemical transport modelling of the NO2 columns,       instrument. By comparing the relative levels for the months
provided by the Long Term Ozone Simulation European Op-          of March and April for the years 2020 and 2019, while prop-
erational Smog (LOTOS-EUROS) chemical transport model,           erly accounting for the differences in meteorology using the
shows that the magnitude of these reductions cannot solely       simulations of a chemical transport model (CTM), we quan-
be attributed to the difference in meteorological factors af-    tify the improvement in local and regional air quality due to
fecting NO2 levels during March and April 2020 and the           the reduced nitrogen oxides (NOx ) emissions.
equivalent time periods of the previous year. Taking this fac-      In the following sections, we provide basic information on
tor into account, the resulting decline was estimated to range   tropospheric NOx , focus on current knowledge of the nom-
between ∼ −25 % and −65 % for 5 of the 8 weeks studied,          inal NOx emissions over Greece, present a brief overview
                                                                 of the capabilities of current and past satellite instruments

Published by Copernicus Publications on behalf of the European Geosciences Union.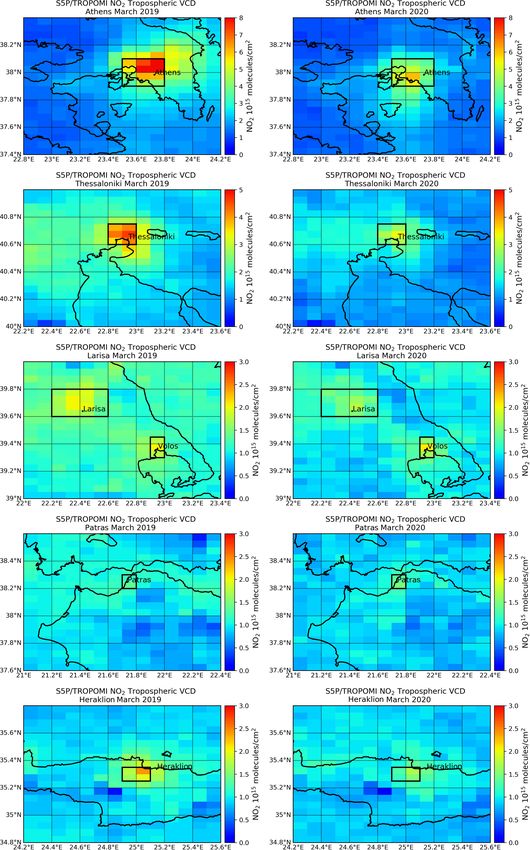
1760                                      M.-E. Koukouli et al.: Sudden changes in nitrogen dioxide emissions over Greece

with respect to sensing abrupt atmospheric content changes,        centages for NOx air emissions, separated by sector, as ex-
and provide the dates when the different lockdown measures         tracted from the Air Emission Account 2017 report from the
were enforced nationwide in Greece.                                Hellenic Statistical Authority (HAS, 2017), are as follows:
                                                                   industry, 48 %; transport, 22 %; energy supply, 18 %; man-
1.1    Nitrogen oxides in the troposphere                          ufacturing, 6 %; central heating, 4 %; agriculture, 1 %; and
                                                                   others, 1 %. Based on the European Environment Agency
Nitrogen dioxide (NO2 ) and nitrogen oxide (NO), referred          (EEA) European Pollutant Release and Transfer Register,
to more commonly as nitrogen oxides (NOx ), are important          77 % of the reported industrial NOx / NO2 emissions over
trace gases in the Earth’s troposphere. NOx are emitted as         Greece came from thermal power stations and other com-
a result of both anthropogenic activities, such as fossil fuel     bustion installations. The monthly energy balance reports,
combustion and biomass burning, and natural processes, such        composed by the Independent Power Transmission Opera-
as microbiological processes in soils, wildfires and lightning.    tor of the Hellenic Electricity Transmission System (IPTO,
In the presence of sunlight, the photochemical cycle of tropo-     2020), show that the total energy requested for March 2020
spheric ozone (O3 ) converts NO into NO2 on a timescale of         (4.152 GWh) was −2.1 % lower than 2019 (4.224 GWh) ,
minutes; thus, NO2 is considered a robust measure for con-         whereas for April 2020 (3.527 GWh), it was −9.8 % lower
centrations of nitrogen oxides (Jacob, 1999). For typical lev-     than 2019 (3.527 GWh). These reductions are quite typi-
els of the OH radical, the lifetime of NOx in the lower tropo-     cal of the seasonality of the energy consumption in Greece
sphere is less than a day – normally a few hours depending         which peaks in December and January, due to heating needs,
on the season and the rates of the photochemical reactions         and in July and August, due to cooling needs, with seasonal
(e.g. Beirle et al., 2011; Mijling and van der A, 2012). As a      lows in spring (April and May) and autumn (October and
result, it is well accepted that NO2 fluxes will remain rela-      November). Furthermore, Fameli and Asimakopoulos (2015)
tively close to their source which, first of all, makes it pos-    reported that the annual mean NOx emissions for Greece for
sible for NOx emissions to be well detected from space (e.g.       2006 to 2012 can be attributed as follows, in order of rel-
Stavrakou et al., 2008; Lamsal et al., 2010; van der A et al.,     evance: industry, 45 ± 3 %; road transport, 35 ± 8 %; ship-
2008) but also precludes any transboundary pollution effects       ping, 11 ± 3 %; non-road transport, 10 ± 4 %; central heat-
which might otherwise hinder this study.                           ing, 5 ± 2 %; and agriculture and aviation, an average of
   In the troposphere, NO2 plays a key role in air quality         around 1± respectively. If we assume that 2019 and 2020
issues, as it directly affects human health (WHO, 2016).           were not exceptional in their temperature levels for the spring
In the European Union, the evidence of NO2 health ef-              months, it follows that changes in central heating emissions
fects has led to the establishment of air quality standards        will not be a significant part of the emission changes ob-
for the protection of human health. Limit values for NO2           served.
are set at 200 µg m−3 for 1 h average concentrations (with
18 exceedances permitted per year) and at 40 µg m−3 for            1.3   Sensing abrupt emission changes from space-borne
annual average concentrations (European Council Directive                sensors
2008/50/EC, https://eur-lex.europa.eu/eli/dir/2008/50/oj, last
access: 9 February 2021). Concentrations above the annual          Abrupt emission changes have already been reported using
limit value for NO2 are still widely registered across Europe,     space-borne observations for a number of recent local and
even if concentrations and exposures continue to decrease          continental circumstances. Castellanos and Boersma (2012)
(EEA, 2019a). In Greece in particular, the annual average          reported significant reductions in nitrogen oxides over Eu-
standard of 40 µg m−3 was not exceeded between 2007 and            rope driven by environmental policy and the economic reces-
2017 considering all in situ stations; however, the traffic sta-   sion based on Ozone Monitoring Instrument (OMI)/Aura ob-
tions of Athens and Thessaloniki show annual levels of up          servations between 2004 and 2010. Vrekoussis et al. (2013)
to 45 µg m−3 for 2015 to 2017. Hence, it follows logically         and Zyrichidou et al. (2019) reported strong correlations be-
that closely monitoring abrupt changes in NOx emissions for        tween pollutant levels and economic indicators, showing that
diverse locations plays a key role in shaping future environ-      the 2008 economic recession resulted in proportionally lower
mental policies and directives.                                    levels of pollutants over large parts of Greece. For 2008
                                                                   to 2015, the latter study surprisingly found that while the
1.2    Nitrogen dioxide emissions over Greece                      wintertime tropospheric NO2 trends were negative, signifi-
                                                                   cant positive formaldehyde trends were observed from space,
According to the EEA Report No. 8/2019 (EEA, 2019b), up-           which were shown to be due to increased usage of affordable
dated by the EU 2019 Environmental Implementation Re-              indoor heating methods (e.g. fireplaces and wood stoves).
view for Greece (EU, 2019), the country’s NOx emissions by         Space-sensed reductions in emissions on a shorter timescale
sector originate from road transport, industry (which mainly       have also been attributed to strict measures enforced for be-
covers the energy production and distribution sector), non-        nign reasons. Using OMI/Aura and CTM results, Mijling et
road transport, household and agriculture. The relative per-       al. (2009) calculated reductions in NO2 concentrations of ap-

Atmos. Chem. Phys., 21, 1759–1774, 2021                                             https://doi.org/10.5194/acp-21-1759-2021
M.-E. Koukouli et al.: Sudden changes in nitrogen dioxide emissions over Greece                                            1761

proximately 60 % above Beijing during the 2008 Olympic           a first wave of workplace closures begun; this culminated on
and Paralympic games. Ding et al. (2015) showed a ∼ 30 %         Monday 16 March when all restaurants, coffee shops with
decrease in OMI/Aura columns, which was translated into          seating facilities, and the general food (apart from super-
a ∼ 25 % in actual emission levels during the Nanjing 2014       markets) and hospitality industries were shut down. During
Youth Olympic Games.                                             the following 2 d, all remaining retail activity was suspended
   Numerous first reports suggesting improved air quality af-    apart from pharmacies. On Monday 16 March, restrictions
ter the COVID-19 lockdown was enforced have already been         on the size of public gatherings were announced, and the
detailed by major media outlets. Here, we note the findings      public transport sector (buses, trams, underground and trains)
of Liu et al. (2020), who (based on both OMI/Aura and            started to reduce their capacity. On Monday 23 March, full
TROPOMI) reported a 48 % drop in tropospheric NO2 in             restrictions on the population’s movements were imposed
China from the 20 d averaged before the 2020 Lunar New           with strict stay-at-home mandates (with exceptions for essen-
Year to the 20 d after; this decrease is 20 % larger than that   tial working personnel), including all religion-related con-
from recent years, and the authors related the strengthened      gregations, with a complete and comprehensive restriction
NO2 decline to the date of each Chinese provincial lock-         around the Greek Orthodox Easter holiday on 19 April. The
down. Similar levels of tropospheric NO2 decrease over dif-      country remained in full lockdown until 4 May. We should
ferent Chinese provinces have been reported by Ding et           note here that most industrial activities maintained normal
al. (2020) and Miyazaki et al. (2020). Bauwens et al. (2020),    operations, albeit with a skeleton crew, which might account
using the same sensors, also reported an average NO2 col-        for some of the higher load observed around the city of
umn drop over all Chinese cities of −40 % relative to the        Athens where most of these activities are located.
same period in 2019, whereas the decreases in western Eu-
rope and the US were found to range between −20 % and
−8 %. Goldberg et al. (2020) analysed TROPOMI observa-           2     Materials and methods
tions around large US cities, focusing on the effect of meteo-
rological factors, and reported that meteorological variations   In this section, we introduce the TROPOMI tropospheric
between 2019 and 2020 can cause columnar NO2 differences         NO2 observations, the Long Term Ozone Simulation Eu-
of ∼ 15 % over monthly timescales. Compensating for mete-        ropean Operational Smog (LOTOS-EUROS) CTM simula-
orology, they then calculated a decrease in NO2 levels be-       tions and the proposed methodology to account for the dif-
tween 9.2 % and 43.4 % among 20 cities in North Amer-            ferent meteorological conditions between the nominal period
ica, with a median of 21.6 %. Cersosimo et al. (2020) re-        of March–April 2019 and the disrupted one of March–April
gridded the TROPOMI observations down to the 1 × 1 km            2020.
level and found that the reductions measured by air qual-
ity in situ measurements in the Po Valley, Italy, were very      2.1    TROPOMI NO2 observations
well reproduced by the satellite observations, whereas com-
parisons over less polluted regions in the south of Italy pro-   The recently launched TROPOMI instrument on the
vide mixed results, which may also be attributed to the lower    Sentinel-5 Precursor (S5P) mission (Veefkind et al., 2012)
space-sensed levels. Vîrghileanu et al. (2020) analysed the      has been providing global atmospheric observations since
lockdown effect on Europe-wide pollution and reported cor-       early 2018. Its very high spatial resolution of 3.5 × 7 km2 ,
relations with in situ observations ranging between 0.5 and      upgraded to 3.5 × 5.5 km2 in August 2019, and improved
0.75 while also demonstrating the usefulness of such high        signal-to-noise ratio compared with previous space-borne in-
spatial resolution satellite observations when used in tandem    struments, permits the detection of tropospheric pollution
with other economic factors.                                     from small-scale emission sources as well as the estimation
                                                                 of very localized emissions from anthropogenic activities,
1.4   The COVID-19 situation over Greece                         such as industrial point sources, and regional fires. Lorente et
                                                                 al. (2019) have already reported updated emissions over the
A short review on the COVID-19 situation over Greece is          Paris metropolitan area using TROPOMI observations, and
given here, mainly focusing on providing the dates in March      Ialogno et al. (2020) have assessed the capabilities of this in-
2020 of the successive restrictive measures that were en-        strument in evaluating city-wide air quality levels compared
forced nationwide and affected NOx emissions. The coun-          with the more traditional ground-based and in situ NO2 mon-
try’s General Secretariat for Civil Protection reacted quickly   itoring methods.
to the emerging situation in neighbouring Italy, and long           In this work, we use the publicly available TROPOMI of-
before the first causalities were reported, major festivities    fline v1.2 and v1.3 tropospheric NO2 data for March–April
for the carnival season (planned for the 28 February to the      2019 and for March–April 2020, accessed via the Coperni-
2 March) were cancelled; this was followed by the cancella-      cus Open Access Hub. The algorithm producing these data is
tion of all other cultural and sporting activities on 8 March.   described by van Geffen et al. (2019) and is based on the
On the 11 March, all levels of education were suspended and      approach used for processing OMI/Aura NO2 data within

https://doi.org/10.5194/acp-21-1759-2021                                          Atmos. Chem. Phys., 21, 1759–1774, 2021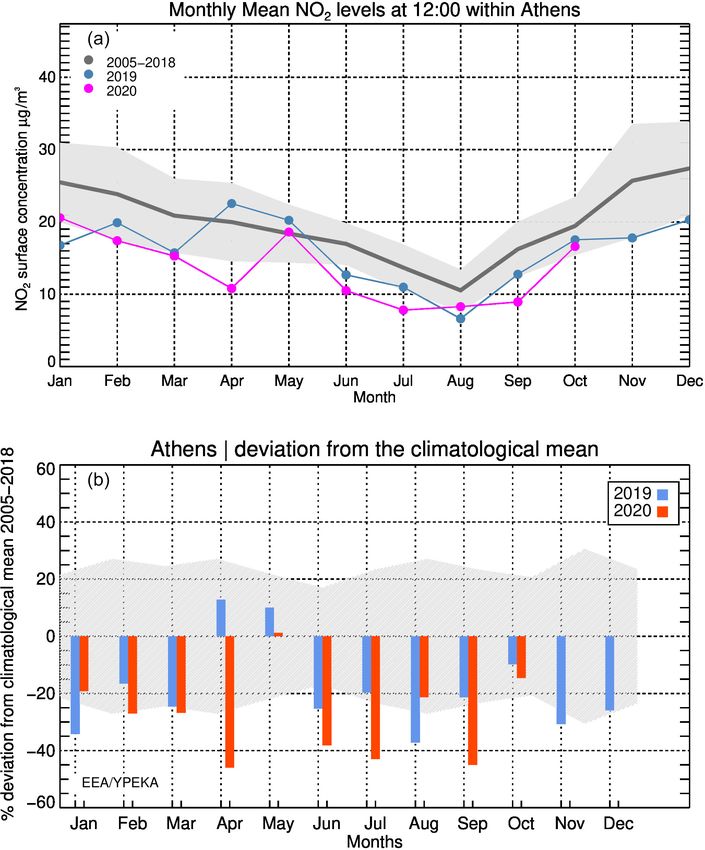
1762                                      M.-E. Koukouli et al.: Sudden changes in nitrogen dioxide emissions over Greece

DOMINO (Dutch OMI NO2 ) and the FP7 Quality Assur-                 the Bosporus Strait in Istanbul moving south-west towards
ance for Essential Climate Variables projects (Boersma et al,      Athens before turning westward towards the Mediterranean
2011, 2018). Routine validation is being carried out by the        Sea.
Validation Data Analysis Facility, who also provide the quar-
terly validation report of the Copernicus Sentinel-5 Precur-       2.2   LOTOS-EUROS CTM simulations
sor Operational Data Products. The S5P tropospheric NO2
columns are routinely compared to ground-based column              The open-source LOTOS–EUROS v2.2.001 chemical trans-
data at 19 ground-based multi-axis differential optical ab-        port model is used for the purposes of this study to simulate
sorption spectroscopy (MAXDOAS) stations. The latest re-           NO2 columns over the Greek domain for March and April for
port describes a negative bias of typically −22 % to −37 %         2019 and 2020. The CTM model (https://lotos-euros.tno.nl/,
for clean and slightly polluted conditions, reaching values of     last access: 3 February 2021) is originally aimed at air pollu-
−51 % over highly polluted areas (ROCVR #08, 2020). Fur-           tion studies and simulates gases (e.g. O3 , NOx and SO2 ) as
thermore, within ROCVR #08, the case of Athens was used            well as aerosols (e.g. sulfate, nitrate, PM10 and PM2.5 ) in the
as an example of the lockdown effects on NO2 observations          troposphere. The gas-phase chemistry of the model is a mod-
from both ground and space. It is shown that both the Athens       ified version of the Carbon Bond Mechanism IV (CBM-IV;
MAXDOAS instrument (operated by the Institute of Envi-             Gery et al., 1989), and the ISORROPIA II module (Foun-
ronmental Physics, University of Bremen) and the S5P ob-           toukis and Nenes, 2007) is used for the aerosol chemistry.
servations evidence a significant drop in NO2 levels between       Detailed information on the model and its activity can be
3 and 13 March, which is in line with the first nation-wide        found in Manders et al. (2017). LOTOS-EUROS is the na-
measures on 10 March 2020, with further restrictions on later      tional air quality model for the Netherlands (Vlemmix et al.,
days (e.g. closure of business, ban on non-essential move-         2015) and has been used for specific studies as well to inves-
ment; see https://www.bloomberg.com/news/articles/2020-            tigate NO2 values (Timmermans et al., 2011; Curier et al.,
04-17/humbled-greeks-show-the-world-how-to-handle- the-            2012, 2014). LOTOS-EUROS also participates in the opera-
virus-outbreak, last access: 3 February 2021). NO2                 tional Copernicus Atmosphere Monitoring Service (CAMS),
columns over Athens remained consistently low for                  comprising one of the seven CTMs that provide the offi-
weeks afterwards, and the MAXDOAS instrument per-                  cial CAMS ensemble air quality forecasting service, and
formed very well overall, with a mean difference to the            its capabilities have been demonstrated during the European
TROPOMI observations of 1.40 ± 3.50 × 10¹⁵ molec. cm−2             Monitoring Atmospheric Composition and Climate (MACC)
(median of 0.25 × 10¹⁵ molec. cm−2 ) for the 385 coin-             project and the MACC-II (Monitoring Atmospheric Compo-
cident days of observations between 1 May 2018 and                 sition and Climate: Interim Implementation) project (Maré-
28 November 2020 (https://mpc-vdaf-server.tropomi.eu/no2/          cal et al., 2015). Vlemmix et al. (2015) compared LOTOS-
no2-offl-maxdoas/athens, last access: 3 February 2021). We         EUROS NO2 tropospheric columns with MAXDOAS mea-
should note at this point that as the main findings in this work   surements and found a good agreement between the two
refer to relative differences between different time periods,      datasets, with a correlation coefficient between the daily av-
absolute differences to standard instruments do not affect our     eraged columns of 0.72. Schaap et al. (2013) compared the
findings because the stability of the TROPOMI datasets is as-      LOTOS-EUROS NO2 simulations with OMI/Aura retrievals
sured.                                                             and also showed that the model captures the NO2 spatial dis-
   For the purposes of this work, orbital files over Greece,       tribution satisfactorily and is able to explain 91 % of the OMI
between 19 and 30◦ E and 34 and 42◦ N, were gridded onto a         signal variation across Europe, while the systematic differ-
0.10 × 0.05◦ grid for different temporal scenarios. The data       ence was attributed to the summer period.
have been filtered, as recommended, using the quality flag            In this work, LOTOS-EUROS NO2 simulations over
indicator ≥ 75 which assures that the data under this flag are     Greece already presented and discussed thoroughly in Sk-
restricted to cloud-free (cloud radiance fraction < 0.5) and       oulidou et al. (2020) are used. The model uses offline me-
snow- and ice-free observations. An example figure is pre-         teorology extracted from the Operational Forecast data from
sented in Sect. 3.1 (Fig. 1) where the major NOx -emitting         the European Centre for Medium-Range Weather Forecasts
sectors around Greece are prominent, including the capital         (ECMWF). These meteorological model level fields cover
city Athens and the second largest city Thessaloniki (in the       parameters such as temperature, boundary layer height, spe-
north), emissions by one of the two largest thermal power          cific humidity, wind components, half-level pressures, cloud
plants in Ptolemaida (also in the north) and an important ther-    cover, cloud liquid and ice water content, rain and snow wa-
mal power plant in the Republic of North Macedonia (near           ter content, total cloud cover, convective and large-scale pre-
the Greek border), where such transborder pollution trans-         cipitation and wind components at 10 m. In addition, sur-
port is often visible. The domain also includes major emis-        face fields that include orography, soil type, land–sea mask,
sions from known locations on the Turkish Asia Minor coast,        sea surface and soil temperature, dew point temperature at
originating from both cities and major power plant activi-         2 m, surface latent and sensible heat fluxes and surface solar
ties, as well as the major shipping track that emerges from        downward radiation, among others, are also included. The

Atmos. Chem. Phys., 21, 1759–1774, 2021                                              https://doi.org/10.5194/acp-21-1759-2021
M.-E. Koukouli et al.: Sudden changes in nitrogen dioxide emissions over Greece                                                 1763

Figure 1. Monthly mean TROPOMI tropospheric NO2 columns (in 1015 molec. cm−2 ) for March (a, c, e) and April (b, d, f) for 2019 (a, b)
and 2020 (c, d) as well as their absolute differences (e, f).

different level type fields are obtained at a 3 h temporal res-         The LOTOS-EUROS NO2 simulations over Greece repro-
olution, whereas the surface fields are imported at a 1 h res-       duce the spatial variability of the TROPOMI NO2 columns
olution. The horizontal resolution of the meteorological in-         over Greece very well, capturing the locations of low and
put fields is 7 km × 7 km. In the vertical domain, the model         high NO2 columns (see their Figs. 11 and 12 for the sum-
distinguishes 10 levels that extend from the surface to about        mer and winter period respectively). The spatial correlation
175 hPa. The height of these levels refers to the levels of the      between the simulations over Athens (Thessaloniki) and the
ECMWF meteorological input data that are further used to             TROPOMI observations is 0.95 (0.82) in summer and 0.82
drive the model runs. The initial and boundary conditions            (0.66) in winter, with a bias of ±18 % (+4 % to −27 %).
are constrained from a coarser run of LOTOS-EUROS that               Furthermore, comparisons to MAXDOAS systems located
is performed over the larger European domain (15◦ W–45◦ E            in both cities have shown that LOTOS-EUROS simulates the
and 30–60◦ N) with a resolution of 0.25◦ × 0.25◦ , as dis-           diurnal variability of the NO2 very well, with biases between
cussed in Skoulidou et al. (2020). The anthropogenic emis-           0 % and 30 % depending on the season for the overpass time
sions are provided by the CAMS-REG (CAMS Regional                    of TROPOMI (around 12:00 UTC), which is in quite good
Emissions) inventory for Europe for the year 2015 with a             agreement with what was found in Vlemmix et al. (2015)
horizontal resolution of 0.1◦ × 0.05◦ (Kuenen et al., 2014).         and Blechschmidt et al. (2020).

https://doi.org/10.5194/acp-21-1759-2021                                               Atmos. Chem. Phys., 21, 1759–1774, 2021
1764                                      M.-E. Koukouli et al.: Sudden changes in nitrogen dioxide emissions over Greece

2.3    Comparative methodology                                     but were restricted, on a daily basis, to the TROPOMI pix-
                                                                   els that actually provided an observation when performing
While it would make sense to simply compare the NO2 lev-           the temporal averaging and producing the comparative plots.
els over Greece for the two periods, assuming that the emis-       Even though a direct comparison of the CTM results to the
sion sources have not changed dramatically between 2019            satellite data is not the focus of this paper, we imposed this
and 2020, one should not discard the effects that various me-      filter to make sure that the same days with the same me-
teorological parameters have on NO2 levels (Goldberg et al.,       teorological conditions were viewed by both methods. Fur-
2020). Meteorological conditions, such as wind speed, tem-         thermore, as discussed in Eskes and Boersma (2003), so as
perature inversions and the depth of the boundary layer, of-       to properly compare the modelled and measured columnar
ten play pivotal roles in local air quality levels (Jacob and      data, we applied the TROPOMI averaging kernels (AKs) to
Winner, 2009). The ambient levels of secondary NO2 pollu-          the modelled profiles before extracting the CTM columns.
tion are determined through the accumulation or dispersion         The LOTOS-EUROS CTM includes a module that imports
of pollutants, low or high solar irradiances, regional transport   the TROPOMI NO2 orbital files in a predefined format, per-
of clear or polluted air and atmospheric chemistry for the for-    forms all the necessary filtering, regridding and averaging of
mation of secondary species, in this case via the chemical         the datasets, and executes the AK convolution of the nearest
coupling of NOx with O3 (e.g. Seo et al., 2017).                   (in time) observation to the CTM NO2 simulated profile be-
   To ensure that the observed decrease in NO2 levels was          fore outputting the profile and columnar information on the
not due to diverse meteorological conditions between one           predefined spatio-temporal grid.
year and the next, relative differences in NO2 columns pro-
vided by the LOTOS-EUROS model are calculated, and
their average magnitude is set as the expected contribution
from the different meteorology. This forms a standard level        3     Results
above which we expect COVID-19-related reductions, i.e.
emission-related reductions. The premise of this thinking          In the following section, we first show the effect on monthly
is as follows: differences in the satellite observations will      NO2 levels over the entire domain, the six Greek cities with
contain the intertwined effect of differences in meteorology       the largest number of inhabitants, and we then present a more
on concentrations and of differences in emissions. For the         in depth analysis, on a weekly basis, for the city of Athens,
model, we keep the emissions constant for the two periods          also examining the long-term variability of tropospheric NO2
but use the meteorology of 2019 and 2020 so that we can            levels over the capital city using 15 years of space-borne ob-
isolate the impact of meteorology on concentrations. We can-       servations by the Ozone Monitoring Instrument (OMI/Aura)
not of course exclude the possibility that the LOTOS-EUROS         as well as the air quality in situ measurements of the Greek
model has biases in the resulting NO2 column depending on          Ministry Environment and Energy network, reporting to the
the meteorological conditions. In Skoulidou et al. (2020), dif-    European Environment Agency.
ferences in night-time surface concentrations between in situ
observations and model simulations were found and were at-         3.1    Lockdown effects on monthly NO2 levels
tributed to modelling uncertainties in mixing under stable
conditions. Within the methodology followed in this work,          In Fig. 1, the monthly mean tropospheric NO2 levels over
we expect any possible biases to cancel out in the difference      Greece, the northern neighbouring countries, the Aegean
fields calculated.                                                 Sea, and the coast of Turkey and Istanbul area, are shown for
   At this point, we should stress that the satellite observa-     2019 (Fig. 1a, b), 2020 (Fig. 1c, d), and their absolute differ-
tions are more often than not gap-ridden, as all but nearly        ence (Fig. 1e, f), for the month of March (Fig. 1a, c, e) and the
clear-skies remain in the suggested screening. Springtime          month of April (Fig. 1b, d, f). Even though the hotspots ap-
months are rainy months, even for typically sunny Greece,          pear strong for year 2019, with discrete shipping tracks and
which means that a one-to-one comparison of the satellite          ground-tracks over Turkey being clearly displayed, the dif-
observations for the two periods, even on a weekly basis,          ferent meteorological conditions between March and April
is usually impossible. For example, during our analysis it         obviously affect both the location of the maxima and the ab-
was found that the last week of March in 2020, the first           solute level of the maxima. As Greece gradually entered full
week of full lockdown, was fully cloudy for northern Greece,       lockdown mode within the first 3 weeks of March, whereas
even though the equivalent week in March 2019 was entirely         Turkey imposed intermittent movement restrictions from the
sunny. As a result, weekly comparisons were only possible          beginning of April onwards, the NO2 hotspot around the
for the major NO2 hotspot over Greece, the city of Athens,         megacity of Istanbul and the Bosporus Strait is still pro-
whereas the rest of the domain was examined on a monthly           nounced in March 2020 (Fig. 1c), whereas most of the
basis.                                                             smaller urban emission points are missing in Greece, and
   In technical terms, the LOTOS-EUROS simulations were            Athens is shown to be in sharp decline. In April 2020, the
performed on the entire timeline as discussed in Sect. 2.2         Turkish hotspots are also reduced in magnitude, as expected.

Atmos. Chem. Phys., 21, 1759–1774, 2021                                              https://doi.org/10.5194/acp-21-1759-2021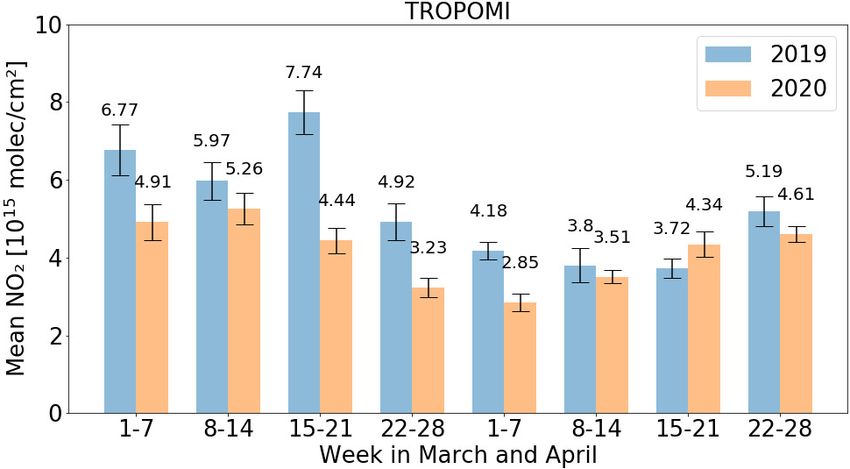
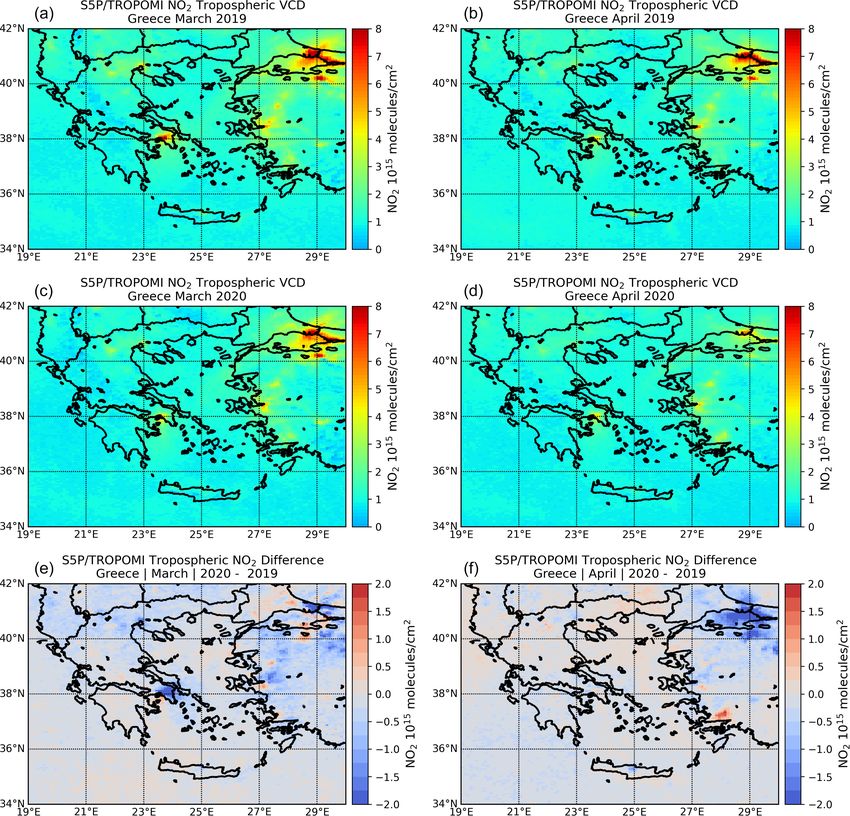
M.-E. Koukouli et al.: Sudden changes in nitrogen dioxide emissions over Greece                                                           1765

Figure 2. Monthly mean TROPOMI tropospheric NO2 columns (in 1015 molec. cm−2 ) for March 2019 (left) and March 2020 (right) for the
five major cities in Greece. First row, Athens; second row, Thessaloniki; third row, Larisa and Volos; fourth row, Patras; fifth row, Heraklion.
The boxes mark the pixels used in the numerical analysis.

https://doi.org/10.5194/acp-21-1759-2021                                                     Atmos. Chem. Phys., 21, 1759–1774, 2021
1766                                     M.-E. Koukouli et al.: Sudden changes in nitrogen dioxide emissions over Greece

In the following sections, we focus on specific hotspot loca-
tions and introduce numerical findings.
   In Fig. 2, the monthly mean TROPOMI tropospheric
NO2 columns (in 1015 molec. cm−2 ) are depicted for March
2019 (left) and 2020 (right) for six major cities in Greece:
from top to bottom, Athens (37.98◦ N, 23.72◦ E), Thessa-
loniki (40.64◦ N, 22.94◦ E), Larisa (39.63◦ N, 22.41◦ E), Vo-
los (39.36◦ N, 22.95◦ E), Patras (38.24◦ N, 21.73◦ E) and
Heraklion (35.33◦ N, 25.14◦ E). We focus on the locations
where major transport emissions are expected, as these six
cities, according to the HAS (2011) census, host 4.45 million
of the 10.8 million people that make up the Greek population
(Table S1 in the Supplement). Even though the NO2 levels
are low over the four smaller cities, we were interested in
examining the ability of TROPOMI with respect to sensing
both the load and expected changes for these relatively clean
cities (numerical results are given in Table 1). The equivalent
maps for April 2019 and 2020 are presented in Fig. S1.
   In Fig. 3, the monthly mean TROPOMI tropospheric NO2
columns (in 1015 molec. cm−2 ) for March (Fig. 3a) and April
(Fig. 3b) for 2019 (blue) and 2020 (orange) are shown for
the six major cities in Greece: from left to right, Athens,
Thessaloniki, Larisa, Volos, Patras and Heraklion. Overall,
the NO2 levels are higher in March for both years (than           Figure 3. Monthly mean TROPOMI tropospheric NO2 columns (in
for the equivalent April months) and are proportional to the      1015 molec. cm−2 ) for March (a) and April (b) for 2019 (blue) and
cities’ populations, with Athens and Thessaloniki showing         2020 (orange) for the five major cities in Greece: from left to right,
the highest levels whereas the remaining four cities present      Athens, Thessaloniki, Larisa, Volos, Patras and Heraklion.
similar NO2 loading conditions. Hence, it is not surpris-
ing considering these rather low monthly mean reported
satellite estimates, which approach the level of detectabil-      For April, slightly more pixels were available for 2020, on
ity of the satellite sensor, that the changes vary widely from    average +5 % with a range between 1 % and 11 %.
one location to the next and not always in the expected              In Fig. 4a, the monthly mean absolute differences in tro-
manner. We note here that the associated standard devia-          pospheric NO2 columns (1015 molec. cm−2 ) between 2020
tion on the monthly mean levels for the four smaller cities       and 2019 are shown for TROPOMI (orange) and LOTOS-
is quite large and might affect the robustness of findings        EUROS (blue) for the six major cities in Greece: Athens,
later on in this work. In Table 1, the full statistics that re-   Thessaloniki, Larisa, Volos, Patras and Heraklion. We opted
late to Fig. 3 are given, and they show that for the month        to show absolute differences here, and not percentage differ-
of March, the relative differences in NO2 loading sensed          ences as might be expected, as a small relative change in a
by the satellite sensor between 2019 and 2020 range from          low NO2 abundance would result in the erroneous message
−3 % to −34 % in all cases except for the port city of Pa-        of a large reduction, as has already been shown in Fig. 3. In
tras, where absolute changes of 0.12 × 10¹⁵ molec. cm−2 re-       Fig. 4b, the emission changes are quantified in the follow-
sult in percentage differences of +20 %. Similarly, for the       ing manner: the percentage differences for LOTOS-EUROS
month of April, relative changes range from −39 % to +5 %;        between 2019 and 2020 are calculated as the equivalent per-
however, these changes mostly result from extremely small         centage differences seen by TROPOMI. By subtracting one
absolute changes of 0.06 × 10¹⁵ molec. cm−2 (Athens) or           percentage difference from the other (and not directly com-
0.08 × 10¹⁵ molec. cm−2 (Volos). The equivalent bar plot for      paring the two), the actual NO2 emission reduction may be
the CTM tropospheric NO2 columns is given in Fig. S2,             quantified.
in the same format as Fig. 3, and the relevant statistics are        This percentage difference is found to be −16 % for
shown in Table S2. We note that, for the possible available       Athens, −12 % for Thessaloniki, −34 % for Larisa, −22 %
observations per location, for the month of March there were      for Volos, −17 % for Patras and +19 % for Heraklion.
slightly fewer available pixels for 2020 than for 2019, on av-    This study shows that, for relatively low tropospheric
erage ∼ −15 % with a range between −5 % and −22 %, with           NO2 columns of the order of 1.5 × 10¹⁵ molec. cm−2 , this
the highest difference for Thessaloniki, which was overcast       methodology, which is based on differences, may result in
the entire final week of March 2020, as previously discussed.     unexpected numerical findings. Similar studies that have ex-
                                                                  amined the effects of the COVID-19 lockdown on air qual-

Atmos. Chem. Phys., 21, 1759–1774, 2021                                              https://doi.org/10.5194/acp-21-1759-2021
M.-E. Koukouli et al.: Sudden changes in nitrogen dioxide emissions over Greece 1767
Table 1. Monthly mean TROPOMI NO2 levels (1015 molec. cm−2 ) over major cities in Greece for March (left block) and April (right block)
for 2019 and 2020 as well as their relative difference, standard deviation and number of pixels (in parentheses).
Location March 2019 March 2020 Percent diff. April 2019 April 2020 Percent diff.
Athens (12) 6.04 ± 1.65 4.45 ± 0.76 −26 % 4.09 ± 0.49 4.03 ± 0.38 −1 %
Thessaloniki (6) 4.13 ± 0.34 2.71 ± 0.38 −34 % 2.41 ± 0.28 2.30 ± 0.22 −5 %
Larisa (16) 1.72 ± 0.22 1.38 ± 0.17 −19 % 1.30 ± 0.13 1.24 ± 0.09 −5 %
Volos (3) 1.84 ± 0.13 1.78 ± 0.21 −3 % 1.50 ± 0.14 1.58 ± 0.19 +5 %
Patras (2) 1.30 ± 0.10 1.42 ± 0.19 +20 % 1.50 ± 0.02 1.17 ± 0.01 −18 %
Heraklion (4) 1.94 ± 0.29 1.43 ± 0.08 −26 % 2.47 ± 0.30 1.52 ± 0.14 −39 %
capital city of Athens – at a weekly temporal scale, so as to
refine this estimate.
3.2 Lockdown effects on weekly NO2 levels over Athens
Without disregarding the possible contribution of central
heating to total NOx emissions, the largest decrease due to
the COVID-19 lockdown is indeed observed over the main
Greek hotspot, the city of Athens and its surroundings. In
Fig. 5, weekly mean TROPOMI tropospheric NO2 columns
(in 1015 molec. cm−2 ) over Athens for 2019 (left) and 2020
(right) are shown for 15–21 March (first row), 8–14 April
(second row), 15–21 April (third row) and 22–28 April
(fourth row). Apart from the obvious reduction in magni-
tude during the lockdown months, the effect of the winds
for both the location of the local maximum and the spread
of the pollution plume is most prominent in this composite,
which further strengthens our decision not to perform one-
to-one comparisons between the different NO2 fields. The
average weekly NO2 load over Athens sensed by TROPOMI
is presented in a numerical form in Fig. 6, where the 2019 av-
erages are shown in blue and the 2020 averages are shown in
orange for the weeks of March and April. Out of the 12 pix-
els considered for this subdomain, which may provide up to
Figure 4. (a) Monthly mean absolute differences in tropospheric
84 measurements for each week in the case of clear skies, for
NO2 columns (in 1015 molec. cm−2 ) between 2020 and 2019 are
the year 2019 an average of 53 ± 16 (median of 52) clear-
shown for TROPOMI (orange) and LOTOS-EUROS (blue) for the
five major cities in Greece: from left to right, Athens, Thessaloniki, sky S5P/TROPOMI observations where found, whereas for
Larisa, Volos, Patras and Heraklion. (b) The percentage differences the year 2020, an average of 52 ± 25 (median of 56) clear-
that may be attributable to emission changes. sky S5P/TROPOMI observations where found. Even though
the representativeness of the weekly levels can by no means
be considered equal between the years, apart from the penul-
timate week, TROPOMI reports lower NO2 columns rang-
ing between −8 % and −43 %. The MAXDOAS observa-
ity based on satellite observations have focused on eastern tions over Athens also show a very similar behaviour, report-
China, specific US and Canadian locations and the Po Val- ing 6.77 ± 6.85 × 10¹⁵ and 3.60 ± 1.83 × 10¹⁵ molec. cm−2
ley in Italy, which observe orders of magnitude higher tropo- for March and April 2019 respectively and 2.76 ± 3.17 and
spheric NO2 columns even during the reduced emissions pe- 2.77 ± 2.44 × 10¹⁵ molec. cm−2 for March and April 2020
riod. As a result, our main tentative finding is that a ∼ −10 % respectively, showing a much larger reduction for the month
reduction in tropospheric NO2 columns as sensed by the of March than for the month of April.
S5P/TROPOMI instrument over Greece may be attributed The meteorology over these 8 weeks over Athens shows
to the reduced emissions due to the COVID-19 pandemic. that, temperature-wise, the entire month of March 2019 as
Hence, we continue this study focusing only on the location well as the first 3 weeks of April had very similar levels
with the highest observed tropospheric NO2 columns – the with a very hot spell affecting the last week of April 2019,
https://doi.org/10.5194/acp-21-1759-2021 Atmos. Chem. Phys., 21, 1759–1774, 20211768 M.-E. Koukouli et al.: Sudden changes in nitrogen dioxide emissions over Greece Figure 5. Weekly mean TROPOMI tropospheric NO2 columns (in 1015 molec. cm−2 ) over Athens for 2019 (left) and 2020 (right): first row, 15–21 March 2019; second row, 8–14 April; third row, 15–21 April; fourth row, 22–28 April. Atmos. Chem. Phys., 21, 1759–1774, 2021 https://doi.org/10.5194/acp-21-1759-2021
M.-E. Koukouli et al.: Sudden changes in nitrogen dioxide emissions over Greece 1769
Figure 6. Weekly mean TROPOMI tropospheric NO2 columns (in
1015 molec. cm−2 ) for weeks in 2019 (blue) and 2020 (orange) for
Athens.
which was also Easter Week in Greece. In 2020, a cold front
appeared during the third week of March which lasted un-
til mid-April when warmer weather appeared and remained
(Fig. S5). The mean vector wind speed and direction, over-
lain as arrows in Fig. S5, are very similar with mostly pre-
dominant northern winds and very few cases of southerly
winds. In the equivalent rose diagrams (Fig. S6), we again
note that the main wind directions appear similar between
the two periods (2019 in the left column and 2020 in the
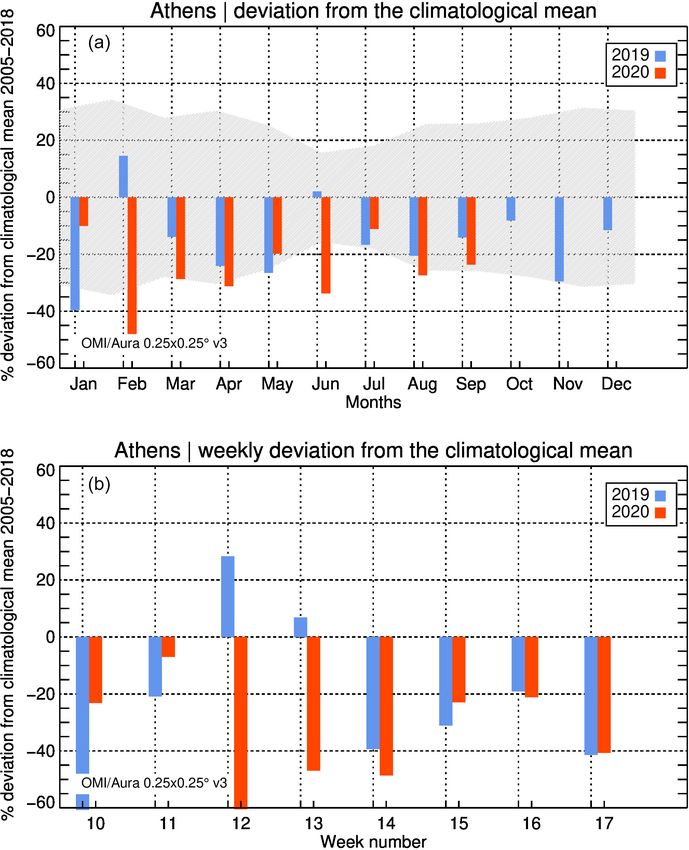
right column) apart from the last week of April (bottom row) Figure 7. (a) The OMI/Aura v003 L3 gridded cloud-screened tro-
where the two weeks had very different directions for the pospheric NO2 monthly deviations from the climatological mean
same magnitude. Note that the percentiles are not constant (grey shaded area) for 2019 (in blue) and 2020 (in orange).
(b) The OMI/Aura v003 L3 gridded cloud-screened tropospheric
between rose diagrams.
NO2 weekly deviations from the climatological mean for 2019 (in
A question that often arises when examining a relatively
blue) and 2020 (in orange) starting in week 10, the first week of
short time period of a highly varying atmospheric species is March.
whether the period considered as “normal” was indeed nor-
mal from a climatological point of view. We have opted to
create a climatological mean based on the daily OMI/Aura the same order and magnitude. For the case of the COVID-
NO2 cloud-screened tropospheric column L3 global gridded 19 pandemic, a number of studies of European locations
0.25 × 0.25◦ v003 product (Krotkov et al., 2017, 2019), ac- have appeared with surprising findings; in Ropkins and
cessed from the NASA EarthData Giovanni repository. The Tate (2021), measurements from automated monitoring sta-
monthly variability of the tropospheric NO2 load over Athens tions across the UK showed abrupt NO2 decreases at the on-
for 2019 (blue) and 2020 (orange) is shown in Fig. 7a as set of the UK lockdown, between ∼ 25 % and 50 % at urban
the percentage difference from the climatological mean (grey traffic and urban background stations. Surprisingly, after the
shaded area). As is also observed by the TROPOMI instru- initial abrupt reduction, gradual increases were then observed
ment, the OMI observations reveal a higher decrease for throughout the rest of the UK lockdown period. A similar
March 2020 compared with March 2019 (than the equivalent finding is reported by Dacre et al. (2020), who showed that
decrease for the April months). In Fig. 7b, the weekly vari- the in situ air quality stations in the north and middle of Eng-
ability of the tropospheric NO2 load over Athens for 2019 land measured a decrease in NO2 concentrations in the lock-
(blue) and 2020 (orange) is shown, starting in the first week down period from 17 March to 30 April 20, whereas stations
of March and covering 8 weeks. It is also shown in this repre- in the south of England measured an increase in NO2 concen-
sentation that the weeks of March in 2020 were further from trations. Putaud et al. (2020) studied in situ concentrations
the climatological mean compared with the weeks in April from an urban background and a regional background station
2020, whereas the April 2019 weeks present overall lower in the north of Italy and showed that the NO2 concentrations
NO2 loads, as also shown by TROPOMI (Fig. 6). decreased as a consequence of the lockdown by −30 % and
Another question that is also often discussed when exam- −40 % on average respectively.
ining such abrupt changes in localized emission sources is
whether in situ surface measurements depict the changes in
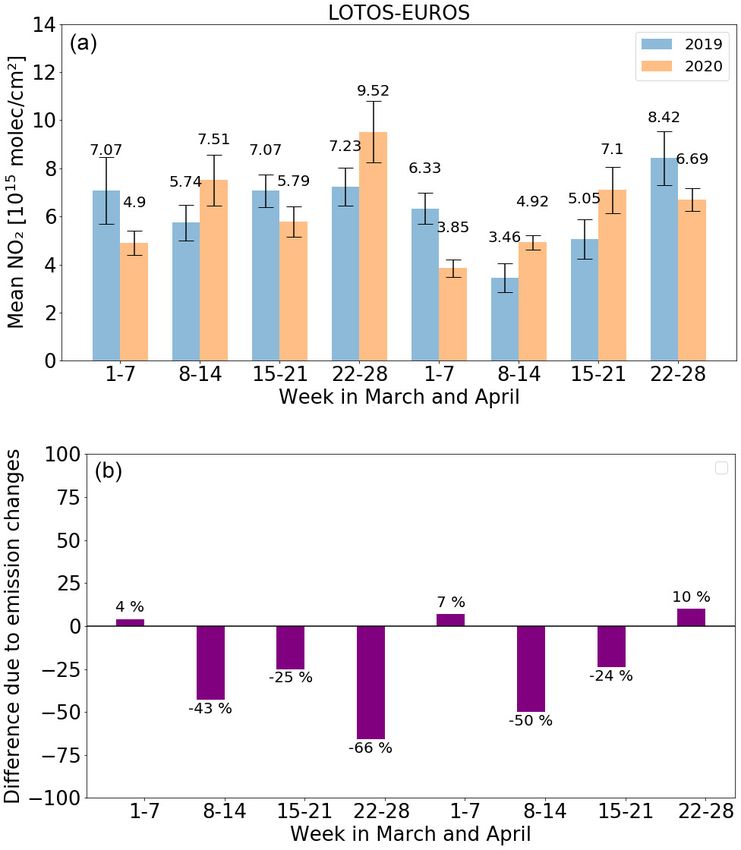
https://doi.org/10.5194/acp-21-1759-2021 Atmos. Chem. Phys., 21, 1759–1774, 20211770 M.-E. Koukouli et al.: Sudden changes in nitrogen dioxide emissions over Greece For the purposes of this discussion, we have analysed the in situ surface NO2 measurements reported by seven air qual- ity stations around Athens (locations shown in Fig. S3), and their individual monthly mean variability for 12:00 UTC is shown in Fig. S4. These long-term observations are main- tained by the Greek Ministry Environment and Energy (YPEKA) network who further report them to the EEA, and they are officially designated as industrial, urban and suburban locations. The measurement time closest to the TROPOMI overpass time over Athens was chosen to calcu- late a climatology between 2005 and 2018, and the monthly mean NO2 levels calculated from the time series shown in Fig. S4 are presented in Fig. 8a. The grey line and shaded area show the seasonal variability of the mean surface con- centrations (in µg m−3 ) with higher levels during wintertime months and lower levels during summertime. Similar NO2 concentrations are reported for the month of March in 2019 (in blue) and 2020 (in purple), at the lower statistical level, whereas an unexpected increase for April (and May) 2019 shows a large difference to the lows found in April 2020, which was the full COVID lockdown month for Greece. This finding is clearer in Fig. 8b, where the monthly deviation of 2019 (in blue) and 2020 (in orange) are given as bars over- laid against the grey shaded area that shows the variabil- ity of the climatological means. Thus, contrary to what the space-borne observations by both TROPOMI and OMI as Figure 8. (a) Monthly mean NO2 surface concentrations (in well as the ground-based MAXDOAS measurements show, µg m−3 ) for the climatological mean of 2005 to 2018 (dark grey the in situ measurements report a similar difference to the line) with the standard deviation (grey shaded area), 2019 (in blue) climatological mean for the months of March, whereas April and 2020 (in purple) calculated from the levels reported by seven 2019 appears in the positive range and April 2020 is beyond air quality stations, as shown in Fig. S4. (b) The monthly percent- the lower statistical level. Grivas et al. (2020) compared cli- age deviation from the climatological mean (shaded grey area) for matological hourly NO2 concentrations measured by an ur- the months of 2019 (blue) and 2020 (orange). ban background station in the Athens Basin (not included in our work) for the years 2016–2020 to days corresponding to the pre-lockdown (1–22 March), lockdown (23 March– in emissions over Athens for these 8 weeks is calculated at 10 May) and post lockdown (11–31 May) periods of 2020. ∼ −20 % from the S5P/TROPOMI tropospheric NO2 obser- Overall, they report −6 %, −41.5 % and +8.7 % changes be- vations. tween 2020 and the 2016–2020 equivalent periods. The contribution of the meteorological factors to the ob- served tropospheric NO2 load can be assessed by the equiv- 4 Conclusions alent LOTOS-EUROS weekly averages, shown Fig. 9a. As in Fig. 4b, the percentage differences of the LOTOS-EUROS In this work, Sentinel-5P/TROPOMI tropospheric NO2 ob- simulations between 2019 and 2020 are calculated, as were servations were studied in order to examine the possible pos- those for the TROPOMI equivalent weekly means (Fig. 6). itive effect on Greek air quality caused by the recent COVID- The difference between those two relative differences is 19 pandemic lockdown. The country enforced severe move- given in Fig. 9b. The fact that the CTM predicted an in- ment restrictions, and entire economic sectors were gradu- crease in NO2 production for most weeks, under the assump- ally shut down, starting from the last weekend of Febru- tion that the primary emissions remained stable between the ary, before total lockdown came into effect beginning on 2 years, results in higher reduction levels ranging between Monday 23 March and ending on 4 May. The time period −24 % and −66 % for 5 of the 8 weeks studied, whereas an between March and April 2020 and the equivalent weeks assumed increase in emissions is calculated for the remain- in 2019 were analysed and compared on a monthly basis ing 3 weeks with levels between +4 % and +10 %. These in- for six of the most populous cities in Greece. TROPOMI creases in emission levels, which are not corroborated by the monthly mean tropospheric nitrogen dioxide (NO2 ) obser- in situ observations, give us an estimate on the uncertainty of vations showed a change of between −34 % and +20 % and this methodology (∼ 10 %). Even so, the average difference between −39 % and +5 % with an average of −15 % and Atmos. Chem. Phys., 21, 1759–1774, 2021 https://doi.org/10.5194/acp-21-1759-2021
M.-E. Koukouli et al.: Sudden changes in nitrogen dioxide emissions over Greece                                                    1771

                                                                    sidering the low tropospheric NO2 levels observed around
                                                                    Greece.

                                                                    Data availability. The S5P data used here are publicly avail-
                                                                    able from the Copernicus Open Access Hub (https://scihub.
                                                                    copernicus.eu/, ESA, 2021). The LOTOS-EUROS simulations
                                                                    are available upon request. The air quality monitoring sta-
                                                                    tion data are publicly available via the European Environ-
                                                                    ment Agency Air Quality monitoring service, https://discomap.
                                                                    eea.europa.eu/map/fme/AirQualityExport.htm (EEA, 2021) and
                                                                    the Greek Ministry of the Environment and Energy monitor-
                                                                    ing network, https://ypen.gov.gr/perivallon/poiotita-tis-atmosfairas/
                                                                    dedomena-metriseon-atmosfairikis-rypansis/ (Greek Ministry of
                                                                    the Environment, 2021). The OMI/Aura NO2 cloud-screened tro-
                                                                    pospheric column L3 global gridded 0.25 × 0.25◦ v003 prod-
                                                                    uct is publicly available from the NASA EarthData Gio-
                                                                    vanni repository, https://giovanni.gsfc.nasa.gov/giovanni/ (NASA,
                                                                    2021). The MAXDOAS observations discussed in this text are
                                                                    publicly available from https://mpc-vdaf-server.tropomi.eu/no2/
                                                                    no2-offl-maxdoas/athens (MPC ESA, 2021).

                                                                    Supplement. The supplement related to this article is available on-
                                                                    line at: https://doi.org/10.5194/acp-21-1759-2021-supplement.

Figure 9. (a) Weekly mean LOTOS-EUROS tropospheric NO2
columns (in 1015 molec. cm−2 ) for weeks in 2019 (blue) and 2020    Author contributions. The data analysis was performed by IS, AK
(orange) for Athens. (b) The percentage differences attributed to   and MEK. Methodology and conceptualization was undertaken by
emission changes, revealing the actual magnitude of the NOx emis-   DB and IP. Software development was carried out by IS and AK.
sions decrease.                                                     MEK wrote and prepared the original draft of the paper, and DB,
                                                                    AS, AM, JvG and HE reviewed and edited it. All authors read and
                                                                    agreed on the published version of the paper.
−11 % for March and April 2020 respectively, compared
with the previous year, for the urban areas, which was mostly
attributable to vehicular emission reductions. For the capital      Competing interests. The authors declare that they have no conflict
city of Athens, weekly reductions in the TROPOMI tropo-             of interest.
spheric NO2 columns (between −8 % and −43 %) for 7 of
the 8 weeks studied were found, corroborated by the space-
borne OMI/Aura observations and ground-based multi-axis             Acknowledgements. We acknowledge the usage of modified Coper-
                                                                    nicus Sentinel data (2019–2020). Results presented in this work
differential optical absorption spectroscopy (MAXDOAS)
                                                                    have been produced using the Aristotle University of Thessaloniki
measurements. Stronger reductions were reported by seven
                                                                    (AUTh) high-performance computing infrastructure and resources.
in situ air quality stations in Athens that reported measure-       Maria-Elissavet Koukouli, Ioanna Skoulidou and Dimitris Balis
ments to the European Environment Agency Air Quality                would like to acknowledge the support provided by the IT Center
database, with monthly decreases reaching −40 % for the             of the AUTh throughout the progress of this research work. Maria-
month of April 2020. In order to eliminate the expected me-         Elissavet Koukouli and Andreas Karavias would also like to ac-
teorological effects on the observed NO2 levels, chemical           knowledge the support provided by the Atmospheric Toolbox® .
transport modelling simulations, provided by the LOTOS-
EUROS CTM, show that the magnitude of these satellite-
sensed reductions cannot solely be attributed to the differ-        Financial support. This research has been supported by the Euro-
ence in meteorological factors affecting NO2 levels during          pean Union (European Regional Development Fund), Greek na-
March and April 2020 and the equivalent time periods of             tional funds through the “Competitiveness, Entrepreneurship and
the previous year. Taking this factor into account, the re-         Innovation” operational programme (grant no. NSRF 2014-2020),
                                                                    the “Panhellenic Infrastructure for Atmospheric Composition and
sulting decline due to the COVID-19 related measures was
                                                                    Climate Change” project (grant no. MIS 5021516) and the “Inno-
estimated to range between −10 % and −20 % for the differ-          vative system for Air Quality Monitoring and Forecasting” project
ent spatio-temporal scales studied in this work, taking into        (code T1EDK-01697, grant no. MIS 5031298), implemented under
account the possible uncertainties of the methodology con-

https://doi.org/10.5194/acp-21-1759-2021                                              Atmos. Chem. Phys., 21, 1759–1774, 2021
1772 M.-E. Koukouli et al.: Sudden changes in nitrogen dioxide emissions over Greece
the Action “Reinforcement of the Research and Innovation” infras- Curier, R. L., Kranenburg, R., Segers, A. J. S., Timmermans, R.
tructure. M. A., and Schaap, M.: Synergistic use of OMI NO2 tropo-
spheric columns and LOTOS–EUROS to evaluate the NOx emis-
sion trends across Europe, Remote Sens. Environ., 149, 58–69,
Review statement. This paper was edited by Stelios Kazadzis and https://doi.org/10.1016/j.rse.2014.03.032, 2014.
reviewed by two anonymous referees. Dacre, H. F., Mortimer, A. H., and Neal, L. S.: How have sur-
face NO2 concentrations changed as a result of the UK’s
COVID-19 travel restrictions? Environ. Res. Lett., 15, 104089,
https://doi.org/10.1088/1748-9326/abb6a2, 2020.
Ding, J., van der A, R. J., Mijling, B., Levelt, P. F., and Hao,
References N.: NOx emission estimates during the 2014 Youth Olympic
Games in Nanjing, Atmos. Chem. Phys., 15, 9399–9412,
Bauwens, M., Compernolle, S., Stavrakou, T., Müller, J.-F., van https://doi.org/10.5194/acp-15-9399-2015, 2015.
Gent, J., Eskes, H., Levelt, P. F., van der A, R., Veefkind, Ding, J., van der, A., Eskes, H. J., Mijling, B., Stavrakou,
J. P., Vlietinck, J., Yu, H., and Zehner, C.: Impact of coron- T., van Geffen, J. H. G. M., and Veefkind, P. J: NOx
avirus outbreak on NO2 pollution assessed using TROPOMI and emissions reduction and rebound in China due to the
OMI observations, Geophys. Res. Lett., 47, e2020GL087978, COVID-19 crisis, Geophys. Res. Lett., 46, e2020GL089912,
https://doi.org/10.1029/2020GL087978, 2020. https://doi.org/10.1029/2020GL089912, 2020.
Beirle, S., Boersma, K. F., Platt, U., Lawrence, M. G., and Eskes, H. J. and Boersma, K. F.: Averaging kernels for DOAS total-
Wagner, T.: Megacity emissions and lifetimes of nitro- column satellite retrievals, Atmos. Chem. Phys., 3, 1285–1291,
gen oxides probed from space, Science, 333, 1737–1739, https://doi.org/10.5194/acp-3-1285-2003, 2003.
https://doi.org/10.1126/science.1207824, 2011. European Environment Agency (EEA): Air quality in Europe –
Blechschmidt, A.-M., Arteta, J., Coman, A., Curier, L., Eskes, 2019 report, https://doi.org/10.2800/822355, 2019a.
H., Foret, G., Gielen, C., Hendrick, F., Marécal, V., Meleux, European Environment Agency (EEA): Report No 8/2019, Euro-
F., Parmentier, J., Peters, E., Pinardi, G., Piters, A. J. M., Plu, pean Union emission inventory report 1990–2017 under the UN-
M., Richter, A., Segers, A., Sofiev, M., Valdebenito, Á. M., ECE Convention on Long-range Transboundary Air Pollution
Van Roozendael, M., Vira, J., Vlemmix, T., and Burrows, J. P.: (LRTAP), https://doi.org/10.2800/78220, 2019b.
Comparison of tropospheric NO2 columns from MAX-DOAS European Environment Agency (EEA): Air quality mea-
retrievals and regional air quality model simulations, Atmos. surements from in situ monitoring stations, available at:
Chem. Phys., 20, 2795–2823, https://doi.org/10.5194/acp-20- https://discomap.eea.europa.eu/map/fme/AirQualityExport.htm,
2795-2020, 2020. last access: 3 February 2021.
Boersma, K. F., Eskes, H. J., Dirksen, R. J., van der A, R. J., European Space Agency (ESA): Sentinel-5P Pre-Operations Data
Veefkind, J. P., Stammes, P., Huijnen, V., Kleipool, Q. L., Sneep, Hub, available at: https://scihub.copernicus.eu/, last access:
M., Claas, J., Leitão, J., Richter, A., Zhou, Y., and Brunner, D.: 3 February 2021.
An improved tropospheric NO2 column retrieval algorithm for European Union (EU): The Environmental Implementation Re-
the Ozone Monitoring Instrument, Atmos. Meas. Tech., 4, 1905– view 2019, COUNTRY REPORT: GREECE, available at: https:
1928, https://doi.org/10.5194/amt-4-1905-2011, 2011. //ec.europa.eu/environment/eir/pdf/report_el_en.pdf (last access:
Boersma, K. F., Eskes, H. J., Richter, A., De Smedt, I., Lorente, 30 April 2020), 2019.
A., Beirle, S., van Geffen, J. H. G. M., Zara, M., Peters, E., Fameli, K. M. and Assimakopoulos, V. D.: Development of a road
Van Roozendael, M., Wagner, T., Maasakkers, J. D., van der transport emission inventory for Greece and the Greater Athens
A, R. J., Nightingale, J., De Rudder, A., Irie, H., Pinardi, Area: Effects of important parameters, Sci. Total Environ., 505,
G., Lambert, J.-C., and Compernolle, S. C.: Improving algo- 770–786, https://doi.org/10.1016/j.scitotenv.2014.10.015, 2015.
rithms and uncertainty estimates for satellite NO2 retrievals: re- Fountoukis, C. and Nenes, A.: ISORROPIA II: a computa-
sults from the quality assurance for the essential climate vari- tionally efficient thermodynamic equilibrium model for K+ –
2−
ables (QA4ECV) project, Atmos. Meas. Tech., 11, 6651–6678, Ca2+ –Mg2+ –NH+ + − −
4 –Na –SO4 –NO3 –Cl –H2 O aerosols, At-
https://doi.org/10.5194/amt-11-6651-2018, 2018. mos. Chem. Phys., 7, 4639–4659, https://doi.org/10.5194/acp-7-
Castellanos, P. and Boersma, K: Reductions in nitrogen oxides over 4639-2007, 2007.
Europe driven by environmental policy and economic recession, Gery, M. W., Whitten, G. Z., Killus, J. P., and Dodge, M. C.:
Sci. Rep., 2, 265, https://doi.org/10.1038/srep00265, 2012. A photochemical kinetics mechanism for urban and regional
Cersosimo, A., Serio, C., and Masiello, G.: TROPOMI NO2 scale computer modeling, J. Geophys. Res., 94, 12925–12956,
Tropospheric Column Data: Regridding to 1 km Grid- https://doi.org/10.1029/JD094iD10p12925, 1989.
Resolution and Assessment of their Consistency with Goldberg, D. L., Anenberg, S. C., Griffin, D., McLinden,
In Situ Surface Observations, Remote Sens., 12, 2212, C. A., Lu, Z., and Streets, D. G.: Disentangling the im-
https://doi.org/10.3390/rs12142212, 2020. pact of the COVID-19 lockdowns on urban NO2 from nat-
Curier, R. L., Timmermans, R., Calabretta-Jongen, S., Es- ural variability, Geophys. Res. Lett., 47, e2020GL089269,
kes, H., Segers, A., Swart, D., and Schaap, M.: Im- https://doi.org/10.1029/2020GL089269, 2020.
proving ozone forecasts over Europe by synergistic use Greek Ministry of the Environment: Air quality measure-
of the LOTOS-EUROS chemical transport model and ments from in situ monitoring stations, available at:
in-situ measurements, Atmos. Environ., 60, 217–226, https://ypen.gov.gr/perivallon/poiotita-tis-atmosfairas/
https://doi.org/10.1016/j.atmosenv.2012.06.017, 2012.
Atmos. Chem. Phys., 21, 1759–1774, 2021 https://doi.org/10.5194/acp-21-1759-2021You can also read