COVID-19 Attributed Cases and Deaths are Statistically Higher in States
←
→
Page content transcription
If your browser does not render page correctly, please read the page content below
Tsiang & Havas. Medical Research Archives vol 9 issue 4. Medical Research Archives

   RESEARCH ARTICLE
  COVID-19 Attributed Cases and Deaths are Statistically Higher in States
      and Counties with 5th Generation Millimeter Wave Wireless
               Telecommunications in the United States.
Authors
Angela Tsiang and Magda Havas1
Affiliations
1
  Trent School of the Environment, Trent University, Peterborough, ON, Canada, K9J 7B8
Corresponding author
Angela Tsiang.
Email: tsiangangela@gmail.com

Accepted for Publication: Medical Research Archives, European Society of Medicine
doi: https://doi.org/10.18103/mra.v9i4.2371

  Abstract
  COVID-19-attributed case and death rates for the U.S.A. were analyzed through May 2020
  in three ways – for all 50 states, the country’s largest counties, and the largest counties in
  California – and found to be statistically significantly higher for states and counties with
  compared to those without 5G millimeter wave (mmW) technology. 5G mmW index was a
  statistically significant factor for the higher case and rates in all three analyses, while
  population density, air quality and latitude were significant for only one or two of the
  analyses. For state averages, cases per million were 79% higher (p = 0.012), deaths per
  million were 94% higher (p = 0.049), cases per test were 68% higher (p = 0.003) and deaths
  per test were 81% higher (p = 0.025) for states with vs. without mmW. For county averages,
  cases per million were 87% higher (p = 0.005) and deaths per million were 165% higher (p
  = 0.012) for counties with vs. without mmW. While higher population density contributed
  to the higher mean case and death rates in the mmW states and counties, exposure to mmW
  had about the same impact as higher density of mmW states on mean case and death rates
  and about three times as much impact as higher density for mmW counties on mean case and
  death rates. Based on multiple linear regression, if there was no mmW exposure, case and
  death rates would be 18-30% lower for 5G mmW states and 39-57% lower for 5G mmW
  counties. This assessment clearly shows exposure to 5G mmW technology is statistically
  significantly associated with higher COVID-19 case and death rates in the U.S.A. The
  mechanism–should this be a causal relationship–may relate to changes in blood chemistry,
  oxidative stress, an impaired immune response, an altered cardiovascular and/or neurological
  response.
  Keywords: 5G; millimeter waves; radiofrequency; RF; microwave radiation; microwave
  sickness; wireless; electromagnetic fields; EMF; EMR; EMI; EHS; COVID-19; SARS-
  CoV-2

Copyright 2021 KEI Journals. All Rights Reserved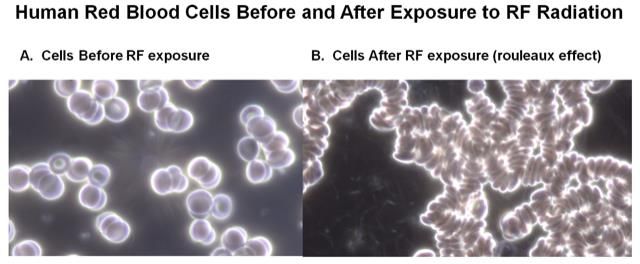
Tsiang & Havas. Medical Research Archives vol 9 issue 4. April 2021 Page 2 of 32
1. Introduction attention has focused on key
The first documented case of environmental factors. These include but
COVID-19 was reported in Wuhan, China are not limited to air quality since this was
in December 2019. To prevent its spread, initially identified as a respiratory illness,
the U.S. blocked travel from China on population density for person to person
January 31st and declared a National transmission, and electromagnetic
Emergency on March 13th, 2020. After the radiation since COVID-19 appeared after
World Health Organization (WHO) 5G was implemented and many of the
declared it a pandemic on March 19, 2020, COVID-19 symptoms resemble those of
the U.S. began quarantine and stay-at- microwave sickness.
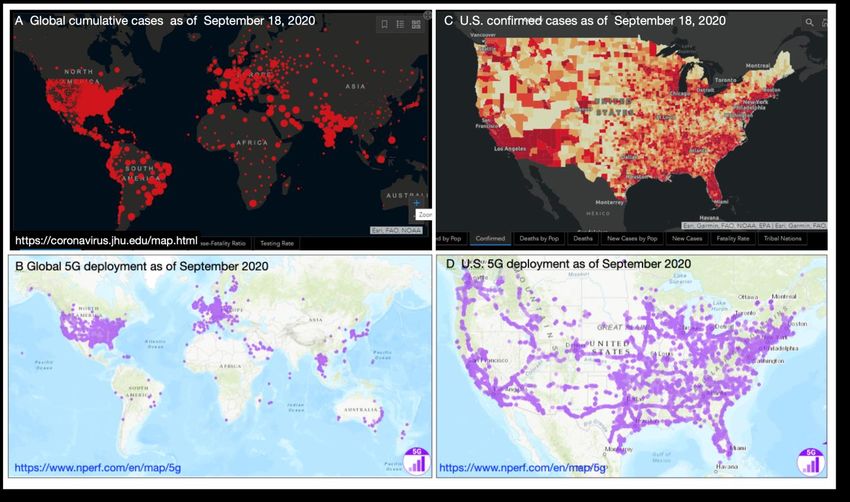
home orders to slow the virus’ spread and As of September 18, 2020,
to “flatten the curve”. Despite these according to Johns Hopkins University,
precautions, the virus spread quickly in the the cases are not uniformly distributed
U.S. and around the globe. globally (Figure 1). Many factors may
The infectious agent was named account for this: testing differences, per
severe acute respiratory syndrome capita income, standard of health care,
coronavirus 2 (SARS-CoV-2) due to population demographics, and
genetic similarity to SARS-CoV that environmental factors among others. This
caused a pandemic in 2002-4. The disease paper focuses on four environmental
associated with SARS-CoV-2 is COVID- factors that may relate to the spread and
19, which is an abbreviation for fatality of this disease: population density,
Coronavirus Disease 2019 associated with air pollution, latitude (which determines
SARS-CoV-2. potential endogenous vitamin D
According to the U.S. Centers for production) and presence of 5G mmW
Disease Control the epidemiological technology, which is present in
triangle for infectious diseases consists of combination with frequencies used in
the agent, the host and the environment. previous generations of wireless
While attention has focused on the agent communications from 1G to 4G and does
(genetics, modes of infection, etc.) and the not replace them. These data, along with
host (age and comorbidities), little COVID-19 case and death data, were
readily available for the United States.
Copyright 2021 KEI Journals. All Rights Reserved. http://journals.ke-i.org/index.php/mra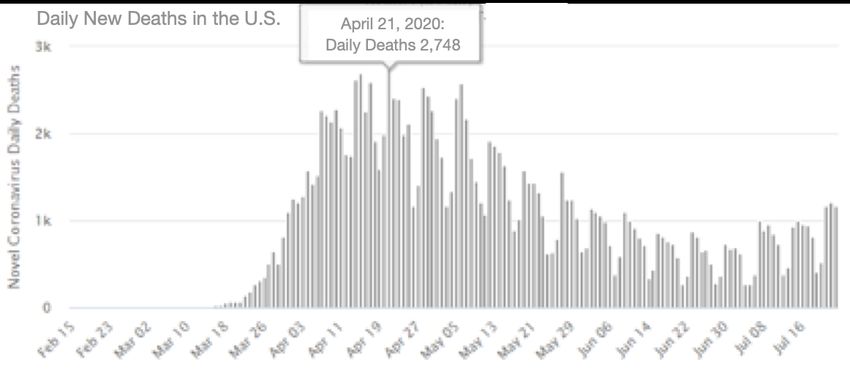
Tsiang & Havas. Medical Research Archives vol 9 issue 4. April 2021   Page 3 of 32

Figure 1. Data for COVID-19 (as of September 18, 2020) and rollout of 5G as of September
2020.
                                              Germany (110), Denmark (106), Monaco
        As of August 9, 2020, the U.S. was    (102), Oman (100), Bahrain (95), and
#1 out of 213 nations in the world for the    Saudi Arabia (91).
highest number of total COVID-19 cases                 Three radio frequency bands are
at 5.2 million, with 15,698 cases per         used in 5th Generation (5G) wireless
           th
million (9 highest) and 500 deaths per        communications. The low band refers to
million (10th highest) [1].                   frequencies below 1 GHz; the mid band to
        The rollout of 5G technology is to    frequencies between 1 GHz and 6 GHz,
support the Internet of things (IoT). As of   and the high band to the millimeter waves
January 2020, 31 countries had working        (mmW), which are 24 GHz and above. The
5G networks globally [2-5] In the top         U.S. telecommunication companies began
quartile of the highest ranking countries     using      mmW       for    5G     wireless
for COVID-19 deaths per million, 16 of        communications in 2019 after their
them had working 5G networks; while           acquisition of the mmW spectrum, making
only 7 countries had 5G in the 2nd highest    the U.S. the first country in the world to
quartile; 6 in the 3rd highest quartile and   use mmW for 5G. In June 2019, FCC’s
only 2 in the bottom quartile. In the top     Auction 101 for 28 GHz sold for $700
quartile, the 5G countries with higher        million and Auction 102 for 24 GHz sold
deaths per million than the U.S. were San     for $2 billion [6], and in March 2020, 37,
Marino (1238), Belgium (851), U.K.            39 and 47 GHz bands in Auction 103 sold
(686), Spain (610) and Italy (582). The       for $7.5 billion [7], generating a total of
other countries with 5G in the top quartile   $10 billion for the U.S. government. As of
with fewer deaths per million than the U.S.   February 2020, European countries were
were Ireland (358), Switzerland (229),        still not using mmW for 5G [8], and other
South Africa (175), Romania (140),            countries have used only the low and mid

Copyright 2021 KEI Journals. All Rights Reserved.   http://journals.ke-i.org/index.php/mra
Tsiang & Havas. Medical Research Archives vol 9 issue 4. April 2021 Page 4 of 32
band frequencies for 5G. To achieve calculation of the mmW exposure level but
higher speeds for 5G, densification of a differentiation between the different
antennas has occurred worldwide. Also, exposure levels in each state and county
because mmW have shorter wavelengths based on the number of mmW providers
(higher frequencies) than that used for 1G and the number of mmW cities and their
to 4G, they are more susceptible to population in those counties or states,
interference from obstructions, thus which is necessary for statistical analysis.
requiring more transmitters closer to users, Population density data were
which have been added to streetlamps and obtained from Wikipedia, which are
utility poles in some cities. The shorter calculated from population data from the
distance and higher density of mmW U.S. Census divided by the area of the
antennas translates into higher radiation state or county. Air Quality Index (AQI)
exposures, as acknowledged by the FCC’s data from 2019 from the EPA were
2019 Notice of Proposed Rulemaking 19- included in the analysis for states and
126 [9] to increase the current RF exposure counties. Latitude, which may relate to
limits four-fold to accommodate 5G mmW potential production of endogenous
devices and infrastructure. vitamin D associated with sun exposure,
If environmental exposure to 5G was also included in the analysis for
mmW increases the severity of COVID-19 counties.
or other viral infections, then the rapid
rollout of 5G technology should be 2.3 States and Counties with and without
reconsidered. 5G mmW Networks
Cities with 5G mmW networks
2. Methods were chosen for analysis because the most
2.1 COVID-19 Attributed Cases and frequencies for wireless communications
Deaths (5G mmW plus low and mid band 5G as
Data for number of cases, deaths, well as frequencies from previous
and tests for COVID-19 from generations 1G to 4G) and the highest RF
Worldometer was assessed on April 22, exposures due to the increased number of
2020, May 15, 2020, and May 31, 2020 small cell antennas for 5G and their
[1]. Data collection was stopped on May placement close to users would be present
31, 2020 because the nationwide there. Even though urbanization and high
quarantine effectively ended by that time density may be part of the criteria for
as people in major cities all around the choosing where to locate 5G mmW, and
country broke quarantine when they therefore it may seem appropriate to adjust
gathered in crowds and some states began the case and death rate data for
lifting their stay-at-home orders. urbanization and density, it is actually
NOT appropriate to do so for this analysis.
2.2 Variables: Air Quality Index, The higher the urbanization and density in
Latitude, Population Density and mmW an area, the higher the levels of RF
Index radiation present because of the higher
A mmW exposure index was density of cell phone towers, Wi-Fi hot
calculated based on the sum of the total spots, cell phones and Wi-Fi routers
population of the cities serviced by mmW present in highly urbanized or dense areas.
5G by each provider in a county or state, To adjust the data for urbanization and
divided by the total population of that density would therefore remove the effect
county or state. This factor is not a of higher levels of RF radiation present in
Copyright 2021 KEI Journals. All Rights Reserved. http://journals.ke-i.org/index.php/mraTsiang & Havas. Medical Research Archives vol 9 issue 4. April 2021 Page 5 of 32
highly urbanized or dense areas. California, the most populated
Therefore, case and death rate data and state in the U.S., has 60 counties in total
charts were not adjusted for density or and six counties with 5G mmW
urbanization. However, multi-variate technology. The counties that did not use
analysis was done to determine if 5G mmW technology chosen for
urbanization or density, along with AQI comparison included only those with a
and latitude, were statistically significant population of 500,000 or greater, of which
factors in the case and death rates using there were 11.
multiple linear regression, and then their Pearson’s correlations were
contributions relative to the contribution calculated for the case and death rates with
from 5G mmW to the case and death rates the four variables population density,
were calculated. mmW index, AQI, and latitude. Two-
Counties and states with mmW 5G sample t-test was used to compare case and
service were determined from the websites death rates of 5G mmW states and counties
of the wireless providers AT&T [10], T- to that of non-5G mmW states and
Mobile [11], and Verizon [12] which counties, and statistical significance was
specified the cities that they service with defined to be pTsiang & Havas. Medical Research Archives vol 9 issue 4. April 2021 Page 6 of 32
Table 1. Cities with mmW 5G Coverage Table 2. Top 10 Ranking European
and Provider from April 22 to May 31, Countries for COVID-19 Deaths/Million
2020. Source: AT&T [10], T-Mobile [11], for 5G * vs. Without 5G through August
Verizon [12]. 9, 2020. Source: Worldometer [1]
City State AT&T T-Mobile Verizon
Atlanta GA X X Rank #
Austin TX X Rank # Deaths per
Deaths per Million out of Total
Baltimore MD X
Million out of European Deaths
Charlotte NC X 213 Countries Countries per
Chicago IL X Worldwide (pop. > 2 million) Country Population Million
Cincinnati OH X 2 1 Belgium * 11,595,151 851
3 2 U.K. * 67,924,946 686
Cleveland OH X X X
6 3 Spain * 46,756,796 610
Columbus OH X Italy * 60,451,842 582
7 4
Dallas TX X X X 17 8 Ireland * 4,943,652 358
Denver CO X
Des Moines IA X 8 5 Sweden 10,106,111 570
12 6 France 65,289,486 464
Detroit MI X X
16 7 Netherlands 17,139,065 359
Grand Rapids MI X 22 9 Armenia 2,963,856 267
Greensboro NC X 23 10 N. Macedonia 2,083,364 253
Hampton Roads VA X
U.S. For Comparison U.S.* 331,214,010 500
Hoboken NJ X
Houston TX X X
Mean 5G European Countries 617
Indianapolis IN X Mean non-5G European Countries 383
Jacksonville FL X p-value of T-test, with vs. without 5G 0.0257*
Kansas City MO X
King of Prussia PA X
Las Vegas NV X X
Little Rock AR X The 500 deaths per million for the
Los Angeles CA X X X U.S. are within the range of the 5G
Louisville KY X
European countries. Because of
Memphis TN X
Menlo Pk, Rdwd City, San Bruno CA X
differences in testing and criteria for how
Miami FL X X cases are counted between U.S. and
Miami Gardens (AT&T only) FL X European countries, deaths per million is
Minneapolis MN X
Nashville TN X
the most consistent number to use for
New York City NY X X X comparison between countries. However,
Oakland CA X there are still other differences between the
Ocean City MD X
Oklahoma City OK X
U.S. and European countries - per capita
Omaha NE X income, standard of health care,
Orlando FL X population demographics, quarantine
Panama City FL X
measures, and environmental factors like
Philadelphia PA X
Phoenix AZ X X air pollution - that complicate comparison
Raleigh NC X between countries. Nevertheless, these
Salt Lake City UT X
data are provided to show how the U.S.
San Antonio TX X
San Diego CA X
compares to the top 10 European countries
San Francisco CA X with the highest deaths per million, with
San Jose CA X and without 5G.
Sioux Falls SD X
Spokane WA X
St. Paul MN X 3.2 States with vs. without 5G mmW
Waco TX X
Washington DC X There were 32 states with 5G
West Hollywood CA X mmW and 18 states without 5G mmW.
Descriptive statistics for the cumulative
Copyright 2021 KEI Journals. All Rights Reserved. http://journals.ke-i.org/index.php/mraTsiang & Havas. Medical Research Archives vol 9 issue 4. April 2021 Page 7 of 32
data through April 22, which was just after twice as many deaths per million (126 vs.
the peak of daily deaths for COVID-19 had 55, ratio 2.29) for states with vs. without
occurred on April 21 (Figure 2), can be mmW technology. For mmW states
found in Table 3. The average rate of cases compared to the non-mmW states, there
and deaths was much higher for the mmW were almost twice as many cases/test
states compared to the non mmW states, (15.5% vs. 8.82%, ratio 1.76) and twice as
and these differences were statistically many deaths/test (0.721% vs. 0.364%,
significant with p-values between 0.005 to ratio 1.98). The fatality rate (deaths per
0. 046 (Table 3 and Table 4A). There were case) was higher for the mmW states but
almost twice as many cases per million was not statistically significant (4.13% vs.
(2,500 vs. 1,288, ratio 1.94) and more than 3.50%, ratio 1.18, p = 0.081).
Figure 2. COVID-19 daily new deaths peaked at 2,748 on April 21, 2020 in the U.S.
Source: Worldometer [1]
Table 3. Descriptive statistics through April 22, 2020 (after peak of daily deaths occurred)
for states with and without 5G mmW for population, mmW index, COVID-19 tests, air
quality index (AQI), and number of COVID-19 attributed cases and deaths. Statistical
significance is indicated by * (p < 0.05) and ** (p < 0.01).
Population
Density % %
(people Tests Cases Deaths % Deaths Deaths
State per sq. mmW per per per Cases per per
States n Population km) index AQI Million Million Million per Test Test Case
with 5G mmW max 39,937,489 467 1.284 51.2 39,487 13,368 1037 51.60% 3.04% 8.30%
with 5G mmW 32 mean 8,752,116 91.7 0.207 43.4 14,378 2500 126 15.50% 0.72% 4.13%
with 5G mmW min 903,027 4.29 0.006 33.5 7,224 492 10 4.50% 0.07% 0.47%
without 5G mmW max 8,626,207 287 0 47.6 21,540 6274 431 32.10% 2.20% 6.90%
without 5G mmW 18 mean 2,639,561 50.2 0 40.0 14,324 1288 55 8.80% 0.40% 3.50%
without 5G mmW min 567,025 0.502 0 21.2 6,567 412 8 2.30% 0.00% 1.30%
p-value of t-test 0.0002 ** 0.062 7.3E-06 ** 0.025 * 0.49 0.027 * 0.046 * 0.005 ** 0.022 * 0.081
Ratio of means 3.32 1.83 N/A 1.09 1.00 1.99 2.33 1.77 1.81 1.18
Copyright 2021 KEI Journals. All Rights Reserved. http://journals.ke-i.org/index.php/mraTsiang & Havas. Medical Research Archives vol 9 issue 4. April 2021 Page 8 of 32
Data from May 15 and May 31 there were 5776 vs. 3220 cases per million
show the same pattern as for April 22, with (ratio 1.79, p = 0.012); 307 vs. 158 deaths
statistically significant higher per million (ratio 1.95, p = 0.049); 9.88%
cases/million, deaths/million, cases/test, vs. 5.88% cases per test (ratio 1.68, p =
and deaths/test for the mmW states 0.003); and 0.494% vs. 0.270% deaths per
compared to the non mmW states. For data test (ratio 1.83, p = 0.025) (Table 4B & C;
cumulative through May 31, 2020, Figure 3A & B; Figure 4A & B).
comparing mmW to non-mmW states,
Table 4. Case and death rates attributed to COVID-19 and Pearson’s Correlations for
population density, mmW index and their interaction for U.S. states for cumulative data
through (A) April 22, 2020; (B) May 15, 2020; and (C) May 31, 2020. Statistical significance
is indicated by * (p < 0.05) and ** (p < 0.01). NOTE: YTD is year to date.
Copyright 2021 KEI Journals. All Rights Reserved. http://journals.ke-i.org/index.php/mraTsiang & Havas. Medical Research Archives vol 9 issue 4. April 2021 Page 9 of 32 Figure 3. COVID-19 attributed case/million (A) and deaths/million (B) for states with and without 5G mmW for data through May 31, 2020. Figure 4. Percentage of COVID-19 attributed cases/test (A) and deaths/test (B) for states with and without 5G mmW technology for data through May 31, 2020. Note: different scale. Copyright 2021 KEI Journals. All Rights Reserved. http://journals.ke-i.org/index.php/mra
Tsiang & Havas. Medical Research Archives vol 9 issue 4. April 2021    Page 10 of 32

3.3 Counties with vs. without 5G                    and 446 vs. 168 deaths per million (ratio
mmW                                                 2.65, p = 0.012), and these differences
       Data for 53 counties with 5G                 were statistically significant. The fatality
mmW and 49 counties without 5G mmW                  rate, which is deaths/cases, was higher for
were analyzed. Comparing mmW to non-                the mmW counties (4.70% vs. 4.07%, ratio
mmW counties, there were 7100 vs. 3797              1.15), but this difference was not
cases per million (ratio 1.87, p = 0.005)           statistically significant (Table 5; Figures
                                                    5A and 5B).

 Figure 5. COVID-19 attributed cases/million (A) and deaths/million (B) for counties
 with and without 5G mmW technology through May 31, 2020. Note: different scale.

Copyright 2021 KEI Journals. All Rights Reserved.    http://journals.ke-i.org/index.php/mra
Tsiang & Havas. Medical Research Archives vol 9 issue 4. April 2021 Page 11 of 32
Table 5. Descriptive statistics and Pearson’s Correlations for U.S. counties through May
31, 2020 with and without 5G mmW for population, population density, mmW index, air
quality index (AQI), latitude and number of COVID-19 attributed case and death rates.
Statistical significance is indicated by * (p < 0.05) and ** (p < 0.01).
Population %
Density Cases Deaths Deaths
County (people mmW per per per
Counties in U.S. n Population per sq. km) index AQI Latitude Million Million Case
with 5G mmW max 10,105,518 26,822 3.00 71.0 47.7 32,064 3,105 11.7%
with 5G mmW 53 mean 1,509,298 2,108 0.862 44.0 37.5 7,100 446 4.70%
with 5G mmW min 51,823 28.6 0.02 27.0 25.8 463 16 0.84%
without 5G mmW max 3,185,968 5,360 0 80.0 61.2 22,141 2,081 10.7%
without 5G mmW 49 mean 852,626 514 0 43.7 36.9 3,797 168 4.07%
without 5G mmW min 119,648 27 0 22.0 21.5 430 0 0.00%
p-value of t-test 0.005 ** 0.007 ** 3E-11 ** 0.44 0.31 0.005 ** 0.012 ** 0.11
Ratio of means 1.77 4.11 N/A 1.01 1.02 1.87 2.66 1.15
Pearson's Correlation to Pop. Density 0.594 0.699 0.430
Pearson's Correlation to PopDensity*mmW 0.508 0.676 0.446
Pearson's Correlation to mmW 0.615 0.709 0.371
Pearson's Correlation to Air Quality Index -0.212 -0.169 -0.072
Pearson's Correlation to Latitude 0.268 0.228 0.199
3.4 California Counties with vs. p = 0.064 and higher fatality rate (3.75%
without 5G mmW vs. 3.01%, ratio 1.25, p = 0.131) than that
Data for six counties with 5G of the non-mmW counties (Table 6).
mmW and 11 counties with a population
of 500,000 or greater without 5G mmW in 3.5 Pearson’s Correlations
California were analyzed. The six counties A Pearson’s correlation coefficient
with 5G mmW technology were San assesses the relationship between two
Francisco, Los Angeles, San Diego, variables. The correlation coefficient is
Alameda, Santa Clara, and San Mateo. The considered very strong between +0.7 and
11 counties that did not have 5G mmW +1; strong between ± 0.5 and ± 0.7, and
technology were Orange, San Bernardino, moderate between ± 0.3 and ± 0.49.
Contra Costa, Sacramento, Riverside, Pearson’s correlations of
Kern, Fresno, Ventura, San Joaquin, cases/million, deaths/million, cases/test,
Stanslaus, and Sonoma. The mmW and deaths/test to air quality index, latitude
counties had higher average cases per population density, and mmW index were
million (2750 vs. 1679, ratio 1.64, p = calculated. The results are in Table 4 for
0.06) and significantly higher average states, Table 5 for counties, and Table 6 for
deaths per million (102 vs. 52, ratio 1.96, California.
Copyright 2021 KEI Journals. All Rights Reserved. http://journals.ke-i.org/index.php/mraTsiang & Havas. Medical Research Archives vol 9 issue 4. April 2021 Page 12 of 32
Table 6. Descriptive statistics and Pearson’s Correlations for California counties through
May 31, 2020 with and without 5G mmW for population, population density, mmW index,
air quality index (AQI), latitude and number of COVID-19 attributed case and death rates.
Statistical significance is indicated by * (p < 0.05) and ** (p < 0.01).
Population
Density Cases Deaths %
County (people mmW per per Deaths
Counties in California n Population per sq. km) index AQI Latitude Million Million per Case
with 5G mmW max 10,105,518 7,245 1.20 71 37.8 5,309 231 5.16%
with 5G mmW 6 mean 3,117,676 1,653 0.61 48 36.2 2,750 102 3.75%
with 5G mmW min 769,545 262 0.22 35 32.8 1,409 46 1.62%
without 5G mmW max 3,185,968 1,352 0 80 38.6 3,055 138 4.53%
without 5G mmW 11 mean 1,367,642 400 0 54 36.2 1,679 52 3.01%
without 5G mmW min 499,942 38 0 34 33.9 909 8 0.73%
p-value of t-test, with vs. without 5G mmW 0.144 0.159 0.007 ** 0.236 0.498 0.060 0.064 0.131
Ratio of means, with vs. without 5G mmW 2.28 4.13 N/A 0.89 1.00 1.64 1.98 1.25
Pearson's Correlation to Pop. Density 0.250 -0.046 -0.292
Pearson's Correlation to PopDensity*mmW 0.294 -0.006 -0.296
Pearson's Correlation to mmW 0.705 0.591 0.157
Pearson's Correlation to Air Quality Index 0.512 0.557 0.305
Pearson's Correlation to Latitude -0.470 -0.481 -0.210
3.5.1 Correlations of Case and suburbs. So even though population
Death Rates with Population density is a major factor in transmission,
Density higher population density also inherently
Population density is strongly means higher wireless radiation exposure
correlated with the rates of cases/million, from neighbors (Table 4 for state data and
cases/test and deaths/million, and Table 5 for county data).
deaths/test in the 50 states (r =0.60 to 0.79 At the county level, population
for April through May) (Table 4). density was also found to be strongly
Population density is an indicator of correlated with the case and death rates.
person to person contact as well as the Pearson’s correlations between
amount of wireless radiation exposure. For cases/million and population density was
example, in New York City, many reside 0.594, between deaths/million and
in multi-level apartment buildings where population density was 0.699, and between
they are exposed to many Wi-Fi routers deaths/cases and population density was
and other wireless devices from closeby moderate, at 0.43 (Table 5). These
neighbors. In addition, Wi-Fi routers from correlations for population density are
certain providers have public Wi-Fi hot comparable to those reported in other
spots that provide service to other studies. A study [14] found a Pearson’s
customers. These hot spots give off correlation of ~0.6 for public transit to
enough radiation to wirelessly connect COVID-19 cases per million, and a ~0.5
anyone within a 100 meter radius [13]. correlation for population density to
Those living in an apartment complex in COVID-19 cases per million. A Brazilian
the middle of a large urban city are likely study reported a negative correlation
to be exposed to more Wi-Fi hotspots than between COVID-19 cases and temperature
those living in single family homes in the (r = -0.38) and a positive relationship
Copyright 2021 KEI Journals. All Rights Reserved. http://journals.ke-i.org/index.php/mraTsiang & Havas. Medical Research Archives vol 9 issue 4. April 2021 Page 13 of 32
between COVID-19 cases and population (Table 6). However, population density
density (r = 0.51) [15]. and latitude were not well correlated with
the cases and deaths per million for
3.5.2 Correlations of Case and Death California counties.
Rates with Millimeter Wave Exposure
The mmW index is moderately to 3.5.3 Synergy between Population Density
strongly correlated with cases per million, with mmW Exposure
cases per test, deaths per million, and There was a positive interaction
deaths per test for the 50 states. For between population density and the mmW
cumulative data through April 22, 2020, index acting together that was greater than
the Pearson’s correlations with the mmW the effect of population density or mmW
index for the cases/million (r = 0.479) and acting singularly on the deaths per million
deaths/million (r = 0.580) were the highest in the cumulative data through April 22.
of the correlations from the data from This is because the interaction of
April and May. From April to May, the population density with mmW index
same correlations trended downward (PopDensity*mmW) had a higher
slightly, but multiple linear regression correlation (0.783) to deaths/million
with cumulative data through May 31, (Table 4A) than either the correlation of
2020 determined that mmW index was a population density (0.577) or mmW index
statistically significant factor in the case (0.580) alone did with deaths/million,
and death rates, which is discussed later. meaning that the combined action of
The correlation between population population density with mmW index had a
density and mmW index is very low at stronger effect on deaths/million than
0.072, meaning that population density either population density or mmW index
and mmW index are not correlated to each did singularly.
other, and that a high mmW index area is
not necessarily a high density area. This is 3.5.4 Correlations of Case and Death
important, because it means that the higher Rates with Latitude and Vitamin D
rates of cases and deaths in mmW states Latitude is an indicator of potential
are not solely because of the higher sun exposure and vitamin D production.
population density that may be present in As latitude increases, the intensity of the
those states. radiation from the sun decreases, which
At the county level, mmW reduces endogenous vitamin D
exposure was also found to be strongly production. Higher latitudes have been
correlated with the case and death rates. found to be partially associated with
Pearson’s correlation for the mmW index increased COVID-19 mortality rates [16].
and for cases/million was 0.615, for Low vitamin D levels have been found to
deaths/million it was 0.709, and for be a risk factor for the COVID-19
deaths/cases it was a moderate 0.371 complications, which will be discussed
(Table 5). later. Latitude was found to have a weak
For California counties, there were correlation with the case and death rates
strong correlations between the mmW (0.199 to 0.268 in Table 5), however,
exposure index and cases per million (r = based on regression analysis, which will be
0.705) and deaths per million (r = 0.591), discussed later, latitude was a statistically
There were strong correlations also for the significant factor in the case and death
air quality index (AQI) and the cases (r = rates.
0.512) and deaths (r = 0.557) per million
Copyright 2021 KEI Journals. All Rights Reserved. http://journals.ke-i.org/index.php/mraTsiang & Havas. Medical Research Archives vol 9 issue 4. April 2021 Page 14 of 32
3.5.5 Correlations of Case and Death statistically significant contributors to the
Rates with Air Quality Index (AQI) rates of cases and deaths. For California
AQI was found to have very little counties, only the AQI and mmW index
to weak correlation with the case and death were statistically significant contributors
rates in the state and county analysis for (pTsiang & Havas. Medical Research Archives vol 9 issue 4. April 2021 Page 15 of 32
population density between average mmW exposure of those states, with the
state and average non-mmW state is 91.7- contribution from each being about the
50.2 = 41.5 (Table 3). So, the contribution same.
to the mean case/million for mmW states The regression equations also
from its higher average population density predict what the case and death rates
= 32.54*41.5 = 1350 (Table 8). The would be if there was no mmW exposure.
increase in mmW index between average For example, the mean cases/million of the
mmW state and average non-mmW state is mmW states is 5776 cases/million;
= 0.207 – 0 = 0.207 (Table 3). So, the however, if there was no mmW in these
contribution to the mean cases/million for states, the same regression equation
mmW states from its mmW exposure predicts that the mean cases/million would
index = 7100 * 0.207 = 1470 (Table 8). be 24% lower, at 4403 cases/million
Therefore, the contribution to the mean (Table 8).
cases/million for mmW states from mmW For all of the case and death rates
exposure is almost the same, but slightly for states, counties, and California, the
higher than it is from the higher population contributions from the higher population
density (1470 vs. 1350 out of the 5776 density and from the mmW exposure of
actual cases/million (Table 8). Thus, the the mmW states and counties are given in
higher mean cases/million for the mmW Table 8, as well as what the predicted case
states is due to the higher average and death rates would be if there was no
population density AND the mmW mmW exposure.
Table 7. Regression Equations for data cumulative through May 31, 2020. Statistical
significance is indicated by * (p < 0.05) and ** (p < 0.01).
p-value p-value
p-value for for for p-value p-value
Regression Regression Pop. mmW for for
R^2 adj (Sig. F) Density index latitude AQI
States: ** ** **
Case/Million = 1418 + 32.54 State Density + 7100 mmW index 0.732 1.35E-14 1.0E-13 3E-05 not sig. not sig.
Death/Million = 12.2 + 2.46 State Density + 577 mmW index 0.713 6.83E-14 7.2E-13 3E-05 not sig. not sig.
** ** *
Case/Test = 0.0534 + 0.000299 State Density + 0.0606 mmW index 0.427 7.89E-07 1.2E-06 2.6E-02 not sig. not sig.
Death/Test = 0.00144 + 2.68E-05 State Density + 0.00480 mmW index 0.525 9.73E-09 1.3E-08 1.6E-02 not sig. not sig.
Counties in US: ** ** ** *
Case/Million = -5080 + 0.576 Density + 218 Latitude + 3770 mmW index 0.448 2.80E-13 6.4E-03 2.5E-04 1.4E-02 not sig.
Death/Million = -435 + 0.0652 Density + 13.4 Latitude + 361 mmW index 0.587 2.10E-19 6.4E-05 5.0E-06 4.5E-02 not sig.
Counties in CA: ** ** **
Case/Million = -268+ 36.6 AQI + 2012 mmW index 0.725 4.71E-05 not sig. 9.9E-05 not sig. 1.6E-03
Death/Million = -49.7 + 1.96 AQI + 83.1 mmW index 0.610 5.37E-04 not sig. 2.0E-03 not sig. 3.1E-03
Copyright 2021 KEI Journals. All Rights Reserved. http://journals.ke-i.org/index.php/mraTsiang & Havas. Medical Research Archives vol 9 issue 4. April 2021 Page 16 of 32
Table 8. Predicted Values and Contributions from mmW index and higher mean density
for mmW state or county for data cumulative through May 31, 2020.
Predicted Ratio of
Contribution Contribution
Predicted Predicted from Higher mmW:Higher
by Change Predicted Mean Density Mean Density
Actual Regression if no Contribution of mmW state of mmW state
Value if no mmW mmW from mmW or county or county
mmW States:
Mean Case/Million 5776 4403 -23.8% 1470 1350 1.09
Mean Death/Million 307 214 -30.4% 119 102 1.17
Mean Case/Test 9.88% 8.09% -18.1% 1.25% 1.24% 1.01
Mean Death/Test 0.494% 0.390% -21.1% 0.099% 0.111% 0.89
mmW Counties in US:
Mean Case/Million 7100 4320 -39.2% 3260 918 3.55
Mean Death/Million 446 204 -54.3% 312 104 3.00
mmW Counties in CA:
Mean Case/Million 2750 1487 -45.9% 1227 N/A N/A
Mean Death/Million 102 44.4 -56.5% 50.7 N/A N/A
Figure 6 shows that the mmW 4. Discussion
exposure factor is better correlated than The world changed in March 2020
the population density with the case and after the WHO classified COVID-19 as a
death rates, and this is also seen in the pandemic and as countries closed their
higher R2 for the mmW exposure factor. borders and initiated social distancing.
For the cases/million, the R2 was 0.501 for Admittance to hospital intensive care units
the mmW exposure as a predictor (ICU) reached an all-time high in some
compared to the R2 of 0.363 for population places and elderly patients were moved to
density, and for the deaths/million, the R2 nursing homes, where residents and staff
was 0.632 for the mmW exposure as a quickly developed fatal symptoms of
predictor compared to the R2 of 0.526 for COVID-19.
population density. Ventilators, commonly used for
These R2 for COVID-19 case and respiratory ailments, were not as effective
death rate regressions as a function of as expected and doctors around the world
mmW exposure, population density, and were sharing their concerns about
latitude are better than those found by treatment protocols that were not working.
others. In New York a positive correlation Atypical cardiovascular complications
between COVID-19 cases per million and were also being reported, including blood
population density was R2 = 0.17, p < clots, hypoxia, arrhythmia, lower
0.01, and between cases per million hemoglobin levels and strokes even in
and public transportation commute younger patients [18-19].
ratios, R2 = 0.25, p < 0.01 [17].
Copyright 2021 KEI Journals. All Rights Reserved. http://journals.ke-i.org/index.php/mraTsiang & Havas. Medical Research Archives vol 9 issue 4. April 2021 Page 17 of 32
Figure 6. Regression plot for 53 counties with 5G mmW technology for COVID-19
attributed cases/million and deaths/million as a function of population density (A & B) and
as a function of 5G mmW exposure (C & D) through May 31, 2020.
COVID-19 was clearly different statistically significant to the case and
than previous viral respiratory illnesses, death rates in the analyses for states,
and one theory was proffered that COVID- counties, and California counties, i.e., in
19 may be associated with the rollout of all three analyses, while population
5G mmW technology, which had occurred density was statistically significant for two
just prior to the first cases of COVID-19 in of the analyses, and air quality index and
China [20]. latitude were statistically significant for
Our results show a statistically only one of the analyses.
significant increase between the COVID-
19 attributed cases and deaths in states and 4.1 COVID-19 Anomalies and Wireless
counties in the U.S. with vs. without 5G Radiation
mmW technology. States with 5G mmW There are some unique anomalies
technology had excess cases and excess in COVID-19 that distinguish it from other
deaths per million when compared to viral infections. These anomalies are
states without this technology, which was multiple blood clots that form in organs
the case for three different dates: April 22, and blood vessels, severe inflammation,
May 15 and May 30. When we examined hypoxia and hypoxemia, and skin lesions
U.S. counties, to determine how robust this even in those who test negative for SARS-
relationship was, we got the same trend. CoV-2 (suggesting that their symptoms
Multiple linear regression and may be due to something other than
Pearson’s correlation coefficients have SARS-CoV-2), and symptoms lingering
shown that the mmW index was for months after initial onset of the
Copyright 2021 KEI Journals. All Rights Reserved. http://journals.ke-i.org/index.php/mraTsiang & Havas. Medical Research Archives vol 9 issue 4. April 2021 Page 18 of 32
infection that resemble microwave these long COVID-19 patients have in
sickness symptoms. The interesting thing common with microwave sickness are
about these anomalies are that RF headaches, fatigue, difficulty
exposure can exacerbate all of them. concentrating, memory problems,
Some COVID-19 patients report insomnia, cardiovascular abnormalities
they have been sick for many months, like palpitations and tachycardia, tinnitus,
despite testing negative for the SARS- anxiety, depression, and skin lesions
CoV-2 virus, with numerous symptoms of according to a COVID-19 Survey Report
microwave sickness. Microwave sickness, by Indiana University School of Medicine
which the World Health Organization [21]. At least 24 of the long COVID
refers to as idiopathic environmental symptoms reported in the survey are also
intolerance attributable to electromagnetic symptoms of microwave sickness, aka
fields (IEI-EMF), is the medical term for EHS [22] (Figure 7).
the syndrome of symptoms that result from Wireless radiation is a toxic
chronic exposure to non-ionizing substance that degrades the immune
radiation. It is also referred to as system, and “[e]xposure to myriad toxic
electromagnetic sensitivity per the substances degrades the immune system,
Americans with Disabilities Act (ADA) or whose dysfunction is then exploited by
electrohypersensitivity (EHS) in some SARS-CoV-2 to result in COVID-19,” [23].
scientific studies. However, A recent Russian study found a strong
electromagnetic illness (EMI) is perhaps a correlation between a country’s exposure
more appropriate term since RFR exposure limits for RF radiation and COVID-19
has the potential to affect all humans and deaths per million (r=0.577) and deaths per
not only those who are highly sensitive to cases (r=0.551) [24].
this radiation. Most of the symptoms that
Figure 7. Prevalence of symptoms common to both COVID-19 and Electrohypersensitivity
(EHS). Sources: *[21], **[22]
Copyright 2021 KEI Journals. All Rights Reserved. http://journals.ke-i.org/index.php/mraTsiang & Havas. Medical Research Archives vol 9 issue 4. April 2021 Page 19 of 32
4.2 Common Mechanisms of Harm and population of 1000 µW/cm2 averaged over
Synergistic Effects between RF Radiation a 30-minute period has been the guideline
and COVID-19. since 1996 per FCC 47 CFR Ch. I § 1.1310
Radio frequency radiation (RFR) and the FCC has proposed to increase that
shares some mechanisms of harm with to 4000 µW/cm2 indefinitely in its 2019
SARS-CoV-2 which could act FCC Notice of Proposed Rulemaking 19-
synergistically with SARS-CoV-2 to 126 [9].
promote and prolong infection. As 5G mmW have not been tested for
explained below: (1) RFR impairs the their long-term biological effects and there
immune system which would contribute to is growing concern from the scientific and
a greater number of people becoming medical communities that this technology
infected and dying from disease [25-28]; could have adverse biological
(2) RFR is known to increase free-radicals consequences. Studies suggest that mmW
and contribute to oxidative stress, leading can contribute to ocular damage,
to increased inflammation [29-33]; (3) arrhythmias, antibiotic resistance among
RFR affects the blood, heart, and bacteria, teratogenic effects in drosophila,
autonomic nervous system resulting in and impaired immunity in mice [42]. Even
some combination of hypoxia, though mmW are absorbed mostly in the
tachycardia, arrhythmia, rouleaux skin, systemic signaling in the skin from
formation, and sympathetic up-regulation mmW can result in physiological effects
[34-36]; (4) RFR interferes with the on the nervous, cardiovascular and
body’s repair mechanisms [37-39]; and (5) immune systems mediated through
a growing population (between 1% – 10%) neuroendocrine mechanisms [42]. A
in developed countries is unable to tolerate compendium of 3800 studies showing a
current levels of RFR [40-41], developing myriad of harmful biological effects from
symptoms of microwave sickness that are RFR at non-thermal levels (and below
similar to those reported for long COVID- FCC’s exposure limits) are contained in
19 (Figure 7). the 2012 BioInitiative Report [43].
Microwave sickness is triggered by
our increasing exposure to RFR emitted by 4.3 Wireless Radiation affects the
mobile and cordless phones, cell phone Immune System, increases Oxidative
base stations, radar, broadcast antennas, Stress and Inflammation
Wi-Fi, Bluetooth, smart meters, smart There is a common presumption
appliances, smart homes, smart light that mmW are safer than the lower
bulbs, wireless security systems, wireless frequencies used in 4G and previous
personal assistants, wireless baby generations of wireless communications
monitors, and wireless wearables, and now because mmW are mostly absorbed in the
an increasing number of people are also skin. However, biological responses to
exposed to 5G mmW. mmW irradiation can be initiated within
Higher radiation exposures result the skin, and the subsequent systemic
from the shorter distance to people and signaling in the skin can result in
higher density of antennas for 5G mmW. physiological effects on the nervous
This is acknowledged by the FCC proposal system, heart, and immune system [44].
in December 2019 to increase the current The cities with 5G mmW would have the
exposure limits four-fold to accommodate most varied and highest potential RF
5G mmW devices and infrastructure. The exposure levels because 5G mmW
current exposure limit for the general requires the use of multiple small cells in
Copyright 2021 KEI Journals. All Rights Reserved. http://journals.ke-i.org/index.php/mraTsiang & Havas. Medical Research Archives vol 9 issue 4. April 2021 Page 20 of 32
close proximity to users and all three bands significantly improve immune function
of frequencies for 5G, in addition to and decrease inflammation in humans;
radiation from previous generations of lymphocyte NK (natural killer) cell
wireless communications.. activity increased by 30% after EMF
Additionally, severe inflammation exposure was reduced for two months
has been reported in COVID-19 cases, and [52]. In 2015, a significant discovery was
oxidative stress is a cause of inflammation made that the brain was directly connected
[45]. There are many studies showing that to the immune system by lymphatic
wireless radiation causes oxidative stress vessels [53], which would mean that the
and generates free radicals [29-33, 46-48]. immune system can be affected directly by
A review by an expert committee the brain and environmental influences
appointed by the Swiss government found that affect the brain, such as wireless
that RF-EMF increased oxidative stress radiation. A U.S. government study under
which can lead to changes in oxidative the National Institute of Health found that
balance, and that those with pre-existing cell phone radiation can affect the brain by
conditions (immune deficiencies or increasing glucose metabolism in the brain
diseases such as diabetes and [54] .
neurodegenerative diseases) that
compromise the body’s defense 4.4 Wireless affects Vitamin D and
mechanisms (including antioxidative Vitamin D Receptor
protection) can experience more severe Vitamin D is essential to the proper
health effects from EMF exposure; also, functioning of the immune system. Low
young and elderly individuals can react vitamin D levels have been associated with
less efficiently to oxidative stress induced the most severe symptoms of COVID-19.
by EMF [49]. So chronic RF exposure Patients with low vitamin D are twice as
creates oxidative stress and oxidative likely to experience major complications
stress leads to inflammation. RF exposure from COVID-19 [55]. Another study
has also been shown to directly increase found that 85% of severe COVID-19
inflammation by the production of pro- patients had vitamin D insufficiency, and
inflammatory cytokines that cause the that 100% of ICU patients less than 75
immune system to overreact [50]. years old had vitamin D insufficiency [56].
There are many studies showing The case fatality rate of COVID-19 was
the effect of wireless radiation on the highest in European countries with the
immune system [27, 43]. A 2013 review highest incidence of severe vitamin D
found that wireless radiation has a deficiency, and supplementation with
stimulating effect on the immune system vitamin D may reduce COVID-19
initially with short-term exposure, and an mortality [16].
immunosuppressive effect with chronic Vitamin D deficiency can result
exposure [26]. Cell phone radiation from inflammation caused by chronic
exposure for 1 hour per day for 30 days wireless radiation exposure [40]. Vitamin
compromised the immune system of rats, D supplementation was also found to
resulting in a significant decrease in reverse the negative effects of cell phone
immunoglobulin levels, total leukocyte, radiation on the immune system of rats
lymphocyte, eosinophil and basophil [41]. Wireless radiation also lowers
counts; and a significant increase in vitamin D receptor (VDR) activity by
neutrophil and monocyte counts [51]. changing the shape of the VDR, thus
Shielding from EMFs was found to impairing VDR activity and its ability to
Copyright 2021 KEI Journals. All Rights Reserved. http://journals.ke-i.org/index.php/mraTsiang & Havas. Medical Research Archives vol 9 issue 4. April 2021 Page 21 of 32
bind with vitamin D [28]. This is important reduces the amount of oxygen that would
because when a T-lymphocyte is exposed be carried from the lungs to the body’s
to a foreign pathogen, it extends a VDR to tissues, contributing to hypoxia. This is
search for vitamin D, and if there is important because SARS CoV-2’s ability
insufficient vitamin D, T-lymphocytes to infect cells is enhanced when blood
will not activate to destroy the invading oxygen levels decline. The
pathogens [57]. "furin cleavage" sequence in the virus
activates increased ACE2 receptor attack
4.5 Wireless Radiation depletes and cellular invasion in low oxygen
Glutathione which reduces Vitamin D environments [61].
and promotes Infection RF radiation also affects the
There’s evidence that low electron transport chain in mitochondria.
endogenous glutathione production has led Mitochondria supply the energy in cells
to complications in COVID-19 and that and consume the majority of oxygen in the
low glutathione levels reduce vitamin D cell. RF exposure leads to mitochondrial
levels [58]. Vitamin D was also found to dysfunction, leading to lowered oxygen
correlate positively with glutathione levels consumption in the cell and less energy
in type II diabetic patients [59], who have production, which would cause fatigue.
an increased risk for COVID-19 Wireless sources of EMF causing
complications. Glutathione treatment of extensive electron leakage from the
patients with COVID-19 pneumonia mitochondrial electron transport chain was
successfully prevented the cytokine storm attributed as the main cause of EMF
in COVID-19 patients [60]. Several damage in human reproductive cells, and
studies have shown reduced glutathione wireless EMF exposure increased
production from wireless radiation production of reactive oxygen species
exposure. Glutathione was found to be at (ROS) by mitochondria [32].
statistically significant lower levels in
those living close to a cell tower (within 80 4.7 Wireless Radiation promotes Blood
m) exposed to 100 times higher RF Clotting
radiation compared to those living far from Vitamin D also has an
a cell tower (300 m or more) [37]. Another anticoagulant effect, and low vitamin D
study found that radar workers in the levels have been shown to increase the
military who had been working with radar chance of venous blood clots [62].
for over 10 years had less than 50% of Formation of blood clots leading to
glutathione levels of non-radar workers, strokes and other complications have been
and this lower level was statistically reported in COVID-19 cases in the young
significant [30]. and middle-aged with no risk factors for
clotting. In children, a condition associated
4.6 Wireless Radiation lowers Oxygen with COVID-19 known as Multisystem
Intake and damages Mitochondria Inflammatory Syndrome in Children
RF exposure also affects the (MIS-C) with symptoms including
structure of hemoglobin, reducing its “COVID Toes” involves inflammation of
ability to bind to oxygen. After just two the blood vessels and the formation of
hours of exposure to cell phone radiation, blood clots.
human hemoglobin structure changed, RF exposure can cause red blood
decreasing its affinity to bind to oxygen in cells to clump and stick together, known as
the lungs between 11-12% [34] which rouleaux formation [35-36] (Figure 8). As
Copyright 2021 KEI Journals. All Rights Reserved. http://journals.ke-i.org/index.php/mraTsiang & Havas. Medical Research Archives vol 9 issue 4. April 2021 Page 22 of 32
early as 1978, effects of mmW on blood µW/cm2, mmW have been used to
were found to cause a “tendency toward stimulate immune cell activity suppressed
hypercoagulation” at an exposure of 1000 by anti-cancer drugs [69-70]. Chronic RF
µW/cm2 or less [63]; 1000 µW/cm2 for 30 radiation exposure within the FCC
minutes is the current exposure limit for permissible levels disturbs immune
mmW for the public in the U.S. function through stimulation of various
Electromagnetic fields were found allergic and inflammatory responses; for
to increase the risk for blood clot example, RFR increases mast cells in the
formation [64]. Other studies have also skin, morphologically alters immune cells,
shown changes in blood viscosity and and interferes with tissue repair processes
rouleaux formation with frequencies of 2 [25]. Anti-inflammatory effects of mmW,
kHz [65]. Frequencies in the 0-3 kHz achieved only with specific modulation
range are found in wireless frequencies for certain mmW carrier
communications in the form of pulsation frequencies, have been used
and modulation, and there is significant therapeutically also; but without the
evidence that the biological effects from correct modulation frequency, certain
wireless communications is because of carrier mmW frequencies were
these electric fields; in addition, the “ineffective” [71]. Therefore, it is not just
application of pulsed electromagnetic the mmW carrier frequency, but also its
fields (PEMF) for short periods of time combination with pulsation and
have therapeutic effects [44] such as the modulation frequencies that determine
stimulation of bone growth [66]. The right biological effects. Medical therapy using
modulation in pulsating electrostatic field RF and mmW radiation is achieved only
therapy can reduce rouleaux formation under controlled conditions, with specific
[67]. Electromagnetic fields have been carrier and pulsation and modulation
used for over a hundred years frequencies at specific power densities
therapeutically, and PEMF devices, over a specific and relatively short period
approved by the FDA, have been used in of time. The RF radiation that we are
animals and humans to reduce exposed to from wireless communications
inflammation, increase circulation and is constant and random, with varying
reduce pain [68]. The fact that RF power densities, layered with many
radiation at non-thermal levels is used in frequencies from different sources that use
medical therapy means that there are pulsation and modulation frequencies
biological effects of RF radiation at non- needed to enable wireless communications
thermal levels. In addition, mmW are used without consideration of biological
in medical therapy, including cancer effects. Consequently, medical mmW and
therapy. At power density levels far telecommunication mmW have very
exceeding the FCC permissible levels for different biological impacts due to
wireless communications of 1000 different exposure parameters.
Copyright 2021 KEI Journals. All Rights Reserved. http://journals.ke-i.org/index.php/mraTsiang & Havas. Medical Research Archives vol 9 issue 4. April 2021 Page 23 of 32
Figure 8. In A., red blood cells are not aggregated prior to RF radiation exposure. In B.,
blood cells from the same patient after 10 minutes of exposure to 2.45 GHz Wi-Fi aggregate
and exhibit rouleaux effect.
4.8 Both Wireless Radiation and lymphocyte cells increases allergic
SARS-CoV-2 interfere with reactions [73]. Increasing intracellular
Calcium Channels in the Cell Ca2+ concentrations have a myriad of
Membrane health effects, from headaches to cancer in
Cell membranes are considered the major humans [66].
target for the interaction between mmW A related virus, porcine
and biological systems, and the waves may deltacoronavirus, attacks host cells by
alter structural and functional properties of opening their voltage gated calcium
membranes [72]. The cell membrane channels (VGCCs) in the cell
becomes more permeable from RF membrane, which increases the calcium
exposure from cell phones due to changes ion (Ca2+) concentration inside host cells
in the phospholipid composition at which increases virus replication.
exposure levels well under the current Reducing the intracellular calcium by
FCC exposure limit. This increased cell blocking VGCC's reduced the infection
membrane permeability altered the [74]. Anti-viral medications work by
expression of 178 genes significantly (p < inhibiting VGCC activation to reduce
0.05), affecting processes such as DNA intracellular Ca2+ to inhibit the viral
replication and repair, cell signalling and replication [75].
calcium signalling, nervous system
function, immune system response, lipid 4.9 Both Wireless Radiation and SARS-
metabolism, and carcinogenesis [38]. CoV-2 interfere with Cell Signalling via
Voltage gated calcium channels (VGCC’s) p38/MAPK and mTOR Pathways
located in cell membranes control SARS-CoV-2 takes over a human
intracellular calcium ion (Ca2+) host cell by interfering with
concentrations, and exposure to phosphorylation cell signalling and
electromagnetic fields has been shown to altering the phosphorylation of 40 human
increase intracellular Ca2+ concentration in proteins and 49 kinase enzymes, involving
human lymphocyte cells between the p38/MAPK and mTOR pathways
approximately 25–50%, and this higher among others. This takeover of the human
intracellular Ca2+ concentration in human host cells by the virus prevents the host
cell from replicating and provides a stable
Copyright 2021 KEI Journals. All Rights Reserved. http://journals.ke-i.org/index.php/mraTsiang & Havas. Medical Research Archives vol 9 issue 4. April 2021 Page 24 of 32
environment for viral replication [76]. significant for multiple dates (April 22,
Signals from wireless communications May 15, May 31 2020) and for a variety of
have also been found to interfere with cell measurements (deaths/million, deaths/test,
signalling and phosphorylation in the cases/million, cases/test).
p38/MAPK and mTOR pathways, which Multiple linear regression found
were associated with an increased that at the state level, the mmW and the
permeability in cell membranes due to higher population density contributed
changes in its phospholipid composition almost equally to the increased case and
following exposure to radiofrequency death rates in the mmW states. Regression
radiation [38]. There have been many equations predicted that if the mmW states
studies on the interaction of EMFs with did not have mmW, the average cases per
cell signalling systems; interference with million for the mmW states would be
cell signalling and phosphorylation was reduced by 24%, and the deaths per
reported in an earlier study that found that million would be reduced by 30%.
pulsed EMFs rapidly activates the At the county level, the mmW
mTOR signalling pathway [77]. exposure contributed three times as much
For all the above reasons, as the higher population density to the
environmental exposure to 5G mmW can increased case and death rates in the mmW
increase cases and severity of COVID-19. counties. Regression equations predicted
that if the mmW counties did not have
5. Conclusion mmW exposure, the cases per million for
While 5G did not cause COVID- the mmW counties would be reduced by
19, statistical analysis showed that 39%, and the deaths per million would be
exposure to 5G mmW (which is present in reduced by 54%.
combination with 1G-4G and other RFR For California counties, mmW and
sources like Wi-Fi) is a statistically AQI were statistically significant
significant factor associated with higher contributors to the case and death rates
COVID-19 case and death rates in the U.S. while population density was not.
The higher population densities in the 5G Regression equations predicted that if the
mmW states or counties is another mmW counties did not have mmW, the
statistically significant factor but it does cases per million would be reduced by
not entirely account for the higher case and 46%, and the deaths per million would be
death rates in those states and counties. reduced by 57%.
Population density is an indicator not only It is not difficult to see how
of person to person contact, but also of radiofrequency radiation could increase
wireless radiation exposure from the case and death rates when wireless
neighbours. Latitude was also found to be radiation and SARS-CoV-2 share common
a statistically significant factor that mechanisms of harm to human and animal
increases case and death rates for 5G cells and wireless radiation exposure
mmW counties. Air quality was not found produces conditions that enhance
to be a statistically significant factor in the susceptibility to SARS-CoV-2. Both
case and death rates except for California interfere with cell signalling via the
counties. phosphorylation pathways, increase
The higher case and death rates in intracellular calcium ion concentrations by
the average mmW state or county activating VGCC’s, and interfere with the
compared to that of the average non-mmW actions of cell membranes.
state or county were statistically Radiofrequency radiation negatively
Copyright 2021 KEI Journals. All Rights Reserved. http://journals.ke-i.org/index.php/mraYou can also read