Shrinking Cities in Portugal - Where and Why1 - Associação Portuguesa para o ...
←
→
Page content transcription
If your browser does not render page correctly, please read the page content below
Shrinking Cities in Portugal – Where and Why1
    Declínio Populacional nas Cidades de Portugal – Onde e Porquê

                                 Maria Helena Guimarães
                                   mhguimaraes@uevora.pt
               Research Centre for Spatial and Organizational Dynamics (CIEO)
         Landscape Dynamics and Social Processes Group - Instituto de Ciências Agrárias
                           e Ambientais Mediterrânicas (ICAAM)

                                        Ana Paula Barreira
                   Research Centre for Spatial and Organizational Dynamics (CIEO)
                                       Thomas Panagopoulos
                   Research Centre for Spatial and Organizational Dynamics (CIEO)

                                                    Abstract/Resumo

    It may seem paradoxical that in a period of                          Na era do crescimento urbano pode parecer
rapid urban growth, some cities are shrinking;                       paradoxal que algumas cidades estejam em
however, they are two sides of the same coin of                      declínio populacional. Contudo, ambos os fenó-
urban change. This article identifies cities that                    menos são dois lados da mesma moeda. Este
are shrinking in Portugal. Looking at the demo-                      artigo identifica o declínio populacional nas
graphic evolution from the 1991 until 2011 we                        cidades em Portugal. Observando a evolução
identified 17 cities that are losing inhabitants, 9                  demográfica de 1991 a 2011 verificou-se que
of them persistently and 8 since 2001. This                          17 cidades estão a perder população: 9 persis-
decline is present in the two biggest cities of                      tentemente e 8 desde de 2001. Este grupo inclui
Portugal, Lisbon and Oporto that present 17%                         as duas maiores cidades portuguesas: Lisboa e
and 21% decline respectively. After this first                       Porto que apresentam 17% e 21% de declínio
screening, we crossed the history of each city                       respetivamente. Após esta primeira triagem, a
with socio-economic data (e.g. employment                            história de cada cidade e dados socioeconómi-
rate, housing characteristics, and unemploy-                         cos são cruzados (ex.: taxas de emprego, carac-
ment among others) and purposed that reasons                         terísticas da habitação, e desemprego, entre ou-
for shrinking include: suburbanization, eco-                         tras) permitindo propor as seguintes razões para
nomic transformation, satellite effect and envi-                     o declínio populacional das cidades: a suburba-
ronmental drivers. However, several cities pre-                      nização, as transformações económicas, o efeito
sent a mixture of reasons underlying shrinking                       satélite e os fatores ambientais. Porém, diversas
and further work should be undertake to com-                         cidades apresentam uma mistura de razões que
plement this exploratory analysis.                                   explicam o declínio da sua população. Esta
                                                                     análise exploratória deverá ser complementada
                                                                     com estudos mais aprofundados.

Keywords: Shrinking cities, pull and push                            Palavras-Chave: Declínio populacional nas
factors, Portugal, urban planning and econo-                         cidades, fatores de atração e repulsão, Portugal,
mics                                                                 Planeamento Urbano e Economia

JEL codes: R50, R58, 020                                             Códigos JEL: R50, R58, 020
1
  This work was funded by FEDER funds through the Operational Programme for Competitiveness Factors - COMPETE and National Funds
through FCT - Foundation for Science and Technology under the project: “EXPL/ATP-EUR/0464/2013 - “Policy guidelines for the regene-
ration in shrinking cities”
Revista Portuguesa de Estudos Regionais, nº 40

            1. INTRODUCTION                                Rhine-Ruhr area), in large portions of Euro-
                                                           pean post-Socialist countries (Großmann et al.,
    In 2008, the world reached an invisible but            2008; Kabisch, 2007) and in the “rust belt” in
momentous milestone: for the first time in                 the US (Beauregard, 2009; Blanco et al.,
history, more than half its human population               2009). However, today shrinkage is registered
was living in urban areas (UNFPA, 2007). At                in almost all countries and the number of
the same time in a significant number of cities            shrinking cities has increased faster than the
population declined (Oswalt and Rieniets,                  number of boomtowns (Oswalt and Rieniets,
2006). This might seem contradicting; howe-                2006; Turok and Mykhnenko, 2007). In 2006,
ver, it also shows that cities are complex sys-            and providing a perspective over the past 50
tems that are still evolving. In fact, shrinkage is        years, the Atlas of Shrinking Cities identified
a process as old as growth although the former             shrinkage in Western industrial countries, es-
is perceived as a symptom of failed planning               pecially in the USA (59), Britain (27), Ger-
while the latter is a synonym of success (Turok            many (26), Italy (23), and increasingly in for-
and Mykhnenko, 2007; Haase et al., 2012;                   mer Warsaw Pact countries, like Russia (13),
Hospers, 2013). For this reason, in a city that is         Ukraine (22), and Kazakhstan (13). Further,
shrinking, the phenomenon tend to be ignored               there have also been an above-average number
as long as possible while trying to invert such            of shrinking cities in South Africa (17) and
situation (Beauregard, 2005; Panagopoulos and              Japan (12). Between 1995 and 1999, Wiech-
Barreira 2012; Hospers, 2013). However, the                mann (2008) describes that the highest popula-
fact that a city is shrinking does not inevitably          tion loss was verified in northern Finland, in
mean it will disappear; however, it also doesn’t           central and northern Sweden, and in large parts
mean it will be back to the point of being a               of the Central and Eastern states. According to
very populated area (Power et al., 2010; Rink              the author considerable losses of population
et al., 2012). Literature shows that in some               also took place in southern Italy, northern
cases the shrinkage phenomenon lead to a de-               Spain, the central regions of France, Scotland,
cline in living conditions of those that stay              and in the Alentejo in Portugal. Data from
while in others it introduced opportunities to             Urban Audit, referred by Wiechmann (2008),
change, otherwise unavailable (Oswalt, 2005;               highlight that out of 220 large and medium-
Power et al., 2010; Maes et al., 2012).                    sized European cities, 57 per cent lost popula-
    In contrast to the abundance of research               tion in the period from 1996 to 2001. Among
about urban growth and its patterns, there is              them, Wiechman (2008) identifies Lisbon
not a “theory of shrinkage” (Rink and Kabisch,             (Portugal capital) included in the group of
2009; Haase et al., 2012). In Europe, the de-              cities with the highest relative loss of more
bate started in Germany and has spread inter-              than 1.75 per cent per year, from 1996 to 2001.
nationally although it remains an underrepre-              This value is also accompanied by Oporto
sented topic in comparative research (Oswalt               were population decline reached 1.37 per cent
and Rieniets, 2006; Pallagst, 2005; Haase et               per year (Sousa, 2010; Panagopoulos and Bar-
al., 2012; Großmann et al., 2013). In Portugal,            reira, 2012).
studies about this topic are scarce but increas-               Demographic data shows that in the future
ing (Balsas, 2000; Sousa, 2010; Panagopoulos               Europe will barely participate in worldwide
and Barreira, 2012).                                       population growth. Some countries, such as
    Shrinkage is not found exclusively in rural            Portugal, should even prepare for a general
areas, neighbourhoods, city size or in special-            decrease in resident population. We hope that
ized cities (Oswalt and Rieniets, 2006; Hos-               the present work contributes for such strategic
pers, 2013). A recent phase of shrinkage star-             thinking. Our goal is to provide an overview of
ted after the end of the II world war, accele-             the shrinking phenomenon in the cities of Por-
rated by the fall of the Berlin Wall and the               tugal. Ultimately, we purpose a typology by
globalization process, where in many coun-                 identifying the process, understanding the rea-
tries, urban growth was replaced by stagnation             sons behind it and by uncovering patterns of
and/or shrinking (Kabisch et al., 2006; Rie-               behaviour. This work can be considered an
niets, 2006). Shrinkage was frequent in                    exploratory analysis of the shrinking phenome-
Europe’s old industrial regions (Northern En-              non in Portugal and an in-depth analysis will
gland, the Scottish Clyde side, Lorraine, the              complement this effort. The typology sug-

                                                      24
Shrinking Cities in Portugal – Where and Why
gested here represented an intermediate achie- population is itself ageing; the share of older
vement within an exploratory project2 of one persons aged 80 years or over within the older
year duration that aimed at understanding the population was 14% in 2013 and is projected
policies preferences of residents of shrinking to reach 19% in 2050 (UN, 2013). Most of all,
cities towards the regeneration of shrinking the implication of this ageing process affects
cities. From the typologies that will be pre- all facets of human life; economically (e.g.
sented here the case studies were selected. economic growth, saving investments, pen-
In the next section we provide an overview sions), socially (e.g. family composition, living
of the causes, consequences and types of arrangements, healthcare services) and, politi-
shrinking. In section 3 we explain the data cally (e.g. voting patterns and political repre-
used and in section 4 the results obtained. In sentation).
section 5 we compare our findings with previ- Further, fertility rates have diminished in
ous works and provide some concluding re- practically all OECD countries to levels that
marks. are well below those needed to secure genera-
tion replacement (OECD, 2003). The world
2. LITERATURE REVIEW – population growth rate rose rapidly in the 20th
SHRINKING CITIES: CAUSES, century, reaching a peak at 2% per year in
CONSEQUENCES AND TYPES 1965-1970 (UN, 2013). This peak was fol-
lowed by a decline mostly as a consequence of
Shrinking cities have been discussed using the reduction of fertility rate in the developing
several approaches and definitions (Haase et regions. By 2045-2050 the expected world
al., 2012; Rink et al., 2012). In the present population growth rate is expected to drop to
work we use Turok and Mykhnenko (2007) 0.36%. While the population of the more de-
definition of shrinking cites as urban areas veloped regions is rising at an annual rate of
where a perceptible population loss occurs and, 0.28%, that of the less developed regions is
behind which a variety of entwined cause ef- increasing almost five times faster, and the
fect processes can be concealed. least developed countries as a group are ex-
Wars, natural disasters, environmental di- periencing even more rapid population growth,
sasters, epidemics, economic, political, and at 2.37% per year. Such disparities, although to
social transformations have affected population some extent soothed, are predicted to continue
settlement and demographic change every- until 2050.
where (Rieniets, 2009). Although the quantity Changes in city populations is not simply
of people living in a city does not provide a attributable to changes in birth and death rates;
full depiction, population changes is an impor- migration plays an important role (Portnov et
tant consequence, as well as, cause of urban al., 2000; Turok and Mykhnenko, 2007). Mi-
conditions, especially the availability of eco- gration dynamics emerge unmistakably as
nomic opportunities (Turok and Mykhnenko, being closely related to the causes of both
2007; Rink and Kabisch, 2009). growth and shrinkage. In an increasingly com-
petitive world, shrinking territories are those
2.1. Causes for population decline where push factors surpass pull factors. Migra-
tion can be triggered by several factors: ex-
One of the main reasons for population de- traordinary factors (e.g. conflicts), political
crease is ageing which has become a process transformation, economic transformation, envi-
without precedents in the history of humanity ronmental factors and competition among local
(UN, 2013). This process leads to a relative governments leading to urban sprawl and sub-
reduction in the proportion of children and to urbanization.
an increase in the share of people in the main A political transformation is mainly linked
working ages and of older persons in the popu- with the post-socialist transformation in East-
lation. Global share of people aged 60 years or ern Germany and Eastern Countries (Nuissl
over increased from 9.2 % in 1990 to 11.7% in and Rink, 2005; Bontje and Musterd, 2012).
2013 and will continue to grow reaching Given the income gap between Eastern
21.1% by 2050 (UN, 2013). Further, the older and Western countries or regions, population
2
EXPL/ATP-EUR/0464/2013 - “Policy guidelines for the regen-
eration in shrinking cities (2014-2015).
25Revista Portuguesa de Estudos Regionais, nº 40
migrate to Western areas in search of im- 2.2. Consequences for population
provements in wealth and quality of life condi- decline
tions.
Economic transformations include, deindus- Most scholars do not a priori determine the
trialization, sector decline (e.g. automotive, causal and sequential relation between eco-
mining, agriculture), rapid economic break- nomic decline and demographic decline, but
downs (e.g. collapse of the dot-com business), rather acknowledge that both types of decline
general economic cycles and macroeconomic are interrelated (Hoekveld, 2014). Hence, age-
trends, globalization, etc. Some authors con- ing previously described as a cause for popula-
sider economic transformation as the main tion decline can be also considered a conse-
cause of urban shrinkage (Friedrichs, 1993; quence (Haase et al., 2013; Hoekveld, 2014).
Oswalt, 2005). Economic transformation alters Currently, the characteristics of shrinkage
the profile of employment, skills, education, mainly correspond to the consequences of
accessibility, taxes, housing prices, etc., and shrinkage (Sousa, 2010). Other of the crucial
affects lifestyle, standards of living, quality of aspects of shrinkage is the number of vacant
life, and available urban amenities. dwellings and the amount of derelict land
Environmental factors are becoming more (Ahrens, 2005). This build-up environment
acute due to climate change and increased implies the general hollowing-out of the inner
health worries; hence the levels of pollution in city, declining target markets which erode the
cities, the availability of green areas and urban viability of neighbourhoods and the services
gardens (Kabisch and Haase, 2013) and the use within (Nevin and Lee, 2004). Further, popula-
of renewable energies (Hoornebeck and tion decline implies that many technical infra-
Schwarz, 2009) are factors that can induce structures will be used below capacity, mal-
migration. Weather factors by affecting urban functions will increase and the costs of supply-
quality of life are also important trigger factors ing drinking water, sewage disposal and other
for migration (Rappaport, 2007). services rise (Moss, 2008; Schiller, 2007).
Amongst the spatial patterns of migration, When features of a city became less attrac-
suburbanization is the most debated topic and tive those that have the capacity to leave do so
the definition of the concept is not yet consen- and those that stay are frequently disadvan-
sual (Ewing et al., 2003). However, for the taged population groups – the poor, the old,
current work we use the definition proposed by and foreigners – which can imply the rise of
Hesse (2006) that generally describes subur- social problems in this areas (Strohmeier and
banization as the sprawl of urban settlements, Bader, 2004; Moraes, 2007). The out-migra-
beyond the bounds of a core city and into its tion of those in the middle-class condemns
hinterland. Suburbanization occurred primarily many businesses to unsustainability, joining to
in conditions of urban growth. However, par- population also economic decline, which am-
tial or selective suburbanization processes can plifies the territorial as well as the visual im-
occur in conditions of shrinkage (Nuissl and pact of shrinkage. Moreover, the declining
Rink, 2005; Hesse, 2006; Siedentop and Fina, population heterogeneity can lead to the death
2008). Suburbanization entails a specific type of social life, of public sphere, which consti-
of out-migration which can be triggered by a tutes the main source of creativity and innova-
variety of reasons alone or combined (Van den tion, creating a sweeping knowledge and cul-
Berg et al., 1982). Due to local governments tural void (Borries and Böttger, 2004; Maes et
that compete to attract inhabitants, some al., 2012)
neighbour municipalities of a city supply pu- The generalized decay described above has
blic amenities and favourable conditions for an evident effect in the image of a territory
lower housing prices, thus leading to subur- (Beauregard, 2005). Borries and Böttger
banization. In other cases, due the small space (2004) conclude that the above scenario might
available at the core city, city expands from the induce lack of motivation, hopelessness and
traditional boundaries into new sprawled areas. sadness which can have a great impact on the
Besides, highway and cheap gasoline along mental maps or psychological conditions of
with the middle class capacity to afford cars residents. On the other hand, other authors
and single-family homes also have encouraged show that for the ones who choose to stay,
suburban growth (Baum-Snow, 2007; Rieniets, living in a shrinking city does not lead to less
2009). life satisfaction (Delken, 2008; Hollander,
26Shrinking Cities in Portugal – Where and Why
2010). Hospers (2013) provides some exam- parative disadvantages (lifestyle attractions and
ples of shrinking cities that while coping with climatic conditions) and societal/global chan-
it became more engaged and cohesive commu- ges (e.g. absolute decline of population).
nities. Under the European framework, more pre-
cisely for France, Cunningham-Sabot and Fol
2.3. Typologies of shrinking cities (2007) describe three types of urban shrinking
areas. Large urban areas suffering from dein-
Shrinkage is a context-base process hence dustrialization and, the fact of their economies
most authors propose typologies that have a were based on single industries (e.g. mining,
national nature (Cunningham-Sabot and Fol, ports). Most of the shrinking cities in France
2007; Martinez-Fernandez and Wu, 2007; are small urban areas, located in the middle of
Moraes, 2007; Beauregard, 2009). Neverthe- the country (from Ardennes to the Pyrenees,
less, attempts to propose general (Western) passing through the Massif Central). These
typologies exist (Pallagst, 2005; Wiechmann, areas are isolated from infrastructure and urban
2008). For the time being there is no esta- networks. Finally, urban shrinkage is occurring
blished global typology but the exercises al- within urban areas that are growing as a whole
ready made are an important source of infor- but where city centres are declining and outer
mation. suburbs are gaining population (mainly in the
Based on the causes of shrinkage, Pallagst south of France).
(2005) proposed one typology divided in four Finally and most relevant to the present
motives: 1) long-term industrial transformation work is the typology of shrinking cities in Por-
(e.g. from one production sector to another), 2)
tugal proposed by Sousa, 2010. The work is
rapid economic breakdowns (e.g. collapse of
based on data from 1991-2001 and cluster
the dot-com business), 3) environmental
analysis. From the cluster analysis at the city
threats (e.g. hazards, pollution), and 4) political
level, Sousa (2010) purposes 3 typologies: 1)
transformation (e.g. post-socialist systems and
metropolitan cores and (de)industrialized are-
economic changes).
as, composed of shrinking cities where impor-
Also based in the causes of shrinkage,
tant economic transformations have occurred;
Wiechmann (2006) proposes four types: 1)
2) small interior and coastal cities where
suburbanization (e.g. hollowing out, sprawl,
the consequences typically associated with
segregation), 2) industrial transformation (e.g.
shrinkage are more visible than population
old industrial areas and Rustbelts), 3) eco-
decrease itself and, 3) cities from th-e north,
nomical, environmental and political selective
centre and suburban cities of Lisbon Metro-
collapses (e.g. oil crisis, abandonment of mi-
politan Area suburban where almost all the
ning areas); and 4) political strategies (e.g.
consequences are not as remarkable as in the
depopulation areas).
other clusters which makes it difficult to un-
From countries away from the European
derstand the reasons behind shrinkage.
and USA realities the above typologies don´t
fit. Moraes (2007) describes that in Brazil the
emergence of empty rural towns and decaying 3. MATERIAL AND METHODS
metropolitan areas, in opposition to swollen
slums on metropolitan outskirts, are the result The main source of statistical information
of an unjust territorial dynamic generated by used in this empirical exploratory research is
the Brazilian land oligopoly, the government’s the Portuguese National Institute of Statistics
incapacity to produce jobs, the highly specula- (Instituto Nacional de Estatística - INE). Our
tive real estate market, the lack of housing analysis is mostly based on data gathered du-
subsidies for low income workers, and the ring the Censuses in the last 20 years: 1991,
inadequate use of land policies. 2001 and 2011. We examine variables and
Wu et al. (2008) further increments the dis- indicators over a ten to twenty years period at
cussion by adding other dimensions which different geographical levels. The data source
includes characteristics of shrinkage and in- used does not provide aggregated information
formation about contemporary examples such at the city level beyond resident population
as, the Chinese county towns. The typology data; hence our analysis was developed using
includes imposing circumstances (e.g. con- an approximation of such geographic level. In
flicts/war and depletion of resources), com- INE the city concept was defined in 2004 and
27Revista Portuguesa de Estudos Regionais, nº 40
named “statistical city”. Data aggregated at The variables used are listed in table 1. For
this level was not found for all the variables some variables, information at the level of
used and during the period of time analysed. parish was not available and municipalities
Therefore we defined each city by the total were used instead (e.g. housing prices, de-
number of parishes within and our first exer- pendence of social security, crime indices).
cise was the identification of the parishes be- Qualitative data concerning each city history
longing to each city of Portugal. The consi- was also used to better understand and charac-
dered number of cities was 158 which was the terize the shrinkage process. We look at the
total number of cities in Portugal in 2011. Ci- Portuguese cities, but also at their close and
ties do not necessarily correspond to the com- extended surroundings; not only to their indi-
plete parishes considered; however a finer vidual population change behaviour but also to
definition was not possible. The error exists their combined performance. The combination
but its transversal to all cases and it is not de- of these information lead to the typology sug-
trimental for our study. gested in the following section.
Table 1: Variables used to characterize the shrinkage process in Portugal
Variables Information derived
Differentiate between cities that are growing from those that are shrinking by calculating the
Resident Population
population growth rate.
Resident Population by age Realise the proportion of inhabitants by age groups and understand how it varied along the 20
groups years.
Measure the evolution of unemployment during the 20 years and its influence on the decline of
Unemployment rate
population.
Employment by activity sector Track possible economic transformations.
Assess suburbanization using the quantity of built houses in the city and surrounding areas, as
Housing
well as the quantity of vacant and old buildings in each city.
Housing price Find how the price by square meter of land compares with other cities.
Dependence of social security Check for the social fragility in each city.
Crime indices Assess the level of insecurity.
Existence of high education
Check how the lack of such institutions drives out-migration of young inhabitants.
institutions
Existence of highways Assess the level of isolation of cities.
Purchase Power Address differences regarding income.
4. RESULTS AND INTERPRETATION unemployment rate was 4.1% and after 10
years the percentage was practically the sa-
Portuguese population from 1991 until me (4% in 2001); however after 6 years the
2011 increased from 9.87 to 10.56 million value was doubled (8% in 2007), reaching 13%
inhabitants. This growth has not occurred at a in 2011 (source: INE). This number was al-
constant rate and differences between the two ready surpassed and in 2013 the unemploy-
decades are relevant. From 1991-2001 the ave- ment rate was 16.3% (source: INE).
rage growth rate (0.489%) was more than the Portugal has 158 cities from which 31 show
double of the one registered between 2001 and decrease when comparing the population re-
2011 (0.197%). After 2007, Portugal has been cords from 1991 to 2011. However, separating
registering a natural balance with negative the analysis in two decades, five of those cities
values, a situation that had only occurred by show an increase in population between 2001-
the end of World War I (1918). At the same 2011 (i.e. Funchal, Ponte de Sor, Elvas,
time, the strong positive net migration dimi- Amadora, Vila Nova de Santo André). From
nished as a consequence of the decline in mi- the remaining cities, 14 display a persistent
gratory entrance flows and of the increase in decline and 12 cities lost population from 2001
the exit flows (Carrilho and Patrício, 2002). onwards. From these 26 cities we excluded 9
Since the year 2000, the ratio of aged people cities since they were designated cities after
into total population exceeds the ratio of young 1991. From the remaining 17 cities, 8 show a
population (Sousa, 2010). In 1991 the national recent shrinkage and 9 a persistent one.
28Shrinking Cities in Portugal – Where and Why
4.1 Population trends in shrinking cities North (Seia and Gouveia), around river Tejo
(Tomar, Torres Novas, Vila Franca de Xira,
From the above screening we considered 17 Lisboa, Barreiro and Almada) and in the coast-
shrinking cities (Figure 1). Angra do Heroísmo line (Peniche). Close to the border with Spain,
and Horta are located in the Azores archipe- in the Alentejo region, three cities are shrink-
lago. In the North we found two coastal shrin- ing (Portalegre, Moura and Serpa). The south-
king cities, Oporto and Espinho and one in the ern area of Portugal, the Algarve region, in-
interior (Peso da Régua). In the center of the cludes 11 cities but none registered a popula-
country several cities are shrinking, in the tion decline during the period in analysis.
Figure 1: The shrinking cities considered in this work.
The above shrinking cities vary largely in crease between 555 (Peniche) - 290 (Vila
term of population size (table 2), as well as, in Franca de Xira).
the amount of lost population. In 2011, Lisbon The remaining five cities have less than 10
had close to 548 thousand inhabitants and lost thousand inhabitants being Gouveia the small-
around 116 thousand from 1991-2011. During est (circa 3 500 inhabitants). In this group,
the same period, Oporto the second biggest Gouveia is the only that show a persistent de-
city in Portugal (around 238 thousand inhabi- cline (~465 inhabitants) while the remaining
tants in 2011), lost circa 65 thousand inhabi- cities (Moura, Seia, Serpa, Horta) lost inhabi-
tants, the most important loss in relative terms tants from 2001-2011. During this decade
in 2011. The third biggest city, Almada with a Moura presents the biggest loss (less 800 in-
population size around 90 thousand inhabitants habitants).
lost close to 11 thousand inhabitants. The population decline presented in table 2
Nine cities have between 38 thousand (in includes changes in birth and death rates, as
Barreiro) and 10 thousand (in Peso da Régua) well as, migratory dynamics. In most of this
inhabitants. Barreiro, although ~2.5 times cases (e.g. Oporto, Lisbon, Portalegre, Torres
smaller than Almada, presents a similar popu- Novas, Serpa, Gouveia) the decline is heavily
lation decline (~10 thousand inhabitants). Be- influenced by the fact that the city population
tween 1991-2011, Espinho and Angra do is aging which implies high death rates and
Heroísmo population decline was around 3 low birth rates. However, we do not consider
thousand inhabitants in the former and 2 thou- this phenomenon a typology of shrinkage,
sand inhabitants in the later, while all the other similarly to the followed approaches taken for
cities up to 10 thousand inhabitants show a de- instance by Haase et al. (2013) and Hoekveld
29Revista Portuguesa de Estudos Regionais, nº 40
(2014). The results presented here are a step- factors that lead to shrinkage. In addition, in
ping stone within a project targeting the devel- each of the typologies suggested there are ci-
opment of policy guidelines for Portuguese ties with positive and negative dynamics bet-
shrinking cites. Therefore, aging of population ween births and deaths.
is mainly considered a consequence of other
Table 2: Shrinking cities divided by size (quantity of population)
Cities Population in 2011 91-01 ∆ pop (%) 01-11 ∆ pop (%) 91-11 ∆ pop (%)
Lisbon 547 733 -98 737 -15 -16 924 -3 -115 661 -17
Oporto 237 591 -39 341 -13 -25 540 -10 -64 881 -21
Almada 89 533 -7 884 -8 -3 072 -3 -10 956 -11
Barreiro 37 729 -7042 -15 -3130 -8 -10 172 -21
Espinho 26 868 -1 214 -4 -1 512 -5 -2 726 -9
Tomar 18 209 268 1 -695 -4 -427 -2
Vila Franca de Xira 18 197 -45 0 -245 -1 -290 -2
Torres Novas 16 302 27 0 -683 -4 -656 -4
Portalegre 15 642 -328 -2 -126 -1 -454 -3
Peniche 14 749 291 2 -846 -5 -555 -4
Angra do Heroísmo 10 887 -898 -7 -1461 -12 -2369 -18
Peso da Régua 9 959 -246 -1 -72 -1 -318 -3
Moura 8 419 579 7 -803 -9 -224 -3
Seia 6 342 463 7 -586 -8 -123 -2
Serpa 6 233 156 2 -330 -5 -174 -3
Horta 6 118 76 1 -346 -5 -270 -4
Gouveia 3 472 -62 -2 -403 -10 -465 -12
4.2. Suburbanized cities in Portugal and 8% respectively). Finally, Peniche al-
so shows signs of suburbanization since the
Among the 17 shrinking cities in analysis municipality grew around 6% while the city
are the country’s most important cities: Lisbon decreased 4% in inhabitants.
and Oporto. Oporto and Lisbon are the main Shrinking is a multi-causal process and
examples of those suffering from suburbaniza- shrinking cities in Portugal are a good example
tion. of this. The following typology designated
To understand if suburbanization is occur- economic transformation also includes three
ring we gathered data concerning the munici- cities were suburbanization was suggested:
palities. For Oporto and Lisbon cases the cities Oporto, Lisbon and Peniche.
embrace the total municipality; hence we gathe-
red data for the respective metropolitan areas 4.3. Portuguese shrinking cities where
(table 3). Results show that four of the shrin- relevant economic transformations
king cities are included in growing municipali- took place
ties which suggest that a process of suburbani-
zation is taking place. Vila Franca de Xira is To understand this process, three main
the municipality with the highest growing rate sources of information were crossed. In table 4
while the city is shrinking (-2% in 20 years), we calculate the unemployment rate of each
Almada present a much higher population de- shrinking cities. Unemployment increases du-
cline (-11%) while the municipality grew 13%. ring the 20 years in analysis; which is a trans-
Oporto and Lisbon cities are declining while versal phenomenon in Portugal. However, in
the surrounding urban areas are increasing (9 some cases the value achieved in 2011 sur-
30Shrinking Cities in Portugal – Where and Why
passes the one registered in the remaining gathered information regarding the employ-
years in more than the double (e.g. Espinho) or ment by sector of activity. With this data we
are above the national average. To better un- realized that in some cases the decrease of em-
derstand this decrease of economic activity we ployment is spread among the distinct sectors
Table 3: The rates of population change in cities and corresponding municipality. Oporto and Lisbon data
corresponds to the Metropolitan Areas.3
% of ∆ in population 91- % of ∆ in population 91-2011 in the corre-
Cities
2011 sponding municipality
Vila Franca de Xira -2% 30.7%
Almada -11% 13%
Oporto -21% 9%
Lisbon -17% 8%
Peniche -4% 5.7%
Horta -4% -0.1%
Angra do Heroísmo -18% -0.4%
Torres Novas -4% -3.1%
Portalegre -3% -6.2%
Barreiro -21% -8%
Espinho -9% -10%
Serpa -3% -12.9%
Moura -3% -14.4%
Tomar -2% -14.4%
Seia -2% -19.1%
Gouveia -12% -20%
Peso da Régua -3% -20.7%
Table 4: Unemployment rate for 2011, 2001 and 19914
Unemployment rate 1991 2001 2011
1 Espinho 7% 7% 18%
2 Oporto 8% 13% 18%
3 Peniche 8% 10% 17%
4 Moura 12% 10% 17%
5 Barreiro 12% 10% 16%
6 Gouveia 5% 8% 14%
7 Peso da Régua 10% 9% 15%
8 Almada 9% 8% 15%
9 Serpa 13% 14% 14%
10 Portalegre 7% 6% 14%
Portugal 4% 4% 13%
11 Seia 7% 8% 13%
12 Vila Franca de Xira 9% 7% 13%
13 Tomar 8% 8% 13%
14 Lisbon 7% 7% 12%
15 Angra do Heroísmo 4% 4% 10%
16 Torres Novas 6% 6% 10%
17 Horta 4% 4% 8%
3
Lisbon Metropolitan Area includes the following municipalities: Alcochete, Almada, Amadora, Barreiro, Cascais, Lisboa, Loures, Mafra,
Moita, Montijo, Odivelas, Oeiras, Palmela, Seixal, Sesimbra, Setúbal, Sintra and Vila Franca de Xira. Oporto Metropolitan Area includes the
following municipalities: Arouca, Espinho, Gondomar, Maia, Matosinhos, Oliveira de Azeméis, Paredes, Porto, Póvoa de Varzim, Santa
Maria da Feira, Santo Tirso, São João da Madeira, Trofa, Vale de Cambra, Valongo, Vila do Conde and Vila Nova de Gaia.
4
Calculated using the following formula: (Unemployed inhabitants/ Economically Active inhabitants) x 100
31Revista Portuguesa de Estudos Regionais, nº 40
of activity while in the cities identified in figu- Heroísmo suburbanization and economic trans-
re 2 the decrease is focused mainly in the se- formation do not explain the decline in resident
condary sector, specifically in the subsectors of population since the respective municipality is
constructions and or transformation industry also shrinking and the increase in unemploy-
(table 5). In these cases we propose that a pro- ment is spread by the different sectors of acti-
cess of economic transformation took place. vity. In these cases we explored the pull factors
The cities where this process was identified of the surrounding cities and for all this cases
were Lisbon, Oporto, Barreiro, Almada, Espinho, we found features that could induce the migra-
Peniche, Gouveia, Seia, Moura and Portalegre. tion of one city to another close-by. Hence
In some other cases such as Peso da Régua, these cities have been included in a typology
Torres Novas, Tomar, Horta and Angra do designated Satellite cities.
Figure 2: Number of employed inhabitants (1991-2011) in the cities where economic transformation was
identified.
Table 5: Decline of employment from 2001 to 2011 in the most affected sectors
Cities Transformation industry Construction sector Fisheries sector
Lisbon 44% 43%
Oporto 42% 45%
Barreiro 45% Not relevant Not relevant
Almada 49% 41%
Espinho 46% 51%
Peniche Not relevant 56% 37%
Gouveia 57%
Not relevant
Seia 50%
Not relevant
Moura Not relevant 70%
Portalegre 52% Not relevant
32Shrinking Cities in Portugal – Where and Why
4.4. Satellite shrinking cities grew 33% and the unemployment rate was
11%. Hence the economic conditions are supe-
This effect can be defined as a silent com- rior in this city. Further within Vila Real there
petition between urban areas close-by. In these is a public University while Peso da Régua
cases the pull factors from one city surpasses does not have any institution for higher edu-
those of a neighbouring one which leads to the cation. The combination of these characteris-
migration of inhabitants inducing a shrinkage tics are pull factors for young residents in Peso
process in the later due to less quantity or qua- da Régua, lacking employment opportunities
lity of pull factors or strong push factors. and or wanting to obtain higher education. The
In the case of Peso da Régua, there are 4 fact that from 1991 to 2011 the age group bet-
cities growing within a distant of ~50 km or ween 0-24 years was the one where the de-
less (figure 3). Peso da Régua lost around 300 crease was identified sustains the purposed
inhabitants while the unemployment rate in
typology (figure 4).
2011 was 15%. Vila Real in the same period
Figure 3: Peso da Régua and surrounding cities.
Figure 4: Number of inhabitants per age groups from 1991 to 2011 in Peso da Régua
Tomar and Torres Novas are two close-by push factors. Nearby there are three growing
shrinking cities (Figure 5) that show similar cities: Fátima, Entroncamento and Ourém
33Revista Portuguesa de Estudos Regionais, nº 40
(61%, 42% and 44% increased of population Ourém (9%) and Entroncamento (10%).
between 1991-2001, respectively) that act as Hence, inhabitants of Tomar and Torres Novas
atracting poles. migh decide to move to nearby cities due to
The unemployment rate (table 4) is equal to working opportunities. The fact that both cities
the national average in Tomar (13%) and present a decrease in population in the working
below in the case of Torres Novas (10%). ageing groups while the opposite is observed
Although the values are not particularly high in all three growing cities supports the
they are equal or above those of the nearby statements (figure 6).
growing cities: Fátima (8% of unemployment),
Figure 5: Location of two shrinking cities: Tomar and Torres Novas, as well as, the nearby cities where
population increase between 1991 and 2011
Figure 6: Number of inhabitants by age groups in the cities of Tomar, Torres Novas and nearby cities
between 1991 and 2011
Another relevant feature that could promote Novas (table 6). Even those individuals work-
this migratory movement is the housing prices. ing in these shrinking cities can be living on
The data regarding the housing prices at the one of the growing cities and do less than one
level of the Municipality show that the most hour per day of travelling between house and
expensive municipalities are Tomar and Torres work. Between the growing cities Entronca-
34Shrinking Cities in Portugal – Where and Why
mento registers the lowest crime rate, as well In the case of Horta, the city lost 300 in-
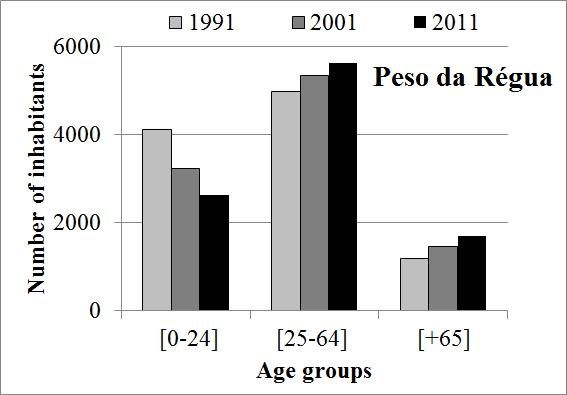
as, the biggest purchasing power. habitants between 1991 and 2011. The fact that
In this typology we also included two cities the island does not include any option for
located in the Azores archipelago. In total the higher education can partially explain the pos-
archipelago includes 6 cities; 3 in São Miguel sible migratory movement to the island of São
(Ponta Delgada, Ribeira Grande and Lagoa), Miguel and Terceira where the Azores Univer-
all of them showing an increase in population sity includes higher education opportunities.
between 1991-2011, 2 in Terceira (Angra do As in Peso da Régua, this possibility is sup-
Heroísmo shrinking and Praia da Vitória grow- ported by the fact that the decline is located
ing), 1 in Faial (Horta) that is losing popula- within the younger age group (see figure 7).
tion.
Table 6: Average housing price for the Municipalities where the cities of Entroncamento Fátima, Ourém,
Tomar and Torres Novas are included.
Municipalities Average Housing price(€/m2)
Entroncamento 846
Ourém5 911
Torres Novas 919
Tomar 978
Figure7: Number of inhabitant per age groups from 1991 to 2011 in Horta
For Angra do Heroísmo the reasons for de- could imply around 40 minutes a journey. This
cline in population are different since this city might have been a triggering factor for the
includes the campus of Azores University decision of inhabitants in Angra do Heroísmo
which makes it an important city for students. to move to Praia da Vitória. In fact, this is sup-
Nevertheless, the population is decreasing ported by data about migratory movement. In
while the neighbouring city, Praia da Vitória, Angra do Heroísmo the migration is negative
grew 4% between 2001-2001. In 2009, Praia while in Praia da Vitória it’s positive. The fact
da Vitória and Angra do Heroísmo were con- that in the island there are only two municipali-
nected by a fast road that implied a 20 minutes ties allows us to use data of 2011 census re-
distance by car between the cities. Previously garding the individuals that have changed resi-
the same trip was done by a national road that dency from one municipality to the other. Al-
5
This municipality includes Fátima and Ourém cities
35Revista Portuguesa de Estudos Regionais, nº 40
though this is a two way movement, we ob- in figure 8 and 9 two cities where population
served that went from Angra do Heroísmo to increased are under the same conditions:
Praia da Vitoria is almost twice (around Reguengos de Monsaraz and Elvas. This sug-
800) than those that left Praia da Vitória to live gests that environmental drawbacks can be
in Angra do Heroísmo (around 490). Finally, overcome by other features. In Elvas the pro-
in the next section we present the fourth and ximity to a highway and to one important city
last typology purposed by us. of Spain (Badajoz) might contribute to the
population growth registered. In the case of
4.5. Cities with environmental drivers Reguengos de Monsaraz, the proximity to
towards shrinkage Évora (one of the most important cities of
Alentejo), the industry of wine and tourism
In Portugal the shrinking phenomenon at might also be pull factors. Moura as we men-
municipal level has been more intense in the tion earlier suffered a recent economic trans-
interior of the country mainly in the Alentejo formation and so far hasn’t been able to revi-
region. This fact is partially explained by the talize the economic dynamic lost. In Serpa, the
combination of environmental push factors fact that it is located in one of the highest
such as the heat intensity and lack of water insolation areas in Portugal has been taken as
(Figure 8 and 9). an advantage and the instalation of the biggest
Serpa and Moura are shrinking cities lo- sun panel park in Europe was done there.
cated in the region with highest quantity of However, this per se has not been enough to
hours of sun per year while having the lowest prevent the decline or the effect of such
precipitation levels. These two features can strategy is yet to notice.
constitute push factors. Nevertheless, as show
Figure 8: Map showing the quantity of hours per year of sun in the southern area of Portugal and the
cities location.
Source: Atlas do Ambiente: http://sniamb.apambiente.pt/webatlas
36Shrinking Cities in Portugal – Where and Why
Figure 9: Map showing the quantity in milimeters of rain in one year in the southern area of Portugal and
the cities location .
source: Atlas do Ambiente:http://sniamb.apambiente.pt/webatlas
5. DISCUSSION AND in this group despite the fact the country pre-
CONCLUSIONS sents a diversify situation where some areas
don´t follow this overall trend (see details in
From the spread distribution of the shrin- Jacinto and Ramos, 2010). Therefore increa-
king cities in Portugal we can conclude that the sing negative natural rates were mainly consi-
phenomenon is not restricted to the interior and dered consequences of shrinking drivers.
isolated areas (i.e. the coastal pull factor). The- From 1991-2011 we identified 27 shrinking
se results endorse the argument that the dicho- cities in Portugal that were grouped around
tomy coast-interior is simplistic and the popu- four drivers: suburbanization, economic trans-
lation decline is a process much more complex formation, satellite effect and environmental
(Haase et al., 2013). factors.
In all shrinking cities we found that the Suburbanization affected the two main ci-
population and economic activity had a bigger ties of Portugal: Lisbon and Oporto. The de-
decrease from 2001 until 2011. Further, in cline trend in both cities is visible since 1970.
some cities we observed an increased econo- According to Panagopoulos and Barreira
mic activity followed by a heavy fall from (2012) one in five buildings in Lisbon is either
2001 to 2011 (Seia, Gouveia, Moura, abandoned or in poor condition. Nevertheless,
Portalegre and Peniche). This behaviour is in addition to the suburbanization process we
probably linked to what was observed at the found that both cities show considerable losses
country level. From 1991-2001 there was a in the construction and transformation sectors.
small increase in births, a strong increment in Specifically in Oporto, unemployment rate is
immigration and decline of the emigration the highest of the shrinking cities and 5%
(Carrilho and Patrício, 2002). Up to 2004, sev- above the national average. In the case of Lis-
eral events could have had a relevant impact on bon the city registers 5% increase of unem-
the economic performance of the country: Ex- ployment from 2001 to 2011; however it’s still
po 98, the introduction of the Euro (€) in 1999, below the national average. This might imply
the European Capital in Oporto in 2001 and the that Lisbon is more resilient to economic trans-
Euro cup in 2004. formations than Oporto.
Many developed countries face declining Within the typology of economic transfor-
birth rates and an ageing population, whereas mation the cases of Peniche, Barreiro and
immigration might not balance the losses Moura stand out. Peniche has one of the high-
(Großmann et al., 2013). Portugal is included est levels of fisheries dependence of all coastal
37Revista Portuguesa de Estudos Regionais, nº 40
municipalities in Portugal (Moniz et al.,2000). Comparing our typology proposal with
The activity includes not only the harvesting Sousa (2010) we found some relevant similari-
sector but also several related activities occur- ties which strengths both analysis done. The
ring both upstream (shipbuilding, gear manu- author identified three clusters of shrinking
facture) and downstream (processing, distribu- cities. The first comprises the cities of Almada,
tion and trade). With one of the nationally Vila Franca de Xira and Lisbon where predo-
most important fishing ports, the city also has a minate aged and derelict building blocks. The-
significant processing industry sector (Abreu et se results are in compliance with our findings
al., 2010). At present the sector is stagnant regarding the process of suburbanization oc-
after registering a decrease in its overall im- curring in these cities. The second cluster in-
portance in recent years. Further, the current cludes the cities of Elvas, Portalegre, Silves,
global decline of marine resources also con- Figueira da Foz and Gouveia. Since our dataset
tributed to the shrinkage phenomenon in includes an additional decade we found that
Peniche (Moniz et al., 2000; Abreu et al., Elvas, Silves and Figueira da Foz population
2010). has increased from 2001-2011. Despite this
Barreiro was one of the main industrial cen- fact, we support her findings for the cases of
ters of the Iberian Peninsula which attracted Portalegre and Gouveia. The third cluster
steadily new inhabitants after the 60’s but due comprehends the following cities: Alcobaça,
the deindustrialisation process, after the 90’s Amadora, Espinho, Fiães, Lamego, Lixa, Lou-
the city loss population, reaching in 2011 fi- rosa, Mangualde, Marinha Grande, Matosi-
gures equal to 1970. nhos, Odivelas, Penafiel and Santo Tirso. From
In the case of Moura city, the building of this group we just considered Espinho as a
Alqueva Dam (between 1998-2002) probably shrinking city. Lourosa and Fiães were esta-
explains the high economic activity followed blished cities in 2001; hence not considered by
by an impressive decline (in construction more us. The remaining cases show a population
than 70%) between 2001-2011. Thus, Moura is increase between 2001-2011.
a clear case of economic transformation. Ho- While uncovering a pattern of behaviour in
wever, Moura is also a city located in the most shrinking cities of Portugal we found several
environmentally harsh region of Portugal, the chain reactions that make it difficult to sepa-
Alentejo. The region is characterized by a rate the causes from the consequences of
combination of high temperatures and low rain shrinkage. Barreiro for instance is perceived as
and such setting makes it a challenging region a degraded residential area with sharp deterio-
to live in. In the era of climate and environ- ration of buildings and public spaces, loss of
mental changes there is need for careful con- environmental quality and urban and architec-
sideration of such conditions (Pallagst, 2005; tural distinctiveness, social degeneration with a
Rappaport, 2007). For this reason we sugges- decrease in population heterogeneity, growing
ted a typology focus on environmental drivers segregation – poor, inactive, illiterate or un-
towards shrinking. educated, and foreigners (namely Romany) –
Finally, we proposed another typology that and (perception) of growing insecurity are
is not frequently discussed in the literature, the worries. Hence, economic transformation
satellite effect. Several authors refer the fact might have been the cause of the above scenar-
that in some cases economic activity is increa- io; however, such factors are also push factors
singly concentrated in certain urban areas that can induce a shrinking process. A similar
which damages ‘ordinary’ cities and towns process has been described for the case of Vila
(Hospers, 2013; Merrilees et al., 2013). Within Franca de Xira where a process of suburbani-
Portugal some cities such as Entroncamento zation is taking place but socio-economic stra-
are designated sleeping cities, since most resi- tification is causing difficulties to territorial
dents live their but work somewhere else, cohesion and social integration (Sousa, 2010).
mostly in Lisbon, Tomar and Torres Novas Despite the manner used to define shrinking
(CME, 2009). Peso da Régua is also an inter- and its typologies, understanding the causal
esting case because although known as the processes of population decline gains more
international capital of wine and vineyard and importance when devising regional or city
located in a beautiful landscape in the center of strategies. The present work is a step towards
the Douro region, such attribute are not enough such planning effort. Nevertheless we highlight
to sustain inhabitants. the fact that further analysis of shrinkage in
38Shrinking Cities in Portugal – Where and Why
Portugal will be beneficial to complement the might prove to provide further insights to the
typology suggested. The use of the concept of present discussion, thus offering future re-
functional city instead of administrative city search developments.
when identifying shrinkage and typologies
REFERENCES
Abreu, S., Leotte, F., Arthur, R., 2010. Plano de Acção 2013 para o Concelho do
Assessment of the status, development and Entroncamento" (em Português). Development
diversification of fisheries-dependent in 2020 and Action Plan 2013 Strategy for the
communities: Peniche, Case Study Report. Entroncamento Municipality.
Ahrens, G-A., 2005. Demographic changes Cunningham-Sabot. E., Fol, S., 2007.
– consequences for the transportation sector. Shrinking cities in France and Great Britain: A
Journal of Public Health 13(1): 16–21. silent process?. The Future of Shrinking Cities
Balsas, C.J.L., 2000. City center Symposium: Problems, patterns and strategies
revitalization in Portugal. Lessons from two of urban transformation in a global context,
medium size cities. Cities 7(1): 19–31. Institute of Urban and Regional Development,
Baum-Snow, N., 2007. Did highways cause California.
suburbanization? Quarterly Journal of Delken, E., 2008. Happiness in shrinking
Economics 122(2): 775–805. cities in Germany: a research note. Journal of
Beauregard R.A., 2005. Images of renewal Happiness Studies 9: 213–221.
and decline. Conference “Beyond the Post- Ewing, R., Pendall R., Chen D., 2003.
Industrial City”, Camden. Measuring sprawl and its transportation
Beauregard, R.A., 2009. Urban population impacts. Transportation Research Record
loss in historical perspective: United States, 1831(1): 175–183.
1820-2000. Environment and Planning A 41 Friedrichs, J., 1993. A theory of urban
(3): 514–528. decline: Economy, demography and political
van den Berg, L., Drewett, R., Klaasen, L., elites. Urban Studies 30(6): 907–917.
1982. Urban Europe: a study of growth and Großmann, K., Bontje, M., Haase, A.,
decline (Oxford). Mykhnenko, V., 2013. Shrinking cities: Notes
Blanco, H., Alberti. M., Forsyth, A., for the further research agenda. Cities 35: 221–
Krizek, K.J., Rodríguez, D.A., Talen, E., Ellis, 225.
C., 2009. Hot, congested, crowded and diverse: Großmann, K., Haase, A., Rink, D.,
emerging research agendas in planning. Steinführer, A., 2008. Urban shrinkage in east
Progress in Planning 71(4): 153–205. central Europe? Benefits and limits of a cross-
Bontje, M., Musterd, S., 2012. national transfer of research approaches. In:
Understanding shrinkage in European cities. Nowak, M., Nowosielski, M. (Eds.), Declining
Built Environment 38(2): 153–161. Cities/Developing Cities: Polish and German
Borries, F., Böttger, M., 2004. Perspectives. Instytut Zachodni, Poznan: 77–
BürgerMeister: New tactics for shrinking 99.
cities. Advances in Art, Urban Futures 4: 53– Haase, A., Bernt, M., Grobmann, K.,
60. Mykhnenko, V., Rink, D., 2013. Varieties of
Carrilho. M.J., Patrício, L., 2002. A shrinkage in European cities. European Urban
situação demográfica recente em Portugal (The and Regional Studies 0(0): 1-17.
recent demographic situation in Portugal).
Haase, D., Haase, A., Kabisch, N., Kabisch,
Revista de Estudos Demográficos 32(2): 147–
S., Rink, D., 2012. Actors and factors in land-
176.
use simulation: The challenge of urban
C.M.E. (Entroncamento Municipality), shrinkage. Environmental Modelling &
2009. “Estratégia de Desenvolvimento 2020 e Software 35: 92–103.
39Revista Portuguesa de Estudos Regionais, nº 40
Hesse, M., 2006. Suburbanization. In fisheries dependent communities in Portugal:
Oswalt P. (Eds.) Atlas of Shrinking Cities. socio-economic change and strategic planning.
Hatje Cantz, Ostfildern: 96–97. Munich Personal, RePEc Archive No. 7154.
Hoekveld, J.J., 2014. Understanding spatial Moraes, S., 2007. Inequality and urban
differentiation in urban decline levels. Europe- shrinkage - a close relationship in Latin
an Planning Studies 22(2): 362-382. America. The Future of Shrinking Cities
Hollander, J., 2010. Can a city successfully Symposium: Problems, patterns and strategies
shrink? Evidences from survey data on of urban transformation in a global context,
neighborhood quality. Urban Affairs Review Institute of Urban and Regional Development,
47(1): 129–141. California.
Hoornebeck, J., Schwarz, T., 2009. Moss, T., 2008. ‘Cold spots’ of urban
Sustainable infrastructure in shrinking cities: infrastructure: ‘Shrinking’ processes in eastern
Options for the future. Report to Cleveland Germany and the modern infrastructural ideal.
Urban Design Collaborative, Kent State International Journal of Urban and Regional
University. Available at: Research 32(2): 436–451.
http://www.cudc.kent.edu/projects_research/re
Nevin, B., Lee, P. 2004. Changing housing
search/shrinking_cities.html. Accessed at:
markets and urban regeneration: the case of the
2014-07-03.
M62 corridor. In Project Office Philipp Oswalt
Hospers, G., 2013. Coping with shrinkage
(Ed.) Shrinking cities complete works 1:
in Europe’s cities and towns. Urban Design
Manchester/Liverpool, Berlin: 17–21,
International 18 (1): 78–89.
Available at: www.shrinkingcities.com.
Jacinto, A.R., Ramos, P.N., 2010. Movi-
mentos migratórios regionais do interior portu- Nuissl, H., Rink, D., 2005. The
guês: Quem saiu e quem entrou? Revista Por- ‘production’ of urban sprawl in eastern
tuguesa de Estudos Regionais 24: 71-85. Germany as a phenomenon of post-socialist
Kabisch, S., 2007. Shrinking cities in transformation. Cities 22: 123–134.
Europe - Reshaping living conditions in post- OECD, 2003. Low fertility rates in OECD
communist cities. Experiences from Eastern Countries: Facts and policy responses. OECD
Germany. In: Komar, B., Kucharczyk-Brus, B. Social, Employment and Migration Working
(Eds.), Housing and environmental conditions Papers, Paris.
in post-communist countries. Gliwice: 175– Oswalt, P. (Ed.), 2005. Shrinking cities:
192. International Research, Vol. 1. Ostfildern,
Kabisch, N., Haase, D., 2013. Green spaces Germany: Hatje Cantz.
of the European cities revised for 1990-2006. Oswalt, P., Rieniets, T. (Eds.), 2006. Atlas
Landscape and Urban Planning 110: 113–122. of shrinking cities. Hatje, Ostfildern.
Kabisch S., Haase A., Haase D., 2006. Pallagst, K. 2005. The end of the growth
“Beyond growth – Urban development in machine – New requirements for regional
shrinking cities as a challenge for modelling governance in an era of shrinking cities.
approaches”, 3rd Biennial meeting of the Association of Collegiate Schools of
International Environmental Modelling and Planning’s 46th Annual Conference, Kansas
Software Society, Vermont. City, Missouri.
Maes, M., Loopmans, M., Kesteloot, C., Panagopoulos, T., Barreira, A.P., 2012.
2012. Urban shrinkage and everyday life in Shrinkage perceptions and smart growth
post-socialist cities: Living with diversity in strategies for the municipalities of Portugal.
Hrušov, Ostrava, Czech Republic. Built Built Environment 38 (2): 276–292.
Environment 37(2): 229–243.
Martinez-Fernandez, C., Wu, C.-T., 2007. Portnov, B.A., Erell, E., Bivand R., Nilsen
Shrinking cities in Australia. State of A., 2000. Investigating the effect of clustering
Australian Cities Conference, Adelaide. of the urban field on sustainable population
Merrilees B., Miller, D., Herington, C., growth of centrally located and peripheral
2013. City branding: A facilitating framework towns. International Journal of Population
for stressed satellite cities. Journal of Business Geography 6(2): 133–154.
Research 66: 37–44. Power, A., Plöger, J., Winkler, A., 2010.
Moniz, A.B., Kovács, I., Vicente, D.N.S, Phoenix cities: The fall and rise of great
Ramos A.R., 2010. Fisheries development and industrial cities. Bristol: Policy Press.
40You can also read