Identifying and Selecting Key Sustainable Parameters for the Monitoring of e-Powered Micro Personal Mobility Vehicles. Evidence from Italy - MDPI
←
→
Page content transcription
If your browser does not render page correctly, please read the page content below
sustainability

Article
Identifying and Selecting Key Sustainable Parameters for the
Monitoring of e-Powered Micro Personal Mobility Vehicles.
Evidence from Italy
Elena Carrara, Rebecca Ciavarella, Stefania Boglietti, Martina Carra, Giulio Maternini and Benedetto Barabino *

                                             Department of Civil, Environment, Land and Architecture Engineering and Mathematics (DICATAM),
                                             University of Brescia, Via Branze 43, 25123 Brescia, Italy; e.carrara001@studenti.unibs.it (E.C.);
                                             r.ciavarella@studenti.unibs.it (R.C.); s.boglietti001@unibs.it (S.B.); martina.carra@unibs.it (M.C.);
                                             giulio.maternini@unibs.it (G.M.)
                                             * Correspondence: benedetto.barabino@unibs.it

                                             Abstract: The recent invasion of electric-powered personal mobility vehicles (e-PMVs) in many cities
                                             worldwide has disputed the transport sector and captured the attention of academics, practitioners,
                                             and public administrators. Indeed, these vehicles are believed to be sustainable transport alternatives.
                                             Therefore, understanding how to evaluate and monitor the related performance is crucial and may be
                                             addressed by suitable key sustainable parameters (KSPs) to inform on the excellences and criticalities
                                             of e-PMVs. Previous research has focused largely on “how to measure and manage” KSPs rather than
                                             “what to measure”. Conversely, as far as the authors know, no study investigated objective methods
                                             for identifying and selecting top KSPs. This paper covers this gap by proposing a cohesive approach,
                                             which identifies a long list of KSPs, defines their properties, involves experts to elicit judgments for

                                      each KSP, evaluates the long list, and returns the most promising set. This approach is demonstrated
Citation: Carrara, E.; Ciavarella, R.;       with an application based on an Italian survey. A circumscribed and relevant set of six overlapping
Boglietti, S.; Carra, M.; Maternini, G.;     KSPs is derived by merging two different approaches. These results may support the opportunity to
Barabino, B. Identifying and Selecting       assess the performance of e-PMVs among cities according to a common set of KSPs.
Key Sustainable Parameters for the
Monitoring of e-Powered Micro                Keywords: micromobility; personal mobility vehicle; sustainability assessment; analytic hierarchy
Personal Mobility Vehicles. Evidence         process; sustainable micromobility parameters
from Italy. Sustainability 2021, 13, 9226.
https://doi.org/10.3390/su13169226

Academic Editor: Miguel Amado                1. Introduction
                                                   Nowadays, sustainability has become one of the core objectives of the transport sector
Received: 5 August 2021
Accepted: 15 August 2021
                                             worldwide. The rapid growth in energy consumption, environmental pollution, and
Published: 17 August 2021
                                             climate change is receiving increasing attention. These facts captured the attention of
                                             academics, practitioners, and public administrators to reinvent transport modes towards
Publisher’s Note: MDPI stays neutral
                                             less energy-intensive solutions such as electric micromobility devices to achieve a more
with regard to jurisdictional claims in
                                             sustainable urban transport [1,2]. Generally speaking, electric micromobility refers to
published maps and institutional affil-      electric-powered micro personal mobility vehicles (e-PMVs) and aims to serve the mobility
iations.                                     demand for short and medium-range trips (within 5 km). The e-PMVs include micro-
                                             vehicles that can be driven while seated (i.e., electric scooters, pedal-assisted or electric
                                             bicycles) or standing (i.e., e-kick scooters, segways, hoverboards, and monowheels).
                                                   Nowadays, e-PMVs (privately or shared) are mostly invading large urban contexts
Copyright: © 2021 by the authors.
                                             (e.g., Rome, Milan, Paris). They are believed to be an environmentally friendly new
Licensee MDPI, Basel, Switzerland.
                                             transport mode because they may increase community relationships, reduce emission
This article is an open access article
                                             levels, and improve air quality. In addition, e-PMVs could reduce traffic congestion—and
distributed under the terms and              consequently, travel times—due to the possibility of using a viable transport alternative
conditions of the Creative Commons           in urban areas for many users. However, some studies showed that they could replace
Attribution (CC BY) license (https://        walking and cycling without reducing the use of private cars for short trips, e.g., [3].
creativecommons.org/licenses/by/             Therefore, the praised sustainable benefits of this new transport mode could be wholly or
4.0/).                                       partially disregarded [4–7].

Sustainability 2021, 13, 9226. https://doi.org/10.3390/su13169226                                          https://www.mdpi.com/journal/sustainability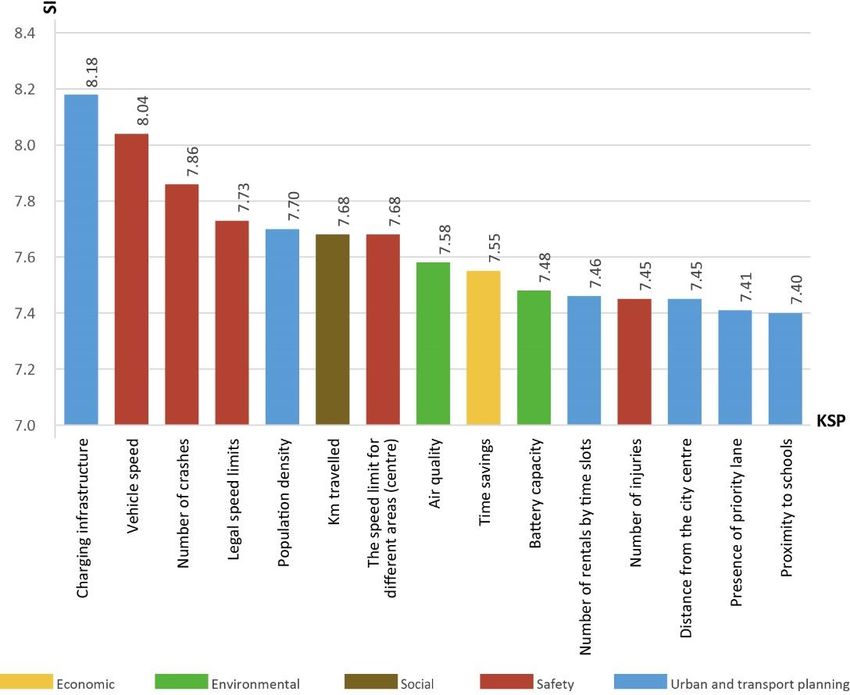
Sustainability 2021, 13, 9226                                                                                             2 of 22

                                      Owing to this exceptional spread, the interest of academics, practitioners, and public
                                administrators towards e-PMVs has grown considerably and caused several challenges,
                                such as monitoring the performances of e-PMVs. For instance, many public administrators
                                could be unprepared to monitor the performance of e-PMVs in their contexts (e.g., where to
                                locate the charging infrastructures, the numbers of riders) without a clear and effective set
                                of parameters representing their characteristics. Thus, these parameters are a fundamental
                                input in monitoring e-PMVs because they help detect excellences and criticalities. Therefore,
                                the selection of key sustainable parameters (KSPs) is crucial for this task.
                                      However, little attention has been paid to the following three issues.
                                      First, relevant inclusive reviews investigated many issues of e-PMVs, seeing as how
                                they are a quite recent and hot research topic. O’Hern & Estgfaeller [8] provided a scien-
                                tometric review to synthesise, sort rapidly, analyse bibliographic data, and display the
                                evolution of mobility research in the field of micromobility in terms of time, region, and
                                numbers of citations. Boglietti et al. [9] reviewed endogenous and exogenous issues of
                                e-PMVs. The former refers to problems strictly related to the use of e-PMVs in public spaces,
                                while the latter refers to the external effects of their use, therefore, their impact on users’
                                road safety and the environment. Lastly, Sengül and Mostofi [10] reviewed the impacts
                                of e-PMVs according to travel behaviours, energy consumption, environmental impacts,
                                safety, and related regulations. Surprisingly, despite these quite comprehensive reviews,
                                there is a lack of research focused on identifying parameters (or indicators) suitable to
                                evaluate and monitor e-PMV performance over time. Boglietti et al. [9] also noted this
                                research gap and stressed the importance of monitoring e-PMVs with proper parameters.
                                      Second, existing research is focused on the development of models and methods on
                                how to measure and manage KSPs rather than on what to measure [8–10]. Indeed, previous
                                research rarely investigated parameter selection mechanisms by objective methods.
                                      Third, according to Castillo and Pitfiled [11] and Barabino et al. [12], selecting suitable
                                KSPs presents some challenges, which require a systematic method to improve their
                                acceptability and credibility among experts. Although many potential KSPs may be
                                considered, the selection of a compact subset of them may be tricky. Moreover, since KSPs
                                are only constructs of the e-PMV system, it is challenging to select those more suitable for
                                its characterisation.
                                      Considering the previous drawbacks and challenges, this study proposes a cohesive
                                approach to identify and select a pool of KSPs able to provide a high-level direction for
                                monitoring the performance of e-PMVs. At first, this approach identifies a long list of
                                KSPs; next, it points out components and attributes for KSPs and involves experts to
                                obtain judgments on each KSP. Finally, it evaluates and ranks KSPs by a weighted outcome
                                score. These evaluations are carried out on the data collected by Italian experts involving
                                academics, practitioners, and users of e-PMVs. This approach differs from ELASTIC, i.e., a
                                framework for identifying and selecting sustainable transport indicators by UK experts [11].
                                Moreover, it differs from other research, which proposed an integrated approach to select a
                                set of key performance indicators to monitor the transit service quality [12].
                                      Since a key goal of each form of sustainable transport (including e-PMVs) is the
                                evaluation of its performances, the content of this study contributes to the progress of
                                analyses and monitoring on the use of e-PMVs for academics, practitioners, and public
                                administrators. Indeed, this study sheds new light on a research area that has been
                                largely neglected. For instance, academics and practitioners could re-think the need to
                                accommodate e-PMVs in urban spaces, and public administrators could measure KSPs to
                                evaluate their benefits and downfalls.
                                      The remainder of the paper is structured as follows: Section 2 reviews the related and
                                relevant literature. Section 3 describes the cohesive method characterised by six procedural
                                steps to identify and select the most suitable KSPs describing the performance of e-PMVs.
                                Section 4 presents the results of the most promising set of KSPs. Section 5 discusses the
                                results in the context of the literature. Finally, Section 6 concludes the study and provides
                                research perspectives.
Sustainability 2021, 13, 9226 3 of 22
2. State of the Art KSPs
The search of parameters in the literature was carried out through the Google Scholar
and Scopus databases. These databases identified articles from the academic literature
using multiple keywords (i.e., e-scooters, micromobility, sustainable micromobility, sus-
tainable transport, environmental sustainability, electric vehicles, sustainable transport
indicators). The reading of titles and abstracts enabled a more accurate selection of sources
consistent with the topic studied. Given the number of identified parameters, we cat-
egorised them into key criteria, representing a reference theme. Each key criterion has
an associated parameter category that can be further divided into sub-parameters and
sub-sub-parameters (if any).
More precisely, Table 1 lists the recent literature and provides a summary of parameters
for the possible evaluation of the performance of e-PMVs. Table 1 is organised into four
parts. The first part contains sources, and the second specifies the number of key criteria
(#KC), parameters (#P), and sub-parameters (#sP) for each source. The third part specifies
which key criteria and parameters were investigated, and, finally, the fourth part shows
how these parameters were selected from the literature. In addition, Table 1 is alphabetically
ordered according to the source.
Data reported in Table 1 leads us to two considerations.
As for the first consideration, the key criteria concerned economic, environmental,
safety, social, and urban and transport planning issues.
The economic criterion included the costs of users to use the service. Therefore,
the cost reduction and increased performance of e-PMVs in terms of effectiveness and
sustainability were considered. The economic criterion referred to the travel costs incurred
by users and the time spent travelling due to traffic congestion. Indeed, market analyses
showed that the costs of managing, maintaining, and operating e-PMVs were significantly
lower than the vehicle itself. Furthermore, given the possibility of travelling on a priority
lane, the use of e-PMVs reduced travel time compared to other means of transport [13,14].
The environmental criterion included several parameters to monitor the impact that
e-PMVs had on the surrounding environment: energy savings, CO2 emissions, and other
emissions. The release of CO2 is influenced by the materials utilised and the production
processes, including the related charging stations. Emissions could depend on several
facets, including the vehicle’s LCA emissions, type of fuel used, mode of transport replaced,
and their daily management. Finally, parameters such as the battery capacity, alternative
transport choice, consumption of energy use, or renewable energies could affect the energy
saving of e-PMVs [5,15].
Being a transport mode, many authors highlighted the safety criterion in e-PMV
systems. They considered, on a case-by-case basis, the internal and external users of the
system. The parameters evaluated the number of crashes and types of injury associated
with the crash. Consequently, other parameters focused on the optional devices available
(for the vehicles or users) to prevent crashes or limit their injuries, or again the user’s
knowledge of the traffic rules and the different types of speeds allowed, including the
speed limit of the vehicle itself. Finally, some studies focused on the perception of safety
both by pedestrians and by the user of the e-PMV [16–18].
The social criterion referred to studies examining the impact of e-PMVs on people’s
lives and population characteristics, both in terms of user habits and fairness of the service
to the population. Parameters were based on social and economic equity (i.e., gender, race,
employment, education, income), the number of trips, kilometres travelled, travel time,
and the average age of users. [19,20].
Finally, the urban and transport planning criterion considered the sustainability of
e-PMVs within the definition of urban development and sustainable transport systems that
involve the well-being of people and the design of the urban environment. Specifically, it
included evaluating infrastructural parameters such as the presence or absence of routes
dedicated to e-PMVs, recharging stations, rentals, or conflicts with the road or parking
areas. Some parameters concerned the impacts on mobility systems depending on the useSustainability 2021, 13, 9226 4 of 22
of urban space and a multimodality offer. Moreover, an analysis of the possible demand
for e-PMVs grouped the population density, connection, and distance from the attractors
of the city (e.g., city centre, shopping centres, schools, offices, parking lots) [21–23].
The second consideration concerned the selection of the parameters. It was carried out
by three different approaches. The selection of parameters from previous literature (L) on
e-PMVs is the prevalent type. By this approach, parameters were selected by drawing on
previous relevant studies about e-PMVs. They ranged from road safety to the perception
of users and non-users [18,21,24]. The second approach selected the parameters through
specific corporate inquiries (C). Therefore, parameters were selected according to the goals
or objectives of the organisations. The commonality between studies is the willingness
to guide mobility strategies. For example, Schellong et al. [25] analysed the market of
the main companies due to highlighted opportunities for mobility service providers and
platforms. Clewlow [17] examined the potential of e-PMVs in several USA cities through a
database of private companies. In both approaches, no report or study presented a ranking
of the best parameters for evaluating e-PMVs. Conversely, the third approach is based on
models and/or methods (M). More precisely, some studies applied simple regression [26]
or spatial regression models [19,23,27] to existing e-PMV systems (e.g., Austin, Louisville,
Minneapolis) to explore which parameters affect e-PMV travel or usage patterns. The
regression highlighted the significant parameters related to, e.g., demographics, density,
social or economic diversity, land use, design, distance to transit, and other transport-
related variables that affect e-PMV travel or usage patterns. Caspi et al. [27] deduced
that the level of employment and charging infrastructure influences the use of e-PMVs.
Hosseinzadeh et al. [23] and Bai & Jiao [19] showed the relevance of proximity to certain
attractive areas such as shopping centres or city centres.
From the previous literature, it appears that the study by Møller et al. [28] considered
more sub-parameters, followed by Bai & Jiao [19] and Gossling [18] with 14, 13, and 11 sub-
parameters, respectively. However, the categories developed did not fully include the
identified criteria (e.g., territorial planning, security, economic, social, and environmental).
Bai & Jiao [19] focused mainly on the social and urban planning and transport aspects. In
contrast, Gossling [18] debated safety, and Møller et al. [28] used the environmental and
economic facets. Gitelman et al. [26] considered four of the five key criteria identified and
only left out the social aspects. Overall, the literature analysis showed particular attention
to KSPs related to the aspects of urban planning and transport (42), environmental (41),
safety (31), social (21), and economic (10).
Nevertheless, despite this high-quality literature, no study proposed a cohesive
method to identify and select the most promising set of KSPs. This study covers this gap.Sustainability 2021, 13, 9226 5 of 22
Table 1. Summary of potential parameters for the evaluation of the performance of e-PMVs.
Parameter
Economic Environmental Safety Social Urban and Transport Planning
Source #KC #P #sP Selection
UC CR ES OE C PS VF TR CP IPL I TI AT UCF
Abduljabbar et al., 2021 [13] 4 5 5 • • • • • L
Alessio, 2019 [29] 3 4 4 • • • • L
Badeau et al., 2019 [16] 1 1 1 • L
Bai & Jiao, 2020 [19] 3 6 13 • • • • • • M
Cao et al., 2021 [20] 3 4 5 • • • • L
Caspi et al., 2020 [27] 2 3 3 • • • M
Christoforou et al., 2021 [30] 3 4 6 • • • • L
Clewlow et al., 2018 [17] 2 2 2 • • C
Gitelman et al., 2020 [26] 4 4 4 • • • • M
Gossling, 2020 [18] 3 5 11 • • • • • L
Hawa et al., 2021 [31] 2 6 6 • • • • • • L
Hollingsworth et al., 2019 [5] 1 2 3 • • C
Hosseinzadeh et al., 2021 [23] 2 4 8 • • • • M
Hwang, 2010 [15] 1 2 2 • • L
International Transport Forum,
2 3 4 • • • L
2020 [32]
James et al., 2019 [24] 2 5 6 • • • • • L
Kopplin et al., 2021 [33] 3 4 5 • • • • L
Møller et al., 2020 [28] 3 8 14 • • • • • • • L
Nocerino et al., 2016 [34] 3 4 1 • • • • L
Piazza et al., 2021 [35] 3 4 4 • • • • M
Reck et al., 2021 [22] 2 4 7 • • • • L
Scarpinella, 2020 [21] 1 1 2 • L
Schellong et al., 2019 [25] 3 4 4 • • • • C
Siow et al., 2020 [36] 2 3 3 • • • L
Smith et al., 2018 [14] 2 2 2 • • C
This is a representative but not a comprehensive list of references. #KC, number of key criteria; #P, number of parameters; #sP, number of sub-parameters; UC, user cost; CR, CO2 release; ES, energy-saving OE,
other emissions; C, crashes; PS, perception of security; VF, vehicle features; TR, traffic rules; CP, characteristics of the population; IP, impact on people’s lives; I, infrastructure; TI, transport impact; AT, attractors;
UF, urban centre features; L, literature; M, models and/or methods; C, corporate inquiries.Sustainability 2021, 13, 9226 6 of 22
3. Methodology
The cohesive method for identifying and selecting a set of KSPs is organised into three
main phases (and related steps) according to the scheme in Figure 1. Moreover, for the sake
Sustainability 2021, 13, x FOR PEER REVIEW 6 of 22
of synthesis, criteria, parameters, and sub-parameters will all be referred to as parameters
(or KSPs) later. Each phase (and related steps) is described below.
Figure 1. Conceptual model of the method.
3.1. Preliminary Phase
3.1. Preliminary Phase
Phase A sets some preliminary
Phase A sets some preliminary tasks
tasks to
to frame
frame both
both KSPs
KSPs and
and their
their related
related properties.
properties.
It runs according to steps (1) and
It runs according to steps (1) and (2). (2).
Step
Step (1)
(1) aims
aims toto collect
collect aa long
long list
list of
of the
the potential
potential KPSs
KPSs for
for e-PMVs.
e-PMVs. Such
Such KSPs
KSPs can
can be
be
expanded into more specific sub-parameters to be able to consider each
expanded into more specific sub-parameters to be able to consider each of them sepa-of them separately.
In this method, the relevant literature is considered. It identifies the more comprehensive
rately. In this method, the relevant literature is considered. It identifies the more compre-
initial source of potential KSPs from scientific databases and reports, as shown in Table 1.
hensive initial source of potential KSPs from scientific databases and reports, as shown in
Step (2) aims to define the key properties of KSPs. To perform this task, two manage-
Table 1.
able components were considered according to [11,12]: (1) the methodological component
Step (2) aims to define the key properties of KSPs. To perform this task, two manage-
of KSPs and (2) the sustainability component. The components represent relevant proper-
able components were considered according to [11,12]: (1) the methodological component
ties of the parameters. However, they could be too broad to cover the selection of KSPs.
of KSPs and (2) the sustainability component. The components represent relevant proper-
Therefore, an additional decomposition into more measurable and accurate related at-
ties of the parameters. However, they could be too broad to cover the selection of KSPs.
Therefore, an additional decomposition into more measurable and accurate related attrib-
utes was required. The literature suggested several attributes for the methodological com-
ponent, and the main ones were taken from [11,12]:
• Measurability: the possibility of evaluating a KSP in a theoretical and reliable way.
• Ease of availability: the opportunity to easily collecting reliable parameter data at aSustainability 2021, 13, 9226 7 of 22
tributes was required. The literature suggested several attributes for the methodological
component, and the main ones were taken from [11,12]:
• Measurability: the possibility of evaluating a KSP in a theoretical and reliable way.
• Ease of availability: the opportunity to easily collecting reliable parameter data at a
reasonable cost.
• Speed of availability: the option to regularly update the derived or calculated parame-
ter data to minimise the time elapsed between two consecutive measurements.
• Interpretability: the unambiguous output should report parameters that all interested
parties easily understand.
Since e-PMVs are believed to be a sustainable mode of transport, the methodological
component is accompanied by the sustainability component, according to the concept
proposed by the Brundtland Commission [37]. The concept of sustainability is very broad
and linked to the compatibility between the development of economic activities and
environmental protection. Hence, four attributes for the sustainability component were
considered in this study, which also included some of the key criteria that clustered
parameters in Table 1, they were:
• Social, a sustainable e-PMV system should contribute to social and spatial equity,
meeting the basic mobility and accessibility needs of all social, economic, and geo-
graphical groups.
• Environmental, a sustainable e-PMV system should minimise the consumption of
natural resources, actively reduce transport-related emissions and waste.
• Economic, a sustainable e-PMV system should contribute to economic growth and
support market mechanisms that reflect the true social, economic, and environmental
costs of activities.
• Safety, a sustainable e-PMV system should be designed and managed to minimise the
risks to health, and the number, severity, and risks of road crashes.
Although all attributes are general, each of them may have a specific level of impor-
tance because they vary to reflect different viewpoints.
3.2. Participation Phase
Phase B identifies a panel of stakeholders and takes their opinions about components
and attributes and their parameters; it runs according to steps (3) and (4). Moreover, for
the sake of synthesis, components and attributes will all be referred to as items in what
follows, unless they were specified.
Defining the relevance of parameters is not a trivial task; it must consider specific
requirements, issues of quality, etc. Therefore, the involvement of experts in the perceived
evaluation of parameters is considered a significant phase, which characterises Step (3).
Academics, practitioners and aware e-PMV users are here considered “experts”. Academics
can provide a thorough and suitable evaluation of parameters related to components and
attributes at a high level. Practitioners can provide a daily operational judgement from a
managerial perspective. Aware e-PMV users can provide an applied evaluation from their
viewpoint, which completes the previous theoretical and managerial ones, thus avoiding
the common wide gap between users, practitioners, and academics [38]. The involvement
of diverse experts is strongly recommended because the different sensitivities, training, and
heterogeneous expertise could lead to a different evaluation of components and attributes
of each parameter. Since these perceptions can vary due to the specific knowledge on
KSPs, and, thus, provide different opinions towards components and attributes, a weighing
process is required to derive the relative importance. Hence, weights of importance are
attached to components and attributes according to objective methods. Indeed, weights can
be directly attached by questioning experts on preferences for a single item. However, this
approach might be flawed since humans have difficulties processing relevant information
about all items into stable weights, especially when many items are evaluated, e.g., [11,39].Sustainability 2021, 13, 9226 8 of 22
Several authors have proposed approaches to weighting items, e.g., [40–42]. In this
study, a multi-criteria decision analysis (MCDA) is considered [43–45]. It has the advantage
of simultaneously considering multiple aspects (e.g., criteria, goals, actions), both qualita-
tive and quantitative, and enables us to highlight the different perspectives of stakeholders.
Using known information (e.g., goals) and judgments expressed in numerical values by
the decision-maker, the MCDA determines a compromising solution [46]. The MCDA
can be performed by different approaches, each one with different pros and cons. This
study chooses the analytic hierarchy process (AHP) due to its positive mitigation of bias
risks [47–49]. It helps to model cases of uncertainty and risk because it can derive and com-
bine multidimensional scales—where measures ordinarily do not exist—in a single scale of
priority [50,51]. Furthermore, it provides a mathematical foundation (e.g., eigenvectors)
that establishes weights from each judgment, arriving at objective evaluations.
The AHP consists of a pairwise comparison of items that generates a stable weight
assignment. Moreover, in order to reduce possible biases in a decision-making process,
the AHP generates a ratio scale for each set of pairwise comparisons to evaluate the
consistency/inconsistency of the judgements provided. To do so, the AHP raises subjective
comparisons and then aggregates the results into objective weights, solving the issue of
subjectivity of the expert involved. Indeed, it resolves conflict or disagreements among
groups that may have incompatible goals or positions [52–56]. The application of the AHP
itself and all its properties eliminate excessive subjectivity because it translates subjective
judgments into objective weights. The AHP results can be useful considering the different
facets with multiple measurements that characterise the parameters of e-PMVs.
Expert involvement can consist of various approaches. According to Step (4), a survey
is proposed to involve the largest number of interested experts in this study. Among
the several survey types available, the choice of a web survey is suggested because of
several advantages that make this procedure well-practicable [57]. In detail, the web survey
(1) can elicit information at a low cost; (2) rapidly reach experts; (3) be directly compiled
online, thus removing the choice to print the questionnaire; and (4) returns data ready to
be processed. Moreover, the web surveys are non-intrusive, and the participation is free
and without external pressure [57,58]. The use of a traditional e-mail survey would be
an interesting choice. Indeed, it could be assumed that a file can be saved on a computer
or in printed form, and the respondent does not necessarily need to be online to answer.
However, the previous advantages suggest adopting a web survey. In addition, during the
COVID-19 pandemic, web surveys were one of few applicable tools.
The web survey is organised in two sections and involves the experts twice. The survey
has two chosen components (i.e., methodological and sustainability), and experts evaluated
which one was more relevant and by how much (e.g., twice as much). Similarly, experts
had to indicate an evaluation among the four attributes of each component. Secondly, a
matrix containing all parameters and attributes (of both the components) is provided, and
experts had to rate each parameter against each attribute.
3.3. Data Processing and Reporting
Phase C processes data collected among experts and returns the KPSs ranked with
respect to the best values. It runs according to steps (5) and (6) as follows.
Step (5) processes data via two methods. The former includes the application of AHP
to translate subjective judgments into objective weights. The second aggregates weights
and outcome marks to compute the performance of each KSP.
More precisely, the AHP method consists of mathematical processing, which is organ-
ised into several stages. First, a matrix of pairwise comparisons is built for each expert
while comparing items. In this matrix, rows and columns report items. Each entry is the
weight assigned to an item with respect to one another. Second, starting from this matrix, a
vector of weights for each item is first computed and next normalised. Third, since some
inconsistency of judgment can be observed, a consistency test is performed to verify the
reliability of judgments of each matrix.Sustainability 2021, 13, 9226 9 of 22
More precisely, let:
• J be the set of experts involved and j an individual expert;
• P be the set of items and p an individual item, i.e., a component or an attribute;
• wp /wq be the numerical judgment of the pairwise comparison between item p ∈ P
and q ∈ P, respectively (for instance, wp /wq = 2/1 means item p ∈ P is twice more
important than item q ∈ P; thus wq /wp = 12 means the opposite case);
• Wp be the overall unnormalised weight of item p ∈ P, and wp is its normalised value;
• CI be the consistency index, which expresses the consistency/inconsistency of pairwise
comparisons. Precisely, the CI measures whether the judgments of the participant are
logical and consistent with the choices made throughout the survey;
• λmax be the maximum eigenvalue needed to compute the measure of consistency;
• RI be the random consistency index, a tabulated CI function of the maximum number
of items.
The computation of weights and the consistency check of the judgments were per-
formed according to the following four-step algorithm:
For each expert j ∈ J:
(1) Build the matrix of pairwise comparisons for each item, as shown in Table 2.
(2) Compute Wp and wp from this matrix. More precisely, among the several approaches,
the vector of weight Wp is computed as follows:
q
n
Wp = n
∏q=1 wp /wq ∀p ∈ P (1)
Then, Wp is normalised through the average arithmetic method as follows:
Wp
wp = n (2)
∑ p =1 W p
(3) Check the consistency.
Table 2. Numerical judgment of the pairwise comparison between items.
1 2 ... q ... n
1 1 w1 /w2 ... w1 /wq ... w1 /wn
2 w2 /w1 1 ... w2 /wq ... w2 /wn
... ... ... ... ... ... ...
p wp /w1 wp /w2 ... wp /wq ... wp /wn
... ... ... ... ... 1 ...
n wn /w1 wn /w2 ... wn /wq ... 1
First, λmax is computed as follows:
" w #
p
∑nq=1 wq ∗w p
∑np=1 wp
λmax = (3)
n
Second, it should be verified that λmax ≥ n
Third, CI is calculated as follows:
(λmax − n)
CI = (4)
( n − 1)
The evaluations are perfectly consistent if λmax = n, thus CI = 0.
Fourth, the RI is taken from Table 3 according to the number of items considered.Sustainability 2021, 13, 9226 10 of 22
Table 3. Random Consistency Index.
n 1 2 3 4 5 6 7 8 9 10
RI 0 0 0.52 0.89 1.11 1.25 1.35 1.40 1.45 1.49
Finally, the consistency ratio is computed as follows:
CI
CR = (5)
RI
The AHP considers the pairwise comparisons consistent when CR < 0.1 (10%); oth-
erwise, the expert may be re-involved to revise his/her evaluations. More details of the
application of AHP are provided in [48–50].
Once AHP returned weights, an aggregate score (denoted by SI) is computed for each
parameter. This score is calculated by a simple additive weighting approach that combines
the average weight of components and attributes and the outcome marks of each parameter.
More precisely, let:
• I be the set of KSPs and i an individual KSP;
• M be the set of attributes of the methodological component and m be an individual
attribute;
• S be the set of attributes of the sustainability component and s be an individual
attribute;
• w1j be the weight of the methodological component returned by (2), according to the
judgement of expert j ∈ J;
• w2j be the weight of the sustainability component returned by (2), according to the
judgement of expert j ∈ J;
• w1jm be the weight of attribute m ∈ M returned by (2), according to the evaluation of
expert j ∈ J;
• w2js be the weight of attribute s ∈ S returned by (2), according to the evaluation of
expert j ∈ J;
• G1 be the average weight of the methodological component;
• G2 be the average weight of the sustainability component;
• w1m be the average weight of attribute m ∈ M;
• w2s be the average weight of attribute s ∈ S;
• V im be the average mark of parameter i ∈ I for attribute m ∈ M;
• V is be the average mark of parameter i ∈ I for attribute s ∈ S;
• Vijm be the mark of parameter i ∈ I for attribute m ∈ M according to the evaluation of
expert j ∈ J;
• Vijs be the mark of parameter i ∈ I for attribute s ∈ S according to the evaluation of
expert j ∈ J.
The computation of SI is performed according to the following four steps algorithm.
For each parameter i ∈ I:
(1) Compute G1 and G2 as follows:
J
∑ j=1 w1j
G1 = (6)
J
J
∑ j=1 w2j
G2 = (7)
J
(2) Compute w1m and w2s as follows:
J
∑ j=1 w1jm
w1m = ∀m ∈ M (8)
JSustainability 2021, 13, 9226 11 of 22
J
∑ j=1 w2js
w2s = ∀s ∈ S (9)
J
1. Compute Vim and Vis as follows:
J Vijm
V im = ∑ J
∀m∈M ∀ i∈I (10)
j =1
J Vijs
V is = ∑ J
∀ s∈S ∀ i∈I (11)
j =1
(4) Compute SIi as follows:
! !
SIi = G1 ∑ w1m ∗ V im + G2 ∑ w2s ∗ V is ∀ i∈I (12)
meM seS
According to step (6), KSPs are in decreasing order based on their estimated SIi .
The first top KSPs are selected to be the most appropriate and coherent to measure the
performance of e-PMVs.
4. Results
4.1. Preliminary Phase: The Long List of Parameters
According to Step (1) of phase A, Table 1 summarised the more comprehensive list
of parameters to evaluate the performance of e-PMVs. Next, a grouping of similar sub-
parameters was carried out, which were clustered based on the original key criteria. A total
of 54 unique sub-parameters was considered, which was not derived from a specific source.
More specific characteristics of sub-parameters have been inserted in the latest column of
sub-sub-parameters reported in Appendix A. Next, components and attributes pointed out
in Step (2) represented a data input in the selection process.
4.2. Participation Phase: The Survey
According to steps (3) and (4), a web-based survey among experts was carried out
to obtain their judgements. The selection of experts considered the national scale of the
research and the multi-perspective of the topic. Consequently, experts are Italian academics,
practitioners, and aware e-PMV users. They were identified according to three sources.
Academics were selected by Scopus for keywords (i.e., e-PMVs) and country. Thanks to
the Google and LinkedIn search engines, practitioners were identified both in research and
in their specific skills. Next, a random sampling criterion was followed. Aware e-PMVs
users were selected through national associations (i.e., Club Monopattini Italiani and AIIT).
A total of 103 experts was selected from January to February 2020.
The survey was developed as a web questionnaire through a free platform. Although
several platforms for the survey planning and submission exist (e.g., Survio, Google form,
Fyrebox, etc.), many have shortcomings in terms of functionalities, i.e., manage matrices
and pairwise comparisons, unlimited program questions, set interfaces, and data export.
According to the required functionalities, we adopted the “SondaggioOnline” platform.
Indeed, the free-access platform enabled us to build comparisons in pairs, manage a
number of questions, and export the data in excel in order to facilitate processing. However,
the number of responses was limited in the free version (i.e., 350 responses in one month
whereas the two questionnaires required 13 and 432 answers per expert, respectively), so a
“personal” license was bought.
The survey was organised into two parts, which represented a wave of data collection.
The first part of the survey was carried out between March and April 2020, and experts were
required to evaluate each item according to an adjusted version of the Saaty’s Semantic
Scale [47–49] on a nine-point scale (Table 4). An example of the first part of the survey wasSustainability 2021, 13, x FOR PEER REVIEW 12 of 22
Sustainability 2021, 13, x FOR PEER REVIEW 12 of 22
Sustainability 2021, 13, 9226 Semantic Scale [47–49] on a nine-point scale (Table 4). An example of the first part of the
12 of 22
Semantic Scale [47–49] on a nine-point scale (Table 4). An example of the first part of the
survey was shown in Figure 2 for the evaluations of components, and the same logic was
survey was shown in Figure 2 for the evaluations of components, and the same logic was
applied to the evaluation of the related attributes. Questions were formulated to collect
applied to the evaluation of the related attributes. Questions were formulated to collect
data properly for the AHP. The first part was completed by 38.8% of the panel of experts.
data
shownproperly
in Figure for the
2 forAHP. The first part
the evaluations of was completedand
components, by the
38.8%same of the
logicpanel
wasof experts.
applied to
the evaluation of the related attributes. Questions
Table 4. The adjusted AHP rating scale adapted from [12]. were formulated to collect data properly
Table 4. AHP.
for the The adjusted AHP
The first rating
part wasscale adaptedby
completed from [12].of the panel of experts.
38.8%
Intensity of Im-
Intensity of Im- Definition Description
Tableportance
4. The adjusted AHP rating Definition
scale adapted from [12]. Description
portance
The two items that are compared are of
1 of
Intensity Equal importance The two items that are compared are of
1 EqualDefinition
importance equalDescription
importance
Importance equal importance
Experience and judgment moderately
3 Moderate importance Experience and judgment
The two items moderately
that are compared
31 Moderate importance
Equal importance favour one item over anotherare of
favour one item
equal over another
importance
Essential or strong Experience and judgment
Experience and judgment favour one item
moderately
53 Essential
Moderateor strong
importance Experience and judgment favour one item
5 importance rather
favour than
one itemanother
over another
importance rather than another
Essential or strong Experience
Experience andand judgmentdefinitely
judgment favour one item
favour
75 Very strong importance Experience andrather
importance judgment
than definitely favour
another
7 Very strong importance one item over another
oneand
Experience itemjudgment
over another
definitely favour
7 Very strong importance Experience and judgment definitely favour
9 Extreme importance Experience and onejudgment
item over another
definitely favour
9 Extreme importance oneand
Experience item over another
9 Extreme importance one itemjudgment definitely favour
over another
In some cases, oneexperience and judgment
item over another
Intermediate values In some cases,
In some experience
cases, experience and
and judgment
judgment
2, 4, 6, 8 Intermediate values
Intermediate values could be better explained through
2,2,4,4, 6,
6, 8 between the two adjacent could be be
could better explained
better explainedthrough
through
between
betweenthethetwotwoadjacent
adjacent intermediate values
intermediatevalues
intermediate values
Figure 2. Part 1. Example of the questionnaire for pairwise comparisons of components.
Part1.1.Example
Figure2.2.Part
Figure Exampleofofthe
thequestionnaire
questionnairefor
forpairwise
pairwisecomparisons
comparisonsof
ofcomponents.
components.
The
Thesecond
secondpart
partofofthe
thesurvey
surveywaswascarried
carriedoutoutininone
onewave
waveof ofdata
datacollection
collectionbetween
between
The second part of the survey was carried out in one wave of data collection between
March
March and
and April
April 2020.
2020. Experts
Expertswere required
were requiredto evaluate
to the long
evaluate the list of
long parameters
list of cor-
parameters
March and April 2020. Experts were required to evaluate the long list of parameters cor-
related to
correlatedeach attribute
to each of
attributeeach component.
of each The
component. judgment was
The judgment expressed through
was expressed a value
through
related to each attribute of each component. The judgment was expressed through a valuea
between 1 (the worst)
value between and 10and
1 (the worst) (the10best).
(the An example
best). An exampleof the of
second part of
the second theofsurvey
part was
the survey
between 1 (the worst) and 10 (the best). An example of the second part of the survey was
shown in Figure 3. The participation rate in the second part was 10.7%
was shown in Figure 3. The participation rate in the second part was 10.7% of the panel of the panel of
shown in Figure 3. The participation rate in the second part was 10.7% of the panel of
experts.
of experts.
experts.
Figure
Figure3. Part
Part2. Example
Exampleof the
thequestionnaire
questionnairefor
forthe
theevaluation
evaluationof
ofthe
thelong
longlist
listof
ofKSPs.
Figure 3.3.Part 2.2.Example ofofthe questionnaire for the evaluation of the long list of KSPs.
KSPs.
AAsummary
summaryofofthe theinformation
information about participation
about participation phases is reported
phases in Table
is reported 5. In-5.
in Table
A summary of the information about participation phases is reported in Table 5. In-
terestingly, practitioners
Interestingly, practitionersactively participated
actively in in
participated thethe
first
firstpart
partofofthe
thesurvey,
survey,unlike
unlikethe
the
terestingly, practitioners actively participated in the first part of the survey, unlike the
second
secondpart
partof
ofparameters
parametersevaluations
evaluationswhere
whereacademics
academicswere weremost
mostnumerous
numerousdespite
despitethe
the
second part of parameters evaluations where academics were most numerous despite the
lownumber.
low number.
low number.Sustainability 2021, 13, 9226 13 of 22
Table 5. Expert panel composition and participation rate in the web survey.
Experts Involved First Part Second Part
Academics 15 8 (53.3%) 6 (40.0%)
Practitioners 69 25 (36.2%) 4 (5.7%)
Users 19 7 (36.8%) 1 (5.2%)
Total 103 40 (38.8%) 11 (10.6%)
4.3. Data Processing and Reporting: The Ranking of Parameters
According to Step (5) of the method, the AHP was applied to calculate the weights
of components and related attributes, which summarised each expert’s preferences. The
weights of each item were computed according to Equations (1) and (2), while consistency
was evaluated by eqns. from (3) to (5). The weights were reported in an aggregate manner
owing to the low number of experts interviewed. A synthesis of overall weights computed
by AHP is shown in Table 6. It reports the standard deviation and the coefficient of
variation. Table 6 is self-explanatory: the weights show the differences obtained from
experts’ opinions with respect to the methodological and sustainability components and
related attributes, respectively.
Table 6. Overall weight for the three pairwise comparisons of the questionnaire.
Standard Coefficient of
Components/Attributes Mean Weight
Deviation Variation
Sustainability component 0.530 0.135 0.253
Safety 0.282 0.026 0.094
Environmental 0.268 0.023 0.088
Social 0.243 0.026 0.107
Economic 0.207 0.027 0.131
Methodological component 0.470 0.135 0.288
Easy availability 0.260 0.029 0.111
Measurability 0.250 0.030 0.103
Speed availability 0.245 0.033 0.151
Interpretability 0.245 0.042 0.166
As shown in Table 6, experts gave a slightly higher relevance to the sustainability
component (0.53) than the methodological one (0.47). Moreover, the quality of results is
demonstrated in Table 6 by the low values returned by the coefficient of variation close to
zero (0.253; 0.288).
On the one hand, no relevant difference was reported in the three attributes of the
methodological component because the attributes reported similar weights (25%). However,
the results of the experts’ judgment identified the ease of availability (26%) of parameters
as the most relevant attribute to consider when evaluating the methodological component.
On the other hand, there was a difference in the weight between each attribute of the
sustainability component. Practitioners and academics agreed on the primary relevance of
the safety (28.2%) and environmental (26.8%) attributes. This reflects the previous literature
results (i.e., Table 1), which are defined as primary categories of safety in terms of crash
severity, road safety, conflicts on driving behaviour; meanwhile, the environmental facets
include a sustainable modal shift and LCA. The interpretation of the resulting sustainability
was very practical. Subsequently, less weight was attributed by experts to social (24.3%)
and economic (20.7%) attributes. These results were partially expected for social instead
of economic sustainability, usually very relevant for practitioners and particularly for
public administrators.
Once the weights of components and related attributes were obtained, and marks
were given to each parameter against each attribute, the SI was computed for each KSPSustainability 2021, 13, x FOR PEER REVIEW 14 of 22
Sustainability 2021, 13, 9226 14 of 22
Once the weights of components and related attributes were obtained, and marks
were given to each parameter against each attribute, the SI was computed for each KSP
bybyEquations
equations(6)
(6)toto(12).
(12).Next,
Next,according
accordingtotoStepStep(6)
(6)ofofthe
themethod,
method,eacheachKSP KSPwas
wasranked
ranked
inindecreasing
decreasing order. Results are shown in Figure 4. It reports the list of top 15KSPs
order. Results are shown in Figure 4. It reports the list of top 15 KSPsthat
that
correspond
correspondtotothe
thefirst
firstquartile
quartileofofthe
therank-ordering
rank-orderingdistribution
distributionofofallallKSPs.
KSPs.AAcomplete
complete
list of rank-ordering is reported in Appendix B.
list of rank-ordering is reported in Appendix B.
Figure4.4.The
Figure Thetop
topKSPs.
KSPs.
5.5.Discussions
Discussions
This
Thiscohesive
cohesivemethod
methodrepresents
representsthethefirst
firstresearch
researchattempt
attempttotoidentify
identifyandandselect
selectthe
the
most promising KSPs regarding e-PMV performance. Consequently,
most promising KSPs regarding e-PMV performance. Consequently, these findings these findings present
pre-
opportunities
sent opportunitiesand challenges
and challenges for academics,
for academics, practitioners, and
practitioners, andpublic
publicadministrators:
administrators:
they can be used as a starting point to evaluate and implement
they can be used as a starting point to evaluate and implement existing strategies existing strategies
or or
ad-
address
dress new ones capable of positively impacting the urban transport systems, based onon
new ones capable of positively impacting the urban transport systems, based the
the measurement
measurement of of KSPs.
KSPs. However,
However, thethe results
results obtained
obtained according
according to the
to the three
three phases
phases de-
described in Section 4 deserve interesting considerations.
scribed in Section 4 deserve interesting considerations.
First, it is worth noting that the long list of KSPs (Appendix A) represents an original
First, it is worth noting that the long list of KSPs (Appendix A) represents an original
element of this study (phase A). Nevertheless, the construction of the long list of parameters
element of this study (phase A). Nevertheless, the construction of the long list of parame-
using an indirect method (i.e., literature review) is a starting point for theoretical and
ters using an indirect method (i.e., literature review) is a starting point for theoretical and
applied research.
applied research.
Second, Table 5 (phase B) provides the summary results of the participation rate in
Second, Table 5 (phase B) provides the summary results of the participation rate in
the survey, and it showed very different levels of response among experts in the two parts.
the survey, and it showed very different levels of response among experts in the two parts.
There was a response of 53% of academics and 37% of practitioners and users in the first
There was a response of 53% of academics and 37% of practitioners and users in the first
part. In the second part, the response rate of non-academics dropped by about 31% instead
part. In the second part, the response rate of non-academics dropped by about 31% instead
of 13% of academics. This drop can be explained by the different response times required
of 13% of academics. This drop can be explained by the different response times required
in the two interview parts and which affects the performance of the web surveys. From
in the10two
about min interview parts
of the first, theand which
second affects
step of thethequestionnaire
performance could
of the take
web up surveys. From
to 60 min.
about 10 min of the first, the second step of the questionnaire could
Therefore, the level of participation by type of expert changes according to the time that take up to 60 min.
Therefore,
can be spentthe on level of participation by type of expert changes according to the time that
the research.
can Third,
be spent on the research.
Figure 4 (phase C) shows that all five key criteria are represented in this list by
a different number of parameters. It is worth noting that just one economic parameter is
included. This suggests a minor (and unexpected) attention to economic facets typical inSustainability 2021, 13, x FOR PEER REVIEW 15 of 22
Sustainability 2021, 13, 9226
Third, Figure 4 (phase C) shows that all five key criteria are represented in this list
15 of 22
by a different number of parameters. It is worth noting that just one economic parameter
is included. This suggests a minor (and unexpected) attention to economic facets typical
in transport investment. Perhaps, the little amount of money involved to acquire and man-
transport
age e-PMVs investment.
might explainPerhaps,
thesethe little amount
results. of money
Furthermore, the involved to acquire
most promising set and manage
of KSPs has
e-PMVs
high mightto
relevance explain
urban andthesetransport
results. planning
Furthermore, the most
and safety. Urbanpromising set of KSPs
and transport has
planning
high relevance to urban and transport planning and safety. Urban
parameters are six of fifteen of the categories, and most focused on infrastructure elementsand transport planning
parameters
such are sixstations,
as charging of fifteennumber
of the categories,
of rentalsand per most
time focused
slot, andonthe
infrastructure
presence ofelements
priority
such as charging stations, number of rentals per
lanes for e-PMVs on the road. There were five safety parameters that time slot, and the presence
generallyof focused
priority
lanes
on for e-PMVs
traffic rules foron the road.
speed There were
and crashes, five safety
including parameters
the number that generally
of crashes focused on
and injuries.
traffic rules for
Finally, speed and
to further crashes, including
investigate the relevance the number of crashes
of the main and injuries.
parameters identified from
Finally, tocohesive
the proposed further investigate
method, we theevaluated
relevance ifofthethe15
maintopparameters
ranked KSPs identified from the
are considered
equally important in the literature. Consequently, we generate a new ranking of equally
proposed cohesive method, we evaluated if the 15 top ranked KSPs are considered 15 top
important
KSPs through in the literature.
a citation score,Consequently,
i.e., the number weofgenerate
occurrencesa new(or ranking of 15
repetitions) of top KSPs
a param-
through a citation score, i.e., the number of occurrences (or repetitions)
eter in the literature considered (Table 1). Figure 5 shows the differences between the two of a parameter in
the literature considered (Table 1). Figure 5 shows the differences between
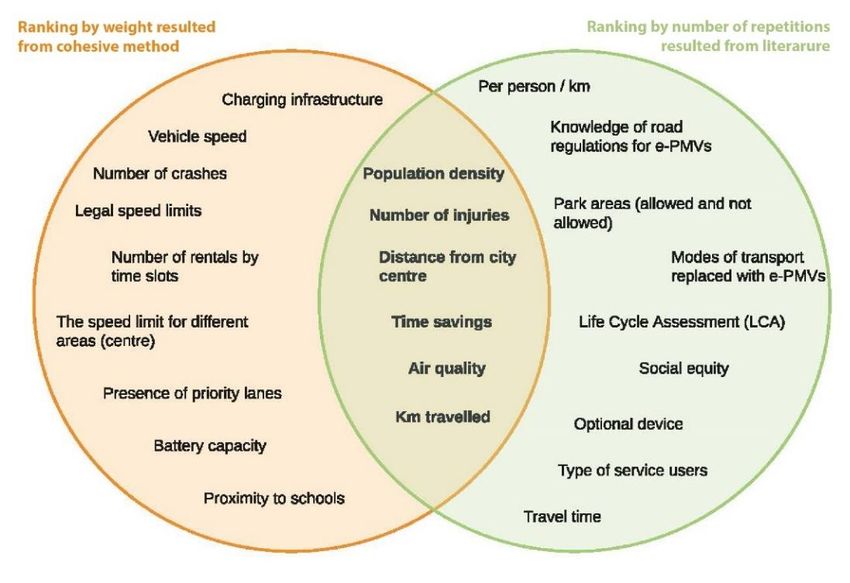
different rankings. Specifically, the literature mainly utilised environmental parameters, the two different
rankings.
unlike Specifically,
the most promising the literature
parameters mainly
of Urban utilised
and environmental
transport planning parameters, unlike
and safety re-
the most promising parameters of Urban and transport
trieved from the cohesive method. Moreover, commonalities were also observed amongplanning and safety retrieved
from the cohesive method. Moreover, commonalities were also observed among the top-
the top-15 KSP lists: population density and distance from the city centre (Urban and
15 KSP lists: population density and distance from the city centre (Urban and transport
transport planning), air quality (Environmental), time savings (Economic), km travelled
planning), air quality (Environmental), time savings (Economic), km travelled (Social), and
(Social), and the number of injuries (Safety). However, the previous studies (see Table 1)
the number of injuries (Safety). However, the previous studies (see Table 1) included an
included an average of 1–2 shared top KSPs, demonstrating the originality of the results
average of 1–2 shared top KSPs, demonstrating the originality of the results obtained in
obtained in this study. The partial exception is the study of Bai & Jiao [20], which have
this study. The partial exception is the study of Bai & Jiao [20], which have identified six of
identified six of fifteen top sub-parameters belonging mainly to the key criteria of Urban
fifteen top sub-parameters belonging mainly to the key criteria of Urban and Transport
and Transport planning. Nevertheless, this difference might be observed because many
planning. Nevertheless, this difference might be observed because many studies start
studies start from parameters already in use in current research. In contrast, the proposed
from parameters already in use in current research. In contrast, the proposed method
method is an objective alternative that involves other subjects who operate with different
is an objective alternative that involves other subjects who operate with different skills
skills than academics.
than academics.
Figure 5. Comparison between the top 15 KSPs provided by 2 alternative methods.
Figure 5. Comparison between the top 15 KSPs provided by 2 alternative methods.
6. Conclusions
Owing to the recent invasion of electric-powered personal mobility vehicles (e-PMVs)
in many cities worldwide, understanding how to evaluate and monitor their performance
is crucial. Therefore, it is essential to identify key sustainable parameters (KSPs) to inform
on the excellences and criticalities of e-PMVs. Although studies on e-PMVs are constantly
growing, and this field of study is still experimental, previous research has focused largely
on models and methods to measure and manage some KSPs. Conversely, it did not
investigate objective methods for identifying and selecting the top KSPs.Sustainability 2021, 13, 9226 16 of 22
To address these gaps, this study contributed to the growing literature on e-PMVs in a
threefold manner:
• Identification of a long (and to-date mostly complete) list of KSPs organised into key
criteria, parameters and sub-parameters, which affect the performance of e-PMVs.
• Proposal of a new cohesive approach that identified top KSPs from a long list and
pointed out the most promising. More precisely, this approach applied a participatory
approach and an objective method of weighting and ranking each KSP. The former
approach used data collected by an Italian web survey involving academics, practi-
tioners, and aware e-PMV users. The latter approach applied both an AHP, which
processed data on the relevance of components and related attributes and a method
that computed a score for each KSP. Hence, subjective data (i.e., judgments from
experts) are managed to achieve objective conclusions (i.e., the score of each KSP).
• Comparison of outcomes obtained the cohesive approach and by the number of
occurrences of each parameter gathered from the literature. A set of six common KSPs
was isolated.
• The relevant implications of this study are:
• The identification of the top KSPs may help stakeholders collect e-PMV data in detail
and for benchmark purposes.
• The high degree of applicability of the cohesive approach is not strictly linked to the
KSPs of e-PMVs but can be generalised for other transportation modes.
• The opportunity to assess e-PMVs among cities according to a common set of KSPs.
To the best of the authors’ knowledge, this is the first study that provided a set of
KSPs to monitor the performances of e-PMVs according to an objective method.
To conclude, this study presents some shortcomings that raise issues for future re-
search agendas.
First, the long list of KSPs was collected from an international literature review, but the
selection of experts is national (Italian). Therefore, the study has a national viewpoint and
is small in scale compared to the large number of cities characterised by the use of e-PMVs.
Consequently, the study has not considered the possible tradeoff between the specificity of
the local and general conditions or the comparability of the selected parameters. However,
this limitation could influence the overall results and not the methodology, which is quite
generalisable and driven by specific and well-recognised literature reviews. Indeed, the
methodology presented here is flexible and applicable to any urban context. The panel of
experts considered is decisive, as it is reasonable to think that each expert might provide
an assessment that implicitly includes the country in which it operates. For instance, in
Italy, where e-PMVs are an emerging transport mode, the most promising KSP obtained
by the cohesive method is charging infrastructure; conversely, in countries where this
transport mode is consolidated, it could have a different parameter ranking. Moreover,
the heterogeneity of countries in their level of development may affect the input data
of some parameters. For instance, the setting of a level of service of a spatial parameter
(e.g., distance from the city centre) may change: developed countries might adopt a level
of service stricter than the developing ones (e.g., 400 m vs. 800 m). However, these
differences do not impede measuring the same KSP, even if the benchmark may be biased.
Consequently, the long list constitutes an initial milestone, and future research should
improve it through interviews with experts from many countries to effectively verify if and
how local conditions could affect the choice of KSPs.
Second, the lower data of participation rate in the second part of the survey showed a
shortcoming of the method: the outcome mark of each KSP against each attribute consists
of a very large number of judgments (i.e., 432 values), which often frighten the expert.
Indeed, it could represent an impediment to reaching a more shared evaluation. Despite
the participation rate achieved from this study not being too different from web-based
surveys [59], future perspectives may either broaden the sample of experts or carry out
a Monte Carlo simulation on existing (and few) data. The application of a stochasticYou can also read