Unique contributions of chlorophyll and nitrogen to predict crop photosynthetic capacity from leaf spectroscopy
←
→
Page content transcription
If your browser does not render page correctly, please read the page content below
Journal of Experimental Botany, Vol. 72, No. 2 pp. 341–354, 2021
doi:10.1093/jxb/eraa432 Advance Access Publication 16 September 2020

RESEARCH PAPER

Unique contributions of chlorophyll and nitrogen to predict
crop photosynthetic capacity from leaf spectroscopy
Sheng Wang1,2,*, , Kaiyu Guan1,2,3,*, Zhihui Wang4, Elizabeth A. Ainsworth1,2,5,6, Ting Zheng4,
Philip A. Townsend4, Kaiyuan Li1,2, Christopher Moller5, Genghong Wu1,2 and Chongya Jiang1,2

                                                                                                                                               Downloaded from https://academic.oup.com/jxb/article/72/2/341/5906627 by guest on 10 May 2021
1
  College of Agricultural, Consumer and Environmental Sciences, University of Illinois at Urbana-Champaign, Urbana, IL 61801, USA
2
  Center for Advanced Bioenergy and Bioproducts Innovation, Institute for Sustainability, Energy, and Environment, University of Illinois at
Urbana-Champaign, Urbana, IL 61801, USA
3
  National Center for Supercomputing Applications, University of Illinois at Urbana-Champaign, Urbana, IL 61801, USA
4
  Department of Forest and Wildlife Ecology, University of Wisconsin-Madison, 1630 Linden Drive, Madison, WI 53706, USA
5
  Department of Plant Biology, University of Illinois at Urbana-Champaign, Urbana, IL 61801, USA
6
  USDA ARS Global Change and Photosynthesis Research Unit, Urbana, IL 61801, USA

* Correspondence: shengwang12@gmail.com or kaiyug@illinois.edu

Received 19 April 2020; Editorial decision 8 September 2020; Accepted 12 September 2020

Editor: Tracy Lawson, University of Essex, UK

Abstract
The photosynthetic capacity or the CO2-saturated photosynthetic rate (Vmax), chlorophyll, and nitrogen are closely
linked leaf traits that determine C4 crop photosynthesis and yield. Accurate, timely, rapid, and non-destructive ap-
proaches to predict leaf photosynthetic traits from hyperspectral reflectance are urgently needed for high-throughput
crop monitoring to ensure food and bioenergy security. Therefore, this study thoroughly evaluated the state-of-the-art
physically based radiative transfer models (RTMs), data-driven partial least squares regression (PLSR), and general-
ized PLSR (gPLSR) models to estimate leaf traits from leaf-clip hyperspectral reflectance, which was collected from
maize (Zea mays L.) bioenergy plots with diverse genotypes, growth stages, treatments with nitrogen fertilizers, and
ozone stresses in three growing seasons. The results show that leaf RTMs considering bidirectional effects can give
accurate estimates of chlorophyll content (Pearson correlation r=0.95), while gPLSR enabled retrieval of leaf nitrogen
concentration (r=0.85). Using PLSR with field measurements for training, the cross-validation indicates that Vmax can
be well predicted from spectra (r=0.81). The integration of chlorophyll content (strongly related to visible spectra) and
nitrogen concentration (linked to shortwave infrared signals) can provide better predictions of Vmax (r=0.71) than only
using either chlorophyll or nitrogen individually. This study highlights that leaf chlorophyll content and nitrogen con-
centration have key and unique contributions to Vmax prediction.

Keywords: Bioenergy crop, chlorophyll, CO2-saturated photosynthetic rate, hyperspectral leaf reflectance, maize, nitrogen,
partial least squares regression, radiative transfer model.

Published by Oxford University Press on behalf of the Society for Experimental Biology 2020.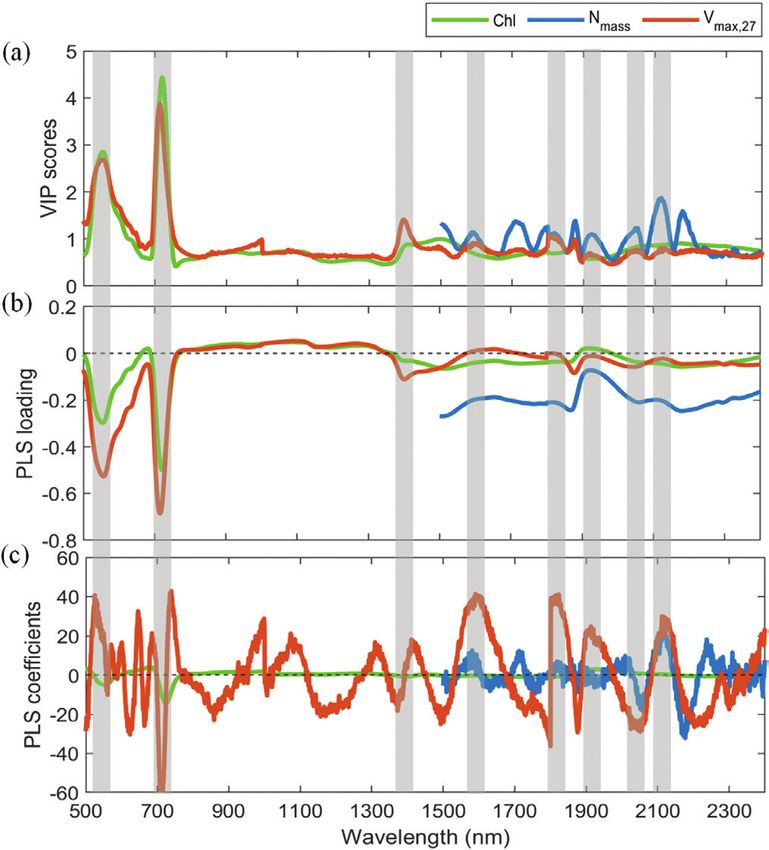
342 | Wang et al.

Introduction
Photosynthesis captures and converts solar radiation into             concentration (Yendrek et al., 2017; Dechant et al., 2017),
chemical energy to drive CO2 fixation into carbohydrates that         or their derivatives [e.g. Chl×carotenoids (Car) Chou et al.,
ultimately power ecosystems and feed humanity (Ainsworth,             2020)] as the proxy for Vmax.
2018). The conservation of photosynthetic proteins and en-               Traditional methods to estimate leaf Vmax by A/Ci (net
zymes has aided the mathematical modeling of photosynthetic           photosynthesis/intercellular CO2 concentration) curves from
processes (Farquhar et al., 1980; von Caemmerer and Furbank,          leaf gas exchange experiments (von Caemmerer, 2013) pro-
1999). In C4 photosynthesis models, carbon assimilation is            vide accurate measurements, but are time-consuming and not
limited by phosphoenolpyruvate (PEP) carboxylation in meso-           suitable for high-throughput crop monitoring in the con-
phyll and Rubisco carboxylation of bundle sheath cells (von           text of field phenotyping and precision agriculture. Sensing
Caemmerer, 2000; Sage and Kubien, 2007). With the ability             techniques such as optical reflectance, solar-induced fluores-
to concentrate CO2 around Rubisco, the photosynthesis of C4           cence, or thermal infrared data are rapid, non-destructive, and

                                                                                                                                            Downloaded from https://academic.oup.com/jxb/article/72/2/341/5906627 by guest on 10 May 2021
crops (e.g. Zea mays, Miscanthus sinensis, and Panicum virgatum)      cost-effective ways to quantify crop traits (Houborg et al.,
under current atmospheric conditions is often limited by the          2013; Serbin et al., 2015; Guan et al., 2017). In particular, spec-
CO2-saturated photosynthesis rate Vmax, which corresponds to          troscopy can exploit spectral information of the entire optical
the maximal Rubisco carboxylation rate (Leakey et al., 2019).         range (400–2500 nm) through either physically based radia-
However, due to limited in situ measurements and knowledge            tive transfer models (RTMs; e.g. Jacquemoud and Baret, 1990;
of Vmax, most crop and terrestrial ecosystem models ignore            Vilfan et al., 2019) or data-driven methods (Serbin et al., 2012;
such variability and specify a fixed value of Vmax for each plant     e.g. Ainsworth et al., 2014; Yendrek et al., 2017) to estimate
functional type (Kattge et al., 2009). Inaccurate temporal and        traits. These estimates include photosynthetic traits (Chl, ni-
spatial representation of Vmax can cause significant uncertain-       trogen, and Vmax), structural parameters, chemical composition,
ties in photosynthesis models and crop yield predictions (Hu          and photo-protective pigments (Townsend et al., 2003; Weber
et al., 2014). Thus, accurate, timely, rapid, non-destructive, and    et al., 2012; Singh et al., 2015). The information of diverse
cost-effective approaches to estimate Vmax are greatly needed         traits from spectroscopy provides opportunities to interpret the
for yield forecasting, bioenergy production, and agricultural         linkage of leaf traits and Vmax to evaluate using Chl, nitrogen,
management.                                                           or other traits as the proxy of Vmax.
   Vmax is sensitive to leaf nitrogen, temperature, ozone, and           The RTM approaches, for instance the pre-calibrated gener-
pathogens, and shows spatial, temporal, and developmental vari-       alized plate-based turbid medium PROSPECT (Jacquemoud
ability (Bernacchi et al., 2001; Ainsworth et al., 2014; Kucharik     and Baret, 1990) or PROSPECT-DyN (Z. Wang et al., 2015,
et al., 2016). Leaf nitrogen is often cited as the primary mech-      2018) models, have merits to operationally predict foliar traits
anism controlling Vmax, as multiple studies have shown that Vmax      such as Chl, nitrogen, and water content across species, growth
standardized to a certain temperature shows a strong relation-        stages, and environmental conditions. However, the accuracy
ship with leaf total nitrogen content or concentration (Walker        and number of predictable traits from RTMs are limited
et al., 2014; Dechant et al., 2017; Yendrek et al., 2017). Other      (Verrelst et al., 2019). For instance, due to the weak absorp-
studies, however, reveal that the Vmax and nitrogen relationships     tion features of Rubisco protein, existing RTMs do not in-
are complicated. For instance, plants in soils with low nitrogen      clude the spectral absorption coefficients of Rubisco protein
availability can achieve high Vmax per leaf nitrogen (Ainsworth       to directly predict Vmax. The prediction of Vmax through RTMs
and Rogers, 2007). Miner and Bauerle (2019) found that ni-            often relies on statistical regression with RTM-based traits
trogen content and the Rubisco carboxylation rate were not            (Houborg et al., 2013; Croft et al., 2017; Dechant et al., 2017)
correlated for sunflower. The Rubisco activity of soybean did         or detecting photosynthetic functioning (Zheng and Chen,
not significantly correlate to leaf nitrogen due to the excessive     2017; Bayat et al., 2018; Vilfan et al., 2019). Additionally, leaf
nitrogen storage in leaves (Koester et al., 2016). For tree species   RTMs are developed with hemispherical reflectance meas-
aspen, maple, and ash, Croft et al. (2017) found that Rubisco         ured with integrating spheres. These reflectance measurements
carboxylation rates were more sensitive to chlorophyll (Chl)          are different from conical reflectance (Schaepman-Strub et al.,
than leaf nitrogen content. The high correlation between Chl          2006) collected by the leaf-clip, which is the high-throughput
and Vmax could be explained by the nitrogen resource opti-            approach for spectra collection in the field. To solve the
mality allocation (Dewar, 1996; Evans and Clarke, 2019; Smith         above issues, the close-range spectral imaging of leaves model
et al., 2019). As light and dark reactions should be well coord-      (COSINE; Jay et al., 2016), which accounts for bi-directional
inated to maximize leaf photosynthesis, nitrogen investment           reflectance factors, needs to be combined with PROSPECT
in light-harvesting Chl and Rubisco should be optimized.              to simulate leaf conical reflectance. Conversely, data-driven
Although these studies imply strong connections among ni-             approaches, such as partial least squares regression (PLSR),
trogen, Chl, and Vmax, it is still debated whether the use of Chl     can flexibly fit leaf spectra with diverse measured traits with
(Houborg et al., 2015; Croft et al., 2017), nitrogen content/         high predictive performance. For instance, a few studies have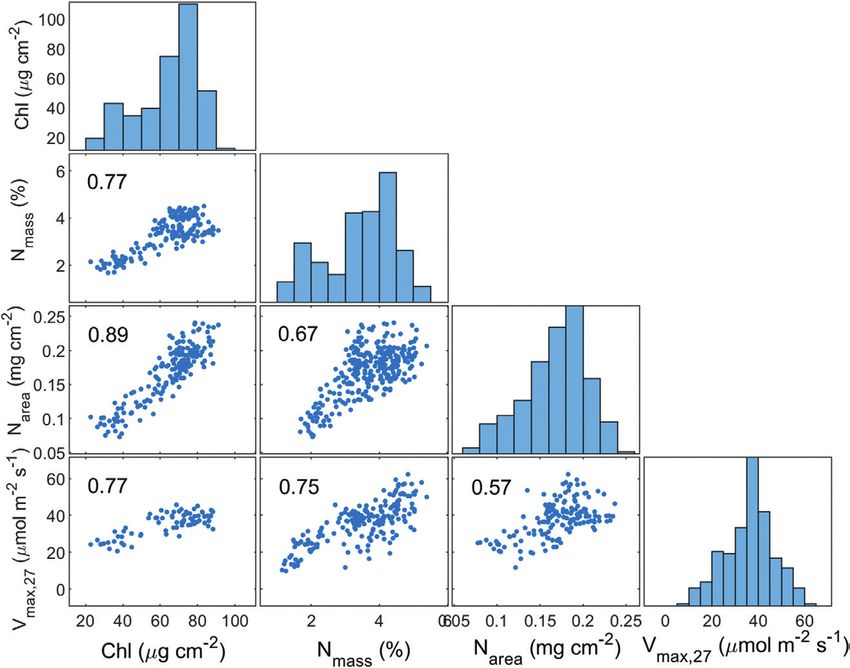
Prediction of crop photosynthetic traits from leaf spectra | 343

demonstrated that Vmax can be accurately estimated from leaf                 leaf-clip spectra, and further to identify the relationship among leaf Vmax,
spectra (Serbin et al., 2012;Yendrek et al., 2017;Wu et al., 2019).          nitrogen, and Chl.
                                                                                 Leaf reflectance spectra (500–2400 nm) were acquired from the cen-
However, the performance of PLSR models can vary signifi-                    tral section of the leaf adaxial surface using ASD FieldSpec 4 Standard
cantly depending on species, plant growth stages, and sensor                 Res full-range spectroradiometers (Analytical Spectral Devices Inc., CO,
configurations (Wang et al., 2019). In addition, PLSR requires               USA) equipped with an illuminated leaf-clip contact probe. A/Ci curves
sufficient samples of measured traits for model training, which              were measured with LI-COR 6400 and 6800 portable photosynthesis
is less operational compared with RTMs.The pre-trained gen-                  systems (LI-COR Inc., Lincoln, NE, USA) after measurements of leaf-
                                                                             clip reflectance. The A/Ci measurements were conducted with the leaf
eralized PLSR (gPLSR) models, which were developed from                      positioned in the chamber with air humidity of 55% and leaf temperature
a large database of in situ observations, can be promising for               close to ambient conditions (25–32 °C). The leaf adaxial side was placed
applications lacking measured trait data for modeling training               facing the light source with an intensity of 2000 µmol m−2 s−1. For each
(Wang et al., 2020).The traits Chl, nitrogen, and Vmax can be re-            A/Ci curve, the ambient CO2 concentrations were set to the sequences
trieved from leaf spectra through RTMs, PLSR, or gPLSR, but                  of 400, 50, 100, 150, 250, 350, 500, 700, 900, and 1200 ppm. To ensure
                                                                             the accuracy of measured Vmax from gas exchange measurements, we have
it remains uncertain for the performance comparison of these

                                                                                                                                                            Downloaded from https://academic.oup.com/jxb/article/72/2/341/5906627 by guest on 10 May 2021
                                                                             tested the reproducibility of LiCOR machines in our experiments. This
approaches. A comprehensive evaluation of these approaches                   study followed the protocol of Yendrek et al. (2017) to use the horizontal
to quantify Chl, nitrogen, and Vmax for high-throughput crop                 asymptote of a four parameter non-rectangular hyperbolic function to
monitoring is greatly needed.                                                process the measured A/Ci curves to estimate Vmax. Furthermore, we
    Maize (Zea mays L.), one of the major nitrogen-deficient                 collected Vmax measurements of the same leaves with different leaf tem-
                                                                             peratures to quantify the Vmax temperature response curve using the Q10
staple and bioenergy crops, represents a model for species with              formula and temperature inhibition curves (Leuning, 2002). By using the
the C4 photosynthesis pathway. Due to environmental fac-                     fitted temperature response curve of maize, Vmax measurements of this
tors or management strategies (e.g. shortage of nitrogen fer-                study were standardized to the reference temperature; 25 °C is a com-
tilizers), maize Vmax is often suppressed and the average yield              monly used reference temperature to normalize the temperature impacts
reaches only 64% of maximum potential globally (Neumann                      on Vmax. However, this study selected 27 °C as the reference temperature
                                                                             due to the following reason: 60% of the field Vmax measurements were
et al., 2010). In this study, we collected leaf gas exchange meas-           collected at 27 °C, and using Vmax,27 could reduce uncertainties of tem-
urements, leaf-level hyperspectral reflectance, nitrogen, and                perature normalization. Furthermore, as 27 °C is close to ambient tem-
Chl data from maize experimental plots with various geno-                    perature in the peak growing season of our study site, using Vmax,27 agrees
types, growth stages, treatments with nitrogen fertilizers, and              with our desire to estimate biochemical limitations to photosynthesis
ozone stress during three growing seasons. The objective was                 close to growth temperature. Additionally, with the measured tempera-
                                                                             ture correction curve of Supplementary Fig. S3, all Vmax,27 relationships of
to develop and evaluate spectroscopy approaches for estimating               this study can be converted to Vmax,25 (Vmax,25=0.875Vmax,27).
photosynthetic traits from leaf-clip spectra and to understand                   After A/Ci measurements, leaf tissues were sampled using a cork borer
the relationship among Chl, nitrogen, and Vmax. Two key ques-                and stored in liquid nitrogen. The wet laboratory experiments were
tions were addressed. (i) Among RTMs, PLSR, and gPLSR                        conducted to measure Chl content and nitrogen concentration of leaf
approaches, which method performs best to estimate Chl and                   samples. For Chl, one leaf disc (~1.4 cm2) was incubated in 96% (v/v)
                                                                             ethanol to determine Chl content using the equations of Lichtenthaler
nitrogen from the leaf-clip reflectance? (ii) Can we utilize leaf            and Wellburn (1983). Three leaf discs were dried in an oven (60 °C) for 3
spectra or spectra-based traits to accurately estimate Vmax? If              weeks to determine leaf dry mass. An analytical balance (ME204TE/00,
so, what are the key spectra or traits for Vmax prediction? By               Mettler Toledo Inc., OH, USA) was used to measure the dry matter
answering these questions, this study aimed to identify the op-              weight per area (Cdm, g cm−2) of leaf samples. The dried leaf tissues were
erational approaches to predict photosynthetic traits using leaf             ground to a fine powder and combusted with oxygen in an elemental
                                                                             analyzer (Costech 4010, Costech Analytical Technologies Inc., CA, USA).
hyperspectral reflectance and understand the linkage among                   The nitrogen per mass (Nmass, %) was determined by comparing experi-
Chl, nitrogen, and Vmax prediction.                                          mental samples with an acetanilide standard curve. In total, we collected
                                                                             460 leaf spectra, 297 leaf Vmax measurements, 177 leaf Chl measurements,
                                                                             and 350 leaf Nmass and Cdm measurements. Raw data and experiment
Materials and methods                                                        sources of these measurements can be found in Supplementary Dataset
                                                                             S1. A correlation matrix among the measured photosynthetic traits of
Leaf spectra and photosynthetic trait measurements                           Vmax,27, Chl, Nmass, and nitrogen per area (Narea, Nmass×Cdm, mg cm−2)
                                                                             was calculated to characterize their relationships.
The maize experimental plots of diverse genotypes were treated with ni-
trogen fertilizers (maize nitrogen plots; see Supplementary Fig. S1 at JXB
online) and ozone (SoyFACE; Supplementary Fig. S1) in Champaign,
Illinois, and measured during the growing seasons of 2014, 2015, and         Models to predict traits from leaf spectra
2019. The ozone experiment was previously described by Yendrek et al.        Radiative transfer modeling
(2017), along with hyperspectral reflectance, gas exchange, and biochem-     The PROSPECT models (Jacquemoud and Baret, 1990) were employed
ical data from the ozone experiments. The nitrogen experiment was            in this study to simulate leaf hemispherical reflectance over the optical
designed with management practices of different nitrogen fertilization       domain from 400 nm to 2500 nm to retrieve the photosynthetic traits
amounts (0, 50, 100, 150, 200, and 250 pounds per acre), time (planting,     Chl and nitrogen. PROSPECT-D can utilize leaf reflectance to estimate
V6, and V10 stages), and approaches (middle-row injection and in-row         multiple traits, such as a leaf structure parameter (N), leaf Chl content
dribble). The ozone and nitrogen fertilization experiments provided test     (Chl, µg cm–2), equivalent water thickness (Cw, cm), leaf mass per area
cases to evaluate the approaches to retrieve photosynthetic traits from      (Cdm, g cm–2), and the senescent (brown) materials (Féret et al., 2017).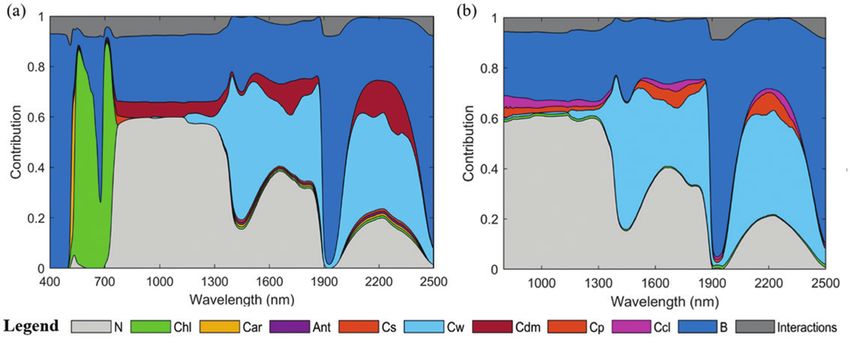
344 | Wang et al.

Table 1. Model parameters and their typical ranges for PROSPECT-D, PROSPECT-DyN, and COSINE leaf radiative transfer models.

Model                         Parameter                 Description and unit                                                                   Typical range
PROSPECT-D                    N                         Leaf structure parameter (unitless)                                                    0–5
                              Chl                       Chlorophyll content (µg cm−2)                                                          0–100
                              Car                       Carotenoids content (µg cm−2)                                                          0–60
                              Ant                       Anthocyanin content (µg cm−2)                                                          0–5
                              Cs                        Senescent (brown) materials (unitless)                                                 0–5
                              Cw                        Leaf water thickness (cm)                                                              0–0.1
                              Cdm                       Dry matter content (g cm−2)                                                            0–0.02
PROSPECT-DyN                  Cp                        Protein content (g cm−2)                                                               0–0.02
                              Ccl                       Cellulose and lignin content (g cm−2)                                                  0–0.02
COSINE                        θs                        Sensor view angle (°)                                                                  0–180

                                                                                                                                                                  Downloaded from https://academic.oup.com/jxb/article/72/2/341/5906627 by guest on 10 May 2021
                              θi                        Light incident angle (°)                                                               0–90
                              B                         Specular term to account for the bidirectional reflectance factor [unitless]           –0.2 to 0.6

The PROSPECT-DyN model was utilized to incorporate protein, cellu-                 calculated through a cross-validation analysis. We selected model com-
lose, and lignin by recalibrating spectral absorption coefficients (Z. Wang        ponents corresponding to the minimum PRESS statistic until successive
et al., 2015, 2018). As leaf protein strongly linearly correlates with ni-         PLSR components did not significantly increase the model predictive
trogen (Yeoh and Wee, 1994), estimated protein content was converted to            accuracy (Serbin et al., 2012).
the nitrogen content. PROSPECT was developed to simulate the hemi-
spherical reflectance of leaves, but the leaf-clip reflectance collected in
this study was conical. To convert the conical to the hemispherical re-            Generalized partial least squares regression
flectance, the COSINE model (Jay et al., 2016) was implemented with                The generation of PLSR models requires sufficient measured traits to be
PROSPECT models. Detailed information about the parameters of these                collected for modeling training, which could limit the applicability of
three models can be found in Table 1.                                              PLSR in a fast and operational manner. To deal with such limitations, we
   The retrieval of foliar traits was conducted through a numerical inver-         tested the pre-trained gPLSR models (Wang et al., 2020) to predict leaf
sion of RTMs by minimizing the root mean square deviation (RMSD)                   Chl and nitrogen. The gPLSR models were generated from a database of
between the measured leaf-clip and simulated reflectance. The numerical            leaf spectra and traits of 40 species (including maize) across NEON field
optimization procedure used the same constrained Powell’s line-search              sites in the Eastern USA (data available from doi:10.21232/e2jt-5209 and
method as in Féret et al. (2017). As nitrogen is sensitive to the shortwave        model code at ecosml.org). The pre-trained gPLSR model has advan-
infrared, a two-step retrieval following Wang et al. (2015) was performed.         tages of free calibration and of only requiring leaf spectra data to predict
The first step was to use the entire optical domain 500–2400 nm to invert          foliar traits. In this study, we tested whether such gPLSR models can be
the leaf structural parameter (N) and Chl content (Chl).Then we applied            applied to agricultural sites with different environmental conditions and
the shortwave infrared domain 2100–2300 nm to invert PROSPECT-                     sampling time.
DyN to estimate the protein content (Cp), which was further converted
to nitrogen content using the ratio of 4.43 (Z. Wang et al., 2018).
                                                                                   Model application and evaluation
                                                                                   Our workflow to compare the predictive ability of RTMs, PLSR, and
Partial least squares regression                                                   gPLSR to estimate leaf Chl, nitrogen, and Vmax is illustrated in Fig. 1.
The PLSR approach has been widely applied to process hyperspectral re-             We evaluated the performance of the PLSR, gPLSR, and RTMs to esti-
flectance with high collinearity. PLSR can minimize predictor variables            mate leaf Chl and nitrogen. Then we conducted a comparison of various
to a few orthogonal latent components (Geladi and Kowalski, 1986;Wold              approaches to estimate Vmax. The first approach utilized the leaf Chl or
et al., 2001). In this study, we selected PLSR to develop models to pre-           nitrogen to develop the linear regression models to estimate Vmax. We
dict photosynthetic traits (i.e. Chl, nitrogen, and Vmax) from the measured        conducted 4-fold cross-validation to evaluate the performance of these
leaf spectra. We conducted 4-fold cross-validation to split the collected          linear regression models.Then we tested the accuracy of using the leaf re-
spectra and traits into training and testing. In each training data set, the       flectance data to develop a PLSR model to estimate Vmax.We also applied
model between leaf spectra and traits was developed. Then this model               RTMs and gPLSR to estimate various leaf traits. Then through these 10
was tested using the independent testing data set.The uncertainty analysis         estimated traits (N, Chl, Car, Ant, Cs, Cw, Cdm, B, Nmass, and Ccl), we
of the PLSR models was conducted by splitting the training dataset via             developed the trait-based PLSR model to predict Vmax. Furthermore, as
100 permutations and generating the new model coefficients following               Chl and Nmass are two commonly used variables as a proxy for Vmax, we
Meerdink et al. (2016). Then we used the ensemble mean of PLSR                     also compared the performance of using only Chl, Nmass, and their multi-
models to predict the photosynthetic traits. By doing so, we obtained              plication to predict Vmax. We used the comparison of spectra-based and
both predictive values and uncertainties for traits. Notably, the leaf re-         trait-based PLSR models to identify the accurate and robust approaches
flectance from 500 nm to 2400 nm was utilized to develop the PLSR                  to estimate Vmax.
models between spectra and Vmax or Chl. However, as nitrogen is well                  To comprehensively evaluate the estimated crop traits from leaf spectra,
known to be linked to the shortwave infrared (Curran, 1988; Serbin et al.,         the Taylor diagram (Taylor, 2001) was used to present these three com-
2012;Yendrek et al., 2017), we used leaf reflectance of 1500–2400 nm to            plementary statistics with a triangle–cosine–law relationship: the Pearson
generate PLSR models to predict nitrogen. To avoid overfitting between             correlation coefficient (r), normalized standard deviation (NSTD, as in
spectra and foliar traits, we optimized the number of PLSR components              Equation 1), and normalized unbiased RMSD (NubRMSD; Equation 2).
by minimizing the prediction residual sum of squares (PRESS) statistic             The radial distance stands for the NSTD, and the angle in the polar plot
(e.g. Meerdink et al., 2016). PRESS of successive model components was             represents r. The reference point on the x-axis with r=1, NSTD=1, and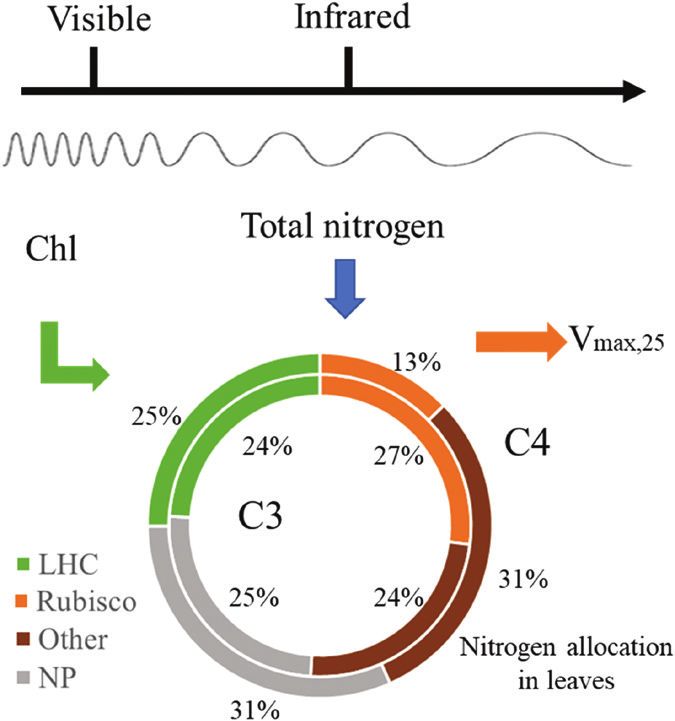
Prediction of crop photosynthetic traits from leaf spectra | 345

                                                                                 simulated leaf spectra to traits. Additionally, to the best of our knowledge,
                                                                                 this study is the first one to integrate PROSPECT-DyN and COSINE
                                                                                 for the retrieval of foliar traits. Such a sensitivity analysis can also provide
                                                                                 insights into evaluating the impacts of incorporating COSINE for re-
                                                                                 flectance simulation.
                                                                                    In the statistical approaches, the PLSR loading, coefficients, and vari-
                                                                                 able influence on the projection (VIP) scores (Wold et al., 2001) were
                                                                                 computed. The wavelengths with high absolute values of loading, coef-
                                                                                 ficients, and VIP scores indicate a high contribution to the leaf trait pre-
                                                                                 diction. The similarity and difference of the model loadings, coefficients,
                                                                                 and VIP scores of the PLSR models to predict Chl, Nmass, and Vmax were
Fig. 1. Comparison of approaches to estimate leaf chlorophyll, nitrogen,         compared to explore the spectral linkage among these key photosyn-
and Vmax,27. PLSR, partial least squares regression; gPLSR, generalized          thetic traits. Notably, this study did not employ RTMs to directly predict
PLSR; RTM, radiative transfer model; LR, linear regression; Chl, leaf            Vmax. The sensitivity of spectral wavelength to Vmax prediction focused
chlorophyll content; Vmax,27, leaf maximum carboxylation rate standardized       on the PLSR approach. In addition, we also analyzed the PLSR loading

                                                                                                                                                                    Downloaded from https://academic.oup.com/jxb/article/72/2/341/5906627 by guest on 10 May 2021
to 27 °C; N, leaf thickness parameter; Car, carotenoids; Ant, anthocyanins;      using these 10 estimated traits (N, Chl, Car, Ant, Cs, Cw, Cdm, B, Nmass,
Cs, senescent material fraction; Cw, leaf water content; Cdm, leaf dry           and Ccl) to predict Vmax. The VIP scores and loading analysis can show
matter content; B, the parameter to account for the leaf bidirectional           the linkages of these 10 traits to Vmax.
reflectance; Ccl, leaf cellulose and lignin content; The dashed line indicates
that methods require model training, while the solid lines are calibration-
free approaches. This study compared three approaches to retrieve leaf
chlorophyll and total nitrogen content, and four approaches to retrieve leaf     Results
Vmax,27. (This figure is available in color at JXB online.)
                                                                                 Measured leaf spectra and photosynthetic traits
NubRMSD=0 refers to the observation. The distance from the simula-               The measured leaf spectra (Fig. 2A) followed a general pat-
tion point to the reference point represents NubRMSD of simulations              tern of low reflectance in the visible region (500–700 nm),
and stands for the integrated performance for the simulation. The closer
distance from simulation points to the reference point indicates better          high reflectance in the near-infrared region (700–1300 nm),
simulation performance.                                                          and two water absorption features in the shortwave infrared
                                                                                 region (1300–2400 nm). The coefficient of variation (CV) of
                      NSTDsim = STDsim /STDobs                            (1)
                                                                                 the spectral data (Fig. 2B) indicated that the visible, red edge
                                                                                 (700–750 nm), and shortwave infrared regions, which are
             2                2            2
NubRMSDobs,sim = NSTDobs + NSTDsim 2NSTDobs NSTDsim cosrobs,sim                 strongly linked to leaf pigments and biochemical traits, have
                                                            (2)                  greater variability compared with the near-infrared, which re-
where sim and obs represent the simulation results and the observations,         flects the structural parameters of leaves (e.g. leaf thickness and
respectively. robs,sim refers to the correlation coefficient between simula-
tions and observations, and NSTD is the normalized standard deviation.           dry matter content).
                                                                                    After Vmax was standardized to 27 °C using the fit-
                                                                                 ting temperature response curve in Supplementary Fig. S2
Analysis of spectral signatures on predicting traits                             (Vmax,25=0.875Vmax,27), the measured leaf biochemical and
To identify the contribution of spectral wavelengths to the prediction           photosynthetic traits, Chl, Nmass, Narea, and Vmax,27, were all
of Chl, nitrogen, and Vmax, both physical model- and statistical method-         highly correlated (Fig. 3). Nonetheless, there were differences
based sensitivity approaches were applied. Through the comparison of             in the strength of trait correlations. Among all pairs, Chl and
these two approaches, this study can get a comprehensive understanding
of the relationship between spectra wavelengths and the prediction of            Narea had the highest linear correlation (r=0.89), and this high
leaf traits.                                                                     correlation indicated that maize tended to allocate leaf total
    In the physical model-based approach, we conducted a global sen-             nitrogen to Chl at a relatively constant rate. Both Chl and
sitivity analysis of the PROSPECT-DyN-COSINE using the Sobol                     Nmass were highly correlated with Vmax,27 (r=0.77 and 0.75, re-
method (Sobol, 2001; Saltelli et al., 2004), which is based on ANOVA             spectively), confirming previous findings showing that Vmax,27
decomposition to calculate the sensitivity of coupled inputs. The Sobol
analysis can quantify the contribution of model parameters (leaf traits) to      of maize is highly correlated with Chl (Houborg et al., 2013;
the wavelengths of leaf reflectance.The first-order Sobol sensitivity quan-      Croft et al., 2017) and Nmass (Yendrek et al., 2017). The large
tifies the independent contribution from each input to the output vari-          variabilities of measured photosynthetic traits can serve a ro-
ables, while the second-order sensitivity quantifies interactions between        bust dataset for testing the model performance to predict traits.
every two inputs to the output variable. The Sobol analysis is sensitive to
the configuration of the model parameter range and distribution. As this
study focused on the maize photosynthetic traits, we utilized the 460 col-
lected leaf spectra to invert RTMs to obtain the parameter distribution.         Predicted photosynthetic traits from leaf spectra
Then, the kernel density sampling method was applied to generate the
                                                                                 The results of comparing RTM, PLSR, and gPLSR (Fig. 1)
input data for sensitivity analysis. The kernel density sampling method
has the advantage of resembling the distribution of the sampled dataset (S.      to estimate leaf photosynthetic traits are shown in the Taylor
Wang et al., 2018). According to the kernel density distribution of model        diagram (Fig. 4). For leaf Chl, PLSR achieved the highest r of
parameters, 20 000 samples were generated to assess the sensitivity of           ~0.95, the lowest NubRMSD of ~0.33, and NSTD close to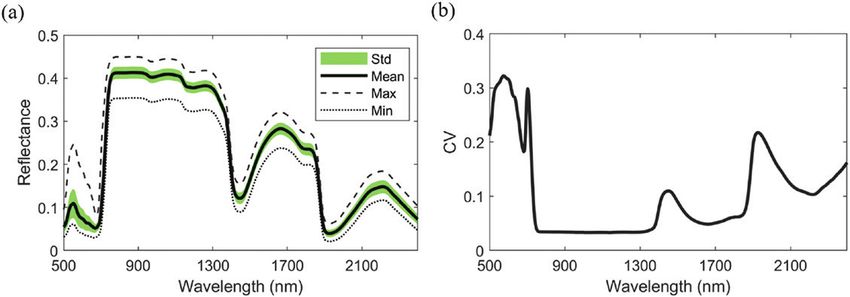
346 | Wang et al.

Fig. 2. Mean, maximum, minimum, standard deviation, and coefficient of variation (CV) of the measured leaf reflectance for maize. (This figure is available

                                                                                                                                                                  Downloaded from https://academic.oup.com/jxb/article/72/2/341/5906627 by guest on 10 May 2021
in color at JXB online.)

Fig. 3. Correlation matrix for measured leaf photosynthetic traits. Vmax,27, the carboxylation rate at 27 °C (µmol m−2 s−1); Chl, leaf chlorophyll content (μg
cm–2); Nmass, leaf nitrogen per mass (%); Narea, leaf nitrogen per area (mg cm-2). The statistics in plots refer to the Pearson correlation coefficients. (This
figure is available in color at JXB online.)

1. The RTM approach also achieved high performance with                           (PROSPECT-DyN-COSINE) was weaker with r of ~0.60.
r ~0.95 and NubRMSD ~0.45. The gPLSR approach can ob-                             Detailed scatterplots of predicting Chl and Nmass are illustrated
tain good performance with r of 0.88 and NubRMSD of 0.48.                         in Supplementary Fig. S4.
For Nmass, the PLSR method showed the highest r of ~0.96                             For Vmax,27 predictions, the best performance was achieved
and NubRMSD of 0.28. The gPLSR approach can also ob-                              by the spectra-based PLSR model with r of 0.81, NubRMSD
tain a relatively good prediction of nitrogen with r of ~0.85                     of ~0.61, and NSTD close to 1. The trait-based PLSR model
and NubRMSD of 0.56. The predictive power of the RTM                              utilizing 10 spectra-based traits (N, Chl, Car, Ant, Cs, Cw, Cdm,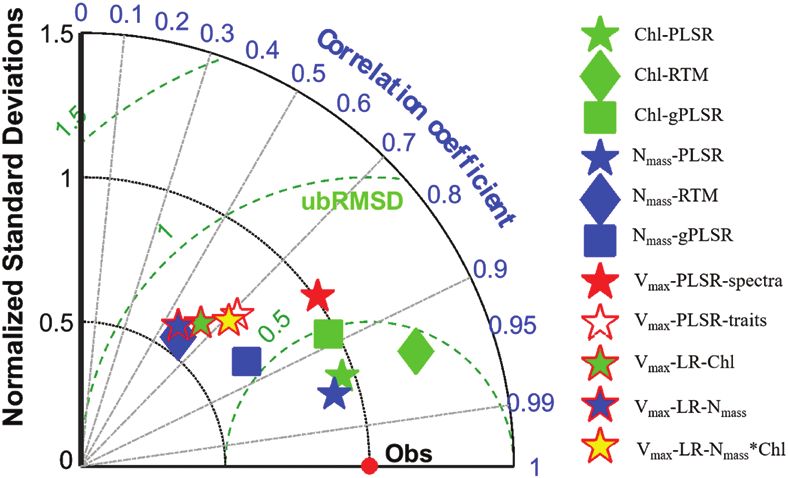
Prediction of crop photosynthetic traits from leaf spectra | 347
PROSPECT-DyN, Fig. 5B) contributed to the variability of
reflectance in near-infrared and shortwave infrared regions
that was not explained by the parameter B. In particular, the
shortwave infrared 1500–1900 nm and 2000–2400 nm are
the main wavelengths exhibiting the nitrogen signal (Cp in
Fig. 5B). The parameter B representing the bidirectional re-
flectance factor of leaves showed a significant contribution
to the spectral variability across visible, near-infrared, and
shortwave infrared, especially in blue and red wavelengths and
the water absorption feature around 1900 nm. This high con-
tribution indicated the importance of considering the bidir-
ectional effects of leaf reflectance collected from a handheld
leaf-clip spectroradiometer (Li et al., 2019). In general, from
Downloaded from https://academic.oup.com/jxb/article/72/2/341/5906627 by guest on 10 May 2021
the model-based contribution analysis, the visible informa-
Fig. 4. Taylor diagram to present the performance of estimating leaf
chlorophyll, nitrogen, and Vmax. The pentagrams represent PLSR and LR tion (500–750 nm) has strong implications for Chl estimation,
(linear regression) methods. The diamonds are the RTM approaches, while the shortwave infrared bands (1500–1900 nm and 2000–
which refer to the PROSPECT-COSINE and PROSPECT-DyN-COSINE. 2400 nm) are important for nitrogen prediction.
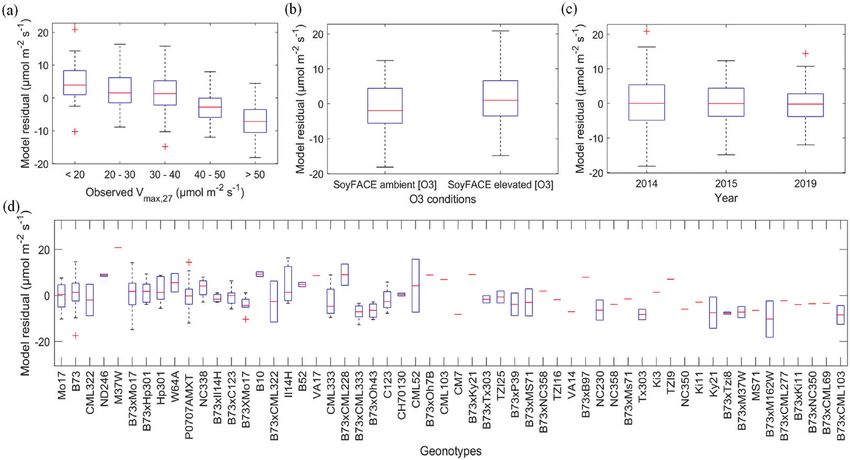
The squares indicate the gPLSR method. The different markers represent In the statistical analysis, the VIP scores, loading, and coef-
chlorophyll-related, nitrogen-related, and Vmax-related predictions. The
ficients of the spectra-based PLSR models were compared to
radial coordinate represents the normalized standard deviation, which
is equal to 1 for the observations. The angular coordinate indicates analyze the similarity and difference of using spectra to predict
the correlation coefficient, which refers to 1 for the observations. The Vmax,27, Chl, and Nmass (Fig. 6A–C). In general, the visible wave-
concentric dashed semi-circles represent the normalized unbiased RMSD. lengths associated with green reflectance and red absorption
In the Taylor diagram, the points closer to the observation point refer to (550 nm and 710 nm) contributed most significantly to the
higher predictive ability for the models. (This figure is available in color at
prediction of Chl, while the shortwave infrared wavelengths in
JXB online.)
the 1700–1900 nm and 2100–2200 nm shortwave infrared re-
B, Nmass, and Ccl) to predict Vmax,27 also demonstrated a good gions were most important to the prediction of nitrogen.These
predictive skill, with r of ~0.72 and NubRMSD of 0.70. These findings also agree with the model-based sensitivity analysis
two PLSR models showed better performance than the linear (Fig. 5) and confirm the robust performance of RTMs. The
regression models based on either Chl or Nmass. The linear re- shaded gray regions in Fig. 6 correspond to the high absolute
gression models based on Chl or Nmass achieved a similar and values of VIP scores for predicting Vmax,27. In the visible part of
moderate prediction performance with r of ~0.6. However, the the spectrum (500–750 nm), the VIP scores, loadings, and co-
predictive performance of the linear model significantly im- efficients of Vmax,27 and Chl were very similar. Specifically, the
proved by using Chl×Nmass. The linear regression model be- green and red edge (550 nm and 710 nm) largely contributed
tween Chl×Nmass and Vmax can achieve an r of ~0.71 and an to the prediction of Vmax,27. In the shortwave infrared region,
NubRMSD of 0.70, which is close to the performance of the the patterns of VIP scores, loadings, and coefficients for Vmax,27
trait-based model (Supplementary Fig. S5).This result indicates were close to those for Nmass. The PLSR models of Vmax,27 and
that Chl and Nmass play a major role in the prediction of Vmax,27 Nmass shared key wavelengths such as 1590, 1830, 1910, 2030,
in the trait-based PLSR model. and 2110 nm. These results indicate that the spectra signals
of Chl and Nmass have complementary contributions to the
prediction of Vmax,27. However, notably, there are also unique
wavelengths such as 1500, 2200, and 2300 nm contributing to
Contribution of spectral signatures on predicting traits
the prediction of Vmax,27 that are not strongly related to Chl
In the RTM-based spectra contribution analysis, this study re- or Nmass.
trieved parameter distribution (Supplementary Fig. S3) from Similar to the analysis of spectra-based PLSR models, the
the 460 collected leaf spectra. Then, the global sensitivity ana- VIP scores and loading of the trait-based PLSR model also
lyses of results of PROSPECT-COSINE and PROSPECT- supported the findings on the large contribution of Chl and
DyN-COSINE for the case of simulating maize leaf-clip Nmass to Vmax,27 predictions. In the VIP scores of the trait-based
reflectance were conducted as shown in Fig. 5. In the visible PLSR model (Fig. 7A), Chl and Nmass were the two strongest
region, pigments including Chl, Car, Ant, and Cs contributed contributors to the prediction of Vmax,27. The analysis of the
to the reflectance variation (Fig. 5A), with red edge and green components 1 and 2 of PLSR loading (Fig. 7B) showed that
wavelengths (500–750 nm) influenced primarily by Chl. The Chl largely contributed to the first component of PLSR
leaf structural parameter N, which indicates the leaf thick- loading. Nmass had a contribution to the first component but
ness, and dry matter content (protein, cellulose, and lignin in also provided unique information on the second component.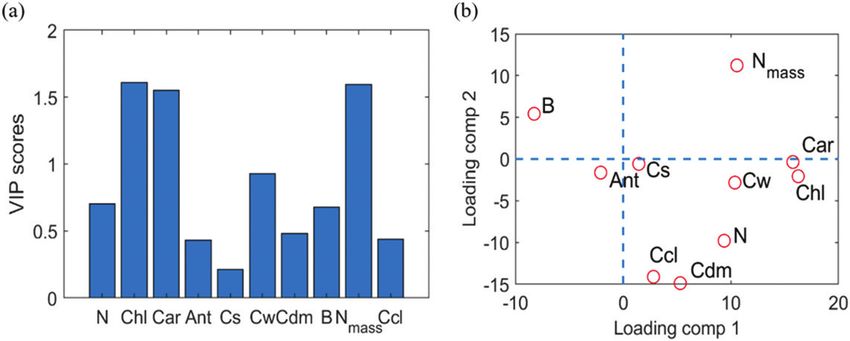
348 | Wang et al.

                                                                                                                                                            Downloaded from https://academic.oup.com/jxb/article/72/2/341/5906627 by guest on 10 May 2021
Fig. 5. Global sensitivity analysis of radiative transfer models. (A) PROSPECT-COSINE and (B) PROSPECT-DyN-COSINE. In the key, the variables N,
Chl, Car, Ant, Cs, Cw, Cdm, Cp, Ccl, B, and Interactions refer to leaf thickness structure parameter, chlorophyll, carotenoids, anthocyanin, senescent
materials, water content, dry matter content, protein, cellulose and lignin, leaf bidirectional reflectance factors, and interactions for the parameter
sensitivities, respectively. (This figure is available in color at JXB online.)

Fig. 6. (A) VIP scores, (B) loading, and (C) coefficients of the spectra-based PLSR model for Vmax,27, chlorophyll, and nitrogen predictions. The orange
curve shows leaf Vmax,27 predictions. The green curve refers to the leaf chlorophyll content prediction. The blue curve represents leaf nitrogen per mass
predictions. The shaded gray region indicates the key wavelengths for Vmax,27 predictions. (This figure is available in color at JXB online.)

This analysis indicated that Chl and Nmass had shared but also                 high contribution to the model prediction following Chl and
unique contributions to the prediction of Vmax,27. In the VIP                  Nmass. This contribution was probably due to the high cor-
scores for the trait-based PLSR model, Car and Cw showed a                     relation between Chl and Car (Kopsell et al., 2004). Under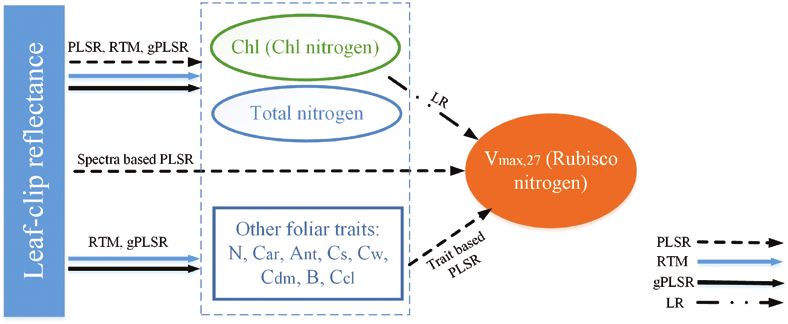
Prediction of crop photosynthetic traits from leaf spectra | 349

                                                                                                                                                                   Downloaded from https://academic.oup.com/jxb/article/72/2/341/5906627 by guest on 10 May 2021
Fig. 7. (A) VIP scores and (B) loading components 1 and 2 of the trait-based PLSR model for the Vmax,27 prediction. The traits N, Chl, Car, Ant, Cs, Cw,
Cdm, B, Nmass, and Ccl refer to leaf thickness structure parameter, chlorophyll, carotenoids, anthocyanin, senescent materials, water content, dry matter
content, leaf bidirectional reflectance factor, nitrogen per mass, and cellulose and lignin content, respectively. These foliar traits are from calibration-free
approaches. The estimated Nmass is from gPLSR, due to its high accuracy. Other traits are from RTMs. (This figure is available in color at JXB online.)

drought conditions, low water availability can alter nitrogen                     for A/Ci curves, when operating systems in the field (Long
uptake and thus results in a high correlation between leaf water                  and Bernacchi, 2003). In addition, the Rubisco capacity Vmax
content and Vmax (Camino et al., 2019).                                           derived from gas exchange measurements is not always equal
                                                                                  to the amount of Rubisco protein present (Crafts-Brandner
                                                                                  and Salvucci, 2000). However, this study carefully screened all
                                                                                  A/Ci curves to exclude the bad fitting of measurement curves
Discussion
                                                                                  as in Kauwe et al. (2016). As multiple machines were employed,
We provided a comprehensive evaluation of spectroscopy                            we have also tested the reproducibility of machines to ensure
methods to retrieve Chl, Nmass, and Vmax. These analyses could                    similar A/Ci curves obtained from different machines for the
be helpful for the model selection to estimate leaf photosyn-                     same leaf. Furthermore, our Vmax measurements are compar-
thetic traits in high-throughput crop monitoring. First, for                      able with estimates reported in previous studies (Houborg
pre-trained approaches, the PROSPECT-D coupled with the                           et al., 2013;Yendrek et al., 2017; Miner and Bauerle et al., 2019).
COSINE model showed a strong ability to predict Chl, while                        All these strategies ensure the high accuracy of the measured
gPLSR predicted leaf nitrogen better.With field measurements                      Vmax data for this study.
for model training, PLSR showed the best performance to                              To diagnose the performance of the spectra–Vmax,27 model,
predict foliar traits. Secondly, the spectra-based or trait-based                 we further analyzed the relationships between model predic-
PLSR models can provide accurate and effective means to pre-                      tion residuals with leaf conditions, environmental stressors,
dict Vmax.We also found that Chl and Nmass, which are strongly                    experiment year, and genotypes (Fig. 8). The comparison be-
linked to visible and shortwave infrared signals, respectively,                   tween model residuals and leaf Vmax,27 (Fig. 8A) shows model
showed shared and unique contributions to the prediction of                       overestimation of Vmax,27 when leaf Vmax,27 is low, while the
Vmax. Measurement and model uncertainties, implications on                        model underestimates Vmax,27 when leaves have high Vmax,27.
RTM and PLSR model selection, and mechanisms of control-                          We also found that the model residuals exhibit dependence
ling Vmax based on these results are further discussed.                           on O3 treatment (Fig. 8B), which indicates that O3 can alter
                                                                                  the leaf spectra and traits relationship (Yendrek et al., 2017).
                                                                                  Similarly, the spectra–trait model also shows a large difference
Uncertainty for photosynthetic capacity prediction
                                                                                  when applied to different genotypes (Fig. 8D). However, we
Compared with Chl and Nmass prediction, achieving high ac-                        did not find a significant difference for model performances in
curacy to predict Vmax through spectroscopy has more chal-                        different year data (Fig. 8C), which demonstrates the transfer-
lenges.These challenges are partially due to the limited amount                   ability of PLSR models for plants across growth stages (Wang
and weak absorption features of Rubisco enzyme. Furthermore,                      et al., 2019).
uncertainties in field Vmax measurements and models may also
contribute to the performance of Vmax prediction.                                 Selection of physically based and data-driven
   This study used commercial gas exchange systems to obtain                      approaches
the A/Ci curves to fit the horizontal asymptote of a four param-
eter non-rectangular hyperbolic function (Yendrek et al., 2017)                   RTMs are developed based on physically based radiative
to quantify Vmax. However, gas leakage, chamber edge effects,                     transfer processes and thus have high accuracy to utilize the
and lateral flux through leaf air space could bring uncertainties                 observed leaf spectra to accurately predict traits with strong
350 | Wang et al.

                                                                                                                                                             Downloaded from https://academic.oup.com/jxb/article/72/2/341/5906627 by guest on 10 May 2021
Fig. 8. Analysis of the performance of the spectra–Vmax,27 model by (A) leaf condition, (B) environmental stressor, (C) experiment year, and (D) genotype.
(This figure is available in color at JXB online.)

absorption features, such as pigments. For instance, this study                shaded leaves (Verhoef, 1984). The upscaling of Vmax from
demonstrated the high accuracy of PROSPECT-COSINE to                           leaf to canopy is also highly non-linear, but the process is in-
estimate Chl (r=0.94) in maize. Compared with pigments, pro-                   fluenced by nitrogen allocation throughout the canopy pro-
tein has relatively weaker absorption features in shortwave in-                file and within leaves (Hammer and Wright, 1994; Evans
frared, and RTM showed moderate accuracy to estimate Nmass                     and Clarke, 2019). Thus, the leaf-scale spectra–Vmax relation-
(Fig. 4). Data-driven methods such as PLSR have the advan-                     ship could hardly be used for the canopy spectra, as different
tage of exploiting spectral signatures to link reflectance with                mechanisms are involved in the upscaling of spectra and Vmax
in situ measurements to accurately predict traits such as Nmass                from leaf to canopy.
(r=0.96). However, the development of PLSR models requires                        To predict Vmax across leaf, canopy, regional, or global scales,
collecting a large dataset of foliar traits for model training, and            the trait-based Vmax model has more flexibility (Houborg et al.,
models may not be applicable outside the conditions of in situ                 2013; Luo et al., 2019). For instance, Houborg et al. (2013)
collections. In practical applications, the pre-trained gPLSR                  showed that using the leaf Chl–Vmax relationship along with
models, which can be implemented without field-measured                        satellite-derived Chl content, the community land model
traits, have high flexibility and accuracy to predict traits such              achieved an improved estimation of canopy gross primary
as Nmass (r=0.85).                                                             production. Similarly, Luo et al. (2019) applied such a leaf
   Regarding Vmax prediction, the spectra-based PLSR model                     Chl–Vmax relationship to the global scale to derive terrestrial
in this study achieved the highest accuracy (r=0.81).The trait-                photosynthesis. In these studies, leaf traits were retrieved from
based PLSR model achieved slightly worse but still reasonably                  the canopy reflectance through RTMs (Jacquemoud et al.,
good performance (r=0.72). The integration of Chl and Nmass                    2009) and then the trait–Vmax relationship was applied to de-
can also achieve good predictive performance (r=0.71). For                     rive photosynthetic capacity.
leaf-scale applications, the spectra-based models show great
potential. However, such leaf spectra models have challenges                   Foliar nitrogen allocation and photosynthetic capacity
to be directly applied to the canopy scale, as spectra vary sig-               prediction
nificantly across leaf and canopy scales. The upscaling of re-
flectance from leaf to canopy is also highly non-linear, due to                Photosynthesis requires a large number of proteins, such as
light scattering throughout the canopy profile, sensor viewing                 Rubisco and the light-harvesting complex, which account for
angles, solar radiation angles, and the fraction of sunlit and                 69–75% of the nitrogen in leaves (Makino and Osmond, 1991;
Prediction of crop photosynthetic traits from leaf spectra | 351
Onoda et al., 2017). Around 25–31% nitrogen is allocated to et al., 2013; Dechant et al., 2017), this proposed approach has
the non-photosynthetic components such as cell walls, mito- greater potential for Vmax retrieval. For instance, Chl-deficient
chondria, peroxisomes, and the cytosol, as shown in Fig. 9 (Mu tobaccos have a much lower Chl to Vmax ratio than normal
et al., 2016; Evans and Clarke, 2019). The nitrogen allocation species (Meacham-Hensold et al., 2019). Using a universal Chl
to Rubisco and other components shows strong variability and Vmax relationship may underestimate Vmax in such species.
depending on species, growth stages, and environmental con- However, with additional nitrogen information, the predic-
ditions (Evans and Clarke, 2019). For instance, Onoda et al. tion of Vmax could be improved. Likewise, use of total nitrogen
(2017) found that when leaves increased leaf dry mass per area, to predict Vmax may result in low correlations for species such
the fraction of leaf nitrogen allocated to Rubisco declined to as soybean (Koester et al., 2016) due to excessive nitrogen
compensate for the increased allocation to the cell wall ma- storage. The additional information of Chl could thus be vital
terials. Due to the greater photosynthetic rate per unit leaf to improving the prediction of soybean Vmax. Moreover, the
nitrogen in young leaves, Vmax showed strong variations with sensing techniques provide estimates of the pool sizes for leaf
leaf ages (Albert et al., 2018; Wu et al., 2019). The proportion nitrogen components, such as Chl or total nitrogen. To fur-
Downloaded from https://academic.oup.com/jxb/article/72/2/341/5906627 by guest on 10 May 2021
of photosynthetic proteins in maize showed large variations ther constrain Vmax prediction, the optimality theories on
with treatments with nitrogen fertilizers (Mu et al., 2016). plant resource allocation (Smith et al., 2019) can be leveraged
Understanding leaf nitrogen allocation is important for Vmax to combine with the retrieved nitrogen components from
prediction. sensing techniques. For natural ecosystems or nitrogen deficit
The proposed approach in this study (Fig. 9), which es- crops, plants tend to maximize carbon gains with improving
timates Chl and total nitrogen through the visible and nitrogen allocation among leaf nitrogen pools (Quebbeman
shortwave infrared spectra, respectively, can integrate Chl and and Ramirez, 2016). With such information about nitrogen
nitrogen information to infer nitrogen allocation to predict allocation, the prediction of Vmax could be further improved.
Vmax. Compared with the remote sensing approaches utilizing Towards operational prediction of Vmax from hyperspectral
either Chl or total nitrogen to approximate Vmax (Houborg reflectance with less dependency on model training, the in-
tegration of RTM-derived Chl and gPLSR-derived Nmass
to develop the generalized model for Vmax prediction shows
great potential.
Conclusion
The accurate, fast, non-destructive, and cost-effective ap-
proaches to estimate photosynthetic traits, such as CO2-
saturated photosynthesis rate (Vmax), chlorophyll, and nitrogen,
are greatly needed for crop monitoring.This study comprehen-
sively evaluated radiative transfer models (RTMs), partial least
squares regression (PLSR), and generalized PLSR (gPLSR) to
retrieve photosynthetic traits from leaf-clip reflectance col-
lected in diverse maize plots with different genotypes, growth
stages, treatments with nitrogen fertilizers, and ozone pollution
in three growing seasons. This study led to the following con-
clusions. (i) Both pre-trained RTM and gPLSR methods have
great potential to estimate photosynthetic traits. RTMs can
achieve a high performance to retrieve foliar pigments such as
Chl content (r=0.95). gPLSR can be used to estimate foliar ni-
trogen concentration (r=0.85). (ii) With model training, PLSR
methods can exploit leaf reflectance in conjunction with field
Fig. 9. Methodology to integrate the visible and infrared hyperspectral samples to achieve high accuracy to predict traits. The PLSR
reflectance to quantify nitrogen allocation to estimate Vmax. The inner and
outer circles refer to the typical nitrogen allocation in C3 leaves and C4
models based on spectra (r=0.81) or the spectra-retrieved
leaves, respectively. The data for nitrogen allocation for C3 and C4 leaves traits (r=0.72) can provide good predictions of Vmax. In par-
are from Evans and Clarke (2019) and Mu et al. (2016), respectively. ticular, the trait-based Vmax model has the ability to be applied
Notably, the allocation rates vary with environmental conditions, species, across spatial scales—using either leaf or canopy level data. (iii)
and growth stages. LHC refers to nitrogen in the light-harvesting complex. We found that leaf Chl content and nitrogen concentration
Rubisco represents nitrogen in the Rubisco protein. Other stands for
nitrogen in other photosynthetic proteins. NP means non-photosynthetic
showed complementary contributions to the prediction of
proteins, such as cell wall, mitochondria, and cytosol. (This figure is Vmax. The integration of leaf Chl and total nitrogen informa-
available in color at JXB online.) tion, which indicates leaf Chl nitrogen and total nitrogen pool352 | Wang et al.
sizes, respectively, can significantly improve Vmax prediction Author contributions
(r=0.71) compared with that using only Chl or nitrogen. The
SW, KG, ZW, EAA, and PT conceived the project. KG, EAA, and PT
information on nitrogen allocation among nitrogen pools is contributed to funding acquisition. SW, ZW, TZ, KL, CM, and GW per-
vital for Vmax predictions. formed the experiments and data collection. SW conducted data pro-
This study provided new insights into improving Vmax pre- cessing and analysis. SW, KG, ZW, EAA, PT, and CJ contributed to data
diction by sensing both Chl and nitrogen for maize. Such ap- interpretation and discussion. SW wrote the original draft of the manu-
proaches could also be applied to other crops, such as perennial script. All authors have revised and approved the final manuscript.
bioenergy C4 grasses. Further, applying estimated photosyn-
thetic traits from spectroscopy into the terrestrial ecosystem
models could significantly improve the ability to predict crop Conflict of interest
yields and carbon cycles. Leveraging the advanced imaging
The authors declare that they have no conflicts of interest.
spectroscopy approaches on towers, unmanned or manned
airborne systems, or satellites such as PRISMA (launched in
Downloaded from https://academic.oup.com/jxb/article/72/2/341/5906627 by guest on 10 May 2021
2019), HISUI (launched in 2019), EnMAP (expected launch in
Data availability
2021), and NASA SBG and ESA CHIME (expected launches
in the late 2020s), we can extend the leaf retrieval to the canopy All data supporting the findings of this study are available within the
and regional scale for high-throughput and large-scale agricul- paper and within its supplementary data published online.
tural monitoring.
References
Supplementary data Ainsworth EA. 2018. Photosynthesis. In: Hatfield JL, Sivakumar MVK,
Prueger JH, eds. Agroclimatology: linking agriculture to climate. Wiley, 1–23.
The following supplementary data are available at JXB online.
Ainsworth EA, Rogers A. 2007. The response of photosynthesis and sto-
Fig. S1. Overview of the study site. matal conductance to rising [CO2]: mechanisms and environmental inter-
Fig. S2. Fitted Vmax temperature correction curve for maize. actions. Plant, Cell & Environment 30, 258–270.
Fig. S3. Retrieved distribution of the PRO-COSINE and Ainsworth EA, Serbin SP, Skoneczka JA, Townsend PA. 2014. Using
PRODyN-COSINE parameters from the 470 measured maize leaf optical properties to detect ozone effects on foliar biochemistry.
Photosynthesis Research 119, 65–76.
leaf reflectance.
Albert LP, Wu J, Prohaska N, et al. 2018. Age-dependent leaf physiology
Fig. S4. Scatterplots of predicting (a–c) leaf chlorophyll con- and consequences for crown-scale carbon uptake during the dry season in
tent and (d–f) nitrogen concentration from leaf-clip reflectance. an Amazon evergreen forest. New Phytologist 219, 870–884.
Fig. S5. Scatterplots of predicting Vmax from leaf spectra or Bayat B, van der Tol C, Verhoef W. 2018. Integrating satellite optical and
spectra-based traits. thermal infrared observations for improving daily ecosystem functioning es-
timations during a drought episode. Remote Sensing of Environment 209,
Dataset S1. Measured leaf traits, measured reflectance, and 375–394.
generated spectra–trait PLSR models. Bernacchi CJ, Singsaas EL, Pimentel C, Portis AR, Long SP. 2001.
Improved temperature response functions for models of Rubisco-limited
photosynthesis. Plant, Cell & Environment 24, 253–259.
Acknowledgements Camino C, Gonzalez-Dugo V, Hernandez P, Zarco-Tejada PJ. 2019.
Radiative transfer Vcmax estimation from hyperspectral imagery and SIF re-
This work was supported by the DOE Center for Advanced Bioenergy trievals to assess photosynthetic performance in rainfed and irrigated plant
and Bioproducts Innovation (U.S. Department of Energy, Office of phenotyping trials. Remote Sensing of Environment 231, 111186.
Science, Office of Biological and Environmental Research under award Chou S, Chen B, Chen J, Wang M, Wang S, Croft H, Shi Q. 2020.
number DE-SC0018420). Any opinions, findings, and conclusions or re- Estimation of leaf photosynthetic capacity from the photochemical reflect-
commendations expressed in this publication are those of the author(s) ance index and leaf pigments. Ecological Indicators 110, 105867.
and do not necessarily reflect the views of the U.S. Department of Energy. Crafts-Brandner SJ, Salvucci ME. 2000. Rubisco activase con-
strains the photosynthetic potential of leaves at high temperature and
We would also like to thank the support for the seed funding from the CO2. Proceedings of the National Academy of Sciences, USA 97,
Center for Digital Agriculture, National Center for Supercomputing 13430–13435.
Applications, University of Illinois at Urbana-Champaign. KG is funded Croft H, Chen JM, Luo X, Bartlett P, Chen B, Staebler RM. 2017.
by NASA New Investigator Award and Carbon Monitoring System pro- Leaf chlorophyll content as a proxy for leaf photosynthetic capacity. Global
gram (NNX16AI56G and 80NSSC18K0170) managed by the NASA Change Biology 23, 3513–3524.
Terrestrial Ecology Program, and USDA National Institute of Food and Curran PJ. 1988. The semivariogram in remote sensing: an introduction.
Agriculture (NIFA) Foundational Program award (2017-67013-26253, Remote Sensing of Environment 24, 493–507.
2017-68002-26789, 2017-67003-28703). ZW, TZ, and PT received Dechant B, Cuntz M, Vohland M, Schulz E, Doktor D. 2017. Estimation
support through a NASA Jet Propulsion Laboratory award 1638464, of photosynthesis traits from leaf reflectance spectra: correlation to nitrogen
content as the dominant mechanism. Remote Sensing of Environment 196,
NSF Macrosystems Biology grant 1638720, and USDA Hatch award 279–292.
WIS01874. We would also like to thank the editor Dr Tracy Lawson and
Dewar RC. 1996. The correlation between plant growth and intercepted
two anonymous referees for suggestions and comments that improved radiation: an interpretation in terms of optimal plant nitrogen content. Annals
the paper. of Botany 78, 125–136.You can also read