Full-fit reconstruction of the Labrador Sea and Baffin Bay
←
→
Page content transcription
If your browser does not render page correctly, please read the page content below
Open Access
Solid Earth, 4, 461–479, 2013
www.solid-earth.net/4/461/2013/
doi:10.5194/se-4-461-2013                                                                        Solid Earth
© Author(s) 2013. CC Attribution 3.0 License.

Full-fit reconstruction of the Labrador Sea and Baffin Bay
M. Hosseinpour1 , R. D. Müller1 , S. E. Williams1 , and J. M. Whittaker2
1 EarthByte     Group, School of Geosciences, University of Sydney, Sydney, NSW 2006, Australia
2 Institute   for Marine and Antarctic Studies, University of Tasmania, Hobart, TAS 7005, Australia

Correspondence to: M. Hosseinpour (maral.hosseinpour@sydney.edu.au)

Received: 7 June 2013 – Published in Solid Earth Discuss.: 8 July 2013
Revised: 25 September 2013 – Accepted: 3 October 2013 – Published: 26 November 2013

Abstract. Reconstructing the opening of the Labrador Sea           Our favoured model implies that break-up and formation of
and Baffin Bay between Greenland and North America re-             continent–ocean transition (COT) first started in the south-
mains controversial. Recent seismic data suggest that mag-         ern Labrador Sea and Davis Strait around 88 Ma and then
netic lineations along the margins of the Labrador Sea, orig-      propagated north and southwards up to the onset of real
inally interpreted as seafloor spreading anomalies, may lie        seafloor spreading at 63 Ma in the Labrador Sea. In Baffin
within the crust of the continent–ocean transition. These          Bay, continental stretching lasted longer and actual break-up
data also suggest a more seaward extent of continental crust       and seafloor spreading started around 61 Ma (chron 26).
within the Greenland margin near Davis Strait than assumed
in previous full-fit reconstructions. Our study focuses on re-
constructing the full-fit configuration of Greenland and North
America using an approach that considers continental defor-        1   Introduction
mation in a quantitative manner. We use gravity inversion
to map crustal thickness across the conjugate margins, and         The Labrador Sea and Baffin Bay formed following Creta-
assimilate observations from available seismic profiles and        ceous rifting between Greenland and North America (Fig. 1).
potential field data to constrain the likely extent of differ-     The relative motions between these two plates in the
ent crustal types. We derive end-member continental mar-           Palaeocene following the onset of seafloor spreading can be
gin restorations following alternative interpretations of pub-     reconstructed based on the identification of seafloor spread-
lished seismic profiles. The boundaries between continental        ing magnetic anomalies (Roest and Srivastava, 1989; Oakey
and oceanic crust (COB) are restored to their pre-stretching       and Chalmers, 2012). Reconstructing the relative motions of
locations along small circle motion paths across the region        the Greenland and North American plates for times prior
of Cretaceous extension. Restored COBs are fitted quantita-        to seafloor spreading depends on accurately identifying the
tively to compute alternative total-fit reconstructions. A pre-    present-day extent of stretched continental crust along the
ferred full-fit model is chosen based on the strongest compat-     conjugate margins and undoing this extension in the recon-
ibility with geological and geophysical data. Our preferred        struction. Uncertainties in the distribution of crustal types
model suggests that (i) the COB lies oceanward of mag-             and identification of seafloor spreading anomalies have im-
netic lineations interpreted as magnetic anomaly 31 (70 Ma)        plications for plate tectonic reconstructions, in particular for
in the Labrador Sea, (ii) all previously identified magnetic       the rifting and early seafloor spreading phases. Existing re-
lineations landward of anomaly 27 reflect intrusions into          construction models for the relative positions of Greenland
continental crust and (iii) the Ungava fault zone in Davis         and North America during Cretaceous continental rifting in-
Strait acted as a leaky transform fault during rifting. This ro-   clude those of Bullard et al. (1965), Rowley and Lottes
bust plate reconstruction reduces gaps and overlaps in Davis       (1988), Srivastava and Roest (1989) and Dunbar and Sawyer
Strait and suggests that there is no need for alternative mod-     (1989) These reconstructions were derived under assump-
els proposed for reconstructions of this area including ad-        tions that much of the crust in the continent–ocean transi-
ditional plate boundaries in North America or Greenland.           tion (COT) was oceanic during chron 28–31 time (70–64 Ma
                                                                   according to timescale from Gradstein et al., 2012) and that

Published by Copernicus Publications on behalf of the European Geosciences Union.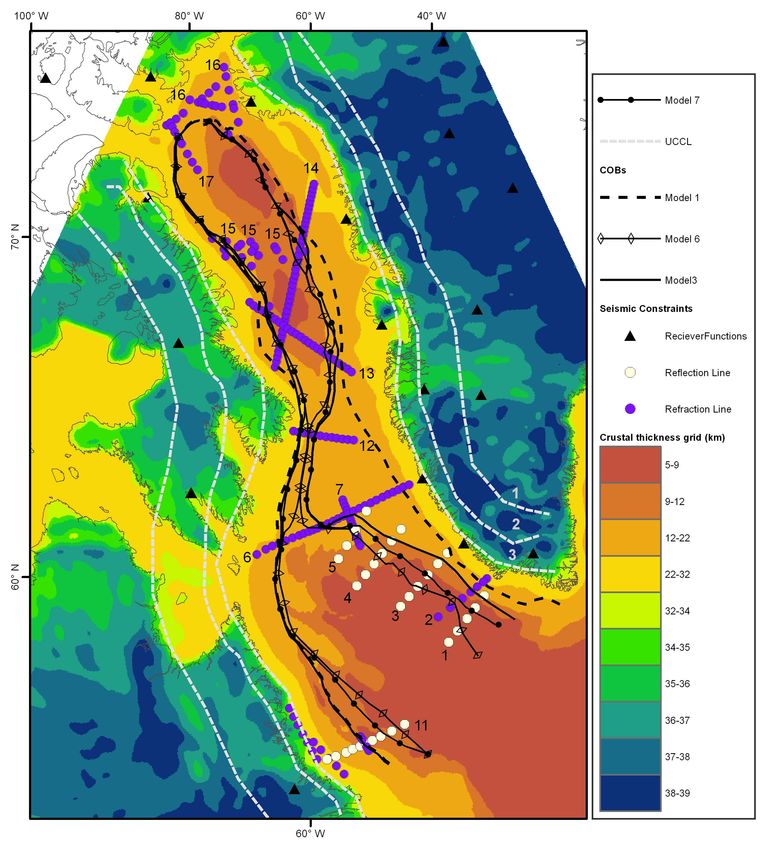
462                                      M. Hosseinpour et al.: Full-fit reconstruction of the Labrador Sea and Baffin Bay

spreading anomalies could be used to constrain relative plate
motions (Roest and Srivastava, 1989). This appears question-
able in the light of subsequently collected seismic data, yet
the anomaly identifications and reconstructions derived from
these interpretations are still used within global-scale com-
pilations (Torsvik et al., 2008; Müller et al., 2008; Seton
et al., 2012). More recent reconstruction models only con-
sider seafloor spreading since chron 27 (63 Ma), the earli-
est undebated spreading anomalies (Oakey, 2005; Oakey and
Chalmers, 2012).
   In this paper we investigate the full-fit configuration of
Greenland and North America in the light of available geo-
physical and geological data. The distribution of crustal types
in the margins of Labrador Sea and Baffin Bay were deter-
mined using interpreted seismic lines and other geophysical
data to extract the limits of continental deformation. A map
of crustal thickness was derived by inversion of gravity data
constrained by Moho depth estimates from seismic refrac-
tion profiles and receiver functions. Next, the extended con-
tinental crust within the conjugate margins was restored to
determine the pre-rift extent of each plate. These boundaries
are used as quantitative constraints in generating new poles
of rotation for the full-fit configuration of North America and
Greenland. We show that previous reconstructions overesti-
mate the amount of closure between the two plates. Our new
reconstruction, incorporating more recent evidence of the ex-
tent of continental crust, reduces the gaps in the Labrador Sea
and overlaps in Davis Strait and Baffin Bay which occurred
in previous reconstructions of this region.

2     Regional tectonic models

Several authors have presented poles of rotations that de-        Fig. 1. Bathymetry of the Labrador Sea, Davis Strait and Baf-
scribe the relative motions of Greenland and North Amer-          fin Bay (Louden et al., 2004). The seismic refraction and reflec-
ica between the onset of Mesozoic rifting and cessation of        tion lines discussed in this paper are shown as thick black lines
seafloor spreading at chron 13 time (34 Ma). Rowley and           1: Chalmers (1997) line BGR77-17; 2: Chian and Louden (1994)
Lottes (1988) generated stage poles of rotation of Greenland      line88R2; 3: Chalmers (1997) line BGR77-21; 4: Chalmers (1997)
relative to North America in the context of reconstruction        line BGR77-12; 5: Chalmers (1997) line BGR77-6; 6: Funck et
of the North Atlantic and Arctic. This reconstruction took        al. (2007) Nugget line1; 7: Gerlings et al. (2009) NUGGET line2; 8:
into account both onshore geology and offshore geological         Keen et al. (2012) line TGS1; 9: Keen et al. (2012) Profile1 (Gravity
                                                                  Profile); 10: Keen et al. (2012) line TGS3; 11: Chian et al. (1995a)
and geophysical data including magnetic anomalies, frac-
                                                                  line90R1; 12: Suckro et al. (2013) line AWI-20080700; 13: Funck
ture zones and syn-rift extension data. Dunbar and Sawyer
                                                                  et al. (2012) line AWI-20080600; 14: Suckro et al. (2012) com-
(1989) created another full-fit reconstruction for the cen-       posite line consisting of AWI-20080500 and AWI-20100400; 15:
tral and North Atlantic including the Labrador Sea with a         Keen and Barret (1972); 16: Harrison et al. (2011); 17: Harrison et
methodology similar to this study as it treats the continents     al. (2011); line3c and Reid and Jackson (1997) line 4. BBF: Baffin
as non-rigid in the rifting phase. They estimate continental      Bay Fan; FSC: Fylla Structural Complex; HB: Hopedale Basin.
extension from total tectonic subsidence rates of margins and
seismic studies and restored the continent-ocean boundaries
(COB)s to their pre-rift configurations. Roest and Srivastava
                                                                    A more recent reconstruction for the opening of the
(1989) and Srivastava and Roest (1999) introduced poles of
                                                                  Labrador Sea and Baffin Bay was presented in Oakey (2005)
rotation from the break-up stage (118 Ma) up to the end of
                                                                  and Oakey and Chalmers (2012), who combined Roest and
seafloor spreading (34 Ma) in the Labrador Sea based on new
                                                                  Srivastava (1989) magnetic anomaly picks for chrons 27 to
interpretation of linear magnetic anomalies, gravity data and
                                                                  13 (63 to 34 Ma) from the Labrador Sea with new picks from
fracture zones in this area.
                                                                  Baffin Bay. They presented new poles of rotation for the 24R

Solid Earth, 4, 461–479, 2013                                                                   www.solid-earth.net/4/461/2013/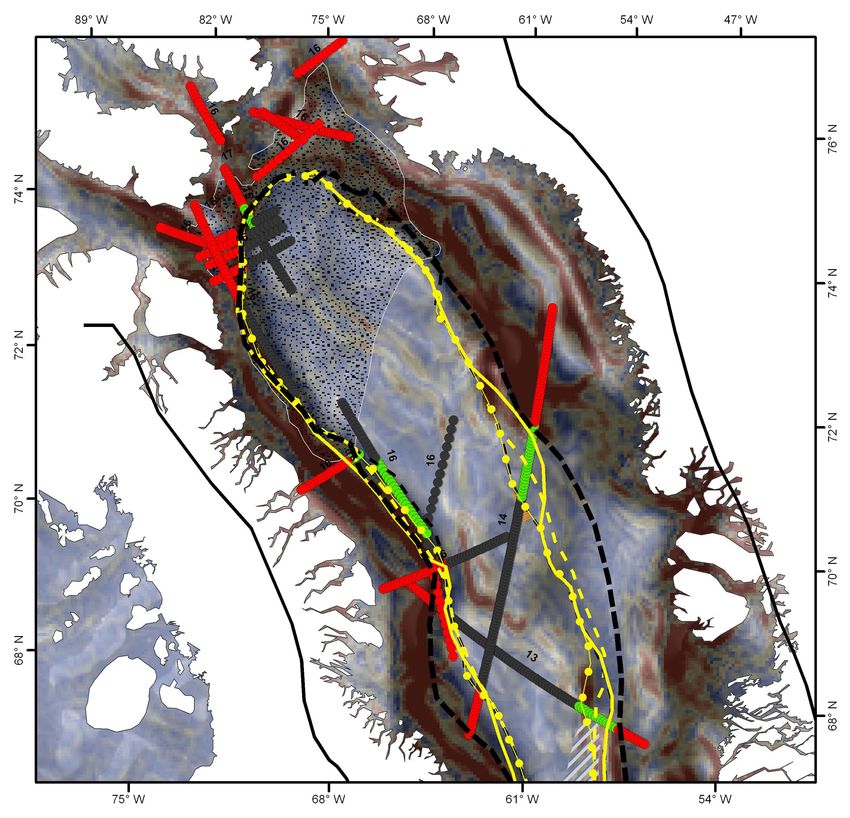
M. Hosseinpour et al.: Full-fit reconstruction of the Labrador Sea and Baffin Bay 463
interval, which correlates with the start of seafloor spread-
ing between eastern Greenland and Europe, but no new poles
for the earlier rifting. Significantly, these studies do not use
spreading anomalies for chrons older than chron 27 on the
grounds that these anomalies, used in the reconstructions of
earlier authors, were located within the COT and are not true
spreading isochrons. This debate is important both for recon-
structions of the early seafloor spreading and for delineating
and restoring the extended continental crust within each mar-
gin, and is discussed further in the next section
3 Tectonic setting
Rifting and the extension of the Labrador Sea started ei-
ther in the late Jurassic (160 Ma) based on dating of coast-
parallel dykes in SW Greenland or the early Cretaceous
(140 Ma), on the basis of distinguishing and dating syn-rift
sediments from wells on both margins (Chain and Louden,
1994). These sediments were deposited on top of rift-related
volcanics in grabens and half-grabens that formed during
continental extension (Srivastava and Roest, 1999; Chalmers
and Pulvertaft, 2001). Seafloor spreading in the Labrador Sea
started along a branch of the mid-Atlantic in either the late
Cretaceous or early Palaeocene times (Roest and Srivastava,
1989; Keen et al., 1993; Srivastava and Roest, 1999; Chian
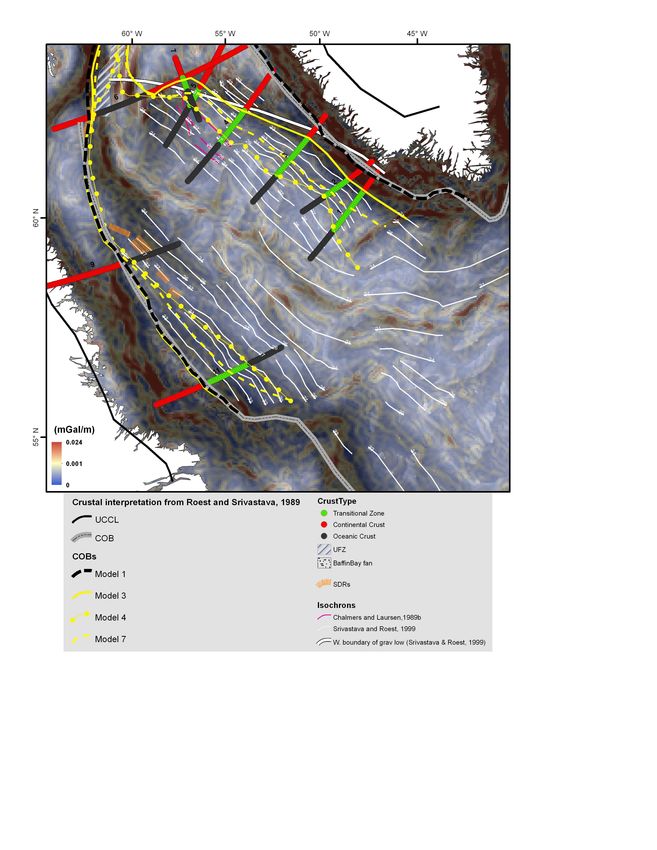
et al., 1995a; Chalmers and Laursen, 1995; Chalmers and Fig. 2. Interpreted crustal structure and alternative COB models in
Pulvertaft, 2001; Keen et al., 2012) and ceased about 35 Ma the Labrador Sea shown overlying Bouguer gravity (derived from
(chron 13), leaving an extinct spreading centre in the middle EGM08). UCCL (black) line is the same for all models. Four al-
of the basin. The existence of oceanic crust in Baffin Bay was ternative COB interpretations are shown: model 1 (dashed black
first shown in seismic refraction lines. Magnetic anomalies line) is based on Roest and Srivastava (1989) crustal interpreta-
along these lines were determined in two different directions tion, model 3 (continuous thick yellow line) is the most landward
– NNW–SSE and NW–SE – in this area. These lineations COB (same as model 2 in the Labrador Sea), model 4 (yellow
were interpreted as Palaeocene and Eocene extinct spreading line with circles) is the most oceanward COB (same as model 5
ridges (Keen and Barrett, 1972; Keen et al., 1974; Chalmers in the Labrador Sea) and Model 7 (dashed yellow line) interprets
the COB within the range of the transitional zone (same as model 6
and Pulvertaft, 2001; Oakey, 2005).
in the Labrador Sea). The numbering for seismic lines is the same
The age of the earliest seafloor spreading magnetic anoma-
as Fig. 1.
lies within the Labrador Sea is controversial. The uncer-
tainty originates from differing interpretations of the nature
of crust within the COT between unequivocal continental and
oceanic crust in both margins. Roest and Srivastava (1989) these anomalies as being a result of magmatic intrusion into
interpreted this zone as oceanic crust containing linear mag- highly thinned and stretched continental crust based on inter-
netic anomalies 31–33 formed during slow seafloor spread- pretation of reflection seismic profiles and that the oldest true
ing (Fig. 2). Other authors interpreted this crust as exhumed seafloor spreading anomaly is chron 27 (Fig. 2).
and serpentinised mantle or high-velocity igneous crust over- The nature of the crust within Davis Strait is also debated.
lain by thin oceanic basalts, highly fractured and hydrother- Chalmers and Pulvertaft (2001) describe the entire crust in
mally altered (Chian and Louden, 1994; Lundin and Dore, Davis Strait as continental, while Srivastava (1983) described
2011; Keen et al., 2012). Some other studies (Chian and sedimentary basins flanking Davis Strait High as oceanic,
Louden, 1994, Chian et al., 1995a, b; Reston, 2009; Dickie et whereas they stated that the nature of the crust in the base-
al., 2011) conclude that seafloor spreading starts sometimes ment high of Davis Strait could be described as continental.
between chron 31 and chron 27. This interpretation is based Several studies (Funck et al., 2007, 2012; Keen et al.,
on data derived from seismic lines, subsidence history and 2012; Suckro et al., 2013) propose that the Ungava Fault
stratigraphic characteristics of both margins. Nonetheless, Zone (UFZ) in Davis Strait acted as a leaky transform fault
Chalmers (1991), Chalmers and Laursen (1995), Chalmers (Fig. 3) and this extensional phase thinned the continental
and Pulvertaft (2001) and Funck et al. (2007) interpreted crust, allowing melted material from the proto-Iceland plume
www.solid-earth.net/4/461/2013/ Solid Earth, 4, 461–479, 2013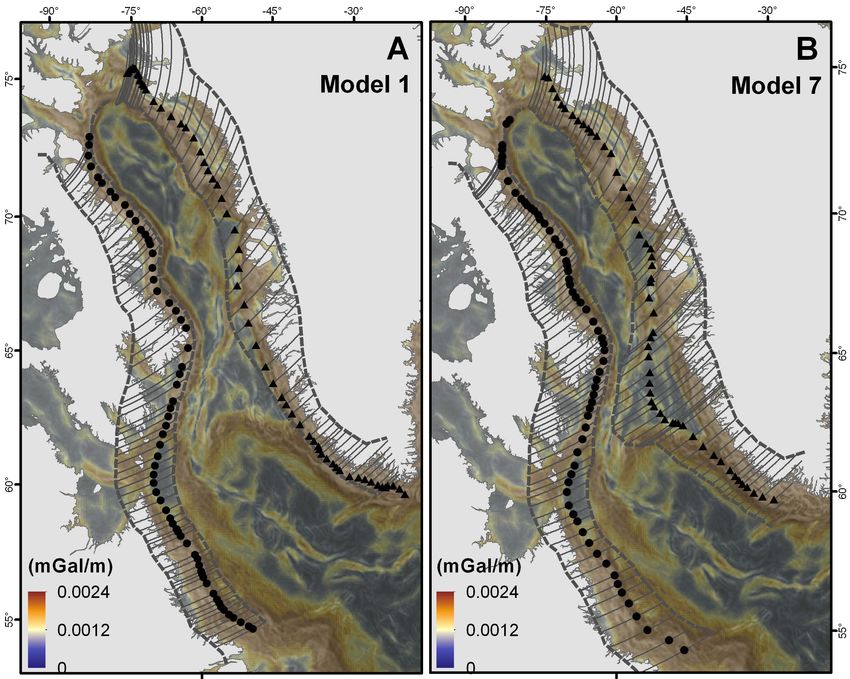
464                                        M. Hosseinpour et al.: Full-fit reconstruction of the Labrador Sea and Baffin Bay

Fig. 3. Interpreted crustal structure and alternative COB models in
Davis Strait. Key is the same as for Fig. 2.

to penetrate and fill it as new oceanic crust (Storey et al.,         Fig. 4. Interpreted crustal structure and alternative COB models in
1998; Funck et al., 2007) or as a mixture of continental crust        Baffin Bay. Key is the same as for Fig. 2.
and plume related material (Keen and Barrett, 1972).
   The Oakey and Chalmers (2012) reconstruction of chron
27–25 suggests a Palaeocene extensional phase along the
UFZ continued as a transpressional tectonic regime during             4     Methodology
the Eocene. In their model, this structural inversion leads to
the formation of the Davis Strait High, a structural feature          4.1    Delineation of crustal types across the COT
that resulted from over-thrusting of Precambrian and Ordovi-
cian continental units onto Palaeogene volcanic rocks.                The distribution of crustal types and the nature of the COT
   Uncertainty in the extent of continental crust and nature          within the study area remain poorly constrained. For this rea-
of the COT continues northward of Davis Strait in south-              son, we investigate end-member cases for the extent of conti-
ern Baffin Bay mostly on the Greenland margin. Funck et               nental crust within the COT for each margin based on avail-
al. (2012) interpret a northward extension of the UFZ as a            able seismic profiles, using a simple classification scheme
continuation of the leaky transform fault. Remnants of con-           similar to the approach of Crosby et al. (2011) (Fig. 5).
tinental crust or a transform fault associated with UFZ lay           We mapped the most landward position of “certain” oceanic
between this zone and normal oceanic crust of Baffin Bay              crust and the most oceanward position of “certain” stretched
(Chalmers and Pulvertaft, 2001; Funck et al., 2012). Another          continental crust. Determining these two boundaries relies
interpretation defines this zone as Palaeocene oceanic crust          upon interpretations of the crustal nature in seismic profiles
(Oakey and Chalmers, 2012; Funck et al., 2012; Suckro et              along both margins in different studies. This interpretation is
al., 2012). In comparison, along the Baffin Island margin the         mainly based on changes in P wave velocity, crustal thick-
continent-ocean boundary is much sharper, recognisable by             ness, observation of detachment faults and seaward dipping
a strong positive gravity high all along the margin (Fig. 4).         reflectors (SDRs), along with information obtained from ex-
   Both margins in the northernmost area of Baffin Bay have           ploration wells wherever they exist. The nature of the inter-
been interpreted as non-volcanic with basement highs and              vening crust is open to interpretation. Importantly for our re-
faulted continental crust, a rough basement of exhumed and            constructions, it is unclear how much of the material mapped
serpentinised mantle and submarine basalts within the in-             within the present-day crust within these zones was part of
terpreted COT, and smoother oceanic crust with only weak              the crust before the rifting, and how much was added, for ex-
magnetic anomalies (Whittaker et al., 1997; Skaarup et al.,           ample due to igneous intrusion or mantle exhumation. The
2006). Oceanic crust terminates in northern Baffin Bay at             crust underneath Davis Strait has been considered alterna-
about 76◦ N (Reid and Jackson, 1997; Oakey and Stephen-               tively as completely continental (Chalmers and Pulvertaft,
son, 2008).                                                           2001; Gerlings et al., 2009) or mostly continental with a
                                                                      narrow strip of Palaeocene oceanic crust in the southwest-
                                                                      ern boundary of Davis Strait High that could be the result
                                                                      of a Palaeocene extensional phase (Funck et al., 2007, 2012;

Solid Earth, 4, 461–479, 2013                                                                      www.solid-earth.net/4/461/2013/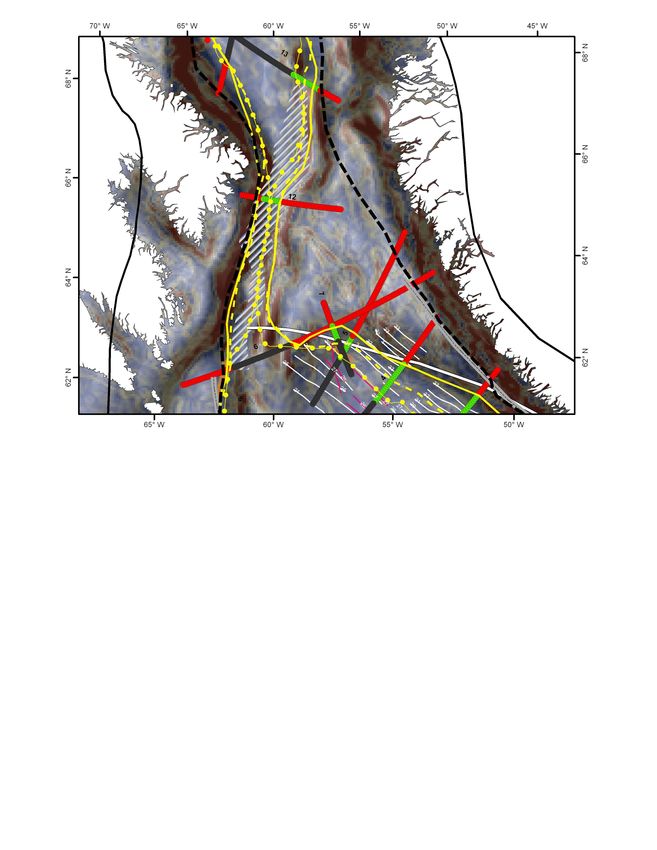
M. Hosseinpour et al.: Full-fit reconstruction of the Labrador Sea and Baffin Bay 465
1. BGR 77-17 Chalmers, 1997 3. BGR 77-21 Chalmers, 1997 America. These different models can be summarised as fol-
lows:
1. An extremely landward COB based on the definition of
Srivastava and Roest (1989). This model assumes that
the COB lies at the edge of the continental shelf along
the Greenland margin. The position of this boundary
4. BGR 77-12 Chalmers, 1997 5. BGR 77-6 Chalmers, 1997 is less clear on the Labrador margin because thinned
and extended continental crust is wider here (Srivas-
tava and Roest, 1999). Further north, through Davis
Strait, a more landward COB implies oceanic crust
for the area and follows the continental shelf in both
Greenland and Baffin Island margins.
6. NUGGET Line 1. Funck et al, 2007 7. NUGGET Line 2. Gerlings et al, 2009
2. The most landward COB (within the limits of cur-
rent seismic interpretations). The COB is located at the
landward limit of the COT and assumes that the entire
Davis Strait underlain with continental crust.
3. The same as (2) in the Labrador Sea and Baffin Bay
but assumes the existence of a narrow strip of oceanic
9. Gravity Profile 1. Keen etal, 2012 11. 90R 1. Chian etal, 1995
crust described as Ungava leaky transform fault pass-
ing through the western edge of the Davis Strait High.
4. The most oceanward COB (within the limits of current
seismic interpretations). The oceanward boundary of
the COT was taken as the COB in the Labrador Sea
2. Seismic line 20100700. Suckro et al, 2012 13.Seismic line 600. Funk et al, 2012 and Baffin Bay. This model assumes the presence of
continental crust across the entire Davis Strait.
5. The same as (4) but assuming the UFZ is a leaky trans-
form fault and that Davis Strait contains oceanic crust.
6. The COB falls within the COT permitted by seismic
nes AWI-20080500 and AWI-20100400. Suckro et al, 2012 17. Line 4. Reid and Jackson, 1997,
reflection data. In the Labrador Sea the COB is lo-
cated landward of chron 31 (70 Ma) assuming this
isochron as the first seafloor spreading anomaly in this
region. This model is based on the assumption that
Davis Strait is continental.
7. The same as (6) but with narrow strip of ocean crust in
949 Davis Strait.
Fig. 5. Seismic profiles showing crustal type interpreted from differ-
950 Figure 5. locations
ent studies, Seismic profiles
shown in Figs.showing
1 to 4. Red crustal type
– continental interpreted
crust; from different studies,
4.2 Generating the crustal thickness grid
green – transitional crust; grey – oceanic crust; yellow – sediments.
Coloured lines show crustal thickness computed using gravity in-
951 locations shown in Figs. 1 to 4. Red – continental crust, green – transitional
We derived a map ofcrust, grey
crustal -
thickness for the Labrador Sea
version: blue for initial crustal thickness of 37 km and density of
−3
500 kg m , red for initial crustal thickness of 38 km and density and Baffin Bay. This grid enables us to distinguish the un-
952 oceanic crust,
−3 yellow - sediments. Coloured lines show
of 450 kg m , and green for initial crustal thickness of 40 km and crustal thickness
stretched computed
continental crust using
boundary (UCCL) where the con-
density of 400 kg m−3 . tinental crust starts thinning at the onset of rifting, and thus
953 gravity inversion; blue (for initial crustal thickness of 37km and
with density of
recognising 500kg/m3),
this limit it is possible to restore the COB
to its pre-rift location. Generating the crustal thickness grid
954 red (for initial crustal thickness of 38km and density of 450kg/m3)
Keen et al., 2012; Oakey and Chalmers, 2012; Suckro et al., and greenby
has been performed (for initial of gravity data using the
inversion
2013). method of Chappell and Kusznir (2008). The starting point
955 crustal thicknessalternative
We generated of 40km andplatedensity of 400kg/m3).
reconstructions using the for this method is the global free-air gravity anomaly compi-
end-member scenarios for the COT, allowing us to investi- lation of Sandwell and Smith (2009). We estimated the grav-
gate the effect of uncertainty in the extent of continental crust ity effects of bathymetry (Divins, 2004) (Fig. 6a) and sedi-
on the full-fit reconstruction between Greenland 38 and North ment layers (Louden et al., 2004; Divins, 2003; Bassin et al.,
www.solid-earth.net/4/461/2013/ Solid Earth, 4, 461–479, 2013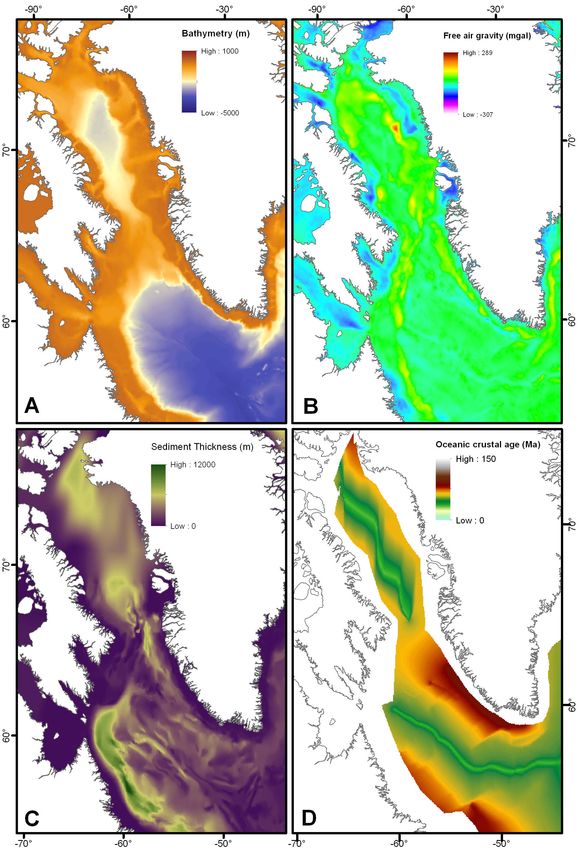
466                                        M. Hosseinpour et al.: Full-fit reconstruction of the Labrador Sea and Baffin Bay

                                                                      Fig. 7. Crustal thickness grid computed using the gravity inversion
                                                                      method. We defined three sets of UCCL for conjugate margins to
                                                                      examine the effect of changing the unstretched crust limit of re-
                                                                      stored COBs. UCCL number 1 is the most inland limit and corre-
                                                                      sponds to the crustal thickness ∼ 40 km. Numbers 2 and 3 represent
                                                                      the limit of ∼ 37 and ∼ 34 km respectively. The seismic line num-
                                                                      bers are the same as Fig. 1. Receiver functions on Greenland are
                                                                      from Dahl-Jensen et al. (2003). The North American receiver func-
Fig. 6. Grids used to generate crustal thickness maps based on        tions derived from Darbyshire (2003) and Ramesh et al. (2002).
the gravity inversion method of Chappell and Kusznir (2008). (A)
Bathymetry (Louden et al., 2004) (B) free-air gravity (Sandwell and
Smith, 2009) (C) sediment thickness (Louden et al., 2004; Divins,     the lowest RMS to produce the crustal thickness grid. These
2003; Bassin et al., 2000). (D) Age grid modified from Müller et      sensitivity tests are discussed in detail in Appendix A and
al. (2008).                                                           Fig. A1.
                                                                         We investigated the possibility that our crustal thickness
                                                                      grids in Davis Strait and southern Baffin Bay included ig-
2000; Fig. 6c) and subtracted these from the observed free-air        neous material added to the continental crust during the pas-
gravity. The gravity effect of mantle thermal variations was          sage of the proto-Icelandic plume beneath this area around
estimated on the basis of seafloor age (Müller et al., 2008;          70 Ma (Lawver and Müller, 1994). Such igneous material has
Fig. 6d). The need to correct for mantle density variations           been reported along seismic lines AWI-20080600 (Funck et
is supported by the 2-D gravity model of Keen et al (2012),           al., 2012), AWI-20100700 (Suckro et al., 2013), NUGGET
who showed that a lower mantle density was necessary be-              line 1 (Funck et al., 2007) and NUGGET line 2 (Gerlings et
neath the Labrador Sea compared to the flanking continents            al., 2009) and WA Line (Gohl and Smithson, 1993), where
in order to match gravity and seismic observations. The re-           high-velocity lower crust is reported. The thickness of inter-
maining gravity signal is inverted using the method of Parker         preted igneous crust reaches 9 km. The igneous activity asso-
(1972) to derive a map of depth to the Moho (Fig. 7). A com-          ciated with the passage of the Iceland plume has a Palaeocene
plete description of the workflow is provided in Appendix A.          age (70–57 Ma) (Storey et al., 1998) and hence postdates
Crustal density, initial crustal thickness and the seafloor age       the rifting period. Our reconstruction methodology relies on
grid influence the results of this method, so we performed            restoring the volume of continental crust that existed before
sensitivity tests to investigate the influence of these parame-       rifting, so it is important to consider the potential error intro-
ters on the resulting crustal thickness and chose the combi-          duced by using crustal thickness grids that include a signifi-
nation of a reference crustal thickness of 37 km and a den-           cant volume of material added during or after rifting.
sity contrast across the Moho of 500 kg m−3 that results in

Solid Earth, 4, 461–479, 2013                                                                      www.solid-earth.net/4/461/2013/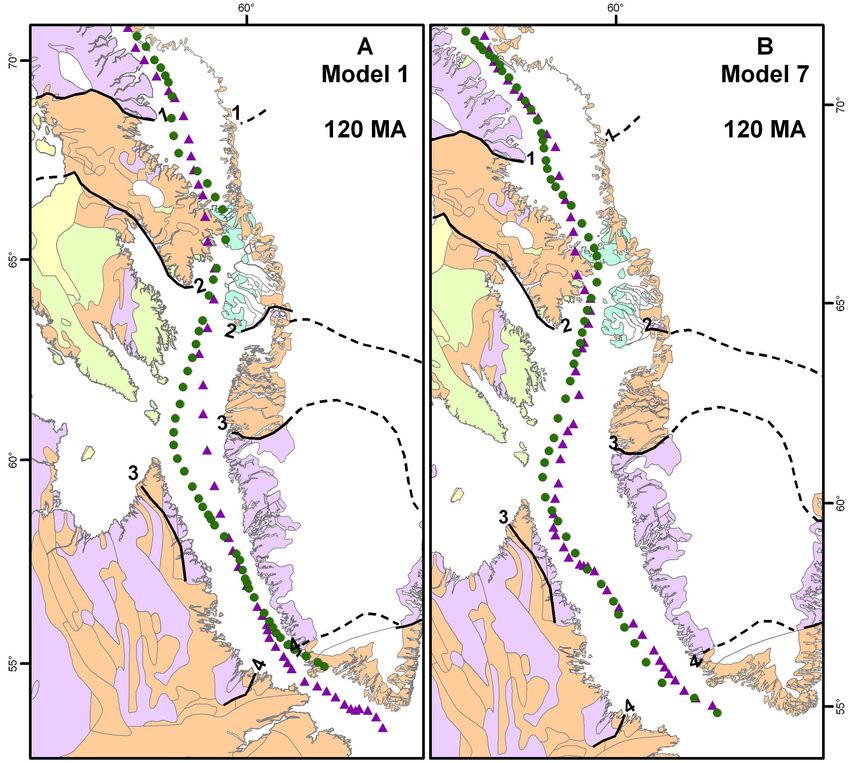
M. Hosseinpour et al.: Full-fit reconstruction of the Labrador Sea and Baffin Bay                                                    467

   For this step in our workflow we defined a region with
a high likelihood of being affected by the addition of late
Cretaceous–Tertiary igneous material. The zone spans the
northern Labrador Sea and Davis Strait and extends north-
ward to the southern Baffin Bay and Disko Island region
(Fig. 8). Constraints on the distribution and thickness of the
igneous crust come from the seismic lines mentioned above.
Where no seismic data are available, especially on the Green-
land margin near Disko Island from 67 to 72° N, we use the
western Greenland/Baffin Island Tertiary volcanic distribu-
tion maps of Chalmers and Pulvertaft (2001) and Skaarup et
al. (2006). The thickness of volcanic addition in these off-
shore regions is poorly constrained, but the total extrusive
sequence onshore varies from 3 to 5 km around Disko Island,
with 2 km suggested as a minimum estimate for the average
thickness across the onshore and offshore regions (Storey et
al., 1998). The considerable thickness of extrusives suggests
that an equivalent or greater thickness of intrusive volcanic
bodies in the lower crust could also be present (White et al.,
2008). In this study we assumed a thickness of igneous ma-
terial up to 4 km across the areas not constrained by seismic
profiles. The estimated thickness of igneous additions to the
stretched continental crust was subtracted from the crustal
thickness grid, and the restoration of COBs repeated with the
corrected crustal thickness grid.
   The resulting crustal thickness grid (Fig. 7) shows that
continental crustal thickness varies from around 40 km for
inland cratons of North America and Greenland to less than
9 km under extremely thinned and stretched continental crust       Fig. 8. The crustal thickness grid after elimination of igneous layers.
adjacent to both margins. Figure 9 illustrates the compari-        Thin grey contour lines show the extent and the amount of igneous
                                                                   crust in km. Seismic data that has been used in determining the
son between Moho depths from seismic experiments and the
                                                                   amount and distribution of igneous material have been shown in
Moho depth extracted from gravity inversion along each of
                                                                   violet circles. The seismic line numbers are the same as Fig. 1.
the seismic profiles being used in this study (Fig. 1). We also
compare our database of seismic refraction (violet circles in
Fig. 7) and receiver function (black triangles in Fig. 7) depths     The gamma factor γ is calculated using
(Jackson and Reid, 1994; Hall et al., 2002; Ramesh et al.,
2002; Darbyshire, 2003; Dahl-Jensen et al., 2003) with the         γ = (1 − 1/β).                                                     (2)
Moho depth contained within the CRUST2 model of global
crustal structure (Bassin et al., 2000). The comparison shows      This factor is sensitive to the addition of igneous material to
that the global grid gives typically deeper Moho compared          the crust as magmatic underplating and/or oceanic crust and
with individual seismic profiles and suggests that the grav-       thus is useful for showing the extent of thinned crust along
ity inversion method will yield more robust crustal thickness      rifted margins. Gamma varies from 0.5 for volcanic mar-
restoration.                                                       gins to 0.7 for normal and magma-poor margins (Kuzsnir,
   A lithospheric thinning factor (γ ) grid illustrates the im-    2009). Figure 10 shows the thinning factor grid for the entire
plications for crustal stretching of our crustal thickness grid.   study region overlain by COB lines for our preferred model.
The parameter γ is derived from the lithospheric stretching        In the magma-starved south Labrador Sea, COBs follow the
factor beta (β) and taking into account the addition of ig-        0.7 gamma contour, while it changes to 0.6 in the northern
neous material added to the crust during rifting:                  parts, where rifting was accompanied by excess magmatism.
                                                                   In Davis Strait the gamma grid shows a relatively thick crust
β = tc0/tc1,                                                (1)    with a thinning factor around 0.4–0.5. This over-thickened
                                                                   crust may reflect igneous crust or underplating in this area.
where tc0 is the initial unstretched continental crustal thick-    Along the southern Baffin Bay volcanic margins, COBs cor-
ness used to produce the crustal thickness grid and tc1 is the     respond to gamma factors of 0.6 to 0.7 on both margins. A
crustal thickness at present day.                                  92 000 km2 submarine fan complex referred to as the Baffin
                                                                   Fan covers most of this area (Fig. 10) (Harrison et al., 2011).

www.solid-earth.net/4/461/2013/                                                                      Solid Earth, 4, 461–479, 2013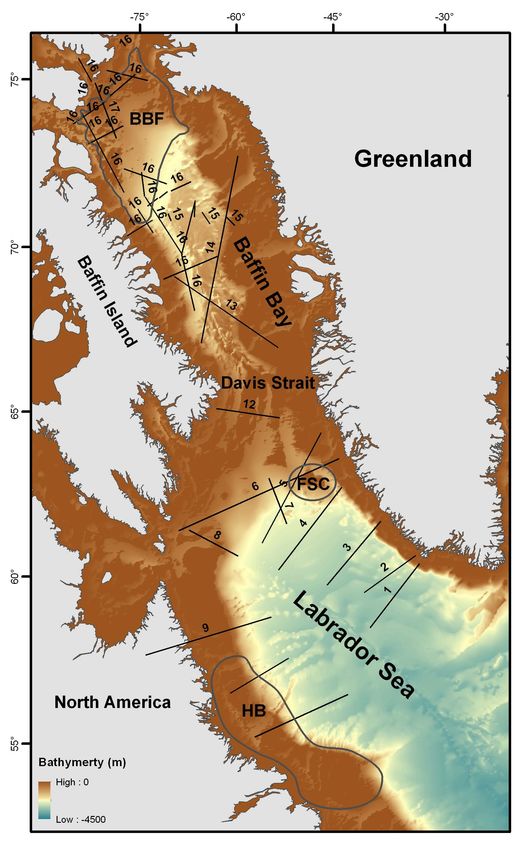
468                                                                           M. Hosseinpour et al.: Full-fit reconstruction of the Labrador Sea and Baffin Bay

                                50
                                                                            Seismic versus CRUST2.0
                                                                            Seismic vs Gravity
                                45                                          Vintage Seismic vs Gravity

                                40

                                35
 Depth to Moho from grid (km)

                                30

                                25

                                20

                                15

                                10

                                 5

                                 0
                                     0   5   10    15     20      25     30       35     40    45        50
                                               Depth to Moho from seismic refraction (km)

Fig. 9. Comparison of depth to Moho between independent seis-
mic interpretations presented in Fig. 1, a global crustal thick-
ness map (CRUST2 model) (Bassin et al., 2000) and our com-
puted crustal thickness from gravity inversion. Dark-grey circles
show seismic depths versus gravity-inversion-derived Moho depths.
Squares show the Moho depths from pre-2000 seismic studies ver-
sus gravity depth. Light-grey circles show seismic depths versus
CRUST2 model depths. Depths from CRUST2 model are typically
deeper compared to regional seismic data. The grey dashed line is a
1 : 1 trend.

This massive volume of sedimentary cover makes the grav-
ity data unable to detect basin slope topography, which leads                                                 Fig. 10. Crustal thinning factor (γ ) grid varies between 0 in un-
to greater uncertainty in computed crustal thickness in this                                                  stretched continental crust and more than 0.7, which is the represen-
region. Defining COBs in this area mainly relies on seismic                                                   tative of volcanic addition in the form of magmatic underplating or
profiles.                                                                                                     oceanic crust. The thick dashed line is our preferred COB (model 7)
                                                                                                              that remains approximately at γ = 0.5–0.7
4.3                                  Restoring extended crust between UCCL and COB
                                     boundaries

For each model, the extended continental crust between the                                                    crustal thickness changes from 30 to 46 km in North America
COB and UCCL was restored along each margin to an un-                                                         and 33 to 48 km in western and central Greenland.
stretched thickness. The UCCL has been placed to where                                                           Welford and Hall (2013) produced a crustal thickness
the crust starts thinning and the crustal thickness grid was                                                  map for the Labrador Sea and generated maps of estimated
used to derive this limit (Fig. 7). However, we used seis-                                                    stretching factors. They also noted large differences in the
mic profiles and teleseismic data analysed via receiver func-                                                 thickness of unstretched crust beneath Labrador and Green-
tions in both North America (Hall et al., 2002; Ramesh et al.,                                                land, between 30 and 50 km, and compared stretching factors
2002; Darbyshire, 2003) and Greenland (Gohl and Smithson,                                                     assuming both a uniform crustal thickness before stretching
1993; Jackson and Reid, 1994; Dahl-Jensen et al., 2003) to-                                                   of 35 km, and with the initial crustal thickness varying from
gether with gravity-inversion-derived crustal thicknesses on                                                  ∼ 50 km beneath southern Labrador to ∼ 34 km beneath Baf-
the Greenland side (Braun et al., 2007; Welford and Hall,                                                     fin Island. They found that the stretching factors were not
2013) to further double-check and reinforce our interpreted                                                   significantly altered between these two approaches, with the
UCCL location. Previous studies suggest that the unstretched                                                  exception of the offshore extension of the Grenville province

Solid Earth, 4, 461–479, 2013                                                                                                               www.solid-earth.net/4/461/2013/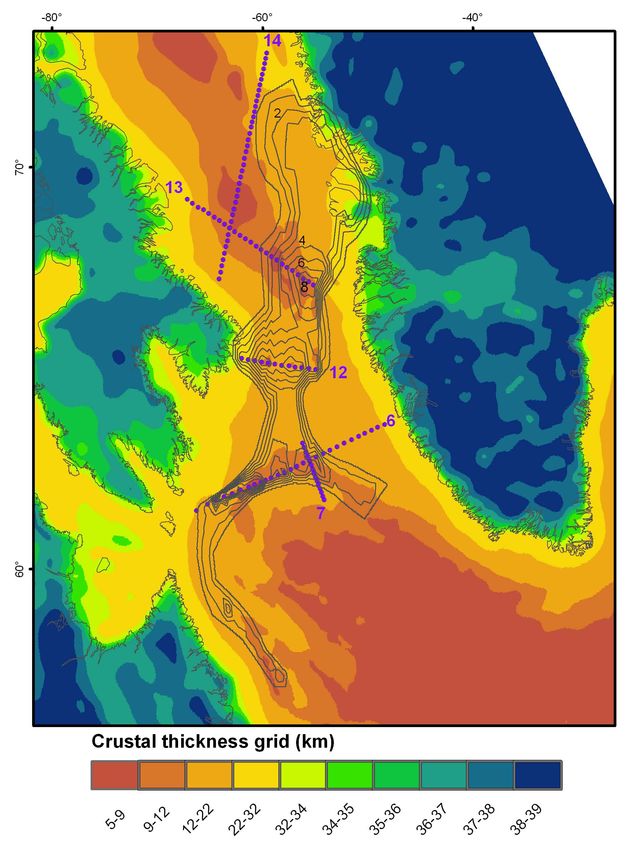
M. Hosseinpour et al.: Full-fit reconstruction of the Labrador Sea and Baffin Bay                                              469

in southern Labrador, where the crustal thickness from grav-           2. Baffin and Disko Bugt suture zones (DBS) that closed
ity data was underestimated.                                              at approximately 1.88 Ga. The Baffin suture zone
   Based on this information and to resolve the effect of                 thrust the Meta Incognita microcontinent over the
changing this limit for the COB restoration and final fit, we             Cumberland Batholith in North America. Similarly,
defined three sets of UCCLs at 35, 37 and 40 km crustal                   closure of the DBS in Greenland led to the expansion
thickness boundaries and restored the COBs of model 7 with                of the Aasiaat domain over the Rae craton (St-Onge et
each of them (Figs. 7 and B3). Distribution of the crust with             al., 2012).
thickness more than 40 km is limited, so we set the upper
limit of the UCCL range to around 40km. The location of                3. Nordre Isortoq suture zone (NIS) (1.86–1.84 Ga) that
the UCCL for all other models is fixed at 37 km and the                   formed due to collision of the Aassiaat domain with
only difference is in the position of COBs along both mar-                the Archean North Atlantic craton along the northern
gins. We used the stage poles of rotation of Roest and Sri-               boundaries of the latter.
vastava (1999) for restoration, which represent the direc-
                                                                       4. Kanairiktok shear zone (1.89–1.8 Ga) that separates
tion of the motion of extended continental crust during the
                                                                          Makkovik province on the Canadian side and Ketilid-
rifting between Greenland and North America. These stage
                                                                          ian orogen on the Greenland side from the Archean
poles of relative motion were used to generate small cir-
                                                                          North Atlantic craton.
cle motion paths between two limits of extended continen-
tal crust. Crustal thicknesses from the crustal thickness grid
are then extracted along these small circles to estimate the       5   Results
thickness of crust between two boundaries. Next, we calcu-
late the length of this crust before extension and restore the     We carried out restoration and reconstruction of RCOBs for
crust to its initial reference thickness before being subjected    the all end-member models discussed above. Restored COB
to extension. Applying the change in crustal length along the      locations and small circle paths for model 1 and 7 are pre-
given small circle gives the restored COB (RCOB). Repeat-          sented in Fig. 11; the restored COBs and small circle paths
ing this process for all small circles along the margins results   for the other proposed models can be found in Appendix B,
in a continuous model for the RCOB location.                       Fig. B1. Model 1 is very similar to the Srivastava and Roest
                                                                   (1989) model in terms of what they proposed as the location
4.4     Reconstruction of restored COBs                            of COB, which put the COB in the most landward position
                                                                   compared to all other models. Model 7 resulted in the best fit
For each model described above, we use the generated               amongst all examined models
RCOBs to compute poles of rotation for the pre-rift fit               The most dramatic differences in the position of the RCOB
between Greenland and North America. The computation               occur in the Greenland margin in the northern Labrador Sea
of Euler poles of rotation has been performed using the            near Davis Strait. Davis Strait shows the greatest amount of
Hellinger (1981) least-squares fitting method. This method         extension in all models, which is mostly concentrated on the
is typically applied to reconstructions of seafloor spreading      Greenland margin. The smallest amount of continental exten-
using isochrons and fracture zones as constraints. Here, we        sion was observed in the model 1, where the most landward
apply the method to derive full-fit poles of rotation in the       COB follows the continental slope (Fig. 11a). The amount
same manner as used for the Australia–Antarctic margins            of continental extension in this model varies between 6 and
by Williams et al. (2011). The Euler pole of rotation calcu-       100 km in both margins. This amount of extension is the least
lated for the alternative models from the beginning of rift-       in comparison with the other models, implying less continen-
ing (120 Ma) to the start of seafloor spreading (chron 27,         tal thinning.
63 Ma). All reconstructions are using crustal thickness grids         The position of the restored COBs along both margins in
derived from the gravity inversion method in which igneous         Baffin Bay does not change significantly for all tested mod-
crust added to the thinned continental crust is removed. North     els. In all models, small circles show a NW–SE direction
America is considered as the fixed plate in all reconstruc-        of extension and are perpendicular or highly oblique to the
tions. The main inputs for geometrical fitting of the margins      coastline.
are the RCOBs, which constrain the amount of closure be-              Full-fit reconstructions for our preferred model 7 and for
tween the two plates. To constrain the lateral juxtaposition of    model 1 are shown in Fig. 13. Table 1 summarises the loca-
Greenland and North America prior to rifting, we use older         tion of Euler poles for full-fit reconstructions and their errors
structural features and terranes mapped and correlated be-         for all models, whereas Table 2 reviews the parameters used
tween these two continents as follows (Fig. 12):                   to calculate the rotation poles. See Appendix B, Fig. B2 for
      1. Southern border of Committee–Melville orogen              reconstructions for the other models presented here.
         (CMO) separating this area in the north from Foxe–           Model 1 shows a reasonable fit in the southern Labrador
         Rinkian fold belt in the Baffin Island and Greenland      Sea and Baffin Bay, but further north there is a major gap in
         margins (Dawes, 2009).                                    the northern Labrador Sea near Davis Strait and an overlap

www.solid-earth.net/4/461/2013/                                                                   Solid Earth, 4, 461–479, 2013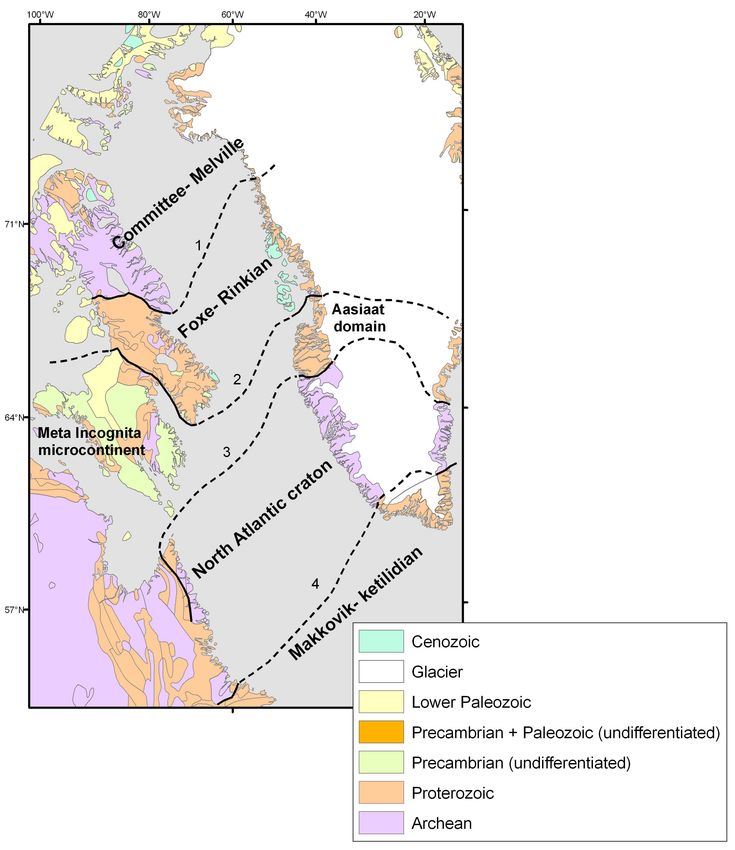
470                                        M. Hosseinpour et al.: Full-fit reconstruction of the Labrador Sea and Baffin Bay

Fig. 11. Restored COBs on North America and Greenland margins
together with small circle paths showing the direction of restora-
tion. The dashed lines are the UCCL and COB lines before the
restoration was performed. The background is total horizontal gra-
dient of Bouguer gravity map. Model 1: Srivastava and Roest (1989)
COBs. Model 7: our preferred model assuming the COB in the
range of COT, and UFZ as leaky transform fault in Davis Strait.
Restored COB locations: triangles – Greenland margin; circles –
North American margin.                                               Fig. 12. Geological map of North America and Greenland
                                                                     (Bouysse, 2010) used for lateral correlation of two margins. We use
                                                                     sedimentary formations and rock units older than Palaeozoic to cor-
north of Disko Island (Fig. 13). This model is very similar          relate the full-fit alignment of the conjugate margins. Numbers refer
to the Srivastava and Roest (1989) reconstruction for the on-        to structural features separating those units and formations that have
set of rifting except that model 1 locates Greenland slightly        been mentioned and discussed in more detail in the main text.
further south relative to North America.
   The most dramatic improvement in the fit reconstruction
of model 7 is achieved in the northern Labrador Sea and              and/or overlaps, leading to some suggestions that the two
Davis Strait, which are the two most problematic and contro-         plates need to be treated as non-rigid continents. Small
versial regions. This model reinforces the hypothesis of the         amounts of late Cretaceous–early Palaeogene extension in
existence of a narrow Palaeocene oceanic basin in that re-           Canada (Okulitch et al., 1990) was proposed for North
gion. Figure B2-H (model 8) demonstrates the full-fit recon-         America as a deforming plate for alleviating overlaps in
struction using the UCCL-COB borders of model 7, while               Davis Strait (e.g. Srivastava and Falconer, 1982 and Lawver,
it uses the crustal thickness grid excluded from the igneous         1990). The evidence for this extension comes from mapping
post-rift material. Model 8 appears to slightly increase the         features in Hudson Strait and Foxe Channel (Jackson and
adjustment of restored COBs, especially in the Labrador Sea          Ianelli, 1981). A recent study by Pinet et al. (2013) in Hud-
and Davis Strait when compared to model 7; however, due to           son Strait and Foxe Channel reported normal fault-dominated
lots of uncertainties in placement and the amount of under-          sub-basins with thicker sedimentary succession that are inter-
plated material, especially where we lack seismic data, this         preted as syn-rift strata. This study investigated the relation-
model should be treated more carefully. Our proposed mod-            ship between formation of these basins and the early rifting
els correlate juxtaposed Precambrian rocks in North America          of the Labrador Sea, but this connection is not clear, mainly
and Greenland margins well.                                          because of lack of information about the age of upper limit of
                                                                     sediment and the amount of extension happened in this area.
                                                                        An alternative mechanism to improve the pre-rift fit has
6     Discussion                                                     been to invoke deformation within Greenland. Studies in
                                                                     western Greenland support the existence of several shear
6.1    Non-rigid Greenland–North America                             zones within the boundaries of the Nagssugtoqidian orogenic
                                                                     belt (the area between structural features 3 and 4 in Fig. 13)
Previous attempts to reconstruct Cretaceous rifting between          (Bak et al., 1975; Wilson et al., 2006). Beh (1975) and Sri-
Greenland and North America have produced major gaps                 vastava and Faconer (1982) invoked a number of sinistral

Solid Earth, 4, 461–479, 2013                                                                      www.solid-earth.net/4/461/2013/
M. Hosseinpour et al.: Full-fit reconstruction of the Labrador Sea and Baffin Bay 471
Table 1. Full-fit rotation parameters for alternative models of Greenland relative to North America (fixed) discussed in this paper. The chron
27 pole of rotation derived from Oakey and Chalmers (2012) has also been represented.
Full fit (120 Ma)
Model Latitude Longitude Angle r κ̂ dF N s
(deg) (deg) (deg) (km)
1 63.92 −124.47 −13.51 946.01 0.12 116 127 4
2 61.00 −129.40 −11.16 644.74 0.16 106 117 4
3 62.82 −129.87 −11.28 634.35 0.17 109 120 4
4 59.98 −134.69 −9.67 818.34 0.15 123 134 4
5 60.88 −132.94 −10.00 672.62 0.17 116 127 4
6 59.73 −132.55 −10.23 769.08 0.13 106 117 4
7 61.67 −131.80 −10.47 678.16 0.15 107 118 4
8 64.18 −131.88 −10.67 435.79 0.23 104 115 4
Chron 27 27.8 −150.0 −3.75
Parameters are r , total misfit; κ̂ , estimated quality factor; dF, degree of freedom; N , number of data points;
and s , number of great circle segments. Model 8 uses the same COBs as model 7 except that the restoration
has been performed using the crustal thickness grid with igneous material subtracting from it.
Table 2. Rotation covariance for North America–Greenland recon-
structions.
Model a b c d e f
1 9.08 7.57 1.79 3.10 −9.56 7.31
2 1.11 3.29 2.75 2.77 −3.23 1.18
3 1.00 7.80 2.45 2.19 −2.27 9.94
4 1.12 −9.90 2.99 1.85 −2.56 1.20
5 8.80 5.66 2.17 2.06 −2.38 9.56
6 9.62 4.57 2.45 2.24 −2.62 1.09
7 9.63 9.13 2.39 2.13 −2.39 1.03
8 7.81 −1.20 2.12 1.96 −2.81 1.00
a b c
The covariance matrix is given by the formula κ1 × b d e × 10−g , where
c e f
the values “a ” to “f ” are given in radians squared.
shear zones crossing central Greenland on the basis of what
Beh et al. (1975) suggested considering geological informa-
tion and the physiography of the glacial channels running Fig. 13. Full-fit (120 Ma) plate reconstruction of North America–
through Greenland. A similar shear zone has been contem- Greenland margins. North America restored COB – green circles;
plated in a recent Arctic reconstruction (Winefield et al., Greenland restored COB – purple triangles. (A) Model 1 results
2011). These structures have been mapped only in the Ar- in a major overlap in the northern Labrador Sea near Davis Strait.
chaean and Proterozoic rocks near the margin and the con- (B) Model 7 minimises the mismatch in this area and results in a
tinuation of these tectonic features inland and under the ice good fit in both the Labrador Sea and Baffin Bay. Structural lines
are the same as Fig. 11 and are represented here to show the lateral
cover of the Greenland, and any reactivation and displace-
juxtaposing of the margins.
ment along these faults during late Cretaceous rifting is as
yet undocumented.
Our analysis suggests that full-fit reconstructions treating deformation within Greenland and/or North America is not
Greenland and North America as rigid blocks with deform- necessary to restore these plates to their configuration at the
ing margins achieve a relatively good overall fit, including in onset of rifting and opening of the Labrador Sea and Baffin
areas such as Davis Strait, where the distribution of crustal Bay.
types remains unclear. Our preferred model 7, as well as the
range of models presented here testing the sensitivity of our
results to different starting assumptions, shows that internal
www.solid-earth.net/4/461/2013/ Solid Earth, 4, 461–479, 2013472 M. Hosseinpour et al.: Full-fit reconstruction of the Labrador Sea and Baffin Bay
constrained reconstruction is ∼ 63 Ma (Oakey and Chalmers,
2012). We now use our preferred reconstruction and COT
configuration to investigate the diachronous transition from
continental rifting to the onset of formation of the transition
zone and seafloor spreading, assuming a constant rate and
direction of rotation of Greenland away from North Amer-
ica and considering possible deviations from this simple as-
sumption.
Reconstruction from 120 to 85 Ma shows that extending
continental crust during this time spans the entire region
in between North America and Greenland. At 85 Ma, Baf-
fin Bay is still underlain entirely by continental crust, but
further south crust now contained within the COT of the
Labrador margins has begun to form (Fig. 15a). By 69 Ma,
large regions of the Labrador Sea are underlain by COT crust
although, based on our preferred COBs from assimilation
of seismic data, continental connection persists at the junc-
tion between the Labrador Sea and Davis Strait (Fig. 15b).
Oblique opening of Davis Strait around this time suggests
that the oldest igneous crust within the UFZ, proposed as a
leaky transform fault (Funck et al., 2007, 2012), could be late
Cretaceous in age. Unequivocal chron 27 seafloor spreading
anomalies are observed in the Labrador Sea (Fig. 15c). The
existence of oceanic crust in Baffin Bay, possibly younger
than chron 27 (late Palaeocene, chron 26), has also been
proposed (e.g. Suckro et al., 2012; Oakey and Chalmers,
Fig. 14. Comparison of previously published and our computed Eu- 2012) that is consistent with our model. The reconstruction
ler poles with 95 % uncertainty ellipses. The numbers represent the
of Oakey and Chalmers (2012) predicts that the earliest ocean
models described in the text.
crust in Baffin Bay formed during broadly NE–SW spread-
ing, followed by a change to more oblique N–S extension be-
6.2 Comparing previous models and our preferred tween chrons 25 and 24 (57–54 Ma) (Fig. 15d). Reconstruc-
model tions constrained by seafloor spreading anomalies and frac-
ture zones suggest that this direction of relative motion per-
Figure 14 shows the comparison between the location of the sisted until the cessation of spreading between North Amer-
Euler poles and their uncertainty ellipses of our alternative ica and Greenland around chron 13 time (Roest and Srivas-
models together with the full-fit Euler poles from previous tava, 1989; Oakey and Chalmers, 2012; Suckro et al., 2012).
studies. The Euler poles resulting from different models pro- Seafloor spreading within Baffin Bay and the Labrador Sea
posed here vary within a very limited geographical range and occurred contemporaneously with strike-slip and transpres-
their error ellipses mostly overlap. The pole resulting from sional deformation within Davis Strait (Suckro et al., 2013).
model 1 is the closest to the rotation pole proposed by Sri- The discussion above assumes a uniform rate and direc-
vastava and Roest (1989). This similarity can be explained tion of relative motion during continental rifting and the
by the almost identical interpretations of these models con- formation of the transition zone. Other geological evidence
cerning the nature of the crust adjacent to both margins. Of is necessary to make such inferences. For example, Døss-
the previously published models, the full-fit rotation pole of ing (2011) presented a detailed study of the Fylla Structural
Rowley and Lottes (1988) is located closest to model 8. The Complex (Fig. 1) located on the western Greenland margin
smaller error ellipse of model number 8 compared with all in the north Labrador Sea near Davis Strait. The complex is
other models is noticeable. composed of rift basins that initiated in the late–early Creta-
ceous. Following a phase of major uplift, characterised by
6.3 Continental rift phase an erosional unconformity, further episodes of rifting oc-
curred in the Campanian and early Cenozoic. The inferred
Our reconstruction based on restoring extended continental stress regime changes significantly between these different
crust gives us a full-fit reconstruction pole at the onset of con- rift phases, with dominantly NE–SW extension in the late–
tinental rifting (∼ 120 Ma). Since the oldest reliable seafloor early Cretaceous followed a clockwise rotation on the exten-
spreading isochron within the Labrador Sea is chron 27, the sional stress direction to E–W to ENE–WSW by the early
next more recent time for which we have a quantitatively Campanian.
Solid Earth, 4, 461–479, 2013 www.solid-earth.net/4/461/2013/M. Hosseinpour et al.: Full-fit reconstruction of the Labrador Sea and Baffin Bay 473
Subsidence curves calculated from wells in the Hopedale
Basin (Fig. 1) consistently show the onset of rapid subsi-
dence around 70 Ma, interpreted to coincide with the onset of
seafloor spreading in the Labrador Sea (Dickie et al., 2012).
A limitation of using crustal thickness restoration is that
these data do not allow us to quantitatively constrain changes
in plate motion during the rifting. Our reconstruction de-
scribes the overall motion between Greenland and North
America from the beginning of rifting (∼ 120 Ma) until the
time of the earliest seafloor spreading anomaly (63 Ma),
which varies from ENE–WSW in the southern Labrador Sea
to NE–SW in Baffin Bay. The studies discussed above are
consistent with the overall motion implied by our reconstruc-
tion while providing evidence for distinct stages within this
overall motion. However, the available data are insufficient to
constrain this in a quantitative manner. As shown for the Aus-
tralian and Antarctic margin, reconstructions derived using
the method applied here are relatively insensitive to changes
in the direction of relative plate motions (Williams et al.,
2011). Hence our reconstruction forms a starting point for
more detailed models of Cretaceous continental rifting be-
tween Greenland and North America.
7 Conclusions
We derive a new full-fit reconstruction that restores the
Greenland and North American plates to their configuration
prior to Cretaceous rifting. In contrast to previous early Cre-
taceous reconstructions, our study incorporates new interpre-
tations of thinned and stretched crust in the margins of the
Labrador Sea, Baffin Bay and Davis Strait as either a conti-
nental or transitional crust consisting of a mixture of serpen-
tinised mantle with slivers of continental crust and igneous
material. We quantify the extension and thinning of continen-
tal crust and restore the COBs to their pre-rift configuration
and test the sensitivity of these results to different interpreta-
tions of the crustal types within the COT. The model that best
fits the entire region (model 7) was generated with a COB
within the bounds of all available seismic interpretations and
Fig. 15. Reconstruction of the rifting and seafloor spreading in the oceanward of magnetic anomalies previously interpreted as
Labrador Sea and Baffin Bay. The models use the rotation pole from chron 31 in the Labrador Sea. Within the best-fitting model,
model 7 UCCL and COBs (purple lines) for the rifting period (120 the UFZ is considered as a leaky transform fault that pro-
up to 63 Ma). Seafloor spreading (63 Ma and younger) has been re- duces a narrow strip of igneous crust through Davis Strait.
constructed using Oakey and Chalmers (2012) poles of rotation.
Our results imply that an acceptable fit between Green-
land and North America can be achieved without the need for
large-scale deformation within either these plates. Assuming
Tectonostratigraphic studies of the North American mar-
a constant rate and direction of rifting from the beginning
gin of the Labrador Sea also show an early rifting phase
of rifting to the start of seafloor spreading, our best defined
during the early Cretaceous, characterised by widespread ex-
model 7 shows the generation of post-rift material within the
tensional faulting and formation of grabens and half-grabens
present-day COT started in the southern Labrador Sea and
(Dickie et al., 2011). Regional unconformities in the mid-
propagated northward.
Cretaceous (100–83 Ma) are considered too early to be re-
lated to continental breakup, and may instead be related to
changes in the magnitude and/or direction of the stress field
(Dickie et al., 2012, and references therein).
www.solid-earth.net/4/461/2013/ Solid Earth, 4, 461–479, 2013474 M. Hosseinpour et al.: Full-fit reconstruction of the Labrador Sea and Baffin Bay
Appendix A After application of all the gravity corrections described
above, the remaining gravity signal is inverted using the
Mapping crustal thickness by gravity inversion method of Parker (1972) to derive a map of depth to the
Moho. The results are influenced by a range of assumptions
We derived a map of Moho depth for the Labrador Sea, involved, notably the density contrast across the Moho, and
Davis Strait and Baffin Bay by inversion of gravity data; our the reference Moho depth. (The thickness of crust corre-
method follows an approach similar to that used by Green- sponds to zero bathymetry and zero long-wavelength free-
halgh and Kusznir (2007) and Chappell and Kusznir (2008) air gravity; Alvey et al., 2008). We tested a range of pa-
to map crustal thickness at continental margins of the north- rameter combinations (Fig. A1) and validated the results by
east Atlantic. We estimate and strip away the gravity effects plotting the gravity inversion depths against independent es-
of sea water, sediment layers and density variations within timates of the Moho depth from seismic refraction profiles
the mantle based on variation in the age of oceanic litho- and receiver functions studies at onshore seismic stations.
sphere. The lowest RMS difference between the gravity and seis-
We use gravity data derived from satellite altimetry over mic refraction corresponds to a reference depth of 37 km and
the oceans (Sandwell and Smith, 2009), which incorpo- density contrast across the Moho of 500 kg m−3 (the RMS
rates the EGM08 gravity model for onshore areas. We cal- for values of 38 km and 450 kg m−3 are very similar). The
culated an onshore simple Bouguer correction using the reference depth is important for our purpose, since we use
EGM08 elevation model and a Bouguer correction density this value as the thickness of continental crust prior to exten-
of 2.67 g cc−1 . For Greenland, the corrections also take into sion in the cross-section area balancing. We find the value
account the thickness of ice taken from (Bamber et al., 2001) used for the reference Moho depths (Zref) has two counter-
and use a density for ice of 0.91 g cc−1 . acting effects on the location of the restored COB locations.
To estimate the gravity effect of the sediment layers, we A larger Zref value yields a greater volume of continental
use sediment thickness grids from Louden et al. (2004) for crust within the margin, so it tends to move the RCOB loca-
the Labrador Sea and Davis Strait. We merged this map with tion more oceanward; however, the larger Zref is also used in
less detailed data for Baffin Bay taken from the compilations the area-balancing and it moves the RCOB landward.
of Divins (2003) and Bassin et al. (2000). A 3-D distribution Seismic data (e.g. Funck et al., 2007; Skaarup et al., 2006;
of sediment density was derived using a depth–density func- Gerlings et al., 2009) show that Davis Strait is heavily af-
tion based on the equations and empirically derived constants fected by magmatic addition related to the passage of the Ice-
given by Sawyer (1985). land plume underneath the area during the early Palaeocene.
A lithosphere thermal gravity anomaly correction was cal- Chappell and Kusznir (2008) describe an approach to es-
culated by first deriving a 3-D model of the lithosphere tem- timate the amount of magmatic addition based on stretch-
perature beneath the basin. Beneath the oceanic lithosphere ing factors obtained from the gravity inversion crustal thick-
the thermal structure is estimated using a 1-D cooling model ness. However, compression in this area, illustrated by ob-
(McKenzie, 1978), which provides an adequate approxima- servations and plate motions (Oakey and Chalmers, 2012),
tion to 2-D thermal models (Chappell and Kusznir, 2008). makes it complicated to estimate stretching factors for the
For the distribution of seafloor age we use a modified ver- earlier extension (and therefore volumes of magmatic addi-
sion of the age grid presented by Müller et al. (2008). The tion) directly from present-day crustal thickness estimates.
grid of Müller et al. (2008) contains ocean crust in Davis We can draw insights from direct comparison between our
Strait and along the Labrador Sea margins based on the in- estimated Moho depths and the distribution of what previ-
terpretation of seafloor up to chron 33 age from Roest and ous authors interpret as underplating along seismic refrac-
Srivastava (1989). As discussed in the main text, a synthesis tion profiles. For profiles across Davis Strait, our preferred
of currently available seismic profile interpretations suggests Moho depth typically lies shallower than the refraction Moho
much of this area is underlain by either stretched continen- where underplating is interpreted beneath continental crust
tal crust or the COT; see Figs. 2 to 5. We therefore mask the on NUGGET lines 1 and 2 (Funck et al., 2007; Gerlings et
Müller et al. (2008) age grid to for these areas. Following al., 2009). The preferred gravity Moho lies slightly above the
Breivik et al. (1999) and Kimbell et al. (2004), we model the base of the crust in the refraction profile presented by Suckro
temperature in the region of stretched continental crust is et al. (2013), although the gravity Moho falls significantly
modelled using a ramp between the oceanic domain and a below the refraction interpretation at the western margin of
separate model for the lithosphere temperature under stable the line. The implications of interpreted underplating within
continental areas. In this way a 3-D grid of lithospheric tem- Davis Strait for our reconstructions are discussed further in
perature field is calculated at a resolution of 5 km. From this, the main text.
we derive a 3-D density field and gravity field observed at the
surface as described by Chappell and Kusznir (2008).
Solid Earth, 4, 461–479, 2013 www.solid-earth.net/4/461/2013/You can also read