On the effect of antiresorptive drugs on the bone remodeling of the mandible after dental implantation: a mathematical model - Nature
←
→
Page content transcription
If your browser does not render page correctly, please read the page content below
www.nature.com/scientificreports
OPEN On the effect of antiresorptive
drugs on the bone remodeling
of the mandible after dental
implantation: a mathematical
model
Mehran Ashrafi1, Farzan Ghalichi1, Behnam Mirzakouchaki2 & Manuel Doblare3*
Bone remodeling identifies the process of permanent bone change with new bone formation and old
bone resorption. Understanding this process is essential in many applications, such as optimizing the
treatment of diseases like osteoporosis, maintaining bone density in long-term periods of disuse, or
assessing the long-term evolution of the bone surrounding prostheses after implantation. A particular
case of study is the bone remodeling process after dental implantation. Despite the overall success of
this type of implants, the increasing life expectancy in developed countries has boosted the demand
for dental implants in patients with osteoporosis. Although several studies demonstrate a high success
rate of dental implants in osteoporotic patients, it is also known that the healing time and the failure
rate increase, necessitating the adoption of pharmacological measures to improve bone quality in
those patients. However, the general efficacy of these antiresorptive drugs for osteoporotic patients
is still controversial, requiring more experimental and clinical studies. In this work, we investigate the
effect of different doses of several drugs, used nowadays in osteoporotic patients, on the evolution of
bone density after dental implantation. With this aim, we use a pharmacokinetic–pharmacodynamic
(PK/PD) mathematical model that includes the effect of antiresorptive drugs on the RANK/RANK-L/
OPG pathway, as well as the mechano-chemical coupling with external mechanical loads. This
mechano-PK/PD model is then used to analyze the evolution of bone in normal and osteoporotic
mandibles after dental implantation with different drug dosages. We show that using antiresorptive
agents such as bisphosphonates or denosumab increases bone density and the associated mechanical
properties, but at the same time, it also increases bone brittleness. We conclude that, despite the
many limitations of these very complex models, the one presented here is capable of predicting
qualitatively the evolution of some of the main biological and chemical variables associated with
the process of bone remodeling in patients receiving drugs for osteoporosis, so it could be used to
optimize dental implant design and coating for osteoporotic patients, as well as the drug dosage
protocol for patient-specific treatments.
Bone remodeling is a biological process that develops in bone tissue throughout its whole lifetime. It denotes the
process of new bone formation and old bone resorption that continuously modifies the internal microstructure
and composition of bone. The main results of bone remodeling are: (i) to repair the internal damage generated
by small-amplitude loads; (ii) to adapt the bone stiffness and strength to the specific mechanical demand; and
(iii) to control the calcium equilibrium in the skeleton1,2. During the first stage of bone remodeling, old bone
is removed (with its internal cracks) by the osteoclasts. These cells are activated by the osteocytes, as the cells
responsible for detecting the environmental signals (e.g., strains, fluid flow, change in concentration or gradients
1
Faculty of Biomedical Engineering, Sahand University of Technology, Sahand New Town, Tabriz, Iran. 2Tabriz
Dental School, Orthodontic Department, Tabriz University of Medical Sciences, Tabriz, Iran. 3Aragón Institute of
Engineering Research (I3A), University of Zaragoza; Aragón Institute of Health Research (IIS-Aragón); Centro de
Investigación Biomédica en Red en Bioingeniería, Biomateriales y Nanomedicina (CIBER-BBN), R&D Building,
Block 5, 1st floor, Campus Rio Ebro, Mariano Esquillor s/n, 50018 Zaragoza, Spain. *email: mdoblare@unizar.es
Scientific Reports | (2021) 11:2792 | https://doi.org/10.1038/s41598-021-82502-y 1
Vol.:(0123456789)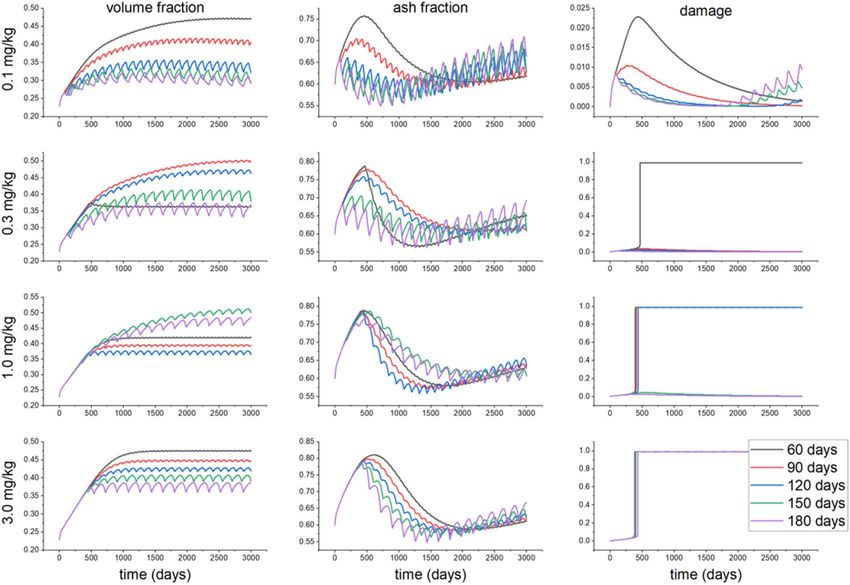
www.nature.com/scientificreports/
of biochemical substances, etc.). This is followed by the second stage of new bone production performed by the
osteoblasts that fill the areas previously resorbed by the osteoclasts1.
Understanding this process is important in many applications, such as optimizing the treatment of diseases
like osteoporosis, maintaining bone density in extreme situations like microgravity or long-term periods of dis-
use, or assessing the long-term evolution of the bone surrounding prostheses after implantation. In particular,
osteoporosis in the elderly (men and women) and especially in post-menopausal women, is highly p revalent3.
A reduction in physical activity or the use of drugs such as steroids may promote excessive bone resorption,
accelerating osteoporosis. This disease might accelerate the reduction in bone quality after implantation of osteo-
synthesis devices, joint prostheses or dental implants, increasing the probability of bone f racture4,5. Finally, it may
cause a reduction in calcium concentration below its physiological level, which may promote other d iseases6.
Consequently, the treatment of osteoporosis with antiresorptive drugs such as bisphosphonates or denosumab
is widely u sed7,8.
A particular case study of the effect of these drugs on the osteoporotic bone is the one of dental implantation.
The increasing life expectancy in developed countries has boosted the demand for dental implants in patients
with osteoporosis9. Several review s tudies4,10,11 conclude that bone healing time increases in osteoporotic patients
which may endanger the success of dental i mplantation12. Histomorphological studies on bone evolution around
Titanium implants in t ibia13, in animal models with induced o steoporosis14,15, indicated that this disease leads to
slower bone turnover and poorer bone-implant adhesion, which promotes reductions in the stiffness and strength
of the bone-implant interface, which may drive to low trabecular bone density. Also, it has been repeatedly dem-
onstrated that the failure rate of dental prostheses and implants, as well as the associated orthopedic equipment,
increases when treating osteoporotic or low-quality b one16. Despite all this, there is not enough evidence to ban
dental implants in osteoporotic patients, although a deeper study and additional improvements are required.
Several methods have been proposed to improve the stability of dental implants in patients with osteoporo-
sis, including modifications in the implant d esign17, in the implant s urface18,19, less invasive surgical techniques
and complementary medical treatment. Drugs like bisphosphonates and denosumab are usually used to treat
osteoporosis20, despite that their long-term use or a high dose may cause o steonecrosis21–23. These antiresorptive
agents decrease osteoclast activity, thus reducing bone resorption, but simultaneously, they also reduce the bone
remodeling rate, which ultimately may cause slow microcrack repair and a more brittle b one24. Although both
bisphosphonates and denosumab reduce the osteoclast activity, their action mechanism is different. Bisphos-
phonates binds to the bone mineral, preventing the inhibitory effect of mature osteoclasts, while denosumab
precludes the binding of RANK-L to its receptor RANK25.
The discovery of the RANK/RANK-L/OPG pathway has been an important progress in the understanding of
bone remodeling26–28. RANK is a protein secreted by the osteoblasts that acts as a receptor at the membrane of
precursor osteoclasts27, with an important effect in the formation, function, and survival of osteoclasts. Binding
of RANK to its ligand (RANK-L) causes the differentiation of precursor osteoclasts to mature o steoclasts28, as
well as the biochemical signalling between osteoblasts and osteoclasts, controlling bone remodeling. OPG is a
decoy receptor for RANK-L26 with a higher affinity than RANK. When OPG attaches to the receptor sites in the
precursor osteoclast membrane, it precludes RANK/RANK-L binding, reducing bone resorption27. In addition
to this main pathway, other growth factors, cytokines, and hormones, such as TGFβ and PTH, are also involved
in bone h omeostasis27. A complete understanding of this RANK/RANK-L/OPG pathway and its interaction with
the mechanical strain and with external drugs such as those mentioned would help to identifying the optimal
dose for patients with bone disorders.
Peter et al.29,30 analyzed the effect of antiresorptive drugs on the bone remodeling process in patients with
osteoporosis utilizing a finite element model around a hip implant after application of alendronate. They used
a phenomenological bone remodeling model to investigate the effect of such drug on the osteoclast activity
trying to establish a relation between the drug dose and the parameters of the resorption part of the density
rate-stimulus curve. Hambli et al.31 investigated the denosumab effect on bone remodeling, considering a couple
PK/PD and FE model. Although their work gave rise to good predictions on the mean bone mineral density,
they did not consider the effect of different loads, nor different doses on different bone types. Also, their damage
model did not consider damage repair. Finally, the effect on long-term mineralization and the damage increase
induced by the higher mineralization-induced brittleness were not considered either. Martinez et al.32 studied
the effect of denosumab on the bone mineral density, but without taking into account the damage effect, neither
different types of bones under various loads.
Therefore, the development of a pharmacokinetic-dynamic (PK/PD) model for bone remodeling that also
takes into account the mechano-chemical coupling can consequently help in predicting the bone evolution and
behavior after implantation in patients with osteoporosis and in optimizing the treatment with different types of
drugs. In this work, we investigate the effect of different doses of drugs on bone remodeling with the help of the
PK/PD model provided by Marathe et al.8,33. This model is complemented here with a sub-model that couples
the mechanical signal with the RANK/RANK-L/OPG p athway34. Finally, the resulting mechano-PK/PD model
is used to analyze the evolution of bone in normal and osteoporotic mandibles after dental implantation with
different drug dosages.
Results
First of all, we tried to validate the biochemical model described above. With such purpose, we calculated the
evolution in time of two biomarkers for bone turnover, Serum N-terminal telopeptide (sNTX), after application
of different doses of denosumab, and urine C-terminal telopeptide (uCTX) after application of different doses
of Ibandronate. Figure 1a,b show the evolution during 90 days of sNTX and plasma concentrations after admin-
istration of a single dose of denosumab. In the first days, a significant decrease in sNTX was observed for any
Scientific Reports | (2021) 11:2792 | https://doi.org/10.1038/s41598-021-82502-y 2
Vol:.(1234567890)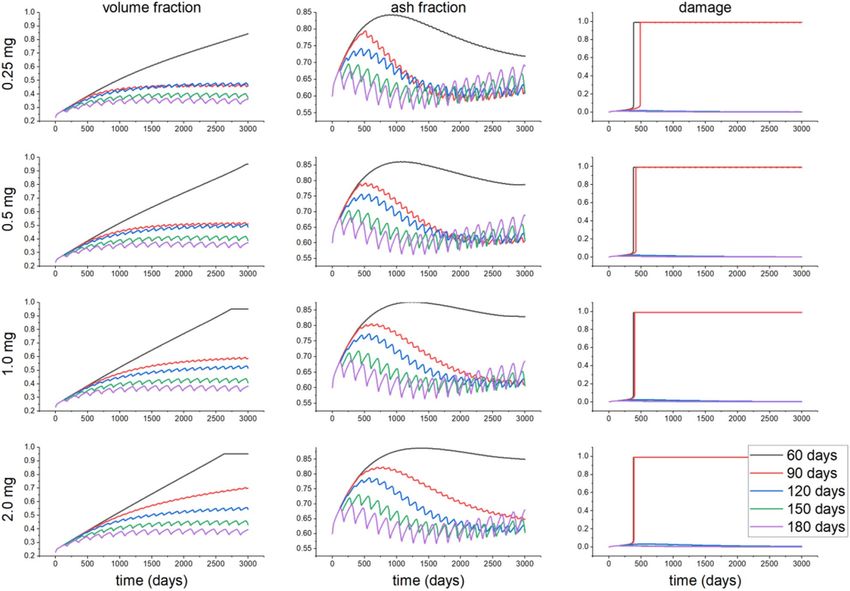
www.nature.com/scientificreports/
Figure 1. (a) Evolution of the serum NTX concentration after administration of a single dose of denosumab
and comparison with Marathe’s work33 and with experiments36; (b) evolution of the plasma concentration after
administration of a single dose of denosumab and comparison with Marathe’s work33 and with experiments36;
(c) changes in the concentration of urine CTX from the baseline after administration of a single dose of
Ibandronate and comparison with Marathe’s w ork8 and with experiments35.
dosage. This reduction is slowly recovered from 55 to 95% of the initial baseline, in 80 days, depending on the
dose. That initial decrease is higher for higher doses, although the difference between doses of 0.3 and 1 mg/kg
is small. On the contrary, the plasma concentration increases by orders of magnitude in the first days after drug
administration, with subsequent recovery towards the initial baseline. Figure 1c shows the evolution of uCTX
concentration after intravenous administration of Ibandronate for 180 days and an interval between successive
doses of 90 days. The concentration of uCTX shows a strong reduction in the first days after drug administration,
up to values of 80% of reduction for a dose of 2 mg of Ibandronate. Then the concentration starts to rise towards
its initial baseline, which is reobtained at about 90 days after drug administration. All these results are in good
agreement with those presented in other s tudies8,33,35,36.
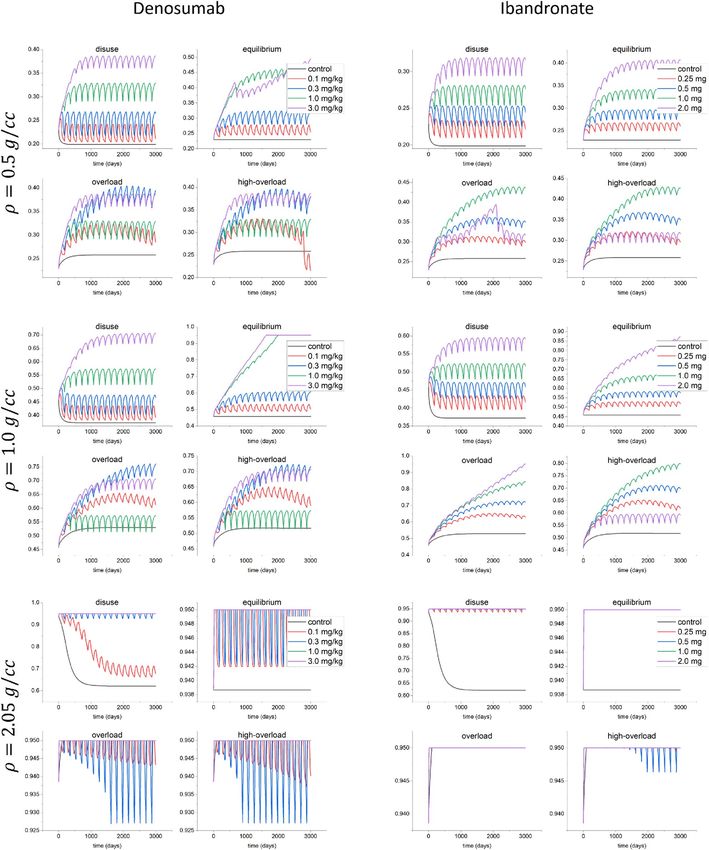
The evolution of the bone volume fraction (Eq. (2)) for different bone types (osteoporotic, ρ = 0.5 g/cm3,
trabecular, 1.0 g/cm3, and cortical, 2.05 g/cm3) under different mechanical stimuli of disuse (ξ = 0), equilibrium
(ξ = ξ ∗), overload (ξ = 5ξ ∗) and high-overload (ξ = 7ξ ∗), with ξ ∗ denoting the reference stimulus (Eq. (7)) are
depicted in Fig. 2. The initial values are obtained by solving the stationary state of Eq. (1), i.e without considering
the drug effect and under equilibrium stimulus (ξ = ξ ∗). When increasing the drug dose, the volume fraction
increases for all types of bone. For ρ = 1.0 g/cm3 , the maximum increase of volume fraction in the equilibrium
condition with respect to the control case for 0.1, 0.3, 1.0 and 3.0 mg/kg of denosumab was about 16%, 32%,
53% and 107% respectively, while for 0.25, 0.5, 1.0 and 2.0 mg of Ibandronate these increases were 15%, 27%,
46% and 90% respectively.
Scientific Reports | (2021) 11:2792 | https://doi.org/10.1038/s41598-021-82502-y 3
Vol.:(0123456789)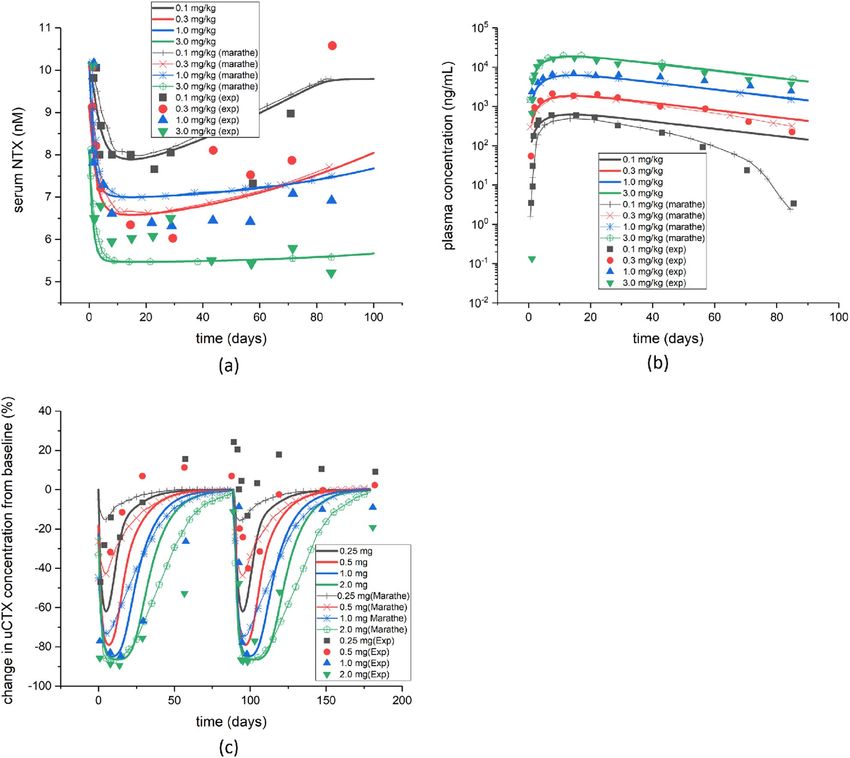
www.nature.com/scientificreports/

                                            Figure 2.  Evolution of the bone volume fraction (Eq. (2)) for the control case without drugs and for different
                                            doses of denosumab (0.1, 0.3, 1.0 and 3.0 mg/kg) and Ibandronate (0.25, 0.5, 1.0 and 2.0 mg) when applying
                                            different stimuli of disuse (ξ = 0), equilibrium (ξ = ξ ∗), overload (ξ = 5ξ ∗) and high-overload (ξ = 7ξ ∗) for
                                            different bone types (ρ = 0.5, 1.0 and 2.05 g/cm3).

                                                The evolutions of ash fraction, bone volume fraction and damage are shown in Fig. 3 when the bone is sub-
                                            jected to constant stress values of σ = 1.0 MPa for ρ = 0.5 g/cm3, σ = 7.0 MPa for ρ = 1.0 cm3 and σ = 34.0
                                            and 54 MPa for ρ = 2.05 g/cm3, that correspond to similar stimuli, and after administration of different doses

          Scientific Reports |   (2021) 11:2792 |                https://doi.org/10.1038/s41598-021-82502-y                                                    4

Vol:.(1234567890)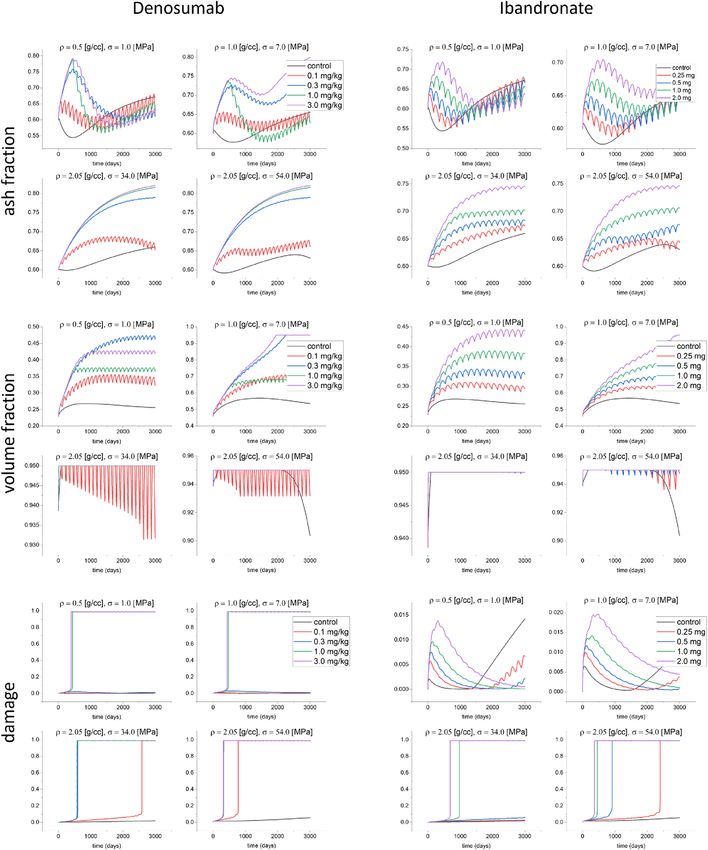
www.nature.com/scientificreports/
of denosumab and Ibandronate. As shown i n34 and in Fig. 3, the ash fraction decreases during the first stage of
remodeling, because of the activity of osteoclasts tends to increase. When applying one of those two drugs, the
ash fraction increases for all types of bones. In the cases of osteoporotic bone under σ = 1.0 MPa, and trabecular
bone, the ash fraction first increases, and then decreases for doses of 1.0 and 3.0 mg/kg of denosumab. After
this period, the ash fraction begins to increase again. The bone volume fraction increases for all types of bones,
as shown in Fig. 3. This same figure also shows that the bone volume fraction tends to decrease with the stress
level in trabecular and osteoporotic bones. The same trend can be observed when prescribing bisphosphonates.
The bone volume fraction in osteoporotic bone increases in that latter case up to the maximum density allowed.
Also, the increase rate for the bone volume fraction is higher when using denosumab than when applying bis-
phosphonates (Fig. 3). Finally, the damage level in cortical bone (ρ = 2.05 g/cm3) shows a greater increase than
for the two other bone types. Using denosumab with doses of 0.1 and 0.3 mg/kg does not increase the damage
level in osteoporotic and trabecular bones, while, on the contrary, for cortical bone, for those doses, the damage
level increases. In the case of bisphosphonates, doses of 0.25 and 0.5 mg do not increase the damage level for
osteoporotic bone. The change in ash fraction for ρ = 1.0 g/cm3 subjected to σ = 7.0 MPa for for 0.25, 0.5, 1.0
and 2.0 mg of denosumab with respect to the control case at time t=3000 days was about – 2%, 14%, – 4% and
20% respectively, while these changes for 0.25, 0.5, 1.0 and 2.0 mg of Ibandronate were about – 0.7%, – 0.9%,
– 1.5% and 5% respectively.
The evolutions of bone volume fraction, ash fraction, and damage for different doses of drugs and different
dosage intervals for the osteoporotic bone, in particular, are depicted in Figs. 4 and 5. For a denosumab dose
0.1 mg/kg, increasing the dosage interval decreases the bone volume and ash fractions. In contrast, for a dose
of 0.3 mg/kg and a time interval of 60 days, the damage reaches the maximum level allowed. After reaching
that maximum damage, the ash fraction shows a higher reduction rate than for other doses. Simultaneously,
the volume fraction for this dose is slightly reduced and then reaches a new steady value after the maximum
damage is reached. For other time intervals and the same dose, the bone volume fraction increases with time,
depending on the time interval, since damage does not reach its maximum level. In contrast, the ash fraction
decreases when increasing the time interval. Increasing the drug dose increases damage, while shorter time
intervals drive to a faster increase in damage up to its maximum level. Moving now to Ibandronate, a dose of
0.25 mg increases the damage up to its maximum value at time intervals of 60 and 90 days. The ash and bone
volume fractions, unlike denosumab, do not stop increasing after reaching maximum damage. The same result
is observed for other doses and dosage time intervals. It is possible to observe faster increases in the ash and
bone volume fractions when decreasing the dosage time interval for all doses. Reductions in volume fraction
for ρ = 0.5 g/cm3 after 3000 days from the case of 60 days for 90, 120, 150 and 180 days of administration of 0.1
mg/kg of denosumab were about 13%, 31%, 37% and 37% respectively, while for Ibandronate these values were
45%, 45%, 56% and 57% respectively.
Figure 6 shows the final density distribution in the whole mandible after application of the phenomenological
bone remodeling model with additional views of several cross-sections to compare such results with correspond-
ing CT images. Figure 6f shows a cut view of the density distribution of the reduced computational model, while
Fig. 6g depicts the assumed density distribution after applying the density reduction due to osteoporosis.
Finally, the application of the coupled PK/PD and remodeling models here described to the mandible model
after dental implantation, physiological mastication loads, and administration of different drug doses drives to
the results shown in Figs. 7, 8, 9 and 10. The bone volume fraction (Fig. 7), damage level (Fig. 8) and ash frac-
tion (Fig. 9) are compared with the base case with the application of no drug. For the two drugs analyzed here,
any dose increases the bone volume and ash fractions and corresponding density. Doses of 1.0 and 3.0 mg/kg of
denosumab and 1.0 and 2.0 mg of bisphosphonate produce higher damage. As consequence, the elastic modulus
decreases in those regions (Fig. 10). The ash fraction (Fig. 9), like damage, increases when increasing the drug
dose, especially in the trabecular bone around the implant threads.
Discussion
One of the main objectives of this study was to investigate the effect of different doses of antiresorptive drugs
on bone behavior. Antiresorptive drugs are used to treat diseases such as osteoporosis in which the balance
between the activity of osteoclasts and osteoblasts is disturbed37. Denosumab and Ibandronate are antiresorp-
tive osteoclast-targeting drugs used in the treatment of osteoporosis25,38. These drugs affect the bone remodeling
process by different action mechanisms. Denosumab binds to RANK-L, reducing the binding between RANK and
RANK-L, thereby the concentration of active osteoclasts on the bone surface. Bisphosphonates as Ibandronate,
on the contrary, interfere with the osteoclast activity by binding to the bone mineral s urface25. As a consequence,
these drugs reduce the resorption stage in bone remodeling, increasing, therefore, the bone volume fraction
and density, and, with that, improving the long-term bone quality in osteoporotic patients. Besides, the mineral
content of bone increases, which causes bone to become more brittle and damaged. This may provoke local
fractures despite the higher stiffness and strength of the treated bone.
Therefore, this ambivalent effect of antiresorptive drugs makes it difficult to predict their net effect on osteo-
porotic bone. This process is especially complex when treating with such drugs after implantation since in those
case, it is not only the effect of drugs but also the critical change in the mechanical conditions of the surround-
ing bone which contributes to modifying the long-term bone internal microstructure. Implantation in patients
with osteoporosis is, therefore, c hallenging39 and its clinical treatment utilizing these drugs may negatively affect
the success of the implant with increasing o steonecrosis24,38.
This happens, for example, after dental implantation, a practice that has increased in recent years in the elderly,
who have an increased risk of osteoporosis in the mandible bone, which justifies why this problem has attracted
the interest of several a uthors14,15,40,41. In particular, mathematical models are useful in analyzing these complex
Scientific Reports | (2021) 11:2792 | https://doi.org/10.1038/s41598-021-82502-y 5
Vol.:(0123456789)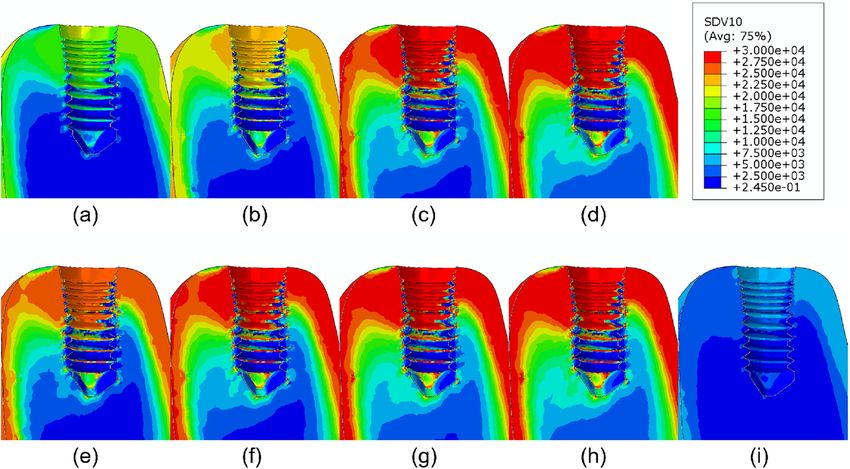
www.nature.com/scientificreports/

                                            Figure 3.  Evolution of the ash fraction, volume fraction and damage for the control case, and different doses of
                                            denosumab (0.1, 0.3, 3.0 mg/kg) and Ibandronate (0.25, 0.5, 1.0 and 2.0 mg) when applying constant stress of 1.0
                                            MPa for an initial density of ρ = 0.5 g/cm3, 7.0 MPa for an initial density of ρ = 1.0 g/cm3 and 34 and 54 MPa
                                            for an initial density of ρ = 2.05 g/cm3.

                                            problems. In principle, an ideal mathematical model of bone remodeling should take into account the different
                                            bone cells involved and their main activities such as proliferation, differentiation, migration, death, biochemical
                                            signals production, changes in their expression due to biochemical or mechanical signals, and tissue resorption or

          Scientific Reports |   (2021) 11:2792 |                https://doi.org/10.1038/s41598-021-82502-y                                                  6

Vol:.(1234567890)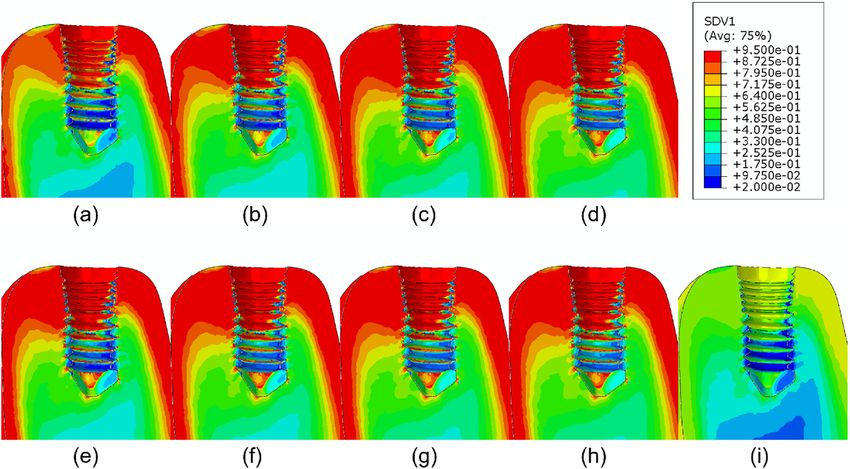
www.nature.com/scientificreports/
Figure 4. Evolution of the volume fraction, ash fraction and damage for different doses of denosumab (0.1, 0.3,
1.0 and 3.0 mg/kg) when applying a stress of 1.0 MPa for a bone initial density of ρ = 0.5 g/cm3, and different
dosage time intervals of 60, 90, 120, 150 and 180 days.
production. Also, it should consider the diffusion, decay and production of growth factors, hormones, proteins,
and other biochemical substances that control the cell behavior. Finally, the particular mechanical microenviron-
ment and its interactions with the chemical reactions and cell protein expression should be taken into account.
To implement all these processes requires very complex mechano-chemo-biological models with several coupled
mechanisms not yet fully understood, a lot of parameters, many times unmeasured, and a difficult validation
due to lack of experimental results in a sufficient number and variety of situations. Even with these limitations,
mathematical modeling is a powerful tool for studying complex biological systems since they allow us to find
out important trends, and to quantify, to a certain extent, the relationships between causes and effects, to test
theoretical hypotheses, quantify the effects of the different parameters individually on the behavior of the bio-
logical system and to do virtual experiments in “what if ” s ituations42.
In this paper, we present a combination of a PK/PD model and a fully-coupled chemo-mechano-biological
bone remodeling approach that incorporates the stimulus effect on the signaling pathway between osteoclasts
and osteoblasts. The effect of damage on the signaling pathway and the local material properties have also been
considered. Finally, the mineralization level is monitored along the whole bone lifetime. We have proven that
these types of models can be used for predicting the bone behavior in the mandible after dental implantation
when using antiresorptive drugs for improving the long-term quality of osteoporotic bone. In order to study the
applicability of this model, the long-term effects of different doses of denosumab (0.1, 0.3, 1.0 and 3.0 mg/kg)
and Ibandronate (0.25, 0.5, 1.0 and 2.0 mg) on the mandibular bone surrounding a dental implant were studied.
We first examined the effect of different drugs and of the mechanical stimulus on the bone behavior. Deno-
sumab does not bind to the bone mineral surface, unlike Ibandronate, so Ibandronate effects last longer after
stopping its administration24,43,44. Considering this fact and comparing the increase in bone volume fraction
after administration of these two drugs, we can speculate that the increase in volume fraction and in mineral
content in bone induced by Ibandronate will be higher than that of denosumab. As commented, the drugs here
analyzed inhibit the activity of osteoclasts, thereby reducing bone resorption and therefore, increasing the bone
volume fraction and the mineralization. On the other hand, due to the effect of calcium, the bone becomes more
brittle, and damage increases. By comparing Figs. 4 and 5, at low doses of 0.1 mg/kg for denosumab and 0.25 mg
for Ibandronate, we found a more significant increase in the bone volume fraction when applying Ibandronate,
while, contrarily, this drug produces higher increases in bone ash fraction and damage than denosumab, lead-
ing to a more brittle bone. Also, these drugs increase the ash fraction initially (Fig. 3), while the mineralized
portion of the bone is also initially reduced. This stage is then followed by the filling of the resorbed bone by the
Scientific Reports | (2021) 11:2792 | https://doi.org/10.1038/s41598-021-82502-y 7
Vol.:(0123456789)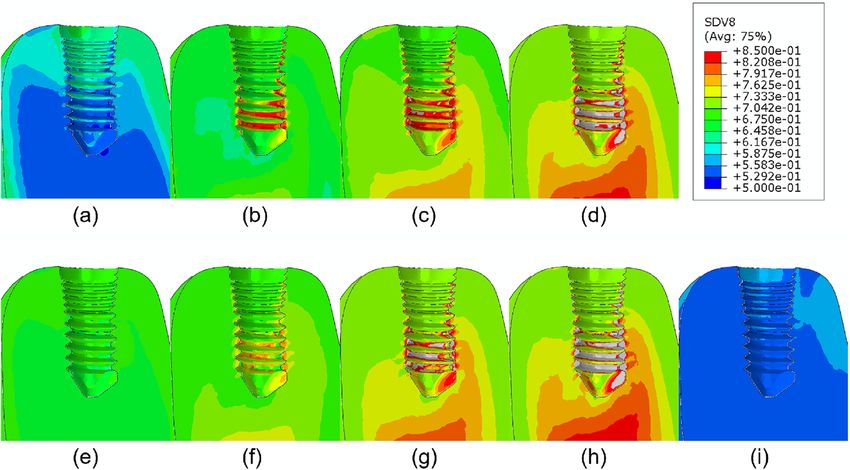
www.nature.com/scientificreports/

                                            Figure 5.  Evolution of the volume fraction, ash fraction and damage for different doses of Ibandronate (0.25,
                                            0.5, 1.0 and 2.0 mg) when applying a stress of 1.0 MPa for a bone initial density of ρ = 0.5 g/cm3, and different
                                            dosage time intervals of 60, 90, 120, 150 and 180 days.

                                            Figure 6.  Bone density distribution (g/cm3) in the mandible and several cross-sections. (a) Mandible, (b) cross
                                            section containing the incisor, (c) CT image of the corresponding incisor cross section, (d) cross section of
                                            second right molar, (e) CT image of the corresponding second right molar section, (f) lingual-labial cut view of
                                            the isolated model and (g) density of the osteoporotic state in the same cut view.

          Scientific Reports |   (2021) 11:2792 |                https://doi.org/10.1038/s41598-021-82502-y                                                     8

Vol:.(1234567890)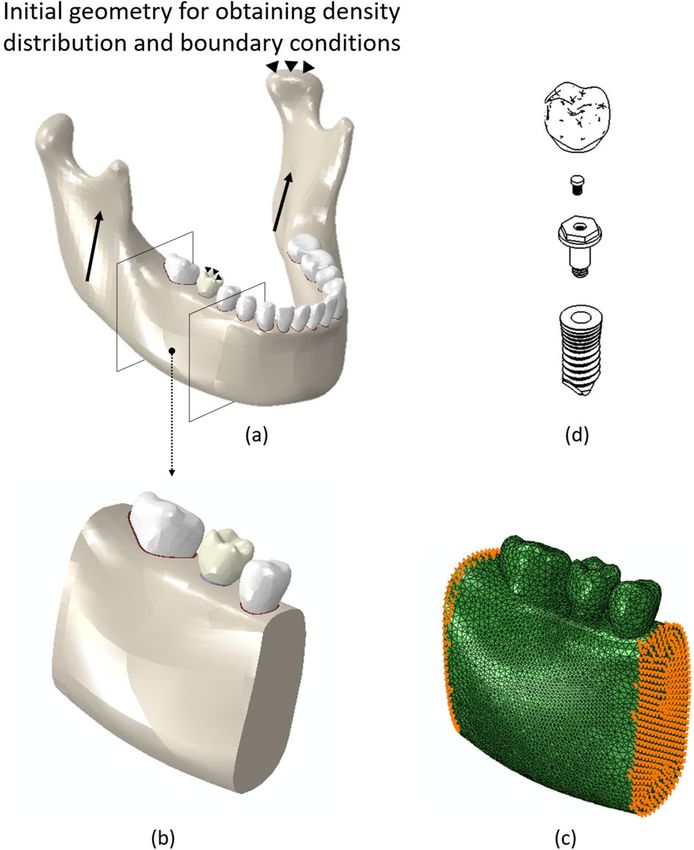
www.nature.com/scientificreports/

                                  Figure 7.  Bone volume fraction distribution after 540 days of simulation for different doses of (a) 0.1, (b) 0.3,
                                  (c) 1.0, (d) 3.0 mg/kg of denosumab and doses of (e) 0.25, (f) 0.5, (g) 1.0, (h) 2.0 mg of bisphosphonates and (i)
                                  control implant.

                                  Figure 8.  Damage distribution after 540 days of simulation for different doses of (a) 0.1, (b) 0.3, (c) 1.0, (d)
                                  3.0 mg/kg of denosumab and doses of (e) 0.25, (f) 0.5, (g) 1.0, (h) 2.0 mg of bisphosphonates and (i) control
                                  implant.

                                  osteoblasts, forming new bone with the corresponding next mineralization. Increasing the drug dose in any of
                                  two cases considered also increases the bone volume fraction and damage for all types of bone. For cortical bone,
                                  for instance, which does not need drug treatment, even low drug doses cause bone to become highly brittle,
                                  reaching the maximum level of damage faster. In this bone, no decrease in the mineralized fraction was detected
                                  after drug treatment, so microdamage progresses in time, and a stress fracture may occur.
                                      The stress level also influences this behavior by promoting or delaying the damage rate. For trabecular or
                                  osteoporotic bone, low drug doses increase the bone volume fraction without substantial damage increase.
                                  This is more evident in osteoporotic bone. Consequently, drug application is beneficial in low-density bone,
                                  although this treatment always increases brittleness, which may compromise the success of dental implanta-
                                  tion. This subtle control between these two opposite effects is essential when defining the treatment protocol

Scientific Reports |   (2021) 11:2792 |                https://doi.org/10.1038/s41598-021-82502-y                                                      9

                                                                                                                                                 Vol.:(0123456789)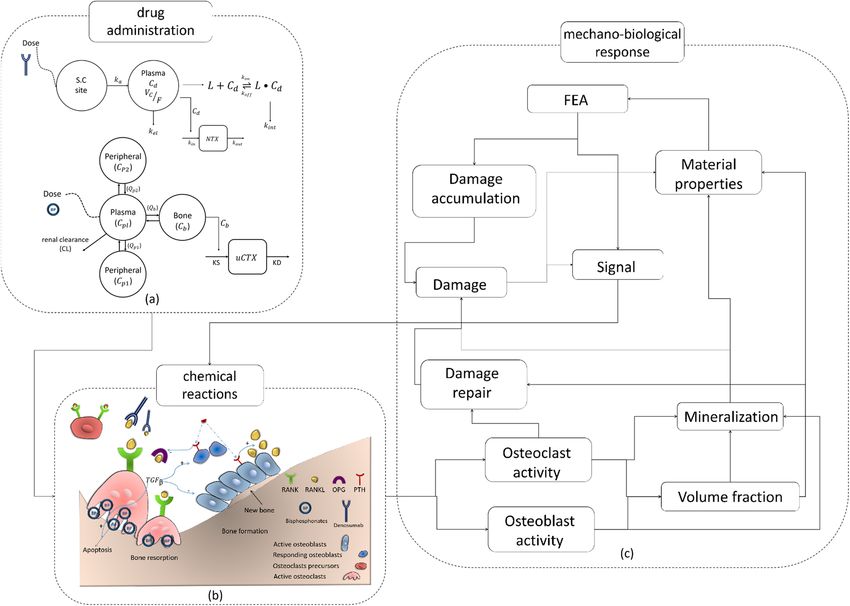
www.nature.com/scientificreports/
Figure 9. Ash fraction distribution after 540 days of simulation for different doses of (a) 0.1, (b) 0.3, (c) 1.0,
(d) 3.0 mg/kg for denosumab and doses of (e) 0.25, (f) 0.5, (g) 1.0, (h) 2.0 mg for Ibandronate and (i) control
implant.
Figure 10. Elastic modulus distribution after 540 days of simulation for different doses of (a) 0.1, (b) 0.3, (c)
1.0, (d) 3.0 mg/kg of denosumab and doses of (e) 0.25, (f) 0.5, (g) 1.0, (h) 2.0 mg of bisphosphonates and (i)
control implant.
for a particular patient and the main reason for using and improving this type of mathematical models and “in
silico” experiments.
After this first test of the model, when we got similar results to other authors with comparable qualitative
clinical conclusions20–23, we studied their effect on the bone surrounding a realistic dental implant using a
3-dimensional finite element model for an osteoporotic mandible after implantation and treatment with dif-
ferent drug doses. Qualitative comparison of the results with clinical studies in patients with osteoporosis who
received bisphosphonate or denosumab agrees with the detected bone mineral content and bone mass increase
after anti-resorptive t reatment45,46.
Bone brittleness is not only linked to low bone mass but also to the increase in the mineral content of the tissue
or to the accumulation of bone microdamage47. This latter could be due to bone resorption and the associated
bone strength or to microcrack blockage of the bone remodeling activity, reducing microcracks r epair48. Another
Scientific Reports | (2021) 11:2792 | https://doi.org/10.1038/s41598-021-82502-y 10
Vol:.(1234567890)www.nature.com/scientificreports/
possibility is associated with the use of bisphosphonates or denosumab, since these drugs reduce the activity of
osteoclasts, thereby reducing the bone remodeling rate, thus slowing down microdamage repair. As shown in our
results, depending on the stress level, the bone type, and the drug dose, the damage level could highly increase
when using these types of drugs. For example, in Fig. 3 for osteoporotic bone ρ = 0.5 g/cm3, after applying
constant stress of σ = 1.0 MPa the amount of volume fraction increased along the whole process (43% for 0.3
mg/kg of denosumab and 30% for 0.5 mg of Ibandronate), but the increase in ash fraction in the early days leads
to a maximum in the damage level. A similar effect is seen in Figs. 7 and 8. The first one shows an increase in
the bone volume fraction in the patient with osteoporosis for higher doses of antiresorptive drugs. This increase
is also seen in the vicinity of the implant threads. On the other hand, the second figure shows that microdam-
age also increases, especially in the threads neighborhood, which confirms the findings of other s tudies47,49,50.
Despite the remarkable potential of these models and the qualitatively accurate results produced, like any
other mathematical models in systems biology, it still has important limitations that should be addressed in
future studies. Among them, we can mention:
1. As mentioned in our previous study34, simplifications such as considering only the RANK/RANK-L/OPG
biochemical pathway, or in the reaction rate assumed for the receptor–ligand reactions, or discarding the
effect of osteocytes in the mechanosensing process, should be progressively overcome.
2. Due to the lack of knowledge about the effect of race, sex, age, etc, onto the biological parameters, those used
in this study are taken from literature, so it is not possible yet to apply the model to patient-specific studies
without additional experimental determinations.
3. The pharmacokinetics determines the dosage of the drug in the intended compartment. Therefore, develop-
ing a pharmaco-kinetic model with an adequate number of compartments and experimental parameters is
essential for determining an accurate value for the concentration of drug reaching bone to better predict the
bone behavior. Also, the parameters used in pharmacokinetic models should vary for different individuals,
which has not been considered here.
4. Although the mineral part of the bone has a prevailing effect on the bone mechanical p roperties51, the effect
of drugs on the organic component of bone was not considered, which may be important to assess bone
fracture resistance, especially under t ension52.
5. Different loading conditions have different effects on bone behavior. However, due to the lack of sufficient
information, and considering that muscle forces vary for different individuals and are also modified after
implantation, the loads applied in our finite element study were based on previous generic studies.
We have presented here a PK/PD model coupled with a mechano-chemo-biological bone remodeling model,
that has been implemented in a standard commercial FE code to analyze the effect of two widely used drugs as
denosumab and Ibandronate onto the evolution of the mandible bone after dental implantation. Using antiresorp-
tive agents such as denosumab or bisphosphonates alter the evolution of the density and mechanical properties of
bone by interfering in the bone remodeling mechanism, reducing the osteoclast activity, which may consequently
increase bone brittleness by augmenting the mineral content and microdamage. This effect is corroborated by
our results that show that using any of those drugs in osteoporotic patients increases the bone volume fraction,
although, in parallel, it also increases bone brittleness, a well-known side effect of these treatments. Using patient-
specific geometries and initial density values, this model may provide a good perspective to clinicians about
these two contradictory effects of those drugs for the treatment of osteoporosis and to compare with longitudinal
clinical results with different doses.
The model developed here is capable of capturing the main biological and chemical variables associated
with the bone remodeling process in patients receiving drugs for osteoporosis treatment. Despite the limita-
tions described, these models can be used to predict bone behavior, complementing costly, and time consuming
clinical experiments, and for optimizing dental implant designs and coatings for osteoporotic patients, as well
as patient-specific dosage protocols.
Methods
The bone remodeling model used here is a chemo-mechano-biological model that couples the effect of mechani-
cal strains and microdamage with the biochemical RANK/RANK-L/OPG pathway, and, with the expression
of the different cell phenotypes involved. It also models the tissue resorption-formation process accomplished
by synchronized sets of osteoclasts and osteoblasts known as basic multicellular units (BMUs), followed by the
tissue mineralization. This model closely follows the one presented in a previous paper of the authors34 but add-
ing now the PK/PD submodel that permits the analysis of the effect of drugs. As a result, the whole process and
the effect on its main output variables, such as the local bone density and the mineral content, as well as their
influence onto the bone mechanical properties, can be analyzed for different mechanical or chemical protocols.
Bone remodeling model. Regarding the bone remodeling model, only a brief review is done here. For
additional details, the reader may consult34. That mechano-chemo-biological model is based on the previous
work of Lemaire et al.27. Three types of cells are considered: responsive osteoblasts, active osteoblasts, and active
osteoclasts. The concentration rate (time derivative of the number of cells per unit volume) for each of these
three cell populations is written as in Lemaire’s :
Scientific Reports | (2021) 11:2792 | https://doi.org/10.1038/s41598-021-82502-y 11
Vol.:(0123456789)www.nature.com/scientificreports/
Description Unit Value References
β Bond interaction constant – vb /vb0 –
27
CS Value of C (osteoclast population) to get half differentiation flux pM 5e−3
27
DA Rate of osteoclast apoptosis caused by TGF β day−1 0.7
27
dB Differentiation rate of responsive osteoblasts day−1 0.70
27
DC Differentiation rate of osteoclasts precursors pM day−1 2.1e−3
27
DR Differentiation rate of osteoblast progenitors pM day−1 7e−4
27
f0 Fixed proportion – 0.05
K Fixed concentration of RANK pM 10 27
27
k1 Rate of OPG-RANK-L binding pM−1 day−1 10−2
27
k2 Rate of OPG-RANK-L unbinding day−1 10
27
k3 Rate of RANK/RANK-L binding pM−1 day−1 5.8 × 10⁻⁴
27
k4 Rate of RANK/RANK-L unbinding day−1 1.7 × 10⁻²
27
k5 Rate of PTH binding with its receptor pM−1 day−1 0.02
27
k6 Rate of PTH unbinding day−1 3
27
KLP Maximum number of RANK-L attached on each cell surface pmol/pmol cells 3 × 10⁻⁶
27
k0 Rate of OPG removal day−1 0.35
27
KOP Minimal rate of production of OPG per cell pmol day−1/pmol cells 2 × 10⁵
27
kp Rate of PTH removal day−1 86
27
rL Rate of RANK-L production and elimination pM day−1 10 3
27
Sp Rate of synthesis of systemic PTH pM day−1 250
Table 1. Values and description of the chemical parameters.
dBr DB
= DR πTGFβ − Br
dt πTGFβ
dBa DB
= Br − kB Ba (1)
dt πTGFβ
dC
= DC πRANK−L − DA πTGFβ C
dt
where Br , Ba and C identify the concentrations of responding and active osteoblasts and osteoclasts, respectively.
πTGFβ and πRANK−L are the fraction of receptor sites occupied by receptor/ligand complex (i.e. π ∼ R • L/R ) of
the transforming growth factor (TGFβ ) and of RANK-L, respectively. DR , DB and DC are differentiation rates of
osteoblast progenitors to responsive osteoblasts, responsive osteoblasts to active osteoblasts, and osteoclasts pre-
cursors to osteoclasts, respectively. DA is the osteoclasts apoptosis rate caused by TGFβ and, finally, kB is the death
rate of active osteoblasts. The values of all these parameters appear in Table 1 with the corresponding references.
After calculating the osteoblast and osteoclast populations, the rate of bone volume fraction can then be
calculated as:
dvb
= kform Ba − kres C (2)
dt
where kform and kres are the rates of bone formation and resorption per unit cell, respectively, that depend on the
bone type and location. The initial value of their ratio kform /kres is assumed to be equal to the initial ratio of the
population of osteoclasts and osteoblasts C0 /Ba0, that can be obtained by solving the steady-state expression of
Eq. (1) (left-hand side equal to zero) and depend on the initial bone density.
Equations (1) and (2) provide the evolution along time of the distributions of the different cells involved in
the process depending on the results of the chemical reactions between receptor and ligands involved in the
RANK/RANK-L/OPG pathway that is briefly explained in the following section, and from them, the change in
bone volume fraction.
Chemical reactions involved in bone remodeling. The receptor activator for nuclear kappa-B, RANK
(K) is a surface-bound molecule that binds to its ligand, RANK-L (L), serving as osteoclast activator28. Osteo-
protegerin, OPG (O), a decoy receptor for RANK-L, is another protein expressed by osteoblasts and other tissues
like the spleen, bone marrow, heart, liver, and kidney26. OPG inhibits RANK/RANK-L binding, so it plays a
protective role against bone loss. Among the many systemic hormones that influence bone cell activity, PTH (P)
is the most important calcium homeostasis regulator and bone remodeling hormone, so it is used as an anabolic
agent in the treatment of o steoporosis27. The chemical reactions between the receptors and associated ligands
27
are as follows :
Scientific Reports | (2021) 11:2792 | https://doi.org/10.1038/s41598-021-82502-y 12
Vol:.(1234567890)www.nature.com/scientificreports/
pO pL pL pP
↓ ↓ k1 ↓ k3 ↓ k5
O + L ⇋ O • L, L + K ⇋ K • L, P + Pr ⇋ Pr • P (3)
↓ ↓ k2 ↓ k4 ↓ k6
dO dL dL dP
with ki (i = 1, 3, 5) reaction binding rates, and ki (i = 2, 4, 6) reaction unbinding rates. pO, pL and pP are produc-
tion fluxes and dO , dL and dP are destruction fluxes of OPG, RANK-L and PTH respectively. Since the reactions
related to chemical bindings in biological systems occur faster than cell population changes, occupancy of the
complexes ( πL = K•L K and πP = RTP = P+P s ) as well as the OPG concentration (O) have been considered as
Pr •P P
pseudo-steady during the whole remodeling process. With all this, the OPG concentration and the fractions of
RANK-L and PTH can be calculated as follows27:
K •L k3 KLP πPTH Ba
πRANK−L = =
K k4 1 + kk3 K + kk1 O
4 2
Pr • P P
πPTH = = (4)
RTP P + Ps
KOP
O= Br
kO .πP
where Pr is the number of free receptor of PTH, RTP stands for the number of PTH receptors per cell, P s = k6 /k5,
KLP is the maximum occupancy of RANK-L attached to each cell surface, P = kSPP is the PTH concentration, SP
is the synthesis rate of systemic PTH, KOP represents the minimal rate production of OPG per cell and kO is the
rate of OPG removal.
From Eqs. (1)–(4) we can calculate the evolution of Br , Ba , C and vb without considering the effect of the
mechanical environment on bone signaling. The next sections address this coupling between Mechanics and
Biochemistry in bone remodeling.
Role of mechanical signal in chemical reactions. Mechanical strain and microdamage are the most
important signals affecting the receptor–ligand binding/unbinding energy fraction. In particular, mechanical
forces change the energy barrier of the molecules and disrupt the binding/unbinding of receptors and ligands in
chemical reactions, while damage interrupts the communication channels between cells, thus reducing the level
aper34 that the reaction rates of the receptor
of the mechanical signal. Therefore, we hypothesized in a previous p
and ligand change as follows:
kf = kf0 eγ (1−S)Ŝv
(5)
kr = kr0 e−γ (1−S)Ŝv
where kr and kf are the unbinding and binding rates associated to the receptor and ligand interactions, kr0 and
kf0 are unbinding and binding rate constants, γ is a constant relating the ratio between current and initial bone
volume fractions (γ = vvbb ), S the normalized mechanical signal (see below) and Ŝv is the normalized specific
0
bone surface (Ŝv = SvSv , with Svmax = 4.17mm2 /mm3 the maximum specific bone surface available)53.
max
The mechanical signal (that is here considered as inhibitory of the action of the c ells54,55), depends on the
mechanical stimulus ( ξ ) and on the damage level (d). We assume that the transmission of this signal in bone
depends on its microstructure through the local bone volume fraction (i.e. vb ). In other words, that signal is
transmitted easier in cortical than in trabecular bone and much easier than in osteoporotic bone. With all this,
and following55, we can write:
ξ
S= (1 − d)avb (6)
ξ +c
with c and a model parameters that, together with ξ , d and vb control the value of the inhibitory remodeling
signal. The mechanical stimulus depends on an equivalent strain ε and the number of loading cycles N as in56:
1/m
ξ= Ni εi m
(7)
i
√
with ε = 2u/E , being u the strain energy density and E the elastic modulus, that correlates with the bone
55,57
volume fraction and ash density as stated in the Eq. (21) below. Finally, m = 4 is an experimental c onstant56 and
i is the number of different load types.
Drug effect on bone remodeling. Different therapies for bone diseases such as osteoporosis have been
developed, influencing the RANK/RANKL/OPG pathway. For example, denosumab is one of such drugs that
binds with RANK-L, reducing its binding potential with its receptor RANK25, and with that diminishing the
differentiation to osteoclasts and their subsequent activation. In our model, this effect is modelled by adding the
following additional reaction in Eq. (3)33:
Scientific Reports | (2021) 11:2792 | https://doi.org/10.1038/s41598-021-82502-y 13
Vol.:(0123456789)www.nature.com/scientificreports/
pL
↓ kon
L + Cd ⇋ L • Cd (8)
↓ koff
dL
where Cd is the drug concentration in the plasma compartment, and kon and koff are the association and dissocia-
tion rate constants of that reaction, respectively. After inclusion of this reaction, πRANK−L changes in (4) such as33:
K •L k3 KLP πP Ba
πRANK−L = = k3 k1 kon (9)
K k4 1 + k4 K + k2 O + koff Cd
with KLP the maximum number of RANK-L attached to each cell s urface27.
Another drug usually used to treat osteoporosis is Ibandronate. Ibandronate, like other bisphosphonates,
adheres to the bone mineral, preventing the activity of mature osteoclasts25. As a consequence, the osteoclast
population (C) in Eq. (1) decreases8. In our model, we take this into account by adding the following equation:
dC Imax Cb
= DC πRANK−L 1 − − DA πTGFβ C (10)
dt IC50 + Cb
where DA and DC are the osteoclast apoptosis rate caused by TGFβ and the differentiation rate of osteoclast pre-
cursors to osteoclasts, respectively, as defined in Eq. (1), Imax is the maximal fractional extent of inhibition, IC50
the concentration producing 50% of maximal inhibition and Cb the concentration of bisphosphonate.
To calculate the drug concentrations (Cd and Cb ), a pharmacokinetic–pharmacodynamic (PK/PD) model
has been used8,33,35,58. Following33, the PK/PD model equations for subcutaneous administration of denosumab
may be stated as:
dCtot
= ka Dose × e−ka t /(Vc /F) − kint Ctot − (kel − kint )Cd , Ctot (0) = 0
dt
1
Cd = (Ctot − Rss − KD + (Ctot − Rss − KD )2 + 4KD Ctot ) (11)
2
dNTX
Imax Cd
= kin 1 − − kout NTX
dt IC50 + Cd
This model considers two compartments (subcutaneous and plasma) as shown in Fig. 11a. The first two
equations determine the drug pharmacokinetics providing the drug concentration in the plasma compartment.
In contrast, the third equation determines the pharmacodynamics in the action site, which reflects the maximal
drug effect on the bone tissue. In these equations, Dose corresponds to the denosumab dose administrated
subcutaneously during each time interval, Ctot is the total drug concentration, sum of the free drug (Cd ) and
the drug–ligand complex ( L • Cd ), ka is the first-order absorption rate of the drug administrated subcutane-
ously into the plasma compartment, Vc /F is the bioavailability-adjusted central compartment volume, kint is the
drug–ligand complex internalization or degradation, kel the drug removal rate from the central compartment,
Rss the concentration of free ligand in the steady-state situation, KD = koff /kon the equilibrium disassociation
constant for the drug–ligand reaction (Eq. (10)), NTX the crosslinked N-telopeptide of collagen type I, a bone
turnover biomarker measured in the serum, which determines the drug response in bone and, finally, kin and kout
are the production and removal rates of NTX, respectively. The steady-state values of NTX ( NTXss = kin /kout )
for multiple myeloma patients receiving 0.1, 0.3, 1.0 and 3.0 mg/kg of denosumab were chosen from33,36 who
gave values of 9.8, 9.1, 10.2 and 8.1 nM respectively.
Similarly, the PK/PD model for bisphosphonates as Ibandronate may be written a s35:
dCpl (CL + Qp1 + Qp2 + Qb ) Qp1 Qp2 Qb
=− × Cpl + × Cp1 + × Cp2 + × Cb , Cpl (0) = Dose
dt Vpl Vp1 Vp2 Vb
dCp1 Qp1 Qp1
= × Cpl − × Cp1 , Cp1 (0) = 0
dt Vpl Vp1
dCp2 Qp2 Qp2
= × Cpl − × Cp2 , Cp2 (0) = 0
dt Vpl Vp2
dCb Qb Qb
= × Cpl − × Cb , Cb (0) = 0
dt Vpl Vb
duCTX Rtar − KS (Cb /Vb )n
= KS × (1 + × [1 − e−kqq t ]) × (1 − ) − KD × uCTX
dt KS IC50 n + (Cb /Vb )n
(12)
The first four equations establish the four-compartment pharmacokinetic model for b isphosphonates35, pro-
viding the Ibandronate concentration in plasma, bone and two peripheral compartments (see Fig. 11a). In these
equations, the subscripts pl, p1, p2 and b stand for plasma, peripheral1, peripheral2 and bone compartments,
respectively. Ci (i = pl, p1, p2, b) is the drug concentration in the compartment i, Qi (i = p1, p2, b) is the inter-
compartmental clearance, Vi (i = pl, p1, p2, b) the volume of each compartment, and CL the renal clearance.
Scientific Reports | (2021) 11:2792 | https://doi.org/10.1038/s41598-021-82502-y 14
Vol:.(1234567890)www.nature.com/scientificreports/
Figure 11. Schematic representation of the bone remodeling model coupled with drug administration: (a) PK/
PD models for denosumab (top) and for Ibandronate (bottom); (b) effect of the biochemical pathway and bone
cells; (c) flowchart of mechano-biological response bone remodeling model.
Dose corresponds to the Ibandronate dose administrated intravenously during each time interval and Cpl is
the sum of current drug concentration and the amount administrated at the beginning of the dosage interval.
The fifth equation shows the pharmacodynamics of Ibandronate in bone, with uCTX the Urinary C-Terminal
Telopeptide of Collagen Type I, a bone turnover biomarker measured in urine, KS and KD the uCTX formation
and degradation rates, respectively, Rtar the limit value for the uCTX formation rate defined by the rate constant
of kqq , IC50 the Ibandronate concentration in the bone compartment producing 50% of maximum response of
uCTX and n the Hill c oefficient35. The PK/PD parameters used in this study are shown in Table 2, with the cor-
responding references.
Mineralization. Newly created bone tissue is mainly composed of collagen osteoid that is, then, progres-
sively mineralized. Mineralization is generally divided in two phases: the first one is fast (it lasts only several
days) reaching about 60% of the maximum mineral content in mature bone, while the second is much slower,
lasting several years to achieve the final mineral content in fully developed bone55,57. Here, as in our previous
model34, and in55, the first phase was assumed as instantaneous, following bone mineralization an exponential
evolution during the second stage, that is:
α(t) = αmax + (α0 − αmax )e−κt (13)
with αmax and α0 the maximum and initial ash fractions (bone residual after calcination that essentially corre-
sponds to the mineral content), respectively, and κ the exponential mineralization constant.
Taking this into account, and for a representative volumen element, the mean ash fraction at a certain time
after periods of new bone formation and resorption may be written as55:
t
(vb,0 − h0 )α(t) + 0 [(v̇F (τ ) − h(τ ))α(t − τ ) − (v̇R (τ ) − h(τ ))α(t − τ )]dτ
ᾱ(t) = (14)
vb (t) − h(t)
with vb,0 the initial bone volume fraction, while, from Eq. (1), v̇F = dB
dt and v̇R = dt are the rates of bone volume
a dC
fraction of newly created and resorbed bone, respectively and h0 is the initial microcrack density defined as the
number of microcracks per unit volume.
Scientific Reports | (2021) 11:2792 | https://doi.org/10.1038/s41598-021-82502-y 15
Vol.:(0123456789)www.nature.com/scientificreports/
Description Unit Value References
Denosumab
33
Dose Drug dose mg/kg 0.1, 0.3, 1.0, 3.0
33
ka Absorption rate 1/day 0.167
33
kint Drug–ligand complex internalization 1/day 2.67 × 10⁻²
33
kel Elimination rate of drug from central compartment 1/day 2.12 × 10⁻²
33
KD KD = koff /kon M 3.0 × 10⁻¹²
33
VC /F Central compartment volume l/kg 0.114
33
Rss Steady-state free ligand concentration nM 1.07
33
Imax Maximal fractional extent of inhibition – 0.331
33
IC50 Concentration producing 50% of maximal inhibition nM 2.64
33
kout Rate of loss of response 1/day 0.572
Ibandronate
8
Dose Drug dose mg 0.25, 0.5, 1.0, 2.0
35
Vpl Plasma compartment volume l 4.30
35
Vp1 Peripheral-1 compartment volume l 2.80
35
Vp2 Peripheral-2 compartment volume l 8.70
35
Vb Bone compartment volume l 609.00
35
Qp1 Plasma-peripheral-1 compartmental clearances l/day 69.43
35
Vp2 Plasma-peripheral-2 compartmental clearances l/day 18.57
35
Vb Plasma-bone compartmental clearances l/day 51.71
CL Renal clearance l/day 57.00 35
KS uCTX formation rate µg mmol CR−1 day−1 231.43 35
KD uCTX degradation rate 1/day 0.68 35
Rtar Limiting value of uCTX formation rate µg mmol CR−1 day−1 194.29 35
35
kqq Rate constant by which Rtar obtained l/day 0.0024
35
IC50 Ibandronate concentration producing 50% of maximum response µgl −1 0.37
n Hill coefficient – 1.92 35
Table 2. Values and description of the mechanical parameters.
Damage. Damage is here associated with the density of microcracks and strongly affects the mechanical
properties of bone as well as the signaling process among cells. Here, the microcrack density, h, is assumed to
have a linear relation with the damage level d, such as h = kd , with k = 0.0003455.
Bone, as a living tissue, is able to repair those micro-cracks, so damage increases when having high stresses/
strains, ḋacc (damage accumulation rate), while, at the same time, microcracks are removed in regions where
bone is resorbed, ḋrep (damage repair rate)2. We can then write:
ḋ = ḋacc − ḋrep (15)
As stated in34 the damage accumulation for a certain number of cycles is a function of the load amplitude and
the type of stress state (tension, dacc,t , or compression, dacc,c ) can be written as:
1
ln 1 − C1 εδ1 N ,
dacc,c = −
γ1
1 C
ln e 3 − C2 εδ2 N ,
γ2
dacc,t =1−
C3
(16)
1 − e−γ 1
δ1 = 10.3, γ1 = −5.238 E/E ∗ ε − 6100 + 7 10−3 , C1 =
,
9.333 × 1040
e C3 − 1
δ2 = 14.1, γ2 = −0.018 E/E ∗ ε − 4100 + 12, C2 =
, C3 = −20,
1.445 × 1053
√
which δ1,2, γ1,2 and C1,2,3 are parameters. N is the number of load cycles and ε = 2u/E is the equivalent strain
in each of those cycles, which described before, with u the strain energy density and E the elastic modulus. E ∗
is the the reference elastic modulus which for undamaged (d = 0) cortical bone the ratio E/E ∗ is equal to one.
Fatigue life ( Nf ) in compression and tension calculated as:
Scientific Reports | (2021) 11:2792 | https://doi.org/10.1038/s41598-021-82502-y 16
Vol:.(1234567890)www.nature.com/scientificreports/
Description Unit Value References
N Number of cycles – 10000 (500 for mandible) 55,63,64
m Weighing exponent – 4 55,56,65
55
ξ0∗ Reference equilibrium stimulus 0.0025
c Stimulus activation curve parameter – 0.0025 55
a Damage activation curve parameter – 20 –
55
d0 Initial damage – 0
55,65,66
αini Initial ash fraction – 0.6
55,66,67
α0 Minimal ash fraction – 0.45
55,66,67
αmax Maximum ash fraction – 0.7
55
κ Secondary mineralization period years 6
β Fatigue limit coefficient – 5 –
Table 3. Values and description of the mechanical parameters.
9.333×1040
Ki E 10.3 in compression
ε
E∗
(17)
� �
Nf = δ = 1.445×1053
, i = c compression , t(tension)
ε i E 14.1 in tension
E∗
ε
Finally, a Miner r ule59 was used the determine the increase in damage for a certain number of cycles, using
the bone fatigue life ( Nf ) for each strain level and for a particular bone calcium content as stated by Martinez
et al.57, being this latter directly related with the ash fraction as [Ca] = 259.2 60
0.69 α . The relationship between Kt and
the amount of calcium ([Ca]) in the bone is expressed by the following equations:
εu ([Ca]) δt
Kt ([Ca]) = 107 (18)
β
where δi and β are constants. εu is ultimate strain which has relation with calcium content:
logεu = 25.425 − 11.341log[Ca] (19)
Finally damage repair evolution is calculated as follows:
d
ḋrep = v̇R , (20)
vb
where v̇R = kres C is the rate of bone volume fraction due to osteoclasts activity.
Mechanical properties. Finally, as a first approach, and despite the well-known local orthotropy of bone
t issue61, we assumed bone tissue as heterogeneous and isotropic with its mechanical properties defined by the
following correlation between the volume fraction (vb), ash fraction (α) and damage (d), with the bone elastic
modulus55,62:
E = 84370vb2.58 α 2.74 (1 − d) (21)
A summary of the mechanical parameters used in these study are presented in Table 3.
Finally, a scheme of the chemo-mechano-biological bone remodeling model, coupled with the PK/PD models
for the two drug contents, is illustrated in Fig. 11.
Finite element simulation. Computed tomography images of a healthy adult woman were used to con-
struct the 3D geometric model of the mandible. After segmenting the mandible and teeth in MIMICS 10 (Mate-
rialise, Leuven, Belgium) and obtaining the STL files, CATIA (CATIA V5, Dassault Systèmes, Vèlizy-Villacou-
blay, France) was used to create the final three-dimensional geometry of the mandible, teeth, and PDLs (see
Fig. 12). The gaps between the mandible and the teeth were used to obtain the geometry of the PDLs. The
implant selected for this analysis is based on the INTRI design without internal resilient parts68. The height of
the implant was 11 mm and its diameters at the top and bottom were 5.1 mm and 4.5 mm with two threaded
steps of 1 and 0.5 mm respectively. Finally, the crown was designed for the first right molar, taking into account
the implant neck.
The model here developed is based on physiological mechanisms and properties, so, contrary to other phe-
nomenological bone remodeling models, it leads to wrong results when the initial density distribution is not
physiological and related to the initial values of the cell concentrations. Therefore, the geometry in Fig. 12 was
used first to obtain the initial density distribution for the next simulations. A phenomenological bone remodeling
model56,69 was used for this purpose, considering the mastication muscles’ reaction forces, while the boundary
conditions were applied to each teeth involved in the mastication process based on previous s tudies63,70. After
Scientific Reports | (2021) 11:2792 | https://doi.org/10.1038/s41598-021-82502-y 17
Vol.:(0123456789)You can also read


