Beijing 2008 Olympics ad dynamics
←
→
Page content transcription
If your browser does not render page correctly, please read the page content below
Beijing 2008 Olympics ad dynamics
           Nicholas C. GEORGANTZAS, Evangelos KATSAMAKAS, Blake BROWNE, Caitlin ARMISTEAD,
                        Bob SERPENTE, Rayma BARAN, John CHOI and Eric STEINBERG
                         Deming Scholars Program and System Dynamics Consultancy
                                 FORDHAM UNIVERSITY BUSINESS SCHOOLS
                                      113 West 60th Street • Suite 625-A
                                      New York, NY 10023-7484 • USA
                Tel: (+212) 636-6192 | ƒax: 1-212-765-5573 | e-mail: katsamakas@fordham.edu

Abstract
The Beijing 2008 Olympics glamour presents a unique profit opportunity from advertising for entertainment and
media firms worldwide. Poised to benefit from this prospect, the European Union Television Network (EUTV
Net) formed a system dynamics (SD) modeling team to carve its ad traffic system during and around the Beijing
2008 Olympics. EUTV Net’s objective is to maximize monetary gains by making its ads play on time, error free
and with minimal duplication effort. A seven-sector SD model shows ad traffic system structure and computed
scenarios identify the dysfunctional effects of the lack of information systems (IS) integration at EUTV Net. The
SD modeling process can help organizations respond to their IS integration problems in order to significantly
and sustainably improve their business performance.
Keywords: ad traffic, Beijing 2008 Olympic Games, IS integration, model test and validation, system dynamics

Slated to begin on 8 August 2008, the Beijing Olympics coverage by European Union’s Television Network
(EUTV Net), a pseudonym to protect the innocent at our client company, represents a most significant coverage
of the Olympics by a major European TV network. It marks a new phase in sports-content treatment from the
Far East on a live basis. New regulations from the International Olympic Committee reduce restrictions on
advertising and its content. Coupled with the 10 channels EUTV Net plans to devote to the Olympic Games, it
might turn the 2008 Olympics into a highly profitable enterprise for this media giant, with monetary gains
expected to exceed €2.5 billion.
         Spirits are high across the Atlantic too. More than half a year prior to the start of the Olympics, NBCU
announced, for example, an impressive group of top-tier companies committed to funding its advertising, which
includes Coca-Cola, AT&T, McDonalds, Nike and Target (Pursell 2008). To meet the needs of advertisers and
to capitalize on its ability to generate sales in a strong advertising environment, NBCU has pledged more than
3,600 hours of commercial coverage throughout the two-week event.
         Back in Europe, EUTV Net’s Beijing Olympics proposition holds potential for large-scale revenue.
Which turns Olympics-related advertising into a high priority for the firm’s ad media and spec centers (Fig. 1),
charged with the successful queuing and broadcasting of all ad content. The flowchart on Fig. 1 shows a highly
simplified depiction of ad traffic at EUTV Net during and around the Beijing 2008 Olympic Games.
         A system dynamics (SD) modeling group of eight people assessed EUTV Net’s ad traffic system
components. Based on information the client provided (Fig. 1), the SD modeling process culminated into a SD
model that shows critical interactions among subsystem components. It highlights areas in need of particular
attention in terms of either redesign or intensive monitoring to ensure the successful and seamless operation of
ad traffic at EUTV Net during the two-week Olympic Games period.
         Shown here is only a small part of the much larger modeling project at EUTV Net that combined both
deterministic and stochastic components to answer specific client concerns about how to respond effectively to
increasing external and internal ad failure severity and frequency. The project helped identify ways to make
advertisement content at EUTV Net on time, error free, and carried out with a minimal duplication of effort.
Extracted from that project is a purely deterministic SD model that simulates the flow of advertisement content
or ad traffic through the EUTV Net around and during the Beijing 2008 Olympic Games.
         The model’s time horizon is 28 days (672 hours). Week one represents preparation time, including
receipt of advertising content and its entry into multiple information systems (IS) that slate it into appropriate
spots. Weeks two and three represent ad playout during the Beijing 2008 Olympics, with 8-hour coverage per
day across EUTV Net’s 10 (ten) affiliated TV channels or stations. Week four entails auditing and reconciliation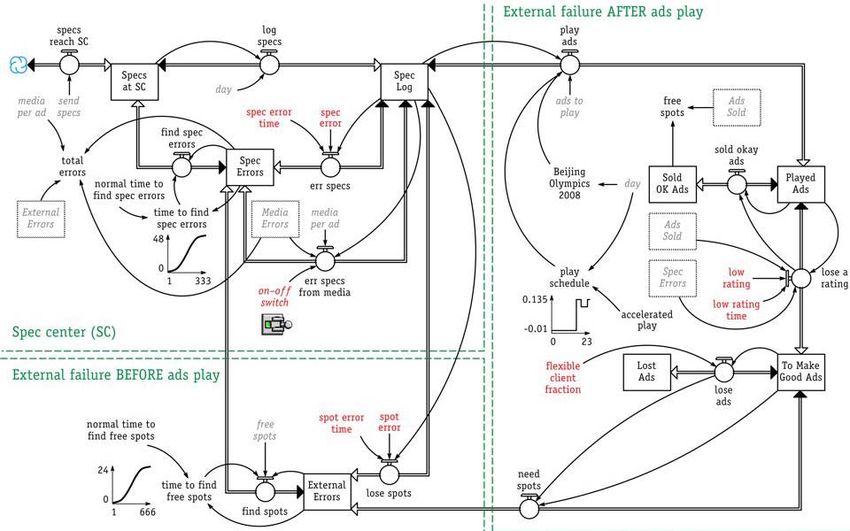
needed to determine whether all ad content airs at appropriate spots, including calculations related to agreed
upon ratings and number of duplicate advertisements.
          To put the flowchart on Fig. 1 into perspective, today’s firms need mature enterprise IS architectures
(Ross 2003, Ross, Weil et al. 2006). Enterprise IS architecture maturity is achieved in four stages of increasing
maturity: ‘business silos’, ‘standardized technology’, ‘rationalized processes’ and ‘business modularity’. In the
first stage of enterprise IS architecture maturity, disparate information-technology (IT) applications that address
local needs characterize business silos, not integrated to share enterprise-wide data. Given the lack of IS
integration between its ad spec and media centers (SC and MC, respectively, Fig. 1), EUTV Net fits squarely in
the business silos stage of IS maturity, with low performance implications for the company as a whole.
          On the top left of Fig. 1, ad sales contracts, sports-related ad traffic and reconciliation (recon) reports,
after ads play, feed the spec database 1, within EUTV Net’s SC. The database also incorporates non-sports
promotional (promo) elements. The SC spec database or log guides ad media at MC, formatted for standard
television (SDTV: media system 1) and high-definition TV (HDTV: media system 2). On the lower half of Fig.
1, spec databases 2 and 3 handle both specs and play schedules for promos not directly linked to Olympics
sports content. They guide ad content of the media mounted on media system 3.

                       Figure 1 Flowchart of Beijing 2008 Olympics ad traffic at EUTV Net
         Signed ad sales contracts signal ad agents to fax ad instructions or specs to SC and to send media to MC
(Fig. 1). The lack of IS integration between MC and SC requires EUTV Net workers to manually log and re-log
data from MC computers to SC computers, and vice versa. When SC changes its spec log, then MC workers
must manually update the appropriate media system. If MC alters media, either because of format errors or
because of recon actual reports after playout, now SC workers must manually update the pertinent spec
database. Imagine how time consuming and costly these rework feedback loops get, given that EUTV Net does
not operate just one, but 10 affiliated TV network channels or stations.
         Computed scenarios show that the pathway of opportunity for EUTV Net is to ascend to a more mature
enterprise IS architecture stage than its current business silos one. The next stage, standardized technology,
involves the implementation of a set of IS standards shared by all IT applications. Standardized technology
enables firms to move to the next stage, rationalized processes, where enterprise-wide IS support standardizes

                                                           2
business processes into efficient enterprise-wide sharing of data and processes. The highest stage of enterprise
IS architecture maturity, business modularity, involves a modular capability of integrating internal and external
processes (Ross 2003). EUTV Net cannot skip a stage in improving its IS maturity because important lessons
learnt at each stage enable firms to move on to the next one.
         The lack of IS integration in immature enterprise IS architectures can be painful. It stops firms from
developing effective end-to-end business processes. Processes cannot be automated nor rationally designed.
Instead of sharing data seamlessly across IT systems, multiple sources of un-standardized data and transferring
data manually from one IS to another become prevalent. Across-applications coordination is missing. Poor data
for decisions, slow, ineffective decision making, poor coordination and low transparency, lack of flexibility,
lack of shared understanding and high IT costs are symptoms of organizations lacking IS integration. The result
is, assuredly for EUTV Net, dysfunctional performance with intricate error dynamics.
         Conversely, going up the enterprise maturity ladder might yield significant performance improvements,
as a qualitative case of the Veteran Health Administration evolution suggests (Venkatesh, Bala et al. 2007). The
SD model of EUTV Net’s ad traffic system offers a rigorous approach to seeing the benefits of enterprise IS
integration. One insight of this study is that lack of IS integration increases dynamic complexity.1 That increases
both operational failure cost and management or coordination cost through a feedback-loop structure of multiple
interdependencies among cause and effect variables, distant both in space and in time.
         The model description section presents a seven-sector SD (Forrester 1958, 1961) model of the ad traffic
model at EUTV Net, which entails dynamically complex processes. Any model that purports to explain the
evolution of a dynamic process also defines a dynamic system either explicitly or implicitly (Repenning, 2002).
A crucial aspect of model building in any domain is that any claim a model makes about the nature and structure
of relations among variables in a system must follow as a logical consequence of its assumptions about the
system. And attaining logical consistency requires checking if the dynamic system the model defines can
generate the expected performance of the dynamic process the model tries to explain (Morecroft 2007, Ch. 10).
         The flowchart on Fig. 1 served well our EUTV Net modeling team in lieu of a rough-cut map. Like this
flowchart, however, most process and all standard operating procedure (SOP) models are merely textual and
diagrammatic in nature. Given a particular process that managers must manage, to determine if a prescribed idea
can generate superior performance, which only ‘systemic leverage’ endows (Georgantzas and Ritchie-Dunham
2003), managers must mentally solve a complex system of differential or difference equations. But relying on
intuition for testing logical consistency in dynamic business processes might contrast sharply with human
cognitive limits (Morecroft 1985, Paich and Sterman 1993, Sastry 1997, Sterman 1989).
         Aware of these limits, the article makes multiple contributions. One is the culmination of the ad traffic
situation at EUTV Net into a SD model that contains assumptions common to seemingly diverse processes in
economics, epidemiology, marketing, sociology and statistics. At the right level of abstraction, SD researchers
often encounter similar causal mechanisms that underlie seemingly diverse phenomena (Forrester, 1961). Two is
the translation of these seemingly diverse components into a computer simulation that allows addressing specific
client concerns at EUTV Net. Both contributions stem from articulating exactly how elements peculiar to ad
traffic IS structures interact through time. Client-driven, the SD modeling process aims at helping managers of
both manufacturing and service firms articulate exactly how the structure of circular feedback relations among
variables in the system they manage determines its performance through time (Sterman 2000, 2001). SD
emphasizes disequilibrium dynamics and thereby departs from the hyper-rationality and perfect foresight
typically assumed in equilibrium analysis (Sterman, Henderson, Beinhocker and Newman, 2007).
         Three, by describing SD and showing its value, the article encourages a wider adoption of the SD
method in ad traffic quality research, to help elucidate the quality management theory underlying Shewhart’s
and Deming’s work (Anderson, Rungtusanatham and Schroeder 1994, Schultz 1994). Four, the article does not
merely translate the ad traffic situation at EUTV Net into a SD model to compute scenarios of what might
happen around the Beijing 2008 Olympic Games. It dares to ask how and why the model produces the results it

1
  People often confuse the term ‘complex’ with ‘complicated’. But complexity must not be confused with the simple-
complicated dimension (Lissack and Roos 1999). Etymology shows that complicated uses the Latin ending -plic: to fold,
but complex contains the Greek root πλέξ- ‘plēx-’: to weave. A complicated structure is thereby folded, with hidden facets
stuffed into a small space. But a complex structure has interwoven parts with interdependencies that cause dynamic
complexity. Remember: complex is the opposite of independent or untwined and complicated is the opposite of simple.

                                                             3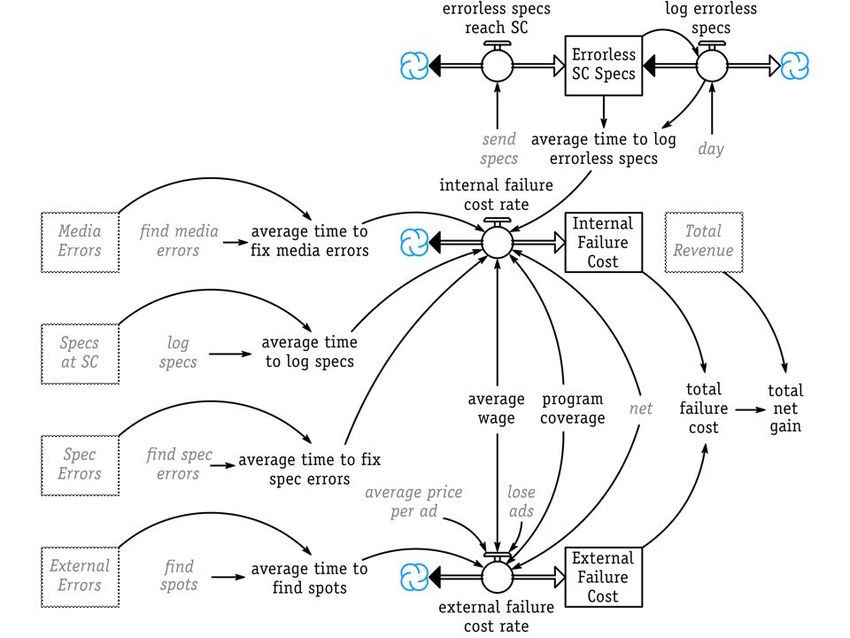
does. Hence, by venturing beyond dynamic and operational thinking, the article seeks insight from system
structure and thereby accelerates circular-causality thinking (Richmond 1993, Weick 1979).
         Five, the article also fills a gap in the information systems literature by assessing the adverse effects of
the lack of IS integration in EUTV Net’s ad traffic system. Driven by internal growth, mergers and acquisitions
(M&As), and technological change, firms are plagued with IS integration challenges. Anecdotal evidence and
many case studies exist about companies with IS integration problems (Laudon and Laudon 2006), but the
literature has not yet shown exactly how IS integration or the lack of it impacts performance.
Model description
The subsystem diagram of Fig. 2 shows the model’s seven sectors, dynamically interconnected through bundled
connectors and flows. The subsystem diagram also shows an IS integration on–oƒƒ switch, which can drastically
affect system structure. It instigates IS integration as a zero-one dummy variable: 0 = IS integration and 1 = no
IS integration. When the on–oƒƒ switch = 0, EUTV Net’s internal failure cost gets dramatically reduced,
showing the monetary benefits of IS integration. Most importantly perhaps, IS integration reduces EUTV Net’s
dynamic complexity, i.e., the interdependencies among variables connected through multiple feedback loops.

                              Figure 2 Subsystem diagram of ad traffic at EUTV Net
Ad sales model sector
Modeling ad traffic at EUTV Net during the Beijing 2008 Olympics with system dynamics hinges on two bases.
First, Deming’s System of Profound Knowledge, which integrates psychology, statistics, systems and theory of
knowledge, begins with building appreciation for a system (Anderson et al. 1994). Second, Deming said: “Until
you draw a flow diagram, you do not understand you business” (cf Schultz 1994, p. 21). System dynamics does
use stock and flow diagrams to depict relations among variables in a system. A fundamental tenet of system
dynamics is that the structure of relations among variables in a system gives rise to its behavior (Sterman 2001,
p. 16). Figure 3 shows the stock and flow diagram of EUTV Net’s ad sales model sector, reproduced from the
simulation model built with the iThink® (Richmond et al. 2007) SD software.
          There is a one-to-one correspondence between the model diagram on Fig. 3 and its equations (Table 1).
Building the model entailed first drawing the model structure on the glass of a computer screen and then
specifying simple algebraic equations and parameter values. The software enforces consistency between the
diagram and the equations, while its built-in functions help quantify parameters and variables pertinent to ad
traffic at EUTV Net around and during the Beijing 2008 Olympics.

                                                           4
Figure 3 Ad sales model sector
       In system dynamics, rectangles represent stocks or level variables that can accumulate, such as the Ads
Sold stock on Fig. 3. Emanating from cloud-like sources and ebbing into cloud-like sinks, the double-line, pipe-
and-valve-like icons that fill and drain the stocks represent flows or rate variables that cause the stocks to
change. The send media flow (lower right, Fig. 3) feeds the Media stock, for example, driven by the Ads Sold
level. Single-line arrows represent information connectors, while circular or plain text icons depict auxiliary
converters where behavioral relations, constants or decision points convert information into decisions. EUTV
Net’s ads to play capacity (lower middle, Fig. 3), for example, depends on both its ads per station capacity and
the firm’s 10 TV network or net stations.

Table 1 Ad sales model sector equations
Level (state) or stock variables {unit}                                                                     Eqn #
Ads Sold(t) = Ads Sold(t - dt) + (ad sales) * dt                                                              1
     INIT Ads Sold = 0.004 * ads to play {ad}                                                                1.1
Media(t) = Media(t - dt) + (send media) * dt {Note: an ad consists of two parts: media and specs}             2
     INIT Media = 0 {media}                                                                                  2.1
Specs(t) = Specs(t - dt) + (send specs) * dt {Again, each ad consists of two parts: media and specs}          3
     INIT Specs = 0 {spec}                                                                                   3.1
Flow or rate variables {unit}
ad sales = MAX (0, net ad sales growth fraction * Ads Sold) {ad / hour}                                       4
send media = MAX (0, (Ads Sold * media per ad - Media) / day) {media / hour}                                  5
send specs = MAX (0, (Ads Sold * specs per ad - Specs) / day) {spec / hour}                                   6
Auxiliary or converter variables and constants {unit}
ads per station = 922 {ad / station}                                                                         7
ads to play = ads per station * net {ad}                                                                     8
day = 24 {hour}                                                                                              9
maximum ad sales growth fraction = 1 / day {1 / hour}                                                        10
media per ad = 0.1 {media / ad}                                                                              11
net = 10 {station}                                                                                           12
net ad sales growth fraction = maximum ad sales growth fraction * (1 - Ads Sold / ads to play) {1 / hour}    13
specs per ad = 1 {spec / ad}                                                                                 14
         On Fig. 3, the net ad sales growth fraction (Eq. 13, Table 1), which determines ad sales (Eq. 4), is a
downward sloping or linearly declining function of the Ads Sold stock (Eq. 1), relative to its ads to play (Eq. 8)
capacity at EUTV Net’s 10-station network or net (Eq. 12). Initialized at a small, unitless fraction of EUTV Net’
ads to play capacity (Eq. 1.1), Ads Sold is an important special case of S-shaped growth, known as logistic or

                                                             5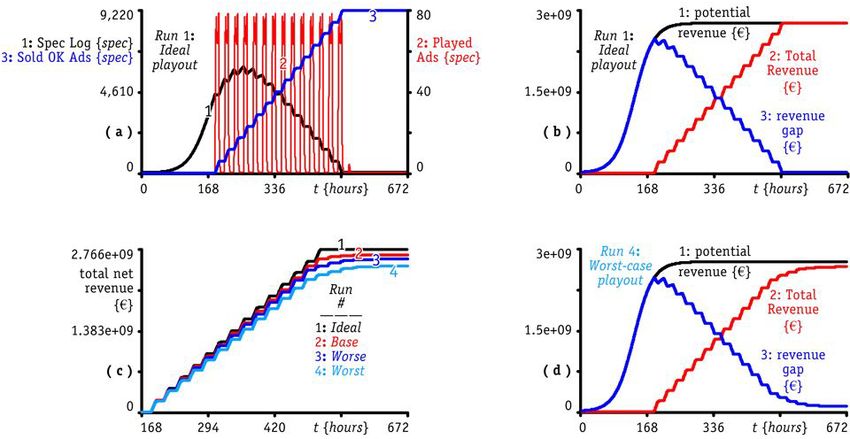
Verhulst growth, after François Verhulst who first published this model in 1838 (Richardson 1991). The logistic
model helps explain and predict EUTV Net’s Ads Sold, a real quantity that cannot grow forever.
         Every system that initially grows exponentially, eventually approaches the carrying capacity of its
environment, whether it be food supply for sheep, the number of people susceptible to infection or the potential
market for a good or service, e.g., ads. As an autopoietic system approaches its limits to growth, it goes through
a non-linear transition from a region where positive feedback dominates to a negative feedback dominated
regime. S-shaped growth often results: a smooth transition from exponential growth to equilibrium, captured by
the logistic function in the net ad sales growth fraction (Eq. 13, Table 1). Widely used for modeling population
growth, innovation diffusion, sales and other social phenomena, the logistic growth model conforms to the
requirements for S-shaped growth and the ecological concept of carrying capacity (Sterman 1990, pp. 296-7).
         The ad sales it models typically grow in a fixed ads scheduling environment: given EUTV Net’s ads to
play capacity (Eq. 8, Table 1), as more ads sell, ad sales eventually decline (Eq. 4). Once signed, sales contracts
signal ad agents to send their media and pertinent ad instructions or specs to EUTV Net’s media center (MC) and
spec center (SC), respectively (Fig. 1, 2, 4 and 5). Depending on the Ads Sold level (Eq. 1), the media per ad
(Eq. 11) and specs per ad (Eq. 14) constant parameters determine what ad agents send to EUTV Net’s media and
spec centers (Fig. 3, and rate Eqs 5 and 6, Table 1).
Media center (MC)
As ad media reach EUTV Net’s media center (Fig. 4 and Eq. 21, Table 2), they create a backlog of Media at MC
(Eq. 15). MC workers must prep and mount media in this backlog to make Media Ready (Fig. 4 and Eq. 17).
The prep media rate (Eq. 22) can be time consuming, depending on the media format (analog or digital). MC
workers always check media for errors as they prep them to feed the Media Ready stock, but media error (Eq.
23, Table 2) can strike any time (Eq. 24) without warning, causing media to err (Eq. 18).

                                    Figure 4 Media center (MC) model sector
         Reducing the Media Errors backlog (Fig. 4 and Eq. 16, Table 2) might entail error discovery and
recovery, and even involve external agents messing up, for example, a courier damaging media, but EUTV Net’s
MC always takes responsibility to find media errors (Eq. 20). The graphical table function (gtf) of time to find
media errors (Fig. 4 and Eq. 26) not only assumes that the more media errors are, the longer they take to recover
(Garcia 2006, p. 145), but also abides to the cumulative normal curve requirements (Franco 2007, Wilk and
Gnanadesikan 1968).
         Moreover, even if faultless and ready to air, media can also err from specs (Eq. 19) because of the lack
of IS integration between EUTV Net’s media and spec centers. The on–oƒƒ switch = 1 in Eq. 19 emulates this
lack of IS integration, which causes the firm’s ad traffic system to attain a high level of dynamic complexity.
With the on–oƒƒ switch = 1, the Media Ready stock is caught inside 16 feedback loops and the Media Errors
backlog inside 30 loops. With IS integration, i.e., on–oƒƒ switch = 0, the Media Ready loops drop down to three
and the Media Errors loops down to four, respectively. The REWORK built-in function of iThink® helps prevent
double counting Media Errors attributed to Spec Errors (Eq. 19), and vice versa (Eq. 31, Table 3).

                                                         6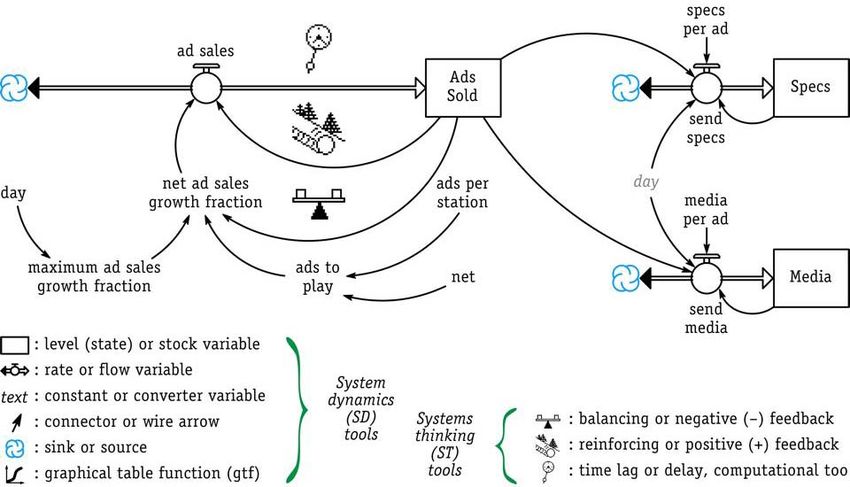
Table 2 Media center (MC) model sector equations
Level (state) or stock variables {unit} Eqn #
Media at MC(t) = Media at MC(t - dt) + (media reach MC + find media errors - prep media) * dt 15
INIT Media at MC = 0 {media} 15.1
Media Errors(t) = Media Errors(t - dt) + (err media + err media from specs - find media errors) * dt 16
INIT Media Errors = 0 {media} 16.1
Media Ready(t) = Media Ready(t - dt) + (prep media - err media - err media from specs) * dt 17
INIT Media Ready = 0 {media} 17.1
Flow or rate variables {unit}
err media = IF (Media Ready > 0) AND (INT (TIME / media error time) = TIME / media error time) THEN 18
(MIN (media error / DT, Media Ready / DT)) ELSE (0) {media / hour}
err media from specs = MAX (0, REWORK (on–oƒƒ switch * Spec Errors / (1e-9 + Spec Log) * media per ad 19
/ DT)) {media / hour}
find media errors = MAX (0, Media Errors / time to find media errors) {media / hour} 20
media reach MC = MAX (0, send media) {media / hour} 21
prep media = MAX (0, 0.5 * Media at MC / day + 0.3 * Media at MC / (2 * day) + 0.2 * Media at MC / (3 * 22
day)) {media / hour}
Auxiliary or converter variables and constants {unit}
media error = 9 {media} 23
media error time = 96 {hour} 24
normal time to find media errors = 1 {hour / media} 25
time to find media errors = GRAPH (Media Errors * normal time to find media errors) {hour} 26
(1.00, 0.447), (1.20, 1.64), (1.40, 4.81), (1.60, 11.4), (1.80, 22.2), (2.00, 36.0), (2.20, 49.8), (2.40, 60.6), (2.60, 67.2),
(2.80, 70.4), (3.00, 71.6)
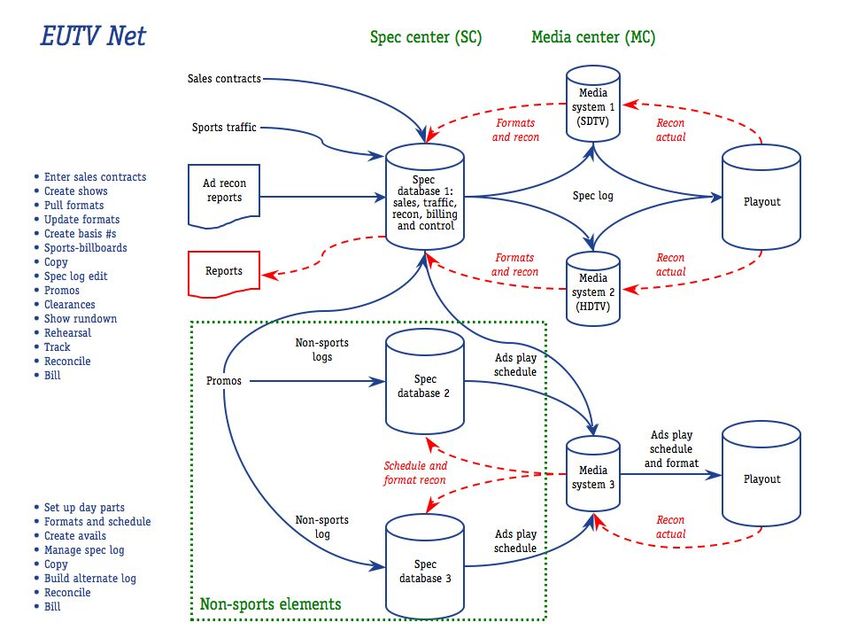
Spec center (SC), and external failure before and after ads play
Ads Sold generate ad specs, which reach EUTV Net’s SC via facsimile (Fig. 5 and Table 3). Faxed specs that
contain ad instructions build the Specs at SC backlog (Eq. 27), which SC workers deplete via the log specs rate
(Eq. 33). This is a tedious, time-consuming job, redolent with complicated details, as opposed to dynamic
complexity. Much like their MC counterparts, SC workers always check specs for errors as they log them to
feed the Spec Log stock (Eq. 29), but spec error (Eq. 37, Table 3) can also strike any time (Eq. 38), again
without warning, causing specs to err (Eq. 30).
EUTV Net deems critical to make its Spec Log as error free as possible. So, its SC log editors check and
re-check ad specs to determine whether they are ready for play or not. Reducing the Spec Errors backlog (SC,
Fig. 5 and Eq. 28, Table 3) entails spec error discovery and recovery, but it takes both time and lots of human
interaction to find spec errors (Eq. 32). The gtf of time to find spec errors (SC, Fig. 5 and Eq. 32) again assumes
that the more spec errors are, the longer they take to recover (Garcia 2006, p. 145), and also conforms to the
cumulative normal curve requirements (Franco 2007, Wilk and Gnanadesikan 1968).
In addition to the SC-specific errors, ad specs can also err from media (Eq. 31) because of the lack of IS
integration between EUTV Net’s MC and SC. Again, the on–oƒƒ switch = 1 (SC, Fig. 5 and Eq. 36, Table 3)
emulates the lack of IS integration, which not only feeds the spec center’s Spec Errors backlog, but also does so
while making EUTV Net’s ad traffic system attain increased dynamic complexity. With the on–oƒƒ switch = 1,
the Specs at SC backlog is caught inside 25 feedback loops, the Spec Log stock entails 48 loops and the Spec
Errors backlog 52. With IS integration, i.e., on–oƒƒ switch = 0, the Specs at SC backlog loops drop from 25 to
19, the Spec Log stock loops drop from 48 to 21 and the Spec Errors from 52 to 26 loops, respectively.
The limited, purely deterministic, non-proprietary edition of the SD model that this article shows
excludes all fixed overhead and coordination, i.e., management, cost considerations at EUTV Net. In reality,
however, these costs are much higher than the potential variable cost savings from IS integration reported here.
During and around the Beijing 2008 Olympic Games, EUTV Net anticipates its coordination cost to skyrocket as
its managers scramble, day and night, to find ways to make advertisement content at EUTV Net on time, error
free, and carried out with a minimal duplication of effort.
7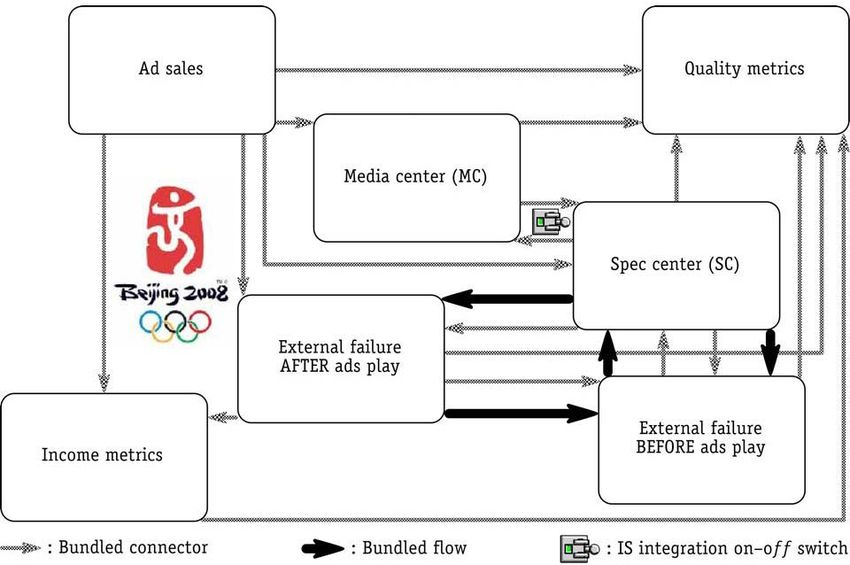
Figure 5 Spec center (SC), and external failure before and after ads play model sectors

Table 3 Spec center (SC) model sector equations
Level (state) or stock variables {unit}                                                                                        Eqn #
Specs at SC(t) = Specs at SC(t - dt) + (specs reach SC + find spec errors - log specs) * dt                                     27
     INIT Specs at SC = 0 {spec}                                                                                               27.1
Spec Errors(t) = Spec Errors(t - dt) + (err specs + find spots + err specs from media - find spec errors) * dt                  28
     INIT Spec Errors = 0 {spec}                                                                                               28.1
Spec Log(t) = Spec Log(t - dt) + (log specs - err specs - lose spots - play ads - err specs from media) * dt                    29
     INIT Spec Log = 0 {spec}                                                                                                  29.1
Flow or rate variables {unit}
err specs = IF (Spec Log > 0) AND (INT (TIME / spec error time) = TIME / spec error time) THEN (MIN                             30
     (spec error / DT, Spec Log / DT)) ELSE (0) {spec / hour}
err specs from media = MAX (0, REWORK (on–oƒƒ switch * (Media Errors / media per ad) / (1e-9 + Spec                             31
     Log) / DT)) {spec / hour}
find spec errors = IF (Spec Errors > 0) THEN (Spec Errors / time to find spec errors) ELSE (0) {spec / hour}                    32
log specs = MAX (0, 0.5 * Specs at SC / day + 0.3 * Specs at SC / (2 * day) + 0.2 * Specs at SC / (3 * day))                    33
     {spec / hour}
specs reach SC = MAX (0, send specs) {spec / hour}                                                                              34
Auxiliary or converter variables and constants {unit}
normal time to find spec errors = 1 {hour / spec}                                                                               35
on–oƒƒ switch = 1 {unitless}                                                                                                    36
spec error = 666 {spec}                                                                                                         37
spec error time = 72 {hour}                                                                                                     38
total errors = External Errors + (Media Errors / media per ad) + Spec Errors {spec}                                             39
time to find spec errors = GRAPH (Spec Errors * normal time to find spec errors) {hour}                                         40
    (1.00, 0.298), (34.2, 1.09), (67.4, 3.21), (101, 7.62), (134, 14.8), (167, 24.0), (200, 33.2), (233, 40.4), (267, 44.8),
    (300, 46.9), (333, 47.7)

                                                                       8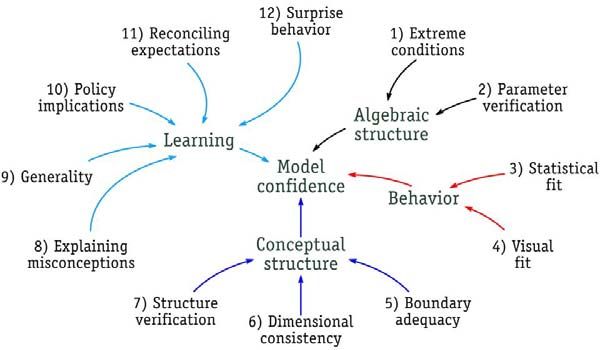
External failure BEFORE ads play
The External Errors backlog (lower left, Fig. 5 and Eq. 41, Table 4) also adds to Spec Errors (SC, Fig. 5 and Eq.
28, Table 3). It does so while EUTV Net’s SC log editors scramble to find free ad spots (Eq. 42, Table 4), which
they lose (Eq. 43) because of external failure (Eqs 45 and 46) before ads play. To give but one example, this
might entail the Beijing 2008 Olympics swimming events pushed back a few days because of technical
problems with some under-water photo-finish equipment. The swimming-related ads will either lose their spot
or be reshuffled by SC log editors until satisfactory. But scrambling to find free spots also takes time. Once
more, the gtf (graphical table function) of time to find free spots (lower left, Fig. 5 and Eq. 47, Table 4) both
assumes that the more External Errors are, the longer they take to correct (Garcia 2006, p. 145), and conforms to
the cumulative normal curve requirements (Franco 2007, Wilk and Gnanadesikan 1968).

Table 4 External failure before ads play model sector equations
Level (state) or stock variable {unit}                                                                                         Eqn #
External Errors(t) = External Errors(t - dt) + (lose spots + need spots - find spots) * dt                                      41
     INIT External Errors = 0 {spec}                                                                                           41.1
Flow or rate variables {unit}
find spots = IF (External Errors > 0) THEN ( MIN (External Errors / time to find free spots, free spots / time to               42
     find free spots)) ELSE (0) {spec / hour}
lose spots = IF (Spec Log > 0) AND (INT (Time / spot error time) = Time / spot error time) THEN (MIN (spot                      43
     error / DT, Spec Log / DT)) ELSE (0) {spec / hour}
Auxiliary or converter variables and constants {unit}
normal time to find free spots = 1 {hour / spec}                                                                                44
spot error = 6666 {spec}                                                                                                        45
spot error time = 48 {hour}                                                                                                     46
time to find free spots = GRAPH (External Errors * normal time to find free spots) {hour}                                       47
    (1.00, 0.149), (67.5, 0.546), (134, 1.60), (200, 3.81), (267, 7.40), (334, 12.0), (400, 16.6), (466, 20.2), (533, 22.4),
    (600, 23.5), (666, 23.9)

External failure AFTER ads play
In addition to losing ad spots before ads play, External Errors can also occur after ads play, attributed to low
program ratings (middle right, Fig. 5 and Eqs 52, 61 and 62). If failures occur after ads play, per its extant
contractual obligations and depending on how flexible its clients are (Eq. 59, Table 5), EUTV Net must handle
ads that receive low ratings after playout to make good on them.
          On the top right of Fig. 5, the play ads rate (Eq. 55) concurrently depletes the Spec Log backlog and
feeds the Played Ads stock (middle right, Fig. 5 and Eq. 49), according to EUTV Net’s play schedule (Fig. 5 and
Eq. 63). Depending on EUTV Net’s ad accelerated play per hour per hour (Eq. 57), the play schedule gtf
operates in discontinuous mode to emulate the discontinuous playout of advertising content during the Beijing
2008 Olympics, with eight hours of daily coverage, including prime time (6-10 PM), across EUTV Net’s 10 TV
net stations.
          Most ads play fine and receive the high ratings that EUTV Net anticipates, so they feed the Sold OK Ads
stock (Eq. 50), at the sold okay ads rate (Eq. 56). Among Played Ads, those that receive a low rating (Eqs 61
and 62) because, for example, viewers switch channels to watch the news about terrorism or a natural disaster,
fill the To Make Good Ads stock (Eq. 51), at the lose a rating rate (Eq. 52). Depending on ad contracts and how
flexible or inflexible its clients are, EUTV Net can either lose ads (Eq. 53) to feed its Lost Ads stock (Eq. 48) or
need spots (Eq. 54) to make good on ads that played smoothly but received low ratings. The available free spots
(Eq. 60) that EUTV Net can use to make good on ads that received low ratings after playout is the algebraic
difference between the Ads Sold stock (Fig. 1 and Eq. 1, Table 1) minus the Sold OK Ads stock (Fig. 5, Eq. 50).

                                                                      9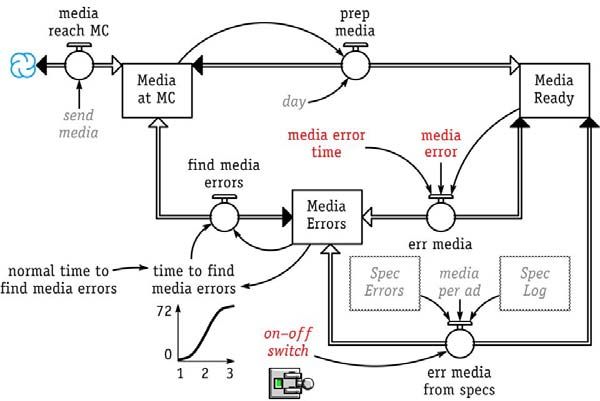
Table 5 External failure after ads play model sector equations
Level (state) or stock variables {unit}                                                                                             Eqn #
Lost Ads(t) = Lost Ads(t - dt) + (lose ads) * dt                                                                                     48
     INIT Lost Ads = 0 {spec}                                                                                                       48.1
Played Ads(t) = Played Ads(t - dt) + (play ads - lose a rating - sold okay ads) * dt                                                 49
     INIT Played Ads = 0 {spec}                                                                                                     49.1
Sold OK Ads(t) = Sold OK Ads(t - dt) + (sold okay ads) * dt                                                                          50
     INIT Sold OK Ads = 0 {spec}                                                                                                    50.1
To Make Good Ads(t) = To Make Good Ads(t - dt) + (lose a rating - need spots - lose ads) * dt                                        51
     INIT To Make Good Ads = 0 {spec}                                                                                               51.1
Flow or rate variables {unit}
lose a rating = IF (Played Ads > 0) AND (INT (Time/low rating time) = Time/low rating time) THEN (MIN                                52
     (low rating / DT, Played Ads / DT) + REWORK (Spec Errors / Ads Sold / DT)) ELSE (0) {spec / hour}
lose ads = IF ((1 - flexible client fraction) * To Make Good Ads / DT > 0) THEN ((1 - flexible client fraction)                      53
     * To Make Good Ads / DT) ELSE (0) {spec / hour}
need spots = IF ((To Make Good Ads - lose ads) / DT > 0) THEN ((To Make Good Ads - lose ads) / DT)                                   54
     ELSE (0) {spec / hour}
play ads = IF (TIME > 168) AND (Spec Log > 0) THEN (MIN (PULSE (Spec Log * play schedule), ads to                                    55
     play / Beijing Olympics 2008 * play schedule)) ELSE (0) {spec / hour}
sold okay ads = MAX (0, Played Ads - lose a rating) {spec / hour}                                                                    56
Auxiliary or converter variables and constants {unit}
accelerated play = 1 {1 / hour ^ 2}                                                                                                  57
Beijing Olympics 2008 = 336 / day {unitless}                                                                                         58
flexible client fraction = 0.85 {unitless}                                                                                           59
free spots = MAX (0, Ads Sold - Sold OK Ads) {spec}                                                                                  60
low rating = 6666 {spec}                                                                                                             61
low rating time = 24 {hour}                                                                                                          62
play schedule = GRAPH (MOD (accelerated play * TIME, day)) {1 / hour}                                                                63
    (0.00, 0.00), (1.00, 0.00), (2.00, 0.00), (3.00, 0.00), (4.00, 0.00), (5.00, 0.00), (6.00, 0.00), (7.00, 0.00), (8.00, 0.00),
    (9.00, 0.00), (10.0, 0.00), (11.0, 0.00), (12.0, 0.00), (13.0, 0.00), (14.0, 0.00), (15.0, 0.124), (16.0, 0.124), (17.0,
    0.124), (18.0, 0.0954), (19.0, 0.0954), (20.0, 0.0954), (21.0, 0.0954), (22.0, 0.124), (23.0, 0.124)

Income metrics
Ads Sold (Fig. 1) and the average price per ad (left, Fig. 6 and Eq. 68, Table 6) co-determine EUTV Net’s
potential revenue (Fig. 6 and Eq. 71). The product of the average seconds per ad (top left, Fig. 6 and Eq. 68)
times the average price per second (Eq. 69) parameters determines the average price per ad. Similarly, average
price per ad and sold okay ads (Eq. 56, Table 5) co-determine EUTV Net’s sales revenue rate (Eq. 67), which
feeds the Total Revenue stock (Eq. 65). The potential revenue minus Total Revenue difference produces EUTV
Net’s revenue gap (Eq. 72) and Total Revenue minus Lost Revenue gives its total net revenue (lower right on
Fig 6 and Eq. 73, Table 6). Again, all this entails strictly operational cost terms, excluding fixed overhead and
coordination, i.e., management, costs.

                                                Figure 6 Income metrics model sector

                                                                       10
Table 6 Income metrics model sector equations
Level (state) or stock variables {unit} Eqn #
Lost Revenue(t) = Lost Revenue(t - dt) + (lost sales revenue) * dt 64
INIT Lost Revenue = 0 {€} 64.1
Total Revenue(t) = Total Revenue(t - dt) + (sales revenue) * dt 65
INIT Total Revenue = 0 {€} 65.1
Flow or rate variables {unit}
lost sales revenue = average price per ad * (lose a rating + lose ads) {€ / hour} 66
sales revenue = average price per ad * sold okay ads {€ / hour} 67
Auxiliary or converter variables and constants {unit}
average price per ad = average price per second * average seconds per ad {€ / ad} 68
average price per second = 750000 / 30 {€ / sec} 69
average seconds per ad = 12 {second / ad} 70
potential revenue = average price per ad * Ads Sold {€} 71
revenue gap = potential revenue - Total Revenue {€} 72
total net revenue = Total Revenue - Lost Revenue {€} 73
Quality metrics
With its “dramatic implications” (Sterman 2000, p. 423) for business performance, Little’s (1961) law helps
compute the average residence time of specs and faulty specs (errors) in their respective backlogs (left, Fig. 7)
through the ratio of the pertinent stock in transit to its outflow rate (Fig. 7 and Eqs 81 through 85, Table 7).
Three of these ratio metrics contribute to the internal failure cost rate (Eq. 79). There, a fourth ratio metric,
average time to log errorless specs (Eq. 84), deflates the internal failure cost rate from EUTV Net’s ideal, i.e.,
errorless, operating cost, so that the internal failure cost rate does not in turn inflate the Internal Failure Cost
stock (Fig 7 and Eq. 76, Table 7) it feeds. On the top right of Fig. 7, the ideal Errorless SC Specs stock (Eq. 74),
along with its associated errorless specs reach SC inflow (Eq. 77) and log errorless specs outflow (Eq. 80) are
material for proper accounting while the SD model computes scenarios of what might happen to EUTV Net’s ad
traffic system around and during the Beijing 2008 Olympics.
Figure 7 Quality metrics model sector
The fifth Little’s law-based ratio auxiliary variable on Fig. 7, the average time to find spots (Eq. 81),
contributes to EUTV Net’s external failure cost rate (Eq. 78), together with the average price per ad (Eq. 68,
11Table 6), average wage (Eq. 86, Table 7), program coverage (Eq. 87) and net (Eq. 12, Table 1) parameters, two
of them ghosted from their respective model sectors to avoid diagram clutter. The external failure cost rate feeds
the External Failure Cost stock (Eq. 75) which, together with the Internal Failure Cost stock co-determine EUTV
Net’s total failure cost (Eq. 88). Last but not least, the Total Revenue stock minus EUTV Net’s total failure cost
converter difference produces the firm’s total net gain (right, Fig. 7 and Eq. 89, Table 1), strictly in operational
cost terms once more, without accounting for any fixed overhead and coordination, i.e., management, costs.
Table 7 Quality metrics model sector equations
Level (state) or stock variables {unit} Eqn #
Errorless SC Specs(t) = Errorless SC Specs(t - dt) + (errorless specs reach SC - log errorless specs) * dt 74
INIT Errorless SC Specs = 0 {spec} 74.1
External Failure Cost(t) = External Failure Cost(t - dt) + (external failure cost rate) * dt 75
INIT External Failure Cost = 0 {€} 75.1
Internal Failure Cost(t) = Internal Failure Cost(t - dt) + (internal failure cost rate) * dt 76
INIT Internal Failure Cost = 0 {€} 76.1
Flow or rate variables {unit}
errorless specs reach SC = MAX (0, send specs) {spec / hour} 77
external failure cost rate = MAX (0, average time to find spots * average wage * net * program coverage + 78
average price per ad * lose ads) {€ / hour}
internal failure cost rate = MAX (0, (average time to fix media errors + average time to fix spec errors + 79
average time to log specs - average time to log errorless specs) * average wage * net * program coverage)
{€ / hour}
log errorless specs = MAX (0, 0.5 * Errorless SC Specs / day + 0.3 * Errorless SC Specs / (2 * day) + 0.2 * 80
Errorless SC Specs / (3 * day)) {spec / hour}
Auxiliary or converter variables and constants {unit}
average time to find spots = External Errors / (1e-9 + find spots) {hour} 81
average time to fix media errors = Media Errors / (1e-9 + find media errors) {hour} 82
average time to fix spec errors = Spec Errors / (1e-9 + find spec errors) {hour} 83
average time to log errorless specs = Errorless SC Specs / (1e-9 + log errorless specs) {hour} 84
average time to log specs = Specs at SC / (1e-9 + log specs) {hour} 85
average wage = 20 {€ / hour / station} 86
program coverage = 1 {1 / hour} 87
total failure cost = External Failure Cost + Internal Failure Cost {€} 88
total net gain = Total Revenue - total failure cost {€} 89
Computed scenarios
The simulation results show five computed scenarios of what might happen to EUTV Net’s ad traffic during and
around the Beijing 2008 Olympics. Table 8 shows the first four of these scenarios that the purely deterministic
SD model computes. They assess potential implications for EUTV Net’s performance, in terms of income and
quality metrics, as error severity and frequency increase incrementally. The first or ideal scenario assumes that
all ad traffic runs smoothly at EUTV Net, with zero errors in ad media and specs, and without any external errors
causing lost ad spots and, lo and behold, low ad ratings. Moreover, all clients are flexible with ad spots.
Table 8 Computed scenarios of increasing error severity and frequency {units: d = day and h = hour}
media media spec spec spot spot low low flexible
Run error error error error error error rating rating client
# {media} time {h} {spec} time {h} {spec} time {h} {spec} time {h} fraction
1: Ideal 0 168 (7 d) 0 144 (6 d) 0 120 (5 d) 0 96 (4 d) 1.00
2: Base 3 144 (6 d) 222 120 (5 d) 2,222 96 (4 d) 2,222 72 (3 d) 0.95
3: Worse 6 120 (5 d) 444 96 (4 d) 4,444 72 (3 d) 4,444 48 (2 d) 0.90
4: Worst 9 96 (4 d) 666 72 (3 d) 6,666 48 (2 d) 6,666 24 (1 d) 0.85
Admittedly, the entire planet’s population would have to collaborate to make this utopia scenario play
(#1: Ideal, Table 8). But it is useful to let EUTV Net know what its performance metrics might potentially look
like, if 0 (zero) errors were humanly feasible.
12Then the base-, worse- and worst-case scenarios on Table 8 explore how EUTV Net’s income and
quality metrics might respond to the incrementally increasing error severity and frequency. To give but one
example of that the terms ‘error severity and frequency’ and their respective scenarios mean, let’s follow the
incremental changes in the low rating and low rating time parameters down on Table 8. Incrementally
increasing error severity means that unanticipated world events might make TV viewers switch channels, their
moving away from the Beijing Olympics sports events, potentially causing 2,222, 4,444 and 6,666 low ad
ratings at a time, respectively, under the base-, worse- and worst-case scenarios on Table 8, respectively.
Incrementally increasing error frequency means that these low ad ratings occur every three, two and one days,
respectively, under the base-, worse- and worst-case scenarios on Table 8, respectively.
The four computed scenarios on Table 8 emulate ad traffic at EUTV Net as is: with its ad media and
spec centers functioning as business silos, without IS integration, i.e., on–oƒƒ switch = 1 (one). A fifth scenario
that the SD model computes, not shown on Table 8, entails the same error severity and frequency as the
#4: Worst-case scenario on Table 8 does, but with IS integration, i.e., on–oƒƒ switch = 0 (zero). This scenario
offers a unique opportunity for EUTV Net to rigorously assess the benefits of enterprise IS integration.
Figure 8 shows results for the ad sales, MC and SC sector metrics at EUTV Net, under the computed
scenarios on Table 8. Through time (Fig. 8a), ad sales feeds Ads Sold, which in turn cues ad agents to send their
ad media to EUTV Net’s MC. The Media stock lags behind Ads Sold because it takes time for ad agents to
prepare and to send their ad media to MC. Similarly, the Media Ready stock lags behind Media because of the
time it takes EUTV Net’s MC workers to receive, to mount and to inspect ad media before they render Media
Ready for playout.
Figure 8 Computed scenarios for ad sales, media center (MC) and spec center (SC) metrics at EUTV Net
The difference in amplitude between ad Media at SC and ad Media Ready represents the extra number
of ads that go into the MC and SC computer systems to ensure continuous operation in the event of errors.
Following on the heels of the logistic or Verhulst S-shaped growth of Ads Sold on Fig. 8a, Media and Media
Ready increase at an increasing rate until they reach their respective inflection points. Thereafter, like Ads Sold,
they increase concurrently at a declining rate and then plateau as the Beijing 2008 Olympics commence and ad
operations begin to slow down in terms of preparation. Past the 504-hour mark, EUTV Net will only focus on
reconciliation and will not be entering any new data other than to correct internal and external failures. And the
smooth behavior of the five metrics on Fig. 8a persists undisturbed under all 4 scenarios on Table 8.
That is not, however, the case for the Specs at SC stock. Here (Fig. 8b), the Specs at SC backlog
responds differentially under the base-, worse- and worst-case scenarios of Table 8. Once these three scenarios
of incrementally increasing error severity and frequency play, Specs at SC overshoots EUTV Net’s ideal or
errorless Specs at SC and remains high thereafter, contributing to EUTV Net’s Internal Failure Cost (Fig. 7).
13Likewise, the Spec Log backlog (Fig. 8c) responds differentially under the base-, worse- and worst-case
scenarios (Table 8). But unlike Specs at SC, Spec Log remains proportionally lower than under the #1: Ideal-
case scenario of Table 8. What causes the anomalous dynamics of Specs at SC and Spec Log is the fire-like
Spec Errors accumulation (Fig. 8d). Without IS integration at EUTV Net, Spec Errors is caught inside a
malicious web of 52 interdependent feedback loops, causing both Specs at SC to inflate inside its own web of 25
feedback loops, and Spec Log to deflate, the latter backlog also caught inside 48 loops.
The time-series graph on Fig. 9a shows the relations through time among Spec Log, Played Ads and
Sold OK Ads, under the #1: Ideal-case or errorless scenario on Table 8. Focusing first on the Spec Log backlog,
its curve increases in a step pattern. The ads to play increase during the week prior to the start of the Olympics.
As ads play out in the second week, the first week of the Olympics, Spec Log peaks on the fourth day of the
Olympics and then gradually drops as each day passes and the amount of Ads Sold is reaching its saturation
point of 9,220 ads (Fig. 8a).
Ads Played varies wildly because the Olympics-related ads play for 8 hours a day, 1/3 of a day’s
programming per channel. EUTV Net fills the remaining 16 hours with regular network programming and
regular ads. Ads Played during the Olympics programming are in fact the peaks of the Ads Played curve, which
flat lines a day after the Olympics because there are no Olympics Ads Sold left to show.
Sold OK Ads are the ads played fine, i.e., without errors, during the Olympics (Fig 9a). ETVU Net sells
ad time prior to the Games, but collects its revenue after sold ads actually show on its airwaves. This explains
why Sold OK Ads (Fig. 9a), Total Revenue (Fig. 9b and Fig. 9d) and total net revenue (Fig. 9c) all increase in a
step pattern. EUTV Net collects no revenue until after the first day of the Olympics. Its revenue curves increase
when it collects revenue for the prior day’s ads shown and then slightly plateau while next day’s programming
plays. EUTV Net then collects next day’s revenue. This pattern continues until the day after the Olympics and
then plateaus, as EUTV Net has no revenue pending to collect from Olympics ads.
Figure 9 Computed scenarios for spec center (SC) and income metrics at EUTV Net
Under the ideal or errorless playout scenario on Fig. 9b, through time, EUTV Net’s potential revenue
increases, Total Revenue comes closer and closer to its potential revenue and its revenue gap reacts inversely.
Potential revenue is the perceived monetary € stream of what the network might receive at the end of the run in
ads. The day after the Olympic games begin, EUTV Net’s Total Revenue starts to move up to match its potential
revenue from Olympics-related ads and so does its total net revenue (Fig. 9c). Its revenue gap begins to decrease
the day after the start of the Olympics because of realized Total Revenue (Fig. 9b).
But the effects of incrementally increasing error severity and frequency can easily diminish EUTV Net’s
income metrics. If the base-, worse- and worst-case scenarios of Table 8 play, then the network might anticipate
less total net revenue (Fig. 9c). As its Total Revenue falls short of matching its potential revenue on Fig. 9d, its
14revenue gap, the difference between Total Revenue and Lost Revenue (Fig. 6 and Eq. 73, Table 6), remains
positive, well above zero at the end of the SD model’s time horizon of 672 hours or 28 days (4 weeks).
Looking more closely at what causes the step-pattern dynamics of variables on Fig. 9, Played Ads
behaves quite differently under the computed ideal- and worst-case ad playout scenarios at EUTV Net (Fig. 10).
Under the worst-case playout scenario, the fire-like Spec Errors accumulation (Fig. 8d) depletes the Spec Log
backlog (Fig. 8c), thereby causing EUTV Net to run short of ads to play on days 13 and 14 of the Olympics (Fig.
10). The reduced Spec Log reduces Played Ads, which get further reduced as low ratings increase To Make
Good Ads (right, Fig. 5). To Make Good Ads in turn feeds External Errors, thereby driving Spec Errors even
higher, which in turn depletes Media Ready via Media Errors (Fig. 4). Closing the loop, because of EUTV Net’s
lack of IS integration, Media Errors further depletes the Spec Log backlog (Fig. 5). Which makes EUTV Net’s
10 stations play and re-play ads during the ad reconciliation week, still showing Olympics ads 21 days after the
14-day long Olympics start and end.
Figure 10 Computed ideal- and worst-case ad playout scenarios at EUTV Net
The phase plot on Fig. 11a shows that, under the ideal playout scenario, there is no correlation between
ETVU Net’s Sold OK Ads and Lost Ads. But under the incrementally increasing error severity and frequency
scenarios of Table 8, the higher Sold OK Ads are, the higher Lost Ads get, also because of inflexible clients.
And as errors and inflexible clients increase, so does the correlation between these two variables.
Figure 11 Computed scenarios for spec center (SC) and quality metrics at EUTV Net
15Conversely, as error severity and frequency increase, the correlation between EUTV Net’s Internal
Failure Cost and total net gain gets smaller (Fig. 11b). But, as the phase plot on Fig. 11b shows, if EUTV Net
integrates its media and spec center computer systems, i.e., on–oƒƒ switch = 0, then, under the #5: Worst-case
playout scenario (Fig. 11b), it might see more than a 37 percent reduction in its Internal Failure Cost, coupled
with a slight increase in its total net gain, during the 28-day horizon around the Beijing 2008 Olympics.
Back to the time domain (Fig. 11c). The IS integration scenario sequesters EUTV Net’s Internal Failure
Cost not only below the results of the #4: Worst-, but also below the #3: Worse-case, without IS integration
playout scenario (Table 8). Given that through its 4-week time horizon the model computes EUTV Net’s
potential Internal Failure Cost savings at €3,268,778, over a 52-week horizon, IS integration might benefit
EUTV Net by more than €42 million in annual Internal Failure Cost savings.
Discussion and conclusion
The buzz around the Beijing 2008 Olympics has many EUTV Net clients flocking for advertising time during
this international event. EU TV means enormous access and exposure for each client company. The Beijing
2008 Olympics has fewer restrictions on ads during coverage compared to all previous Olympics. This gives
EUTV Net incredible hours of coverage with volumes of ads. The great capacity for ad spots and volume per day
requires a system that is dynamic in reaction to live sporting events with big revenue stakes.
EUTV Net’s ad traffic system is both combinatorially complicated and dynamically complex. It is
daunting just to see how one commercial spot and its playout involve so many interacting parts to properly show
the ad and to collect revenue. The system dynamics modeling process helped our modeling team at EUTV Net
accomplish the task of capturing the processes required to complete the cycle of services purchased, services
rendered, and revenue received by our client. The larger, proprietary model contains stochastic elements that
made the simulation results more photorealistic, more real life. Other than that, however, the statistics did not
add much insight to EUTV Net’s ad traffic situation during and around the Beijing 2008 Olympics.
Increasing the dynamic complexity of the system under management, the lack of IS integration has
deleterious effects on business performance, along both income and quality metrics. As IS integration problems
challenge many companies, SD can provide a powerful tool for understanding these problems, optimizing
business processes and achieving stronger, sustainable performance via more mature enterprise architectures.
Model validity
Born in 535 BC in Ephesus, a great Hellenic Ionian city, Heracletus made the first notable contribution
to system dynamics in 500 BC, when he articulated his universal flux doctrine: «everything flows» (Kirk, Raven
and Schofield 1995). It took 2,458 years and another beautiful mind, that of Forrester’s (1958), who built on
Heracletus’ logos by showing that indeed, everything flows «in and out of stocks». Influenced by cybernetics
(Wiener 1948, 1954), Forrester’s extending of Heracletus’ universal flux doctrine gave birth to SD, born both an
applied and a most practical modeling method.
But the flux nature of SD necessitates a broad and pragmatic approach to SD model validation (Bell and
Senge 1980, Forrester and Senge 1980, Morecroft 2007: Ch. 10, Sterman 2000: Ch. 21). The influence diagram
(ID) on Fig. 12 shows four test groups that can help build confidence in system dynamics models. The diagram
shows algebraic and conceptual structure tests, as well as behavior and learning tests. Any one of them alone
cannot prove model validity. But combined, they might help clients and modelers see a model’s quality and
usefulness (Morecroft 2007, p. 410).
Does the SD model of EUTV Net’s ad traffic around the Beijing 2008 Olympics pass the test gauntlet on
Fig 12? To build confidence in the model, what follows draws heavily on Morecroft’s (2007) Ch. 10: Model
Validity, Mental Models and Learning.
Algebraic structure tests. The model responds quite robustly to the extreme range of increasing error
severity and frequency. Under the #4: Worst-case scenario on Table 8, almost 1/3 of the ads that EUTV Net
anticipates to sell fail either internally or externally, both before and after ads play. Moreover, EUTV Net data
helped verify all model parameters.
Behavior tests. Although EUTV Net does not yet have any actual data from the Beijing 2008 Olympics,
the Ads Played dynamics (Fig. 9 and Fig. 10) provides a perfect visual fit with EUTV Net’s regular playout and
Olympics rehearsals. Given the lack of actual data from the future, our SD modeling team did not formally test
for magnitude, shape, periodicity and phasing of trajectories. The visual fit is, however,
16a common and effective way to build confidence in a model because it is a criterion
people readily understand, even if they are not modellers (Morecroft 2007, p. 410).
Figure 12 Tests that build confidence in SD models (adapted from Morecroft 2007, p. 411)
Conceptual structure tests. Boundary adequacy refers to the endogeneity of closed-loop feedback
structures that cause dynamics (Meadows 1980). Assuredly the model passes this test with flying colors. Its
subsystem diagram (Fig. 2) shows seven sectors dynamically interconnected through bundled connectors and
flows, which reveal the multiple closed feedback-loop structures that generate EUTV Net’s ad traffic system
dynamics. Moreover, the model is not only dimensionally correct, but also verifiably consistent with descriptive
knowledge about EUTV Net’s ad traffic system during and around the Beijing 2008 Olympics (Fig. 1).
Learning tests. The use of model sectors (Fig. 2) enables partial model tests to avoid misconceptions.
Custom-built, the SD model shows the peculiarities of EUTV Net’s ad traffic system. Parts of it are generic,
however, with assumptions common to seemingly diverse processes in economics, epidemiology, marketing,
sociology and statistics. Such as, for example, the S-shaped logistic or Verhulst growth model (Fig. 3). Widely
used for modeling population growth, innovation diffusion, sales and other social phenomena, EUTV Net’s ad
sales model sector also conforms to the ecological concept of carrying capacity (Sterman 1990, pp. 296-7).
Regarding policy implications, first, the model instigates IS integration with its on–oƒƒ switch (Fig. 2, 4
and 5), which drastically affects system structure and, thereby, behavior (Fig. 11). Most importantly perhaps,
flipping the switch from one to zero reduces EUTV Net’s dynamic complexity, i.e., interdependencies among
variables connected through multiple feedback loops. Second, the extreme range of increasing error severity and
frequency values (Table 8) might help account for unforeseen policy outcomes at EUTV Net.
In addition to providing a perfect visual fit with EUTV Net’s regular playout and Olympics rehearsals,
the Ads Played dynamics (Fig. 9 and Fig. 10) allowed comparing computed scenarios with expectations and
reconciling opinions about anticipated ad traffic behaviors at EUTV Net. Last but not least, it is indeed daunting
to see how one commercial spot and its playout involve so many interacting parts to properly show the ad and to
collect revenue. Even the mental models of our modeling team’s members have been surprised by how many
interdependent feedback loops our formal SD model helped unearth.
Complexity theory and the exponential increase in computational power make simulation a critical fifth
tool in addition to the four tools used in science for theory building: observation, logical/mathematical analysis,
hypothesis testing and experiment (Davis, Eisenhardt and Bingham 2007, Turner 1997). Simulation modeling
with system dynamics permits business researchers and practitioners to examine the aggregate, dynamic and
emergent implications of the multiple, nonlinear, generative mechanisms embedded in the processes capabilities
and resources of every modern organization (Oliva and Sterman 2001, Repenning and Sterman 2002).
Following on the heels of Heracletus (500 BC) and Forrester (1958), one might anticipate that in the
year 4416, a third person will make a new contribution to what we know about systems. We cannot say who the
contributor will be. Neither can we predict what s/he will say. But we must work hard until then to refine our
knowledge about human systems, utilizing our precious gifts from Heracletus and Forrester.
17References
Anderson JC, Rungtusanatham M and Schroeder RG. 1994. A theory of quality management underlying the
Deming management method. Academy of Management Review 19(3, Total Quality Special Issue): 472-509.
Bell JA and Senge PM. 1980. Methods for enhancing refutability in system dynamics modeling. In A Legasto
Jr, JW Forrester and JM Lyneis (Eds.), TIMS Studies in the Management Sciences: System Dynamics 14 (pp.
61-73). Elsevier Science (North Holland): New York, NY.
Davis JP, Eisenhardt KM and Bingham C. 2007. Developing theory through simulation methods. Academy of
Management Review 32(2): 480-499.
Forrester JW. 1958. Industrial dynamics: A major breakthrough for decision makers. Harvard Business Review
36(4): 37-66.
Forrester JW. 1961. Industrial Dynamics. MIT Press: Cambridge, MA (currently available from Pegasus
Communications: Waltham, MA).
Forrester JW and Senge PM. 1980. Tests for building confidence in system dynamics models. In A Legasto Jr,
JW Forrester and JM Lyneis (Eds.), TIMS Studies in the Management Sciences: System Dynamics 14 (pp.
209-228). Elsevier Science (North Holland): New York, NY.
Franco D. 2007. Fifty years of table functions. In Proceedings of the 25th International Conference of the
System Dynamics Society and 50th Anniversary Celebration, Jul. 29 – Aug. 2, Boston, MA.
Garcia JM. 2006. Theory and Practical Exercises of System Dynamics. Juan Martin Garcia: Barcelona, Spain.
Georgantzas NC and Ritchie-Dunham JL. 2003. Designing high-leverage strategies and tactics. Human Systems
Management 22(1): 217-227.
Kirk GS, Raven JE and Schofield M. 1995. The Pre-Socratic Philosophers: A Critical History with a Selection
of Texts (2e). Cambridge University Press: Cambridge, UK.
Laudon J and Laudon K. 2006. Management Information Systems: Managing the Digital Firm (10e). Prentice-
Hall: Upper Saddle River, NJ.
Lissack MR and Roos J. 1999. The Next Common Sense: The e-Manager’s Guide to Mastering Complexity.
Nicholas Brealey Publishing: London, UK.
Little JD. 1961. A proof of the theorem l = xw. Operations Research 9: 383-387.
Meadows DH. 1980. The unavoidable a priori. In Randers, J. (Ed.), Elements of the System Dynamics Method.
Pegasus Communications: Waltham, MA.
Morecroft JDW. 1985. Rationality in the analysis of behavioral simulation models, Management Science 31:
900-916.
Morecroft JDW. 2007. Strategic Modelling and Business Dynamics: A Feedback Systems Approach. West
Sussex, UK: John Wiley & Sons, Ltd.
Oliva R and Sterman JD. 2001. Cutting corners and working overtime: quality erosion in the service industry.
Management Science 47(7): 894-914.
Paich M and Sterman JD. 1993. Boom, bust and failures to learn in experimental markets. Management Science
39(12): 1439-1458.
Pursell C. 2008. Olympic gold for NBCU: record €1.1 Billion in ad sales expected. TV Week (Jan. 20).
Repenning NP. 2002. A simulation-based approach to understanding the dynamics of innovation
implementation. Organization Science 13(2): 109-127.
Repenning NP and Sterman JD. 2002. Capability traps and self-confirming attribution errors in the dynamics of
process improvement. Administrative Science Quarterly 47: 265-295.
Richardson GP. 1991. Feedback Thought in Social Science and Systems Theory. University of Pennsylvania
Press: Philadelphia, PA.
Richardson GP. 1995. Loop polarity, loop dominance and the concept of dominant polarity. System Dynamics
Review 11(1): 67-88.
Richmond B, et al. 2007. iThink® Software V 9.0.2. iSee Systems™: Lebanon NH.
Ross JW. 2003. Creating a strategic IT architecture competency: learning in stages. Management Information
Systems Quarterly Executive 2(1): 31-43.
Ross, JW, Weil P et al. 2006. Enterprise Architecture as Strategy: Creating a Foundation for Business
Execution. Harvard Business School Press: Cambridge, MA.
Sastry MA. 1997. Problems and paradoxes in a model of punctuated organizational change. Administrative
Science Quarterly 42(2): 237-275.
18You can also read