The molecular conformation of silk fibroin regulates osteogenic cell behavior by modulating the stability of the adsorbed protein-material ...
←
→
Page content transcription
If your browser does not render page correctly, please read the page content below
Bone Research                                                                                                                               www.nature.com/boneres

                  ARTICLE                 OPEN

                  The molecular conformation of silk fibroin regulates
                  osteogenic cell behavior by modulating the stability of the
                  adsorbed protein-material interface
                  Yanlin Long1,2, Xian Cheng3, John A. Jansen3, Sander G. C. Leeuwenburgh                           3
                                                                                                                        , Jing Mao4, Fang Yang        3
                                                                                                                                                          and Lili Chen1,2

                     Silk fibroin (SF) can be used to construct various stiff material interfaces to support bone formation. An essential preparatory step is
                     to partially transform SF molecules from random coils to β-sheets to render the material water insoluble. However, the influence of
                     the SF conformation on osteogenic cell behavior at the material interface remains unknown. Herein, three stiff SF substrates were
                     prepared by varying the β-sheet content (high, medium, and low). The substrates had a comparable chemical composition, surface
                     topography, and wettability. When adsorbed fibronectin was used as a model cellular adhesive protein, the stability of the
                     adsorbed protein-material interface, in terms of the surface stability of the SF substrates and the accompanying fibronectin
                     detachment resistance, increased with the increasing β-sheet content of the SF substrates. Furthermore, (i) larger areas of
                     cytoskeleton-associated focal adhesions, (ii) higher orders of cytoskeletal organization and (iii) more elongated cell spreading were
                     observed for bone marrow-derived mesenchymal stromal cells (BMSCs) cultured on SF substrates with high vs. low β-sheet
1234567890();,:

                     contents, along with enhanced nuclear translocation and activation of YAP/TAZ and RUNX2. Consequently, osteogenic
                     differentiation of BMSCs was stimulated on high β-sheet substrates. These results indicated that the β-sheet content influences
                     osteogenic differentiation of BMSCs on SF materials in vitro by modulating the stability of the adsorbed protein-material interface,
                     which proceeds via protein-focal adhesion-cytoskeleton links and subsequent intracellular mechanotransduction. Our findings
                     emphasize the role of the stability of the adsorbed protein-material interface in cellular mechanotransduction and the perception of
                     stiff SF substrates with different β-sheet contents, which should not be overlooked when engineering stiff biomaterials.

                     Bone Research (2021)9:13                              ; https://doi.org/10.1038/s41413-020-00130-0

                  INTRODUCTION                                                                           applied processing methods and has been reported to be
                  Silk fibroin (SF), a natural protein derived from Bombyx mori silk                      ~15%–60%.10–12 In previous studies, various groups observed
                  cocoons, is a millennium-old material that has been recently                           variation with respect to the in vitro osteogenic performance of
                  widely adopted in biomedical engineering.1 SF exhibits attractive                      stiff SF materials with different β-sheet contents.13–16 Although
                  features for the production of bone-related biomaterials, such as                      these studies indicated that this variation might be partially due to
                  robust mechanical properties,2 hypoallergenic features,3 vascular-                     a difference in SF conformation, they failed to exclude the role of
                  ization,4 tunable biodegradation,5 the ability to accelerate                           other influential factors on cells, such as chemical composition or
                  biomineralization of collagen,6 and the ability to act as template                     surface topography (e.g., deformation during the preparatory
                  for the growth of hydroxyapatite.7 Over the past decades, SF has                       process). The influence of SF conformation on in vitro osteogenic
                  been shown to be a promising polymer to construct various stiff                        cell behavior at the material surface is still unclear.
                  materials to support bone formation. The application of stiff SF                          The β-sheet content determines the density of the water-
                  materials ranges from scaffolds1 to implants,2 membranes,7,8 and                       insoluble molecular network of the β-sheets in stiff SF materials.
                  coatings.3,9                                                                           The different β-sheet contents can induce a clear difference in
                     Regardless of the forms, stiff SF materials are prepared from SF                    dissolution (degradation) profiles,17,18 which might have a strong
                  aqueous solutions extracted and regenerated from silk cocoons,                         influence on the surface stability of SF materials. However, SF
                  which consist of SF molecules in a soluble random coil                                 molecules themselves do not contain recognition motifs, such as
                  conformation.3 An essential step during the preparation is to                          integrin-binding arginyl-glycyl-aspartic acid motifs, to facilitate cell
                  partially transform the SF molecules from a random coil to stable                      adhesion and spreading.13 Instead, the adsorbed cellular adhesive
                  β-sheet conformation to render the materials water-insoluble.10                        protein layer, such as fibronectin (FN), at the SF material surface
                  The efficiency of β-sheet transformation highly depends on the                          acts as a bridge between cells and material, where the interfacial

                  1
                   Department of Stomatology, Union Hospital, Tongji Medical College, Huazhong University of Science and Technology, Wuhan 430022, China; 2Hubei Province Key Laboratory of
                  Oral and Maxillofacial Development and Regeneration, Wuhan 430022, China; 3Department of Dentistry–Biomaterials, Radboud University Medical Center, Philips van Leydenlaan
                  25, 6525 EX Nijmegen, The Netherlands and 4Center of Stomatology, Tongji Hospital, Tongji Medical College, Huazhong University of Science and Technology, Wuhan 430030,
                  China
                  Correspondence: Fang Yang (Fang.Yang@radboudumc.nl) or Lili Chen (chenlili1030@hust.edu.cn)
                  These authors contributed equally: Yanlin Long, Xian Cheng

                  Received: 12 July 2020 Revised: 27 September 2020 Accepted: 29 October 2020

                  © The Author(s) 2021
Silk fibroin and osteogenic cell behavior
                                                              Y Long et al.
2
    stability (e.g., conformation change, reorganization, and detach-         measured by AFM (Fig. 1d) did not show any significant difference
    ment) of protein plays an important role in regulating cell               among the groups (P > 0.05).
    behavior.19 Focal adhesion (FA) is cell-substrate contact, which            The average water contact angle slightly increased with
    forms a link with the adsorbed proteins and the cytoskeleton of           increasing β-sheet content (Fig. 1e, f). Moreover, this factor was
    spreading cells at the cell-material interface.20 Once adhered, cells     not significantly influenced by ultraviolet sterilization (Supple-
    will generate tensions via the cytoskeleton, and the generated            mentary Fig. 2). With increasing β-sheet content, the stiffness of
    contractility will be sequentially transmitted to the protein layer       the SF substrates increased from 14.8 ± 4.1 MPa to 120.3 ±
    via FAs to partially unfold, reorganize, or even detach proteins          17.4 MPa (Supplementary Table 1).
    from the underlying material substrate.21 In turn, the interfacial
    instability, especially the detachment of the adsorbed proteinac-         Stability of material-protein interfaces with different β-sheet
    eous layer induced by cells, has been found to largely disturb            contents
    intracellular tension via the cytoskeleton.22 Consequently, the           After being immersed in phosphate-buffered saline (PBS) for 24 h,
    adsorbed protein-FA-cytoskeleton link plays an important role in          the samples were removed and gently rinsed with Milli-Q water.
    the transmission of extracellular cues from the material to the cell      The topography of the different material surfaces was comparable
    and evokes intracellular changes in cytoskeletal organization,            among the three groups (Fig. 2a). However, when a mild ultrasonic
    which affects subsequent cell funcations.23                               treatment was applied, the surface topography of the SFL
       Yes-associated protein/transcriptional coactivator with PDZ-           substrate became much more uneven and rougher than that of
    binding motif (YAP/TAZ) was recently identified as a master                the SFM and SFH substrates.
    regulator in cellular sensing and transduction of mechanical                 Quantitative measurements were performed in terms of the
    signals, with enhanced nuclear translocation in response to               remaining mass of the substrates with the same ultrasonic
    increased intracellular tension.24–26 YAP/TAZ has been demon-             treatment (Fig. 2b). The results showed a 24.5% weight loss on
    strated to modulate a wide variety of material-mediated mechan-           the SFL surfaces after the first removal of loosened components at
    otransduction parameters, such as topography,27 degradation,28            24 h. The SFM samples lost ~9.5% mass upon the first removal,
    stress relaxation,29 fiber density,30 and multicyclic attachment/          while no appreciable silk weight loss occurred for the SFH group.
    detachment of cells.31 YAP and TAZ are found both in the                  After the first removal of loosened components at 24 h, all three
    cytoplasm and nucleus, and they can interact with and activate a          groups showed no visible mass loss within 14 days.
    number of their DNA binding partners (e.g., Runt-related                     After the first removal, the β-sheet content of SFL showed an
    transcription factor 2 (RUNX2)30–32) in the nucleus to modulate           increase from 15.8% to 21.2%, whereas the β-sheet content of
    the osteogenic differentiation of stem cells. Therefore, the              SFM increased from 40.4% to 45.6% (Figs. 1b and 2c). At the end
    subcellular localizations of YAP/TAZ and RUNX2 have been                  of immersion for 14 days, the β-sheet contents of SFL and SFM
    considered rapid and reliable proxies applied to evaluate                 finally reached 22.8% and 47.6%, respectively (Fig. 2c). In contrast,
    material-mediated mechanotransduction by cytoskeletal cues.25,32          the β-sheet content of SFH did not change evidently. The β-sheet
       Therefore, this study aimed to investigate the impact of the           contents of the three substrates remained significantly different
    β-sheet content of stiff SF materials on osteogenic cell behavior         between the groups during the whole immersion time.
    while focusing on the stability of adsorbed protein-material                 The interfacial stability of FN was first measured by immersing
    interfaces, adsorbed protein-FA-cytoskeleton link and YAP/TAZ             the SF substrates in FN solution for 24 h followed by no treatment
    regulation. To shed light on this regulation, we established a            or the same ultrasonic treatment described above. Without the
    material interface model by constructing three stiff SF material          application of any artificial external forces, the FN was evenly
    substrates with high (SFH group), medium (SFM group), and low             distributed (Fig. 2d), and the fluorescence intensity of FN was
    (SFL group) contents of β-sheets while maintaining comparable             comparable among all substrates (Fig. 2e). In contrast, when
    chemical composition, surface topography, and wettability. The            additional external forces were applied, an increase in dark areas
    surface stability of the SF substrates was assessed using an              (Fig. 2d), a lower fluorescence intensity of FN (Fig. 2e), and more
    artificial external force. FN, a ubiquitous cellular adhesive protein,     detached FN (Supplementary Fig. 3a) were found on the SF
    has been applied as a model protein in many studies to evaluate           substrates with a decreased β-sheet content. In addition, other
    cellular adhesive protein adsorption and stability on materi-             alternative artificial external stimuli (e.g., Tris-EDTA buffer immer-
    als.19,33,34 We also used FN as a model protein to investigate            sion) showed a similar trend in the detachment ratio of FN with
    adsorbed protein detachment resistance with the same artificial            the variation in β-sheet content (Supplementary Fig. 3b).
    external force or in a cell culture environment. Subsequently, the           To evaluate the interfacial stability of FN in a cell culture
    number of cytoskeleton-associated FAs, cytoskeletal organization          environment, we photographed the adsorbed FN and the
    and spreading shape of bone marrow-derived mesenchymal                    morphology of BMSCs after 24 h of cell culture. The immunostain-
    stromal cell (BMSC) response to the different SF substrates were          ing images of FN and F-actin (Fig. 3a) and the subsequent analysis
    assessed. Finally, the intracellular mechanotransduction of YAP/          (Fig. 3b–c) showed an obvious FN dark area surrounding the cell
    TAZ and RUNX2 and the consequent osteogenic differentiation of            outline on the SFL and SFM substrates, while the FN dark area was
    BMSCs on different SF substrates were evaluated.                          more evident on SFL than SFM. On the SFH substrates, the FN dark
                                                                              area was less apparent. The immunofluorescence staining images
                                                                              of FN on the substrates without BMSCs showed a relatively even
    RESULTS                                                                   distribution and no evident large dark area (Fig. 3a).
    Material characterization of SF substrates with different β-sheet
    contents                                                                  Spreading behavior of BMSCs on different SF substrates
    Three SF substrates were constructed with either low, medium, or          BMSCs were isolated, identified (Supplementary Fig. 4), and
    high β-sheet contents of 15.8% (SFL group), 40.4% (SFM group),            cultured on different SF substrates. The cell adhesion process
    and 58.2% (SFH group), respectively (Fig. 1a, b). Ultraviolet             within 4 h could be divided into four stages, and stage IV implied
    sterilization did not significantly influence the SF conformation           that cells adhered to the surface and appeared fully flattened and
    (Supplementary Fig. 1).                                                   spread (Supplementary Fig. 5c).19,35 In this study, more cells were
       Scanning electron microscopy (SEM) and atomic force micro-             observed to enter stage IV on the SFH surfaces than on the SFM
    scopy (AFM) images (Fig. 1c) showed that the surface topography           and SFL surfaces at 2 h and 4 h (Supplementary Fig. 5a, b),
    of the SF substrates was equally even and smooth regardless of            indicating a fast adhesion of BMSCs on surfaces with a high
    the β-sheet content. The average values of roughness (Ra)                 β-sheet content. However, the number of cells that successfully

                                                                                                           Bone Research (2021)9:13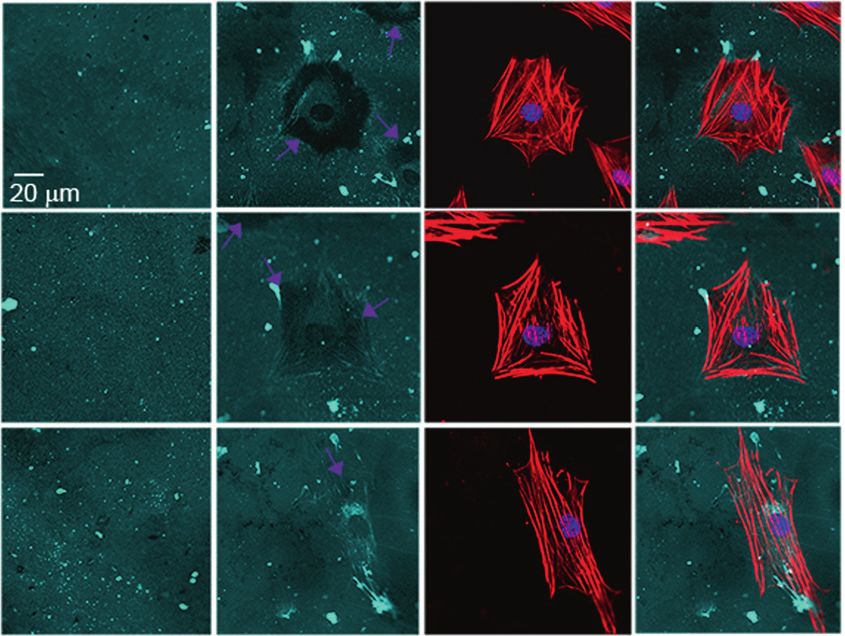
Silk fibroin and osteogenic cell behavior
Y Long et al.
3
a b
100
β sheet (crystalline)
Absorbance (a.u.)
80 ** **
content/%
SFH 60
SFM 40
SFL 20
SF Random coil β sheet 0
SFL SFM SFH
1 700 1 680 1 660 1 640 1 620 1 600
c
8.17 nm
SFL
0
500 nm 500 nm
0
9.27 nm
SFM
0
500 nm 500 nm
0
10.29 nm
SFH
0
500 nm 500 nm
0
d e f
5 120
Surface roughness
ns ns
Water contact
angle/degree
4 90 SFL
Ra/nm
3
60
2 SFM
1 30
SFH
0 0
SFL SFM SFH SFL SFM SFH
Fig. 1 Material characterization of SF substrates with different β-sheet contents. a, b FTIR absorbance spectra (a) of the amide I region (between 1
695 and 1 595 cm−1) obtained from different SF substrates and (b) the β-sheet contents calculated by Fourier self-deconvolution from these spectra.
c Surface topography observed by SEM and AFM. d Surface roughness values analyzed by AFM. e, f Surface wettability (e) determined by water
contact angle measurement and (f) representative images of water droplets. Error bars represent one standard deviation. (*P < 0.05 and **P < 0.01)
adhered to the surfaces was not significantly different among the Although such a large-scale order in cytoskeletal organization over
groups (Supplementary Fig. 5d). the entire cell area was not observed at the SFL surfaces, some locally
After 24 h, BMSCs completed the process of adhesion and ordered actin filament microdomains were still observed. The
spreading onto the material surface.19 The immunostaining quantitative analysis (Fig. 4e) of this F-actin fiber staining showed
images of vinculin (Fig. 4a) and subsequent analysis (Fig. 4b) that the fiber anisotropy was significantly lower on the SFL surfaces
showed that the area of total vinculin-containing FAs per cell was than on the SFM (P < 0.05) and SFH (P < 0.01) surfaces.
comparable on all three SF-based interfaces without cytoskeletal Then, single-cell scatter plots showed F-actin fiber anisotropy as a
buffer (CKB) treatment. However, after CKB treatment to remove function of cytoskeleton-associated FA area per cell or cell shape
proteins that are loosely attached to the cytoskeleton,36 the area metrics (spread area and CSI). A clear trend was observed where a
of cytoskeleton-associated vinculin-containing FAs per cell was larger number of cytoskeleton-associated FAs was correlated with a
significantly larger on the SFH surfaces than on the SFM (P < 0.05) higher-order of cytoskeletal organization, with distinct populations
and SFL (P < 0.01) surfaces. evident for the low, medium, and high β-sheet surfaces (Fig. 4g). In
The immunostaining of F-actin (Fig. 4a) and the corresponding comparison, the scatter plots indicated a stronger correlation
analysis (Fig. 4c, d) showed that the area of BMSC spreading was between F-actin fiber anisotropy and the CSI (Fig. 4h) than between
larger on the SFH surfaces than on the SFL surfaces. Cells exhibited F-actin fiber anisotropy and the cell area (Fig. 4f).
significantly more elongated shapes (i.e., lower cell shape index In addition, the SEM image depicted in Fig. 4i shows
(CSI)) on the SFH surfaces than on the SFM (P < 0.05) and SFL (P < representative cell spreading morphology on different substrates.
0.01) surfaces. BMSCs were fully spread on all three surfaces, but cells revealed a
Furthermore, the corresponding orientation plots of F-actin more elongated shape on the SFH substrates than the SFL
showed that more actin stress fibers appeared to cluster into larger substrates. Vinculin expression in BMSCs showed no apparent
locally ordered microdomains aligned parallel to the long cell axis differences among various SF surfaces (Fig. 4j), while Vinexin α,
with the increase in the β-sheet content of the SF materials (Fig. 4a). Cap, and Rhoa were upregulated on the SFH surface (Fig. 4k–m).
Bone Research (2021)9:13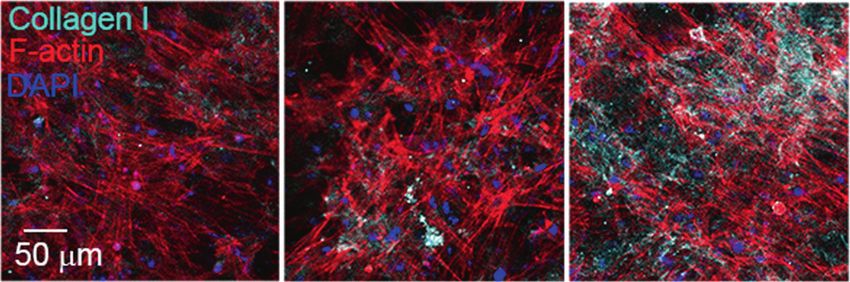
Silk fibroin and osteogenic cell behavior
Y Long et al.
4
a SFL SFM SFH b
SFL SFM SFH
Remaining mass/%
100
80 * ** *** *** **
60
UT(-)
40
20
0
0 2 4 6 8 10 12 14/d
c
SFL SFM SFH
80
β sheet (crystalline)
** ** ** **
60
content/%
UT(+)
40
20
0
1d 14 d
d e
Relative fluorescent intensity
SFL SFM SFH
1.5
UT(-)
ns ***
1.0
0.5
UT(+)
0.0
UT (-) UT (+)
Fig. 2 Interfacial stability between different SF substrates and adsorbed FN. a SEM images of different SF substrates after being immersed in PBS for
24 h, with and without ultrasonic treatment (UT). b, c Remaining mass (b) and β-sheet contents (c) of different SF substrates immersed in PBS with
UT treatment at specific time points. d, e Immunofluorescence images (d) and the quantitative analysis (e) of adsorbed FN on different SF substrates
after being immersed in FN solution for 24 h, with and without UT treatment. Error bars represent one standard deviation. (*P < 0.05 and **P < 0.01)
a Without cells With cells b
FN FN F-actin Merge
Nucleus
Dark area/cell area
1.2
1.0 ** **
SFL
0.8
0.6
0.4
0.2
0.0
SFL SFM SFH
SFM
1.2
** **
Intensity ratio
1.0
0.8
0.6
0.4
SFH
0.2
0.0
SFL SFM SFH
Fig. 3 Interfacial stability of adsorbed FN on different substrates in a cell culture environment. a Immunofluorescence staining of adsorbed FN
(cyan) on different SF substrates with and without BMSCs cultured for 24 h, together with F-actin (red) and nuclei (blue). The purple arrows
indicate the detached FN underlying the cells. b Ratio of the FN dark area underlying the cell outline to the cell area. c Ratio of FN intensity
underlying the cell outline to that of the background. Error bars represent one standard deviation. (*P < 0.05 and **P < 0.01)
Intracellular mechanotransduction of YAP/TAZ and RUNX2 on analysis (Fig. 5b) revealed that the nuclear-cytoplasmic ratio of
different SF substrates YAP/TAZ in BMSCs was lower on the SFL surfaces than on the
The immunostaining of YAP/TAZ in Fig. 5a shows that YAP/TAZ SFH surfaces at day 1 and on the SFM (P < 0.05) and SFH
was translocated to the nucleus for all three groups, and YAP/ (P < 0.01) surfaces at day 3.
TAZ was more abundant in the nuclei of BMSCs on the SFH Similarly, immunostaining of RUNX2 in BMSCs (Fig. 5a)
surfaces than on the SFL surfaces at days 1 and 3. Quantitative indicated that RUNX2 nuclear translocation was not evident at
Bone Research (2021)9:13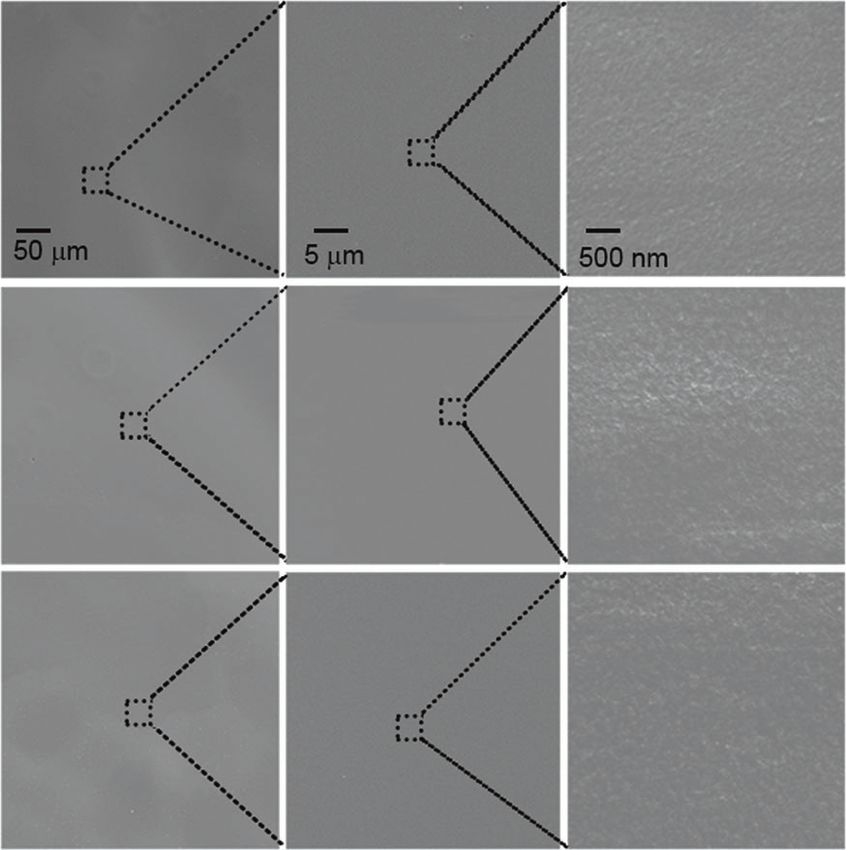
Silk fibroin and osteogenic cell behavior
Y Long et al.
5
a CKB (-) CKB (+) b f
Vinculin Vinculin F-actin Merge Orientation
Nuclues Nuclues plots 10 000
SFL SFM SFH
600
FA area per cell/μm2
ns
Cell area/μm2
500 ** 8 000
400
*
6 000
300
SFL
200 4 000
SFL
100
2 000 SFM
0
CKB(-) CKB(+) SFH
0
0.0 0.2 0.4 0.6 0.8 1.0
c F-actin firber anisotrophy
1.0
** g
Cell shape index
0.8 *
0.6
FA area per cell with CKB/μm2
400
SFM
0.4
0.2 300
0.0
SFL SFM SFH 200
SFL
100
d SFM
12 000 SFH
0
* 0.0 0.2 0.4 0.6 0.8 1.0
Cell area/μm2
9 000
F-actin firber anisotrophy
6 000
SFH
3 000
0
SFL SFM SFH h
1.0
e SFL
F-actin firber anisotrophy
0.8 SFM
Cell shape index
0° 180°
1.0 SFH
i ** 0.6
SFL SFM SFH 0.8 *
0.6 0.4
0.4 0.2
0.2
0.0
0.0 0.0 0.2 0.4 0.6 0.8 1.0
SFL SFM SFH F-actin firber anisotrophy
j k l m
Vinexin
Relative mRNA expression
Cap
Relative mRNA expression
Relative mRNA expression
Relative mRNA expression
Vinculin Rhoa
2.5 5 5 3.0
ns
4 * 4 ** 2.5 **
2.0
1.5 3 3 * 2.0
1.5
1.0 2 2
1.0
0.5 1 1 0.5
0.0 0 0 0.0
SFL SFM SFH SFL SFM SFH SFL SFM SFH SFL SFM SFH
Fig. 4 Spreading behavior of BMSCs on different SF substrates. a Representative mosaic immunofluorescence images of vinculin (purple),
F-actin (white), and nuclei (blue) in BMSCs without and with CKB treatment and the corresponding orientation plots for F-actin staining, where
the different colors indicate different orientations of actin filaments as per the given color map. b–e Quantitative analysis of (b) FA area per
cell, (c) cell shape index, (d) cell area, and (e) F-actin anisotropy in BMSCs. f–h Single-cell scatter plots of F-actin anisotropy as a function of (f)
cell area, (g) FA area per cell, and (h) cell shape index. i SEM images of BMSCs’ spreading morphology. j–m The mRNA expression levels of (j)
Vinculin, (k) Vinexin α, (l) Cap, and (m) Rhoa in BMSCs. For each box plot, the box boundaries represent the 25th–75th percentiles, and the
whiskers represent the min and max values. The central line and cross represent the median value and mean, respectively. Error bars represent
one standard deviation. (*P < 0.05 and **P < 0.01)
day 1. In contrast, RUNX2 showed obvious nuclear translocation The single-cell scatter plots (Fig. 5e) revealed a trend positively
for all three substrates at day 3, and more RUNX2 was translocated correlating the high nuclear ratio of YAP/TAZ with that of RUNX2,
from the cytoplasm to nucleus on SF substrates with an increase in which indicates that RUNX2 might be nuclear translocated along
β-sheets. The quantitative analysis (Fig. 5c) demonstrated that the with YAP/TAZ.
nuclear-cytoplasmic ratio of RUNX2 in BMSCs was significantly The expression of Yap in BMSCs was comparable for all different
higher on SFH vs. SFM (P < 0.05) and SFL surfaces (P < 0.01) at day 3, material surfaces at 24 h and day 3 (Fig. 5f, g). While the
while it was comparable among all three SF surfaces at day 1. expression of Ankrd1 and Ctgf was upregulated in the SFH samples
Moreover, quantitative measurement of the fluorescence intensity compared to the SFL samples at 24 h and day 3 (Fig. 5h–k), Runx2
of RUNX2 per cell (Fig. 5d) indicated that RUNX2 expression in expression was only upregulated with increased β-sheet content
BMSCs was also higher on SFH than SFM at day 3. of the materials at day 3 (Fig. 5l, m).
Bone Research (2021)9:13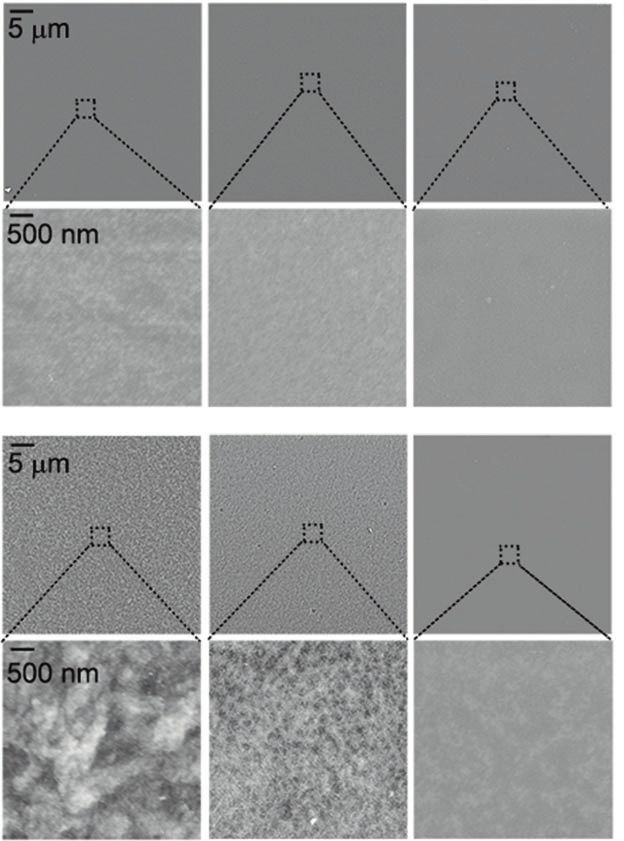
Silk fibroin and osteogenic cell behavior
Y Long et al.
6
a b
24 h Day 3 SFL SFM SFH
4
YAP nuc/cyto ratio
YAP/TAZ RUNX2 Nucleus Merge YAP/TAZ RUNX2 Nucleus Merge * * **
3
2
1
0
SFL
24 h 3d
c
SFL SFM SFH
RUNX2 nuc/cyto ratio
8
** *
6
4
ns
2
0
24 h 3d
d
Relative total fluorescent
RUNX2 (Day 3)
SFM
2.5
intensity per cell
2.0 *
1.5
1.0
0.5
0.0
SFL SFM SFH
e
8
RUNX2 nuc/cyto ratio
6
SFH
4
SFL
2
SFM
SFH
0
0 1 2 3
YAP nuc/cyto ratio
f h j l
Relative mRNA expression
Relative mRNA expression
Relative mRNA expression
Relative mRNA expression
Yap (24 h) Ankrd1 (24 h) Ctgf (24 h) Runx2 (24 h)
1.5 3.0 2.5 1.5
ns * ns
2.5 * 2.0
1.0 2.0 1.0
1.5
1.5
1.0
0.5 1.0 0.5
0.5 0.5
0.0 0.0 0.0 0.0
SFL SFM SFH SFL SFM SFH SFL SFM SFH SFL SFM SFH
g i k m
Relative mRNA expression
Relative mRNA expression
Relative mRNA expression
Relative mRNA expression
Yap (Day 3) Ankrd1 (Day 3) Ctgf (Day 3) Runx2 (Day 3)
1.5 2.5 4.0 3.0
ns ** ** * * **
2.0 3.0
1.0 2.0
1.5
2.0
1.0 1.0
0.5
0.5 1.0
0.0 0.0 0.0 0.0
SFL SFM SFH SFL SFM SFH SFL SFM SFH SFL SFM SFH
Fig. 5 YAP/TAZ and RUNX2 nuclear translocation in BMSCs on different SF substrates. a Representative mosaic immunofluorescence images
of YAP/TAZ (red), RUNX2 (yellow), and nuclei (blue) in BMSCs at 24 h and day 3. b, c The nuclear-cytoplasmic ratios of (b) YAP/TAZ and (c)
RUNX2 in BMSCs analyzed from the immunofluorescence images. d Relative fluorescence intensity per cell of RUNX2 at day 3. e Single-cell
scatter plots of the YAP/TAZ nuclei/cytoplasm ratio as a function of the RUNX2 nuclei/cytoplasm ratio at day 3. f–m The mRNA expression
levels of (f–g) Yap, (h–i) Ankrd1, (j–k) Ctgf, and (l–m) Runx2 in BMSCs at 24 h and day 3. For each box plot, the box boundaries represent the
25th–75th percentiles, and the whiskers represent the min and max values. The central line and cross represent the median value and mean,
respectively. Error bars represent one standard deviation. (*P < 0.05 and **P < 0.01)
Bone Research (2021)9:13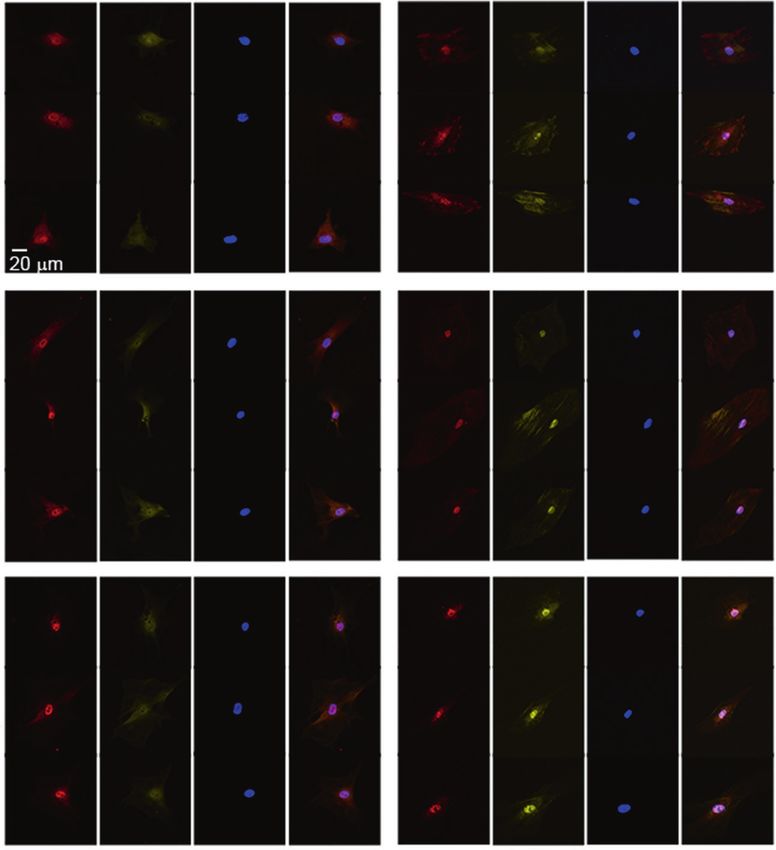
Silk fibroin and osteogenic cell behavior
Y Long et al.
7
a SFL SFM SFH b
(nmol 4NP/h/ng DNA)
5
*
4
ALP activity
3
2
1
0
SFL SFM SFH
c d
Calcium concentration/
90
**
(µg·cm-2)
60
30
0
SFL SFM SFH
e f
Relative fluorescent intensity
3
**
2
1
0
SFL SFM SFH
g i k
Relative mRNA expression
Relative mRNA expression
Relative mRNA expression
Alp (Day 7) Osterix (Day 7) Collagen I (Day 7)
16 8 3
** ** **
12 6
2
8 4
1
4 2
0 0 0
SFL SFM SFH SFL SFM SFH SFL SFM SFH
h j l
Relative mRNA expression
Relative mRNA expression
Relative mRNA expression
Alp (Day 14) Osterix (Day 14) Collagen I (Day 14)
9 5 4
* ** *
4 3
6 *
3
2
2
3
1 1
0 0 0
SFL SFM SFH SFL SFM SFH SFL SFM SFH
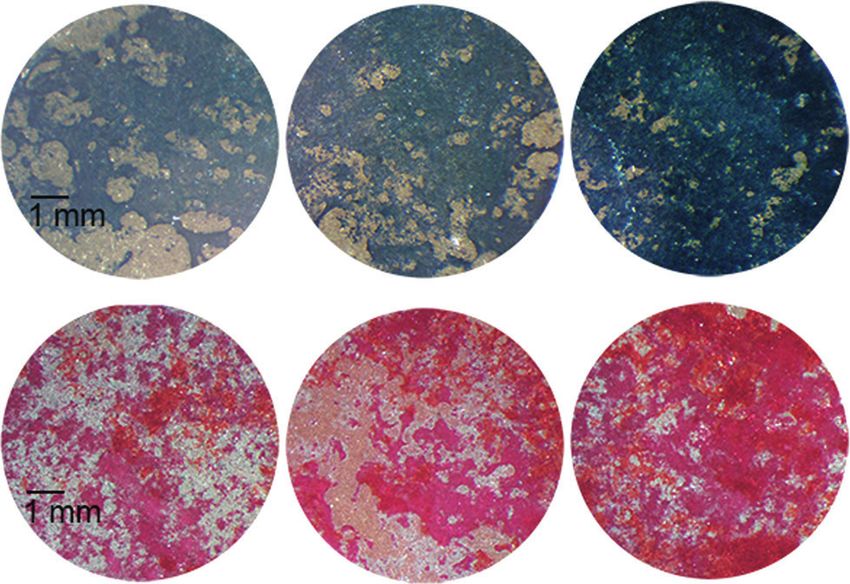
Fig. 6 Osteogenic differentiation of BMSCs on different SF substrates. a, b Images of ALP staining (a) and quantitative detection of ALP
activity (b) in BMSCs at day 7. c, d Images of ARS staining (c) and quantitative analysis of calcium concentration (d) in BMSCs at day 14.
e, f Immunofluorescence images of collagen Ι (e) in BMSCs and quantitative analysis of fluorescence intensity of collagen Ι (f) at day 14.
g–l mRNA expression levels of representative (g–h) Alp, (i–j) Osterix, and (k–l) collagen Ι in BMSCs at days 7 and 14. Error bars represent one
standard deviation. (*P < 0.05 and **P < 0.01)
When cytoskeletal organization was inhibited with the inhibitor content of the SF materials at day 14 (Fig. 6c). More mineralization
Y27632, the difference in Ankrd1 and Runx2 gene expression in occurred on the SFH surfaces. Similarly, the quantitative detection
BMSCs on various SF surfaces was diminished at 24 h and day 3 kit showed that on the SFH surfaces, the concentration of calcium
(Supplementary Fig. 6), further confirming the relationship between secreted by BMSCs was higher than that on the SFL surfaces
cytoskeletal organization and intracellular mechanotransduction. (Fig. 6d). In addition, the immunostaining images (Fig. 6e) and
their quantitative analysis (Fig. 6f) revealed that collagen Ι
Osteogenic differentiation of BMSCs on different SF substrates expression in BMSCs was upregulated on the SFH surfaces
Alkaline phosphatase (ALP) expression was more abundant in the compared to the SFL and SFM surfaces at day 14.
BMSCs with an increased β-sheet content of the SF materials at The expression of the related osteogenic markers Alp (Fig. 6g,
day 7 (Fig. 6a). Correspondingly, ALP activity was higher on the h), Osterix (Fig. 6i, j), and Collagen Ι (Fig. 6k, l) in BMSCs showed an
SFH vs. SFL surfaces (Fig. 6b). Different batches of BMSCs showed upward trend on the SFH surfaces compared to the SFL surfaces at
similar trends (Supplementary Fig. 7). The Alizarin staining images days 7 and 14. The cell number, as measured by the CCK-8 assay,
indicated that mineralization was also dependent on the β-sheet was comparable on all SF surfaces (Supplementary Fig. 8).
Bone Research (2021)9:13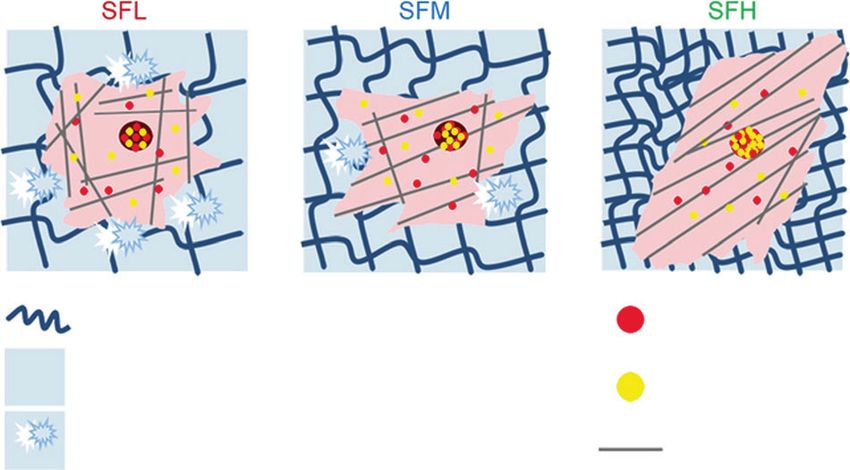
Silk fibroin and osteogenic cell behavior
                                                              Y Long et al.
8
    DISCUSSION                                                                experiment in PBS without external force.12 Accordingly, another
    The aim of the current study was to investigate the effect of the SF      PBS degradation/dissolution study reported a total weight loss
    conformation on the osteogenic behavior of BMSCs. Herein, we              (~17%) of a medium β-sheet content (~30%) film induced by
    prepared stiff SF substrates with different β-sheet contents.             water annealing for 6 h at room temperature,17 which is close to
    Depending on the various conformation conversion methods,                 the observed 14.5% total weight loss of the SFM substrates.
    the β-sheet contents in stiff SF materials range from ~15% to                Another notable finding is that after the first 24 h immersion and
    ~60% in the literature.10–12 Our prepared SF substrates contained         ultrasonic treatment, the SFL and SFM substrates already showed an
    three representative β-sheet contents within this range (Fig. 1b).        initial weight loss of 24.5% and 9.5%, respectively, whereas the
    The chemical composition of all materials was comparable since            substrates exhibited no further visible (>5%) mass loss during
    no additional chemicals except water were introduced during               the 14 days of immersion. This finding indicates that except for the
    material preparation. Moreover, during these preparatory pro-             loosened components, the SF molecule network was stable and
    cesses, the use of rigid titanium support successfully prevented          could maintain the structural integrity of the SF material. Notably,
    obvious changes concerning surface topography and kept                    the effect of the surface instability of stiff SF materials on cells will be
    topography comparable within the microscopic scales (Fig. 1c),            different compared with the influence of extensively investigated
    which may influence osteogenic cell behavior.25 With increasing            hydrogel degradation characteristics on cells. Hydrogels undergo
    β-sheet content, we found a slight (not significant) increase in Ra        sustained surface erosion and bulk degradation due to high water
    values (2.86–3.52 nm) (Fig. 1d). A previous study also observed a         content and diffusivity, which progressively breaks the structural
    slight increase in the Ra values (2.12–3.28 nm) of SF films with an        integrity of materials and can favor BMSC spreading and osteogenic
    increase in β-sheet contents using graded ethanol (50%–100% v/            differentiation by reducing the steric hindrance effect.28,42
    v) treatments,37 but the low variation in nanoroughness did not              The stability of adsorbed proteins on materials was also
    significantly influence BMSC behavior.37                                    assessed by immersion of the SF substrates in FN solution for
       The range of water contact angles (60–70 degrees) of the SF            24 h followed by no treatment or the same artificial external forces
    substrates (Fig. 1e) was consistent with a previous study.3 This          above. Without ultrasonic treatment, the fluorescence intensity of
    increase may result from the fact that the β-sheet formation              FN was comparable among all three substrates (Fig. 2e), which is
    induces tighter packing of hydrophobic repeats of the SF                  not surprising considering the fact that the morphology and
    molecules, changing some amino acids exposed on the surface.3             wettability of the substrates were comparable.31 However, with
    However, these changes were subtle, and no significant difference          ultrasonic treatment, a larger dark area and lower fluorescence
    was found. In addition, the one order of magnitude                        intensity of FN were observed on the SF surfaces with decreased
    (14.8–120.3 MPa) in stiffness as a function of β-sheet content            β-sheet content. This finding suggests that more adsorbed FN was
    (Supplementary Table 1) was in accordance with the literature.38          detached with the removal of the loosened components from the
    Although the variation in stiffness within the Pa to kPa range can        low β-sheet content material surfaces by the application of the
    be sensed by cells and notably determines stem cell fate and              external force.22 These results indicate that a high content of the
    osteogenic differentiation25, the variation in stiffness of 2D stiff      β-sheets stabilized the protein-material interface, and a low
    material substrates for values higher than ~2 MPa does not                content of the β-sheets might compromise the detachment
    significantly influence the osteogenic behavior of stem cells.39,40         resistance of adsorbed FN via the reduced surface stability of the
    Therefore, we do not expect that the stiffness of stiff SF substrates     SF materials. A similar influence of material surface properties on
    significantly determines the osteogenic cell behavior in this study.       the detachment resistance of FN was reported in previous studies,
       Matrix metalloproteinases are the major enzymes secreted by            e.g., the long-chain collapse of a material surface was shown to
    BMSCs to degrade and remodel extracellular matrix and                     induce the detachment of FN.43
    materials.41 However, Kaplan’s group demonstrated that the                   These different phenomena of detachment resistance of
    ability of matrix metalloproteinases to break down a solid SF film         adsorbed FN on various SF substrates were further investigated
    is not apparent, since the formation of SF-matrix metalloprotei-          by culturing cells on top of this protein-coated surface (Fig. 3). The
    nase aggregates blocks degradation.41 Their in vitro study further        immunofluorescence images of FN on substrates without cell
    confirmed that BMSCs do not induce significant endogenous                   culture showed a relatively even distribution without dark areas,
    enzymatic degradation of solid silk films as osteoclasts do.5              indicating that the observed dark area underlying BMSCs was
    Therefore, to simplify the research model, we used a PBS solution         caused by the presence of cells.22 Moreover, our results showed
    instead of enzyme solution to investigate the material-protein            more obvious dark areas on the SFL substrates than on the SFH
    interfacial stability of SF substrates in the aquatic environment.        substrates, which indicates that more FN was detached by the
       Before the formation of β-sheets, SF materials are water soluble       transition of cellular force to the adsorbed FN layer on the SFL
    and mainly consist of SF molecules presenting random coil                 surface. In addition, the degree of FN detachment induced by cells
    conformations.17 The conformation transition results in soluble           showed similar degrees of FN detachment resistance as that
    random coil SF molecules folding into a stable β-sheet conforma-          observed in PBS with artificial external force treatment. Once cells
    tion to form water-insoluble molecule networks, in which the              adhere, part of the FN will desorb during the attachment phase.
    remaining random coil regions and other soluble protein                   Simultaneously, cells will also generate tensions via their
    fragments are embedded.12 When the amount of β-sheet exceeds              cytoskeleton and exert cell contractility on the adsorbed protein
    a threshold (~15%), the network is dense enough to make the               layer of underlying materials through FAs,25 which might induce
    bulk SF material water insoluble.15 Our SEM images (Fig. 2a)              our observation of partial FN detachment from the SF surfaces.22
    revealed that some soluble fractions can still easily dissolve and           Furthermore, the influence of protein/material interfacial stability on
    escape from the relatively loose β-sheet network of an SFL                BMSC behavior was studied. Among various proteins that form FAs,
    substrate under external forces, although the bulk material is            vinculin plays a crucial role in FA assembly and actin polymerization.20
    water-insoluble. This finding indicates the surface instability of the     The structure of vinculin can switch between activated (linked to F-
    material with a low β-sheet content.                                      actin) and inactivated (head–tail folding structure inhibiting its
       This observation was confirmed by the quantification of the              association with F-actin).36,44 Immunostaining revealed an increase
    remaining mass of SF substrates subjected to the same artificial           in cytoskeleton-associated (i.e., activated) vinculin in BMSCs cultured
    external force treatment (Fig. 2b). The 29.2% total weight loss of        on the SFH surface compared to SFL (Fig. 4b). This result is consistent
    SFL substrate is close to the reported ~35% total weight loss of a        with the observed upregulated expression of Vinexin α and Cap in the
    low β-sheet content (~20%) silk film, which is prepared by the             BMSCs cultured on the SFH surface (Fig. 4k, l), which is related to the
    slow-drying method and tested via a degradation/dissolution               activation and unfolding of vinculin.36,45

                                                                                                              Bone Research (2021)9:13
Silk fibroin and osteogenic cell behavior
                                                                              Y Long et al.
                                                                                                                                                         9
   The cellular assays also demonstrated that the BMSCs exhibited a                                                      SFM            SFH
more elongated shape (Fig. 4c) with a higher degree of cytoskeletal
organization on SFH surfaces than on SFL surfaces (Fig. 4e). The
emergence of cellular scale order in cytoskeletal organization has
also been observed on substrates when other types of mechan-
obiological stimuli were applied, e.g., different geometric micro-
patterns46 and frequent mechanical stress.47 Moreover, the
anisotropy value (0.485) of F-actin fibers in the BMSCs on SFH is
close to the reported data (~0.5) found in BMSCs cultured on                           SF:β-sheet                                    YAP/TAZ
typically stiff and stable material surfaces (e.g., glass),46 implying that
the order of cytoskeletal organization on SFH reached its upper limit.                 SF:Other conformations                        RUNX2
   Single-cell scatter plots showed two trends: (i) a larger number
of cytoskeleton-associated FAs of the BMSCs on higher β-sheet                          Instability of material-protein interfaces    Cytoskeleton

content surfaces along with higher-order cytoskeletal organization            Fig. 7 The molecular conformation of SF regulates osteogenic cell
(Fig. 4g) and (ii) a higher-order cytoskeletal organization correlated        behavior by modulating the stability of the adsorbed protein-
with more elongated cell shapes (Fig. 4h). This finding is                     material interface. Applying FN as a model cellular adhesive protein,
supported by the upregulated gene expression of Rhoa in the                   the surface stability of the SF substrates and the accompanying
BMSCs cultured on the SFH surfaces (Fig. 4m). Previous studies                detachment resistance of adsorbed protein on these SF substrates
demonstrated that via exposure of its cryptic binding sites to link           increased with increasing β-sheet content. Furthermore, more
F-actin, unfolded vinculin can trigger a series of phosphorylation            cytoskeleton-associated FAs, higher orders of cytoskeletal organization,
events to activate the mechanoresponsive signaling transforming               and more elongated spreading shapes were observed in the BMSCs
protein, RhoA, which engages in the control of cytoskeleton                   cultured on the SFH surface than in those cultured on the SFL surface,
                                                                              along with the enhancement of nuclear translocation and activation of
dynamics and promotes cell elongation and polarity.21,44                      YAP/TAZ and RUNX2 in intracellular mechanotransduction
   Thus, a lower stability of the adsorbed protein-material interface
was found along with a smaller number of cytoskeleton-associated
FAs, lower order in cytoskeleton organization, and less elongated cell           Although many studies have focused on osteogenic signaling
shapes in the BMSCs cultured on the SFL surfaces compared to the              and regulating the osteogenic potential of stiff SF materials via
SFH surfaces. These observations can be explained by the tensegrity           their physical (e.g., topography designs), chemical (e.g., decorated
model, which shows that cytoskeletal ordering and cell polarity               chemical groups) and biological (e.g., immobilized growth factors)
require high resistance to endogenous stress.23 The instability of the        factors,50 few have revealed the impact of SF molecular
adsorbed protein-material interface of substrates with low β-sheet            conformation on osteogenic cell behavior. Using FN as a model
content may partially reduce the intracellular tension and stress             cellular adhesive protein, this study found that the surface stability
resistance by the adsorbed protein-FA-cytoskeleton link.22 Compared           of the SF substrates and the accompanying detachment resistance
to the cellular effect induced by low stiffness, the spreading cell           of adsorbed protein showed a positive correlation with the
shape and cytoskeletal organization pattern observed here in the              β-sheet content. Moreover, we observed (i) more cytoskeleton-
BMSCs on stiff but unstable SFL surfaces are completely different             associated FAs, (ii) higher-order cytoskeletal organization, and (iii)
from those on soft materials. On a soft material (e.g., hydrogel)             more elongated cell spreading for BMSCs cultured on the SF
surface, most cells present a round and nonspreading shape with an            substrates with high vs. low β-sheet content, along with enhanced
orthoradial pattern of actin filaments around the nucleus.19,35                nuclear translocation and activation of YAP/TAZ and RUNX2.
   In this intracellular mechanotransduction process, the nuclear-            Consequently, osteogenic differentiation of BMSCs was stimulated
cytoplasmic ratio of YAP/TAZ was higher on the SFH surface than               on high β-sheet substrates. These results indicate that the β-sheet
on the SFL surface (Fig. 5b). In the nuclei, YAP/TAZ are activated            content may influence the osteogenic differentiation of BMSCs on
and can interact with and activate a number of their DNA binding              stiff SF material surfaces by modulating the detachment resistance
partners (e.g., RUNX230–32) to modulate the osteogenic differ-                of adsorbed protein, which proceeds via protein-FA-cytoskeleton-
entiation of stem cells. This higher nuclear-cytoplasmic ratio was            YAP/TAZ-RUNX2 mechanotransduction (Fig. 7).
correlated with the higher gene expression levels of Ankrd1 and                  Moreover, by using stiff SF substrates as an example, we found
Ctgf in the BMSCs cultured on SFH than in those cultured on SFL               that the stability of the protein-material interface can play an
(Fig. 5h–k). Ankrd1 and Ctgf are YAP/TAZ target genes, and their              important role in the cellular perception of the stiff material
expression patterns are used to monitor the activity of YAP/TAZ.24            interface. The unstable material surface and accompanying
   After 3 days, higher gene (Fig. 5m)/protein (Fig. 5d) expression           inadequate detachment resistance of adsorbed cellular adhesive
and nuclear localization of RUNX2 (Fig. 5c) were also observed in             protein may partially impede the mechanotransduction of cells
the BMSCs on the SFH surfaces than the SFL surfaces. The single-              anchoring onto the material surface. This phenomenon should
cell scatter plots (Fig. 5e) indicate that RUNX2 and YAP/TAZ                  not be overlooked when engineering stiff biomaterial (e.g., silk)
might undergo nuclear translocation together. The YAP/TAZ                     interfaces for bone-related applications. However, how this
complex can promote BMSC osteogenic differentiation by                        stability of the protein-material interface regulates BMSC
enhancing RUNX2-dependent transcriptional activation.24,48,49                 behavior on stiff material surfaces in 3D, long-term, and
This material surface-dependent nuclear cotranslocation and                   multifactorial in vivo conditions still needs to be investigated
activation of YAP/TAZ and RUNX2 in BMSCs has also been                        further.
reported on material substrates engineered by other mechanical
stimulations (e.g., nanotopography).31 To confirm this effect of
intracellular mechanotransduction on osteogenic differentiation,              MATERIALS AND METHODS
we further cultured BMSCs on different silk material surfaces for             Construction of SF substrates with different conformations
2 weeks. The results showed an increased osteogenic differ-                   B. mori silk cocoons were first degummed in boiled 0.02 mol·L−1
entiation of BMSCs on the SFH surface than on the SFL surface                 Na2CO3 solution for 30 min and then washed with Milli-Q water.
(Fig. 6). The upregulated expression of Osterix (Fig. 6i, j), a               After drying, the extracted silk was dissolved in 9.3 mol·L−1 LiBr
downstream gene of RUNX2,16 on the SFH surfaces, is consistent                solution at 60 °C for 4 h and then dialyzed with Milli-Q water.10
with the observation that RUNX2 was activated more effectively                Insoluble residues were removed by centrifugation. Finally, the SF
on that surface.                                                              aqueous solution was diluted to 4 wt%.

Bone Research (2021)9:13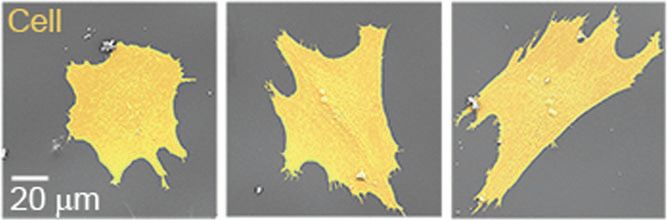
Silk fibroin and osteogenic cell behavior
                                                               Y Long et al.
10
        To facilitate good handling and avoid morphological changes of         Detachment resistance of FN
     SF materials during the experiments, we prepared silk substrates          FN (5 μg·mL−1) from human plasma (F1056, Sigma, U.S.A.) was
     by casting 200 μL of SF solution onto titanium disks (15 mm               dissolved in PBS solution according to previous references.19,22
     diameter). To enhance the contact area and adhesion of SF film             The SF substrates were immersed in FN solution for 24 h. Then, the
     with titanium disk and avoid detachment of SF film during the              samples were treated without or with the same ultrasonic
     whole experiments, we first acid etched the titanium disks with            treatment used in the surface stability experiments before
     HCl/H2SO4 for 30 min at 60 °C, ultrasonically cleaned them in             removing the samples from the solution. Subsequently, all samples
     acetone, ethanol and water, and finally subjected them to argon            were incubated with the corresponding primary and secondary
     plasma glow discharge (Radio frequency glow discharge machine,            antibodies (Supplementary Table 2) to fluorescently label FN.
     Harrick Scientific Corp., U.S.A.) for 5 min before the SF solution         Images were captured by a fluorescence microscope (Axio Imager
     casting. The SF films were dried in a vacuum oven to avoid                 Microscope Z1, Zeiss, Germany), and fluorescence density was
     structural changes.38 Finally, the films were annealed in a water          analyzed by ImageJ (n = 3, three random fields per sample).
     vapor-filled vacuum chamber at 4 °C for 6 h (SFL group), 37 °C for            For determination of the FN detachment ratio under external
     12 h (SFM group), or 90 °C for 24 h (SFH group) to achieve different      stimuli, FN concentrations in solutions were determined by a FN
     β-sheet contents in the SF substrates. The thickness of the SF films       Human ELISA kit (BMS2028, Invitrogen, U.S.A.). The detachment
     made by this method was ~50 μm.10,38                                      ratio was calculated using the following formula:

     Fourier transform infrared spectroscopy (FTIR)                                                      C2
                                                                               FN detachment % ¼              ´ 100%;
     FTIR analysis of the silk films was performed using attenuated total                              C0  C1
     reflectance infrared spectroscopy (UATR Two, PerkinElmer, the
                                                                               where C0 represents the initial concentration of FN added to the
     Netherlands). For calculation of the β-sheet content in the different
                                                                               PBS solution, C1 represents the concentration of FN remaining in
     SF substrates, the contribution of the different SF conformations to
                                                                               the PBS solution after 24 h of immersion, and C2 represents the
     the amide I region (1 595–1 705 cm−1) was determined by Fourier
                                                                               concentration of FN detached under external stimuli (n = 3).
     self-deconvolution using PerkinElmer software and subsequent
                                                                                  In addition, immersion of samples in 50 mmol·L−1 Tris buffer pH
     curve fitting by OriginPro software according to a previously
                                                                               7.4 containing 1 mmol·L−1 EDTA for 24 h at 37 °C52 was chosen as
     reported step-by-step method (n = 3).15,51
                                                                               an alternative artificial external stimulus for reference.
     Surface topography of the SF substrates observed via SEM
                                                                               Cell isolation and identification
     The surface topography of SF substrates dried in a vacuum oven
                                                                               BMSCs were isolated from the femurs of 3-week-old male rats
     was examined by SEM (Zeiss, Sigma-300, Germany) after being
                                                                               (Charles River) with the approval of the Institutional Animal Care
     coated with a 10 nm chromium layer.
                                                                               and Use Committee of Tongji Medical College (IACUC Number:
                                                                               539). For each batch, primary cells derived from at least five rats
     AFM
                                                                               were pooled together, and three batches of cells were made to
     The surface topography and roughness of the SF substrates were
                                                                               verify the reproducibility of the experiments. Cells were cultured in
     measured using AFM (Bruker, multimode 8, U.S.A.) (n = 3, three
                                                                               growth medium consisting of α-MEM medium (Gibco, Invitrogen
     random points per sample). The stiffness of the SF films was
                                                                               Corp., Paisley, Scotland) supplemented with 10% fetal bovine
     measured by using AFM cantilevers (SNL-10, Bruker, multimode 8,
                                                                               serum (FBS, Gibco, Invitrogen Corp., Paisley, Scotland) and 1%
     U.S.A.) with a nominal spring constant of 0.35 N·m−1. Samples for
                                                                               penicillin-streptomycin according to a standard protocol.40,53 The
     stiffness measurement were first hydrated with PBS solution,38
                                                                               pluripotency of BMSCs was identified with a flow cytometer
     and the force vs. indentation curves were obtained in PBS on each
                                                                               (LSRFortessa, BD, U.S.A.). Cells were harvested and suspended to a
     SF substrate. Elastic modulus values were analyzed by NanoScope
                                                                               concentration of 1 × 10⁶ cells per mL in ice-cold PBS, and CD90,
     Analysis software.
                                                                               CD44, and CD29 were used as positive markers, while CD31 was
                                                                               used as a negative marker (Supplementary Table 3). Cells were
     Wettability
                                                                               passaged to the 3rd generation at a confluency of 70%–80%
     The wettability of different SF substrates was determined by detecting
                                                                               before use.
     the static water contact angles of the surfaces with an optical
     tensiometer (Theta Lite Attension®, Biolin Scientific, Sweden) (n = 3).
                                                                               Cell culture
                                                                               Untreated SF substrates were sterilized by ultraviolet light for 30 min.
     Surface stability of the SF substrates
                                                                               For analysis of the detachment resistance of FN in a cell culture
     For detection of the surface stability in an aqueous environ-
                                                                               environment, the SF substrates were first immersed in serum-free (to
     ment, samples were immersed in 2 mL of PBS solution at 37 °C
                                                                               avoid the interference of FN from serum) cell culture medium (α-
     for 14 days. PBS was refreshed every 24 h. At specified time
                                                                               MEM) containing 5 μg·mL−1 FN for 2 h.19,22 Then, BMSCs were seeded
     points, a mild ultrasonic treatment was applied to remove any
                                                                               at a density of 2 × 10³ cells per cm2 in serum-free medium and
     loosened components from the material surfaces before
                                                                               cultured for 24 h, while SF substrates immersed in the same medium
     removing the samples from PBS. The probe of the sonicator
                                                                               without cells were used as controls.
     (UP50H, Hielscher, Germany) was located 1 cm right above the
                                                                                  For other cell assays, untreated SF substrates were first
     sample, and mild ultrasonic treatment lasted for 6 s at 20%
                                                                               immersed in complete osteogenic medium (α-MEM, 10% FBS,
     amplitude with a pulse rate of 1 s on and 1 s off according to
                                                                               50 μg·mL−1 ascorbic acid (A4544, Sigma, U.S.A.), 10 mmol·L−1
     previous references.41 Then, the samples were gently rinsed
                                                                               β-glycerophosphate (G9422, Sigma, U.S.A.), 10−8 M dexametha-
     with Milli-Q water and dried in a vacuum oven. The remaining
                                                                               sone (D4902, Sigma, U.S.A.), and 1% penicillin-streptomycin) for
     mass of SF materials at specified time points was calculated
                                                                               2 h before cell seeding. Then, cells were seeded in this complete
     using the following formula:
                                                                               osteogenic medium. For the individual cell-based fluorescent
                            Wt                                                 measurements, a seeding density of 2 × 10³ cells per cm2 was
     Remaining mass % ¼        ´ 100%;                                         applied for the cell adhesion, spreading, and intracellular
                            W0
                                                                               mechanotransduction experiments according to the literature.32
     where W0 represents the initial weight of the sample and Wt               For the fluorescent staining of RUNX2 and YAP/TAZ at day 3, the
     represents the weight of the sample at a specified time point (n = 3).     SF substrates were treated with mitomycin C (10 μg·mL−1,

                                                                                                             Bone Research (2021)9:13
Silk fibroin and osteogenic cell behavior
Y Long et al.
11
Sigma, U.S.A.) for 2 h after 12 h of cell seeding to inhibit 70%, 80%, 90%, 96%, and 10 min in 100% ethanol twice). The
proliferation, which can interfere with their individual cell-based samples were then treated with 1 drop of tetramethylsilane, air-
fluorescence measurements.32 In addition, 1 × 10⁴ cells per cm2 dried, coated with 10 nm chromium, and examined via SEM.
BMSCs were seeded to assess cell proliferation and osteogenic
differentiation. ALP and mineralization
After 7 days of cell culture, ALP activity in BMSCs was measured
Immunofluorescence staining using the p-nitrophenyl phosphate (Sigma, U.S.A.) method as
At specific experimental time points, cells were fixed with 4% previously described.19 The ALP activity was normalized by DNA
paraformaldehyde and permeated with 0.1% Triton X-100. content per sample via a QuantiFluor dsDNA System kit (E2670,
Subsequently, the cells were blocked with 1% goat serum for Promega Corporation, Madison, U.S.A.). For ALP staining, cells
30 min, incubated with the corresponding primary and secondary were fixed and stained with an ALP Staining Kit (AP100B-1, SBI, U.
antibodies (Supplementary Table 3) and incubated for 1 h. S.A.), followed by taking images via a stereomicroscope (MZ12,
Samples were incubated with phalloidin for 30 min and DAPI for Leica, Germany). After 14 days, calcium contents were assayed
10 min to label F-actin and mark cell nuclei, respectively. using the ortho-cresolphthalein complexone (Sigma, U.S.A.)
CKB treatment could remove the proteins that were not method as previously described.48 For mineralization staining,
associated with the cytoskeleton. CKB treatment was applied as cells were fixed and then stained with an Alizarin Red S staining kit
described previously to distinguish the amount of cytoskeleton- (TMS-008-C, Merck Millipore, U.S.A.), followed by taking images via
associated vinculin-containing FAs from the total amount of vinculin- stereomicroscope.
containing FAs.36 Briefly, to observe the cytoskeleton-associated (i.e.,
CKB treatment-resistant) vinculin-containing FAs, cells were first Quantitative reverse transcription polymerase chain reaction
treated twice with CKB (0.1% Triton X-100, 10 mmol·L−1 PIPES, pH (qRT-PCR)
6.8, 50 mmol·L−1 NaCl, 3 mmol·L−1 MgCl2, 300 mmol·L−1 sucrose) at The RNA of BMSCs on different silk substrates (n = 3) was extracted
4 °C for 30 s, followed by a standard fixation step with 4% using the RNAprep Pure Micro Kit (DP420, Tiangen, China)
paraformaldehyde. Images of stained samples were captured by according to the manufacturer’s instructions. The RNA was reverse
confocal fluorescence microscopy (Zeiss, LSM780, Germany). transcribed to cDNA using HiScript III RT SuperMix for qPCR (R323-
01, Vazyme, China). Subsequently, cDNA was added to ChamQ SYBR
Fluorescent image analysis qPCR Master Mix (Q311-02/03, Vazyme, China) and complemented
All images were analyzed by ImageJ (NIH, U.S.A.). by a real-time PCR system (ABI 7300, Applied Biosystems, U.S.A.).
For collagen Ι quantification, the mean intensity of four random The primers for the genes are listed in Supplementary Table 4. The
fields across three samples per group was measured. mRNA levels of target genes were normalized to the level of GAPDH
FN detachment induced by cell contractility was measured using mRNA and calculated via the 2-ΔΔCt method.
a method as previously described.22 In brief, the cellular masks were
determined by the thresholding method from F-actin fluorescent Inhibition of cytoskeleton organization
images and used to delineate the cell outline. We calculated the For analysis of the inhibition of cell spreading and cytoskeletal
ratio of the dark area underlying the cell outline in FN staining organization, Y27632 (50 μmol·L−1, Selleck, U.S.A.) was supple-
images to the total cell area. In addition, we calculated the ratio of mented daily with the cell culture medium, and the treatment
FN intensity underlying the cell outline to the background (the lasted 4 h prior to cell harvesting as previously described24 for
other area beyond the cell outline) FN intensity. Four random fields fluorescent staining and qRT-PCR.
across three samples per group were measured.
At least 30 individual cells across three samples per group were Cell proliferation
selected for all cell-based measurements. For measurement of the Cell proliferation on different material surfaces (n = 3) was
FA area per cell, the grayscale vinculin image was thresholded to assessed by a cell counting kit (CCK-8, Dojindo, Japan) according
produce a black and white image from which the pixels to the manufacturer’s instructions.
representing FAs were counted and summed, following a step-
by-step quantitative FA analysis protocol as previously reported.54 Statistical analysis
For measurement of cell area and perimeter, the cellular masks One-way ANOVA was used to determine statistical significance
were determined by a thresholding method from F-actin followed by post hoc analysis using the Tukey test. All statistical
fluorescent images, and then, they were used to calculate cell analyses were performed with GraphPad Prism and Origin software.
area and cell perimeter. The CSI was calculated using the formula
as previously reported:28
ACKNOWLEDGEMENTS
4π ´ cell area This work was supported by the National Key R&D Program of China
CSI ¼ ;
cell perimeter 2 (2017YFC1104301, to L.C.), the National Natural Science Foundation of China for
Distinguished Young Scholars (31725011, to L.C.), and the China Scholarship Council
where a line and a circle have CSI values of 0 and 1, respectively. (201606160095, to X.C.).
F-actin anisotropy was measured by the ImageJ plug-in
“FibrilTool” as previously reported,55 where disordered F-actin
(purely isotropic fibers) and perfectly ordered F-actin (parallel AUTHOR CONTRIBUTIONS
Y.L. and X.C. performed the experiment and analyzed the data. Y.L., X.C., J.J., and S.L.
fibers) have anisotropy values of 0 and 1, respectively.
prepared the paper. J.M. helped quantify the fibronectin concentration. L.C. and F.Y.
The nuclear/cytosolic (nuc/cyto) ratio of YAP/TAZ and RUNX2 designed the experiment and supervised the study. All authors have contributed to
was determined by measuring the intensity of a region of the writing or revising the paper and final approval.
nucleus and a region of equal size in the cytosol immediately
adjacent to the nuclear region as previously described.36
ADDITIONAL INFORMATION
Cell spreading observed by SEM The online version of this article (https://doi.org/10.1038/s41413-020-00130-0)
Samples were fixed in 2% glutaraldehyde for 20 min and then contains supplementary material, which is available to authorized users.
immersed in 0.1 mol·L−1 Na-cacodylate for 10 min. Then, the
samples were dehydrated in a graded series of ethanol (5 min in Competing interests: The authors declare no competing interests.
Bone Research (2021)9:13You can also read