Raman and Surface-Enhanced Raman Spectroscopy Applied in Art Conservation
←
→
Page content transcription
If your browser does not render page correctly, please read the page content below
Raman and Surface-Enhanced Raman
   Spectroscopy Applied in Art Conservation

Name: Amber Kamman
Student ID: 12931977
MSc. Literature Project

Daily supervisor: Iris Groeneveld
Examiners: prof. dr. ing. Maarten van Bommel and dr. Freek Ariese
Date: 20-02-2021

Abstract
This literature review shows the value of invasive Raman spectroscopy techniques
determination of colourants and some of their degradation products in works of art. Raman
can identify the chemical composition of colourants in complex samples and identify which
painting technique is used. This knowledge is of great value for proper restoration. Both organic
and inorganic components can be identified and quantified with various Raman spectroscopy
techniques.
The identification is done with a limited but growing amount of reference spectra. Surface-
enhanced Raman spectroscopy (SERS) is a powerful technique to measure components at
low concentrations. There are currently developments in the field of Raman spectroscopy such
as micro-Raman, micrometre-scale spatially offset Raman spectroscopy (micro-SORS) and
ultraviolet-surface enhanced Raman spectroscopy (UV-SERS).
Ultimately, it could be concluded that Raman spectroscopic techniques are of great added
value in the field of art conservation. However, the Raman spectroscopy techniques cannot
complete the complete picture alone. Other techniques such as high-performance liquid
chromatography (HPLC), X-ray fluorescence (XRF) and infrared spectroscopy are needed to
fill in the gaps. A complete picture can be generated by combining multiple techniques with
multivariate data analysis.

Keywords: Raman, Surface-Enhanced Raman Spectroscopy, SERS, Art, Pigments, Dye,
Colorants, Conservation

Photo credits/source front page: S. Lin, [1], corpus ID: 202691443, 2015

                                                                                               2
Acknowledgements
I would like to thank Iris Groeneveld and Maarten van Bommel for guiding me through writing
this literature study, for their patience and helpful feedback. Furthermore, I would like to thank
Freek Ariese for the enthusiastic introduction to SERS. His lectures sparked my interest to
learn more.

Abbreviations
 AFM                Atomic Force Microscopy
 ATR                Attenuated total reflection
 CCD                Charge-coupled device
 FT-IR              Fourier-transformed Infrared spectroscopy
 GC-MS              Gas chromatography-mass spectrometry
 HPLC               High-performance liquid chromatography
 LOD                Limit of detection
 LSP                Localized Surface Plasmon
 Micro-SORS         Micrometre-scale spatially offset Raman spectroscopy
 MVDA               Multivariate data analysis
 NIR                Near-Infrared
 RRS                Resonance Raman Spectroscopy
 SEM-EDX            Scanning electron microscopy energy-dispersive X-ray spectroscopy
 SERS               Surface-Enhanced Raman Spectroscopy
 SERSS              Surface-Enhanced Resonance Raman Spectroscopy
 TERS               Tip-Enhanced Raman Spectroscopy
 UV-SERS            Ultraviolet-surface enhanced Raman spectroscopy
 UV-VIS             Ultraviolet-visible
 W&N                Winsor and Newton
 XRD                X-ray diffraction
 XRF                X-ray fluorescence

                                                                                                3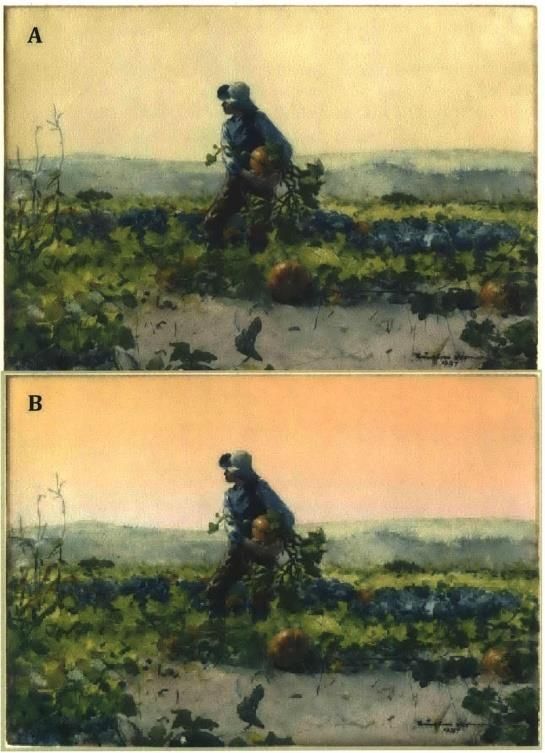
Table of content
Abstract .............................................................................................................................................2
Acknowledgements ..........................................................................................................................3
Abbreviations ....................................................................................................................................3
1.      Introduction ...............................................................................................................................5
2.      Method.......................................................................................................................................7
3.      Art, degradation and components of interest .........................................................................8
     3.1 Art and degradation ...............................................................................................................8
     3.2 Dyes ........................................................................................................................................8
     3.3 Pigments .................................................................................................................................9
     3.4 Surfaces, binders and mordant.............................................................................................9
4.      Raman spectroscopy applied in art conservation ................................................................ 10
     4.1 Theory ................................................................................................................................... 10
     4.2 Equipment ............................................................................................................................ 12
     4.3 Resonance Raman Spectroscopy ...................................................................................... 14
     4.4 Applications for measuring pigments ................................................................................. 15
     4.5 Critical review of Raman ..................................................................................................... 18
5.      Surface-Enhanced Raman Spectroscopy applied in art conservation .............................. 19
     5.1 The technique....................................................................................................................... 19
     5.2 Surface Enhanced Resonance Raman Spectroscopy ..................................................... 20
     5.3 Decision of substrates for SERS ........................................................................................ 20
     5.4 Applications for paint, pigments and other organic components ..................................... 21
     5.5 Critical review of SERS ....................................................................................................... 24
6.      Other Raman techniques applied in art conservation ......................................................... 25
     6.1 Tip-Enhanced Raman Spectroscopy ................................................................................. 25
     6.2 Alternative Raman Spectroscopy techniques.................................................................... 26
7.      Conclusions ............................................................................................................................ 28
        7.1 Recommendation for further research ........................................................................... 28
Literature ......................................................................................................................................... 29
Appendix ......................................................................................................................................... 32

                                                                                                                                                     4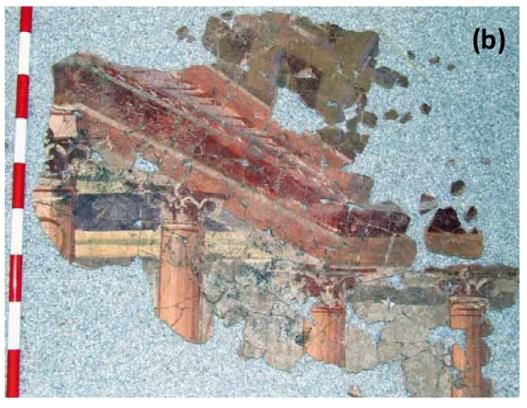
1. Introduction
Art is a big part of our cultural heritage, it is a symbol of beauty, religion, status and more.
Colours are fundamental to obtain a deeper understanding and appreciation of a culture and
society’s history. More knowledge can be gathered by studying the pigments and dyes in these
objects. It helps with authenticating art, by comparing it with work from the same artist.
Furthermore, it can render the initial colours of a faded art piece, identify painting techniques
and estimate the date of creation [1]. The fading of art is caused by degradation processes.
Degradation through time and other factors can hinder the correct interpretation of the artist’s
intention with the art pieces. This can be prevented by learning more about the original state
of the art pieces.

  Figure 1: ‘For to Be a Farmer’s Boy’ by Winslow Homer 1887. (A) The current appearance of the painting. (B)
                                Digital simulation of the original colour. Source [1].

The watercolour painting in Figure 1 shows what it can yield to research the degradation of
paint pigments. The top one (A) is the current state and the bottom one (B) is a digital
simulation after recreating the original colours with the acquired chemical knowledge [1]. This
can give the painting a completely different 'feeling' and thus meaning.

Detecting components at a very low concentration from a limited sample size is essential with
art preservation in mind [1]. Techniques such as Raman spectroscopy and Surface Enhanced
Raman Spectroscopy (SERS) are promising for the analysis of both organic and inorganic

                                                                                                                5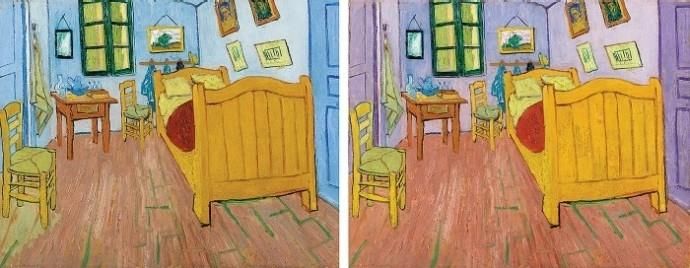
materials in art. Art objects are especially challenging, sampling is restricted and sometimes
not even admissible. This can be challenging since art exists in different forms; a multitude of
materials and layers makes the sample rather complex. Degradation of the materials used
makes identification even more problematic due to the presence of many unknown
compounds.

This literature review aims to give a state-of-the-art overview of Raman and SERS analysis of
samples taken from different types of objects. A review will be given on the possibilities and
limitations of these techniques in the research of a multitude of art objects. Primarily
concentrated on organic materials such as dyes, organic pigments and binding mediums. The
focus is on the application of the techniques in art and applied art. Non-invasive analysis
directly on the object is not part of this literature study.

This literature report starts with background information about art, degradation and the
components of interest (chapter 3). Then the theory and equipment of Raman spectroscopy
are explained (chapter 4). This chapter also includes resonance Raman spectroscopy. At the
end of this chapter, two case studies on the application of Raman in art research are discussed
and critically reviewed. Chapter 5 follows the same structure as chapter 4 but focuses on
SERS. The decision between substrates for SERS are explained in this chapter. Chapter 6
briefly explains and discusses other techniques, including Tip-Enhanced Raman
Spectroscopy. In chapter 7, a conclusion to the aim of this research thesis is given, and
suggestions for a follow-up study are made.

                                                                                              6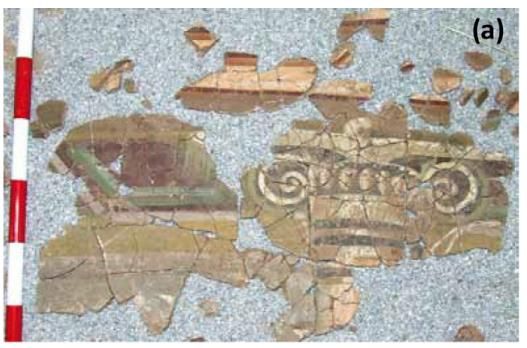
2. Method
This literature study is not comprehensive but provides an overview of several Raman
applications, their advantaged and disadvantages, and further prospects in research on art
objects1. The studies referenced and used for this literature review were selected based on
the following criteria:
    ▪ The focus is on the application of Raman spectroscopy techniques in art and applied
         art.
    ▪ The methodologies for measuring (degradation of) cultural heritage were successful
         with Raman techniques. When additional techniques were applied, clear argumentation
         and motivation are given.
    ▪ Sample preparation and measurement methodology were described meticulously.
    ▪ The advantages and possible disadvantages of the Raman techniques used were
         discussed.
    ▪ Non-invasive analysis directly on the object is not included in this literature study.

1
    This literature study is 6EC instead of 12EC.

                                                                                          7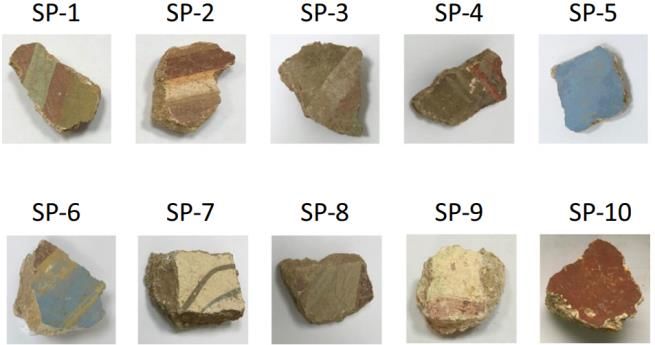
3. Art, degradation and components of interest
This chapter discusses the impact of colours on art objects and how this could change due to
degradation over time. Several causes of degradation and processes are elaborated. In the
second part of this chapter, more information will be given about the components of interest
and their complexity.

3.1 Art and degradation
Works of art connect and inspire people and teach us about history. Visual art exists in a lot of
different forms, such as ceramics, drawings or paintings. An important aspect in visual art, that
has a big influence on its interpretation, is colour. Over time, the colours of a piece of art can
change as can be seen from the artwork of Van Gogh in Figure 2. In his painting ‘de
slaapkamer’, Van Gogh has used different pigments that have changed over time. The most
striking change is the colour of the walls. For this colour, Van Gogh used a blue pigment and
cochineal red pigment. The cochineal red pigment is sensitive to light and overtime only the
more stable blue pigment remained [2].

Figure 2: Vincent van Gogh's painting 'de slaapkamer'. Current condition (left) and s digital reconstruction of the
initial colours before degradation (right). Source [3].

Factors that can cause these changes include, among others, biodegradation [4],
photochemical degradation (non-radiative processes, radiative processes, photooxidation
reactions, etc.) [5], indoor climate [6], a poor choice of the raw material used or preparation
conditions [7]. Depending on the environment in which the art object is made, where located
and/or stored, the different processes may have played a larger or smaller role.

3.2 Dyes
Natural dyes were used all over the world for centuries. These dyes are often used because
of their brightness, non-toxic and soothing nature. They naturally occur in bark, fruits, plants,
roots and seeds. These contain organic compounds that absorb visible light [8]. Natural dyes
are gradually used less and less since William Henry Perkin made the first synthetic dyes in
1856 [9]. Dyes are soluble, thus they can be applied as solutions, which is different from
pigments which are by definition insoluble in the medium in which they are applied.

                                                                                                                 8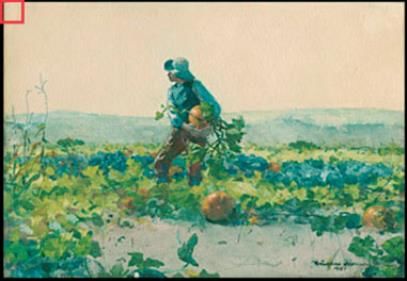
3.3 Pigments
Pigments are compounds that are used to give material a colour [9], based on the period
certain components would be used. They are applied as solid particles, finely ground, mixed
with a liquid. These particles have a size between 10-20 micrometre. Pigments may be organic
or inorganic. Inorganic pigments are often brighter and tend to last longer. For centuries,
biological sources (organic pigments) were used. Other natural sources such as minerals could
be used as both organic and inorganic pigments. Currently, mostly inorganic or synthetic
organic pigments are used. A synthetic organic pigment is derived from petrochemicals.
Inorganic pigments are naturally found on earth or produced through chemical reactions, such
as oxidation.
More research is necessary on pigments in paint due to their complexity. Pigments have been
prepared with various methods throughout history. The formulations change differently through
degradation or interactions with other components in the paint [10]. The identification of the
pigments (and binder) employed may contribute to assess valuable information for proper
restoration and/or conservation treatment [11].

3.4 Surfaces, binders and mordant
Art is an extensive concept and exists in many forms. The colours used in art are applied to
pottery, linen canvases, murals, glazes and so on. To be able to apply colours, some kind of
binders could be required. Examples of binders are beeswax, glues, plant gums and oils [12].
Without these binders, there could be insufficient adhesion to the surface.
A mordant is a substance that is used to bind dyes on fabrics. Mordants that are frequently
used mainly include alumina [12]. The dye and mordant form an inorganic substrate that can
attach to a surface. These inorganic substrates are also called lake pigments.

                                                                                            9
4. Raman spectroscopy applied in art conservation
As mentioned previously, research on art objects can be challenging. High-performance liquid
chromatography (HPLC) is often used for the determination of organic dyes. The main
limitation of this technique is the required big sample size. For pigments, in which HPLC cannot
be used, ultraviolet-visible (UV-VIS) spectroscopy is applied. However, this technique often
has insufficient fingerprint capacity to determine colourants in complex matrices [13].
Spectroscopic techniques like Raman are promising for the analysis of both organic and
inorganic materials in art. In this chapter, the theory and equipment of Raman spectroscopy
and resonance Raman spectroscopy (RRS) are explained. At the end of this chapter, two case
studies on the application of Raman in art research are discussed and critically reviewed.

4.1 Theory
By irradiating a molecule with a light source, energy can be scattered or absorbed. There are
essentially two types of scattering occurring in Raman spectroscopy: the common elastic
Rayleigh scattering, and the less common inelastic Raman scattering (divided into Stokes and
Anti-Stokes scattering). This scattering is at most 0.001% of the intensity of the source. Hence
it may initially seem that Raman scattering more difficult to detect than the IR vibrational bands
[14]. Moreover, Raman radiation is in the visible or near-infrared regions for which more
sensitive detectors are available [15]. In Figure 3, the different types of scattering that occur in
Raman are schematically shown with the corresponding energy diagram.

     Figure 3: Schematic overview of the different types of scattering occurring in Raman spectroscopy and
                                corresponding energy diagrams. Source: [16].

                                                                                                             10
When an electron in the ground state (g0 in Figure 3) is excited to a virtual excited state with
an energy of hv0 and falls back to the same ground-state (g0), no difference in the energy of
the photon is emitted, and nothing changes the frequency of the light. This phenomenon is
called Rayleigh scattering and is an example of elastic scattering because it does not change
frequency. Rayleigh scattering has by far the highest relative intensity in the Raman spectrum
and says nothing about the chemical composition of a sample [15, 16, 17].
The types of scattering that are considered during Raman are the inelastic Stokes and Anti-
Stokes scattering. The incoming energy hv 0 is not the same as the photon that is released
during the relaxation. In Stokes scattering, an electron in the ground state (g0 in Figure 3) is
excited to a virtual excited state with an energy of hv 0 and then falls back to a higher vibration
level (g1 in Figure 3). The energy of the emitted photon is then defined as hv 0-hvs and has a
lower frequency than the radiation of the source. Because the frequency changes with respect
to the source radiation, it is called inelastic scattering. Stokes scattering is lower in relative
intensity than Rayleigh scattering, but higher than Anti-Stokes scattering [15, 16, 17].
Anti-Stokes scattering occurs if the electron is already at a higher vibrational level (g1 in Figure
7), then is excited to a virtual excited state having an energy of hv 0+hvs and then falls back to
the ground state (g0 in Figure 3). The energy of the emitted photon is then defined as hv 0 +
hvs and has a higher frequency than the radiation of the source. Again, because the frequency
changes with respect to the source radiation, this is also called inelastic scattering. Since
initially (at ambient temperature) relatively few molecules are already in an excited state, the
intensity of the Anti-Stokes scattering is relatively the lowest on a Raman spectrum. However,
the intensity of the Anti-Stokes scattering can be increased by increasing the temperature
during the measurement in order to get more molecules in this excited state as follows from
the Boltzmann equation [15, 16, 17].
The scattering of the light is therefore expressed as the difference in wavenumber between
absorbed light and the emitted radiation. This shift is completely independent of the wavelength
of the light source due to the presence of virtual energy levels [15].
In essence, a Raman spectrum is mirrored with the same peaks to the left and right of the
Rayleigh shift, see Figure 4. Furthermore, the example spectrum also clearly shows the
difference in the relative intensity of the peaks.
Figure 4: Example of a Raman spectrum with the Rayleigh, Stokes and Anti-Stokes shifts. A spectrum was
measured with a 532 nm laser of CCL4 [18].
When performing Raman analyses, the Stokes shifts are often considered instead of the Anti-
Stokes shifts due to the higher intensity of the Stokes shift peaks. In some cases, the Anti-
Stokes shifts should be used, especially if the sample to be analysed shows signs of
11fluorescence. Fluorescence uses the same principles as Raman spectroscopy. Mostly
fluorescence is observed after radiation with a light source, due to higher efficiency. This
results in a lot of interference. Furthermore, the signals from fluorescence can cause
disturbances in the Stokes shift portion of the spectrum. Anti-Stokes shifts do not experience
interference from the fluorescence and can be used in this situation [16, 17].
4.2 Equipment
Figure 5 shows a schematic construction of a basic Raman spectrometer. It is important that
the scattering is measured at an angle of 90 degrees from the laser to avoid interference from
the laser source. The schematic representation clearly shows that the scattering perpendicular
to the direction of the laser is picked up by the wavelength selector, after which the radiation
is converted with a detector into data that can be read by a computer system.
Figure 5: Raman spectrometer, source [17].
The choice of the diffraction grating, or wavelength selector, depends on the form of Raman
spectroscopy used. Traditionally, dispersive Raman used double or even triple grating
monochromators, but today they are often replaced with a single monochromator in
combination with holographic interference filters or "notch filters". These notch filters and
interference filters are necessary to filter the Rayleigh scattering as much as possible to
accurately measure the relatively weak Raman scattering [17]. A schematic representation of
a dispersive Raman spectrophotometer is shown in Figure 6.
Figure 6: Dispersive Raman spectrophotometer, source [19].
The light that passes over the grating and/or filters is eventually collected on a detector. This
detector is often a Charge-Coupled Device (CCD). This detector is a silicon multichannel array
detector capable of detecting UV, visible and near-infrared light [20]. The sensitivity and high
12quality are of great importance to be able to capture the relatively weak Raman signal in a
representative manner [20].
CCDs can generate thousands to millions of individual detector units (or pixels) under the
influence of light, which can be converted into a spectrum through a processing system. High-
grade CCD detectors require a degree of cooling to use during the measurements often using
Peltier cooling systems (and possibly liquid nitrogen cooling) [20]. The CCD is often exposed
to light diffracted by a grating, which is shown schematically in Figure 7.
Figure 7: CCD detector, source [20].
Another way of Raman spectroscopy is Fourier-Transform Raman (FT-Raman) and uses a
Michelson-Interferometer. This interferometer can measure the entire spectrum at once in the
form of an interferogram by varying the position of the mirror in the interferometer. This
contrasts with dispersing the spectrum into separate wavelengths. The position of the mirror is
monitored very accurately with the aid of a HeNe reference laser [19]. A schematic
representation of the interferometer in an FT-Raman spectrophotometer is shown in Figure 8.
Figure 8: Michelson-Interferometer, source [19].
The use of FT-Raman has advantages, especially the wide spectral window that can be
obtained at high resolution and the high wavelength accuracy due to the calibration with the
reference laser. Furthermore, multivariate models can be more reliably applied to FT data and
the data is more consistent between instruments. A noteworthy advantage of FT-Raman is the
use of a 1064 nm excitation laser which very effectively eliminates fluorescence, but the high
laser energy of Raman lasers is often too much and can damage (organic) samples [19].
Recently, Fourier-Transform instruments have been overshadowed by advances in dispersive
Raman. This is mainly due to the possibility to use lasers with another wavelength then
131064nm. Multiple laser wavelength options make optimisation for a wider range of compounds
possible [21]. Additionally, the rapidly evolving optoelectronics market, while FT-Raman
continues to use the ‘mature’ FT-IR platforms and Michelson-Interferometers. Furthermore,
the application of ‘low-noise’ CCD detectors is quicker and often good enough for Raman
measurements without the need for an FT-IR platform [19].
Raman scattering always occurs. A laser is necessary, it has a high enough intensity to
produce a sufficient amount of scattering for measurements and good signal-to-noise ratios
[17]. An overview of commonly used laser wavelengths and sources used in art application is
given in Table 1.
Table 1: Common laser wavelengths and sources used in Raman spectroscopy in art applications. Source: [14].
Wavelength (nm) Source
413.1 Ar+ ions
457.9 Ar+ ions
473.1 Doubled Nd:YAG
488 Ar+ ions
514.5 Ar+ ions
532 Doubled Nd:YAG
632.8 He-Ne
647.1 Kr+ ions
780-785 GaAlAs diode
830 GaAiAs diode
1064 Nd:YAG
Fluorescence is the main limitation when measuring samples. In art, varnish layers are often
strongly fluorescent. There are a few possibilities to overcome this problem. Firstly, selecting
the best laser is essential. It is possible to overcome this fluorescence by selecting a laser of
lower energy (thus higher wavelength). The energy could be so low that less or no fluorescence
occurs [17]. Secondly, instead of Stokes scattering, anti-Stokes scattering could be used for
observations of the Raman bands. The intensity of anti-Stokes bands are much lower,
however, fluorescence does not occur in this region.
4.3 Resonance Raman Spectroscopy
As already discussed, Raman scattering is a relatively weak process. Through resonance
enhancement, selectivity and sensitivity can be increased. This is achieved by utilizing a laser
wavelength that is close to the molecule absorption wavelength. The lines from the most
symmetric vibrations are enhancement up to a factor of 106 [17]. Thus, Resonance Raman
Spectroscopy (RRS) can be used to selectively pick out and positively identify a molecule in a
matrix, see Figure 9. Electronic information about a molecule can be obtained from the
intensities of the bands found in resonance, from the energy separations in overtone
progressions, and from the overtone patterns that can be obtained [22].
14Figure 9: Raman spectra that illustrate the resonance Raman effect. The spectra are of crocoite (a) and
carotenoids (b) in corals, measured with a 473.1 and 632.8 nm laser. Resonance occurs when using the 632.8
nm laser in (a) and the 473.1 nm laser in (b). Source: [14] .
Another clear difference between normal Raman scattering and resonance Raman scattering
is that in both cases the intensity is dependent on the fourth power of the frequency, but in
resonance Raman scattering the intensity is also strongly dependent on how close the
frequency of the used excitation is to that of the frequency of an allowed electronic transition
[22]. See Table 2 for an overview of the main differences between Raman scattering and RRS.
Table 2: The main differences between RS and RRS, reproduced from: [22].
Raman scattering Resonance Raman scattering
No overtones Overtones common
More modes observed in the spectrum Some modes selectively enhanced
No electronic information Electronic information present
Weak scattering Stronger scattering
Absorption will occur due to the close match between laser wavelength and absorption
wavelength. Depending on the material, fluorescence and decomposition can occur. This is
important to keep in mind while performing experiments. Decomposition could have a negative
impact on further research of the same sample [22].
4.4 Applications for measuring pigments
Raman spectroscopy knows many applications in a wide variety of fields. Due to the underlying
theory, it can be useful in measurements of various materials (organic and inorganic) in the
gas, liquid and solid phase. Below, two applications of Raman spectroscopy in measuring
pigments in art are elaborated. These two applications have been selected because they
represent the possibilities and limitations of the technique. More applications will be mentioned
afterwards. A critical review follows in the next section.
Roman wall paintings in The Satyr Domus [23]
Cerrato et al. have studied ancient Roman wall paintings in The Satyr Domus. The wall was
made of mortar, a mixture of lime and sand. The surface of the wall paintings consists of a
mixture of lime, powdered marble and powdered limestone. This mixture served as a white
base layer, upon which the pigments were applied. A picture of the wall paintings is provided
in the Appendix.
15Figure 10: The ten fragments studied with various colourants. Source [23].
Ten fragments were used to identify the various colourants present, see Figure 10. These
fragments cover a wide variety of colours. Raman spectra were used to identify Egyptian blue,
goethite yellow, hematite red, pink (diluted red), green earth (glauconite and celadonite) and
calcite white. Table 3 shows an overview of the pigments, its formula and peaks used for
identification.
Table 3: Overview of identified pigments on Roman wall paintings in The Satyr Domus, source [23].
Name pigment Colour Formula Main peaks Weaker peaks (cm-1)
(cm-1)
Egyptian blue Blue CaCuSi4O10 430, 1085 1012, 989, 787, 765, 569,
462, 402, 375, 231, 192
164
Goethite yellow Yellow α-FeOOH 392 244, 299, 480, 554, 683
Hematite red Red α-Fe2O3 1320 220, 290, 410
Hematite red Pink α-Fe2O3 1320 220, 290, 410 &
(diluted) 1085, 712, 278, 152
Glauconite Green (K,Na)(Fe3+,Al,Mg)2(Si,Al)4O10(OH)2 590 270
green
Celadonite Green K(Mg,Fe2+)(Fe3+, Al)(Si4O10)(OH)2 550 264
green
Calcite white White CaCO3 1085 712, 276, 152
A combination of multiple analytical techniques was used to identify chemical components and
mineralogical phases. Scanning electron microscopy-energy dispersive X-ray spectroscopy
(SEM-EDX) was used to examine the composition of the different layers. X-ray diffraction
(XRD) and spectra databases were used to confirm the composition of the measured pigments.
Minor contaminations found in the pigments revealed the preparation method used. UV-VIS
spectroscopy and gas chromatography-mass spectrometry (GC-MS) were used to identify
organic compounds. Components and decomposition products were found of bee wax, a
component used as a pigment binder.
Late medieval objects from Norwegian churches [7]
Platania et al. have studied objects from the 15th and 16th-century form Norwegian churches.
Three painted micro-samples from various locations were studied. The first sample came from
a shrine in Bygland, the second from an altarpiece in Skjervøy and the last from a (now lost)
shrine in Røldal. A picture of the medieval objects is provided in the Appendix.
A micro-sample was taken with a scalpel from the edge of already damaged parts of the
paintings. The micro-samples were embedded in a resin and mounted in sample holders. Two
Raman instruments were used during this research. One instrument was a confocal Raman
16micro-spectrometer working in micro/single configuration. The laser yielded a second harmonic
generation light, which had a wavelength of 370nm. Furthermore, a second Raman
spectrometer with a 785 nm diode laser was adopted.
Figure 11: Raman spectra of the green layers, cross-sections of three various layers Excitation line is at 785nm.
Source [7].
This research mainly focused on the green pigments found in the investigated layers. An
umbrella term for these green copper-based pigments is Verdigris. These pigments show
Raman bands at 946, 1050, 1350, 1442, 1598, 2855 and 2935 cm −1, see Figure 11. These
bands were found in each sample. Table 4 shows an overview of the collected Raman bands,
the assigned formulas and attribution.
Table 4: Characteristic bands collected from the Raman spectra measuring the green paint-layers of sample A, B
and C. The strength of the peaks is assigned as follows: vs (very strong), s (strong), m (medium), w (weak), vw
(very weak). Source [7].
Sample A Sample B Sample C Assigned formula Attribution
(cm-1) (cm-1) (cm-1)
127vs 127vs 127vs ν(Pb-O) lattice mode Lead tin yellow
196m 196m 196m Not assigned
457w 457w 457w Not assigned
946vw 947vw 946w ν(Ch2/ρ(CH2) Copper acetate monohydrate /
Copper carboxylates
1050m 1050m 1050s ν(CH3)/CO32- Copper acetate monohydrate /
lead white?
1087w 1087w 1088w ν(CC) Copper oleates
1130w ν(CC) Copper acetates / lead
palmitates / stearates
1190w δ(CH2) Lead oleates
1298m 1298m 1298m δ(CH2) Copper oleates
1309m δ(CH3) Copper acetate monohydrate
1442m 1442m 1442m ν(COO-)/ δ(CH3) / Copper acetate monohydrate /
δ(CH2) copper oleates / lead oleates
171458sh Not assigned
1540m νas(COO ) -
Lead carboxylates
1568sh Not assigned
1598m 1599m 1598m ν(COO-) Copper acetate monohydrate /
Copper carboxylates
1653sh 1650sh ν(C=C)/ ν(C=CH2) / Copper oleates / basic copper
δ(OH) chloride
1740vw 1740vw 1740vw ν(C=O) Linseed oil
2720w ν(C-H) CH2 Not assigned
2811w Not assigned
2855sh 2856w 2855m ν(C-H) CH2 Copper acetate monohydrate
2935w 2934w 2935m ν(C-H) CH3 Not assigned
3525vw Basic copper acetates
3636vw Not assigned
The wings were analysed with complementary techniques including UV-VIS, SEM-EDX, ATR-
FTIR and GC-MS. This strategy was chosen to identify both binders and pigments in the
complex paint samples. The rationale for this approach will be further discussed in the critical
review below.
4.5 Critical review of Raman
Complete picture
Raman makes it possible to identify which painting technique the artist used. The colours,
material and painting technique used can provide more information about the time from which
the artwork comes. Other equipment is needed to complete the picture. For example, XRF
could be used to identify/verify the chemical composition of the pigments and mineralogical
phases present [1]. FTIR could also be used for the identification of the pigment origin
(preparation) or painting technique used [7].
Limitations
Raman spectroscopy is based on the interaction between photons and matter. This often
implies that a sample needs to be taken, which can be as small as a few microns. The main
advantage of Raman is that it is a non-destructive technique, thus the sample could be reused
for additional experiments. The main downside of spectroscopy is that it is based on a weak
process. Interference of fluorescence could mask the wanted peaks. Fluorescence is less of a
problem when measuring inorganic and synthetic dyes. Organic and natural dyes are
challenging. Since synthetic dyes were first made in the mid-19th century, conducting
experiments on objects before this time could be challenging [1].
Developments
Developments in the Raman field include new hardware (e.g. fibre optics), software
improvements (e.g. automated shifted baseline subtraction), new insights (e.g. micro-SORS)
and new approaches (e.g. SERS). Considering the remarkable signs of progress made over
the past years, new steps are set paving the way for more novel developments in this research
domain [14]. There are also developments in the field of non-invasive Raman spectroscopy.
Non-invasive Raman makes it possible to take measurements without taking samples, which
could be advantageous in art research.
185. Surface-Enhanced Raman Spectroscopy applied in art
conservation
As described above, fluorescence can be a limiting factor in paint and pigments research. A
technique such as Surface-Enhanced Raman Spectroscopy (SERS) could offer a solution
here. This chapter elaborates on SERS, SERRS and pointers for a substrate, and then an
application is discussed. At the end of this chapter, there is a critical review of the technique
concerning art research.
5.1 The technique
A development in Raman spectroscopy is Surface-Enhanced Raman Spectroscopy. SERS is
a technique based on a study carried out by Jeanmarie and Van Duyne in 1977 [24]. SERS
involves obtaining Raman spectra in the usual way on samples that are adsorbed on the
surface of colloidal metal particles (usually silver, gold, or copper) or roughened surfaces of
pieces of these metals, see Figure 12. Because Raman signals are relatively weak, applying
SERS is a way to amplify these weak Raman signals.
The total enhancement originates from two mechanisms. The electromagnetic (EM) effect and
the electrochemical (EC) effect. The EM enhancement relies on a local field interaction
between a metallic surface and a Localize Surface Plasmons (LSP) forming a strong
electromagnetic field [25]. This occurs when the substrate is excited by light and causes an
enormous increase in the size of the induced dipole. This consecutively causes a strong
increase in inelastic scattering [26]. The EM enhancement decreases rapidly with distance.
The EC enhancement is weaker and requires that the molecule is chemically adsorbed on the
surface. The interaction between the metallic surface reduces the change in polarizability. The
orientation of the molecule and distance to the surface influence the degree of enhancement.
Overall, the EM effect has a contribution up to 10 10 and the EC effect has a contribution up to
102.
Figure 12: Illustration of particles on a silver substrate. The occurring Raman scattering is enhanced. Source [27]
SERS sees application due to the high sensitivity and the possibility for very selective
molecular identification. The Raman lines of the adsorbed molecule are often enhanced by a
factor of 103 to 106. When surface enhancement is combined with resonance enhancement
technique, the net increase in signal intensity is roughly the product of the intensity produced
by each of the techniques. Consequently, detection limits in the range of 10-9 to 10-12 M have
been observed [17].
Art materials often show strong fluorescent backgrounds in de near-infrared (NIR) and visible
region. The metal substrates used in SERS act like quenchers for the occurring fluorescence.
Thus, identifications of analytes in art materials, such as pigments, is possible [28].
195.2 Surface Enhanced Resonance Raman Spectroscopy
Surface Enhanced Resonance Raman Spectroscopy (SERRS) combines surface
enhancement with molecular resonance enhancement as described in 4.3 Resonance Raman
Spectroscopy. Enhancement up to 1014 have been reported [22]. The adsorption of the
pigments on the metal substrates are efficient fluorescent quenchers. The higher enhancement
makes it possible to use a lower laser power and shorter accumulation time. Which reduces
the chance that photodegradation occurs.
5.3 Decision of substrates for SERS
The decision on which substrates to use for SERS measurements is important. The substrates
are responsible for the success of SERS, because of their interaction between the substrate
and the adsorbed molecules. The morphology of the surface is determinative, a smooth
surface results in no signal enhancement and a rough surface results in a good signal. Various
materials can be used, each with advantages and disadvantages in the search for an optimal
measurement result.
Figure 13: Estimate wavelength ranges (nm) of Ag, Au, and Cu substrates to measure SERS. Figure is
reproduced from [28].
Primarily, gold (Au) and silver (Ag) are used as SERS substrates, because these materials are
non-reactive with oxygen molecules. Copper (Cu) is subordinate due to its reactivity i.e.
instability in air. All three metals have localized surface plasmon resonances (LSPRs) that
cover most of the visible and NIR wavelength range, where most Raman measurements occur,
also making them convenient to use, see Figure 13. Further enhancement can be achieved
through research about different shapes and new plasmonic materials.
Other metals besides silver and gold have been explored. These include the alkali metals,
aluminium, gallium, indium, platinum, rhodium and metal alloys that have been applied as
plasmonic substrate options for SERS. The main problem of some of these materials is their
reactivity with air [28]. When substrates are developed that can overcome the reactivity with
air, new pathways for SERS substrates would be possible.
Recently, SERS substrates of new materials like graphene [29] and quantum dots [30] are
reported. These materials do not fit the traditional definition of SERS substrates and have not
yet been applied in research on colourants in art, but could be worthy of further investigation.
205.4 Applications for paint, pigments and other organic components
Winslow Homer’s ‘For to be a farmer’s boy’ [13]
Winslow Homer made the watercolour painting ‘For to Be a Farmer’s boy’ in 1887, see Figure
14. He was known for his colour choices that maximize the visual impact of the painting. Due
to photochemical degradation, some colours changed, which could lead the viewer to perceive
something different from the initial intention of the painting.
Figure 14: Winslow Homer watercolour painting ‘For to Be a Farmer’s boy’. The current condition (left), after digital
reconstruction (right). Source: [13].
The red box in the upper left corner was examined with a high magnification stereomicroscope,
see Figure 14. The pigment grains were visualized, see Figure 15 (b), and their colours were
documented. Between 5-15 pigment grains were taken from the sample region, (a) in Figure
15, with a tungsten needle. A colloid paste was applied to the grains. SERS spectrum was
taken from seven grains, three of these grains are highlighted in Figure 15 (b). A 632.8 nm He-
Ne laser was used.
Homer was known for using watercolour washes from Winsor and Newton (W&N). A catalogue
published in 1887 served as a source for making SERS reference spectra. Some of these
reference spectra turned out too complicated to use in this research. Only the spectra for Indian
purple, madder carmine, purple madder and burnt carmine were used. Brosseau et al.
observed that pH values influenced the interpretation of the spectra [13]. To eliminate this
variable, extra experiments at different pH values need to be performed.
Figure 15: (a) a close-up of the sample region. (b) picture obtained with the stereomicroscope. Pigment grains a, b and c are
highlighted. Source: [13].
Grain a has a red/purple colour as observed with the stereomicroscope. The spectra of pigment
grain a, cochineal, W&N burnt carmine and W&N Indian purple are shown in Figure 16. After
interpretation, Brosseau et al. concluded that pigment grain a was mostly likely Indian purple.
21Figure 16: SERS spectra of pigment grain a, Cochineal, W&N burnt carmine and W&N Indian purple. The asterisk indicate
bands due to citrate. Source: [13].
South Netherlandish tapestry [31]
Leona et al. studied a South Netherlandish tapestry form 1495-1505. The tapestry was mainly
made of wool and some silk, silver and gilt wefts. A single red wool fibre was used for the
measurements. The fibre was first treated with hydrogen fluoride vapour and then with
potassium nitrate and Ag colloid. A picture of the tapestry is provided in the Appendix.
Figure 17: The tapestry fibre sample, reflected dots are the Ag nanoparticles, the scale is 100 µm. Source: [31].
The laser beam was focused on the silver-covered spot to obtain the SERS spectra, see Figure
17. For the excitation wavelength, a 785 nm laser was adopted. An objective of 20x was used
on the sample.
22Figure 18: Obtained spectrum from the tapestry fibre sample (UNI) and a reference spectrum of alizarin (AZ).
Source: [31].
Figure 18 shows the obtained spectrum from the tapestry fibre sample (UNI) and a reference
spectrum of alizarin (AZ). There is a clear agreement between the sample and reference
spectra. Furthermore, Leona et al. mentioned that the unidentified peaks may be caused by
purpurin. At certain pH values, purpurin can be identified in the presence of alizarin. To confirm
or rule this out, more experiments with other pH values are needed. An overview of the
characteristic bands of alizarin and purpurin are given in Table 5
Table 5: Characteristic SERS bands of alizarin in a Raman spectrum measuring with a 785 nm excitation laser. The
strength of the peaks is assigned as follows: vs (very strong), s (strong), m (medium), w (weak), sh (shoulder).
Reproduced from: [31].
Dye source Structure SERS bands wavenumber/cm-1 (at 785
nm excitation)
Root of Madder 1628.0 m, 1603.2 m, 1553.5 m, 1508.5 w,
Rubia tinctorum L. 1479.0 w, 1458.9 m, 1451.1 m, 1424.7 s,
and other plants 1406.1 sh, 1323.8 s, 1288.2 s, 1275.7 sh,
1209.0 m, 1188.8 m, 1162.5 m, 1052.3 m,
1018.1 w, 903.3 w, 819.5 w, 763.6 w,
720.2 w, 684.5 w, 664.5 w, 663.3 m, 582.1
w, 506.04 m, 476.6 m, 451.7 m, 419.1 w,
399.0 m, 343.1 m, 312.1 w.
- 1606.3 m, 1558.2 m, 1505.4 sh, 1475.9 m,
1424.7 sh, 1389.0 s, 1320.8 vs 1297.5 vs
1288.2 vs 1266.4 sh, 1212.1 s, 1157.8 m,
1066.2 m, 1032.1 w, 976.2 m, 908.0 w,
650.4 m, 610.0 w, 537.8 s, 464.1 m, 428.4
m, 385.0 m, 340.0 w
235.5 Critical review of SERS
Scope
Adsorption of pigment molecules onto colloidal silver or gold is quite an efficient process. Once
the pigment is adsorbed onto the colloidal layer, the pigments may show a strong surface
enhancement of scattering. SERS has advantages over Raman, in particular, the limit of
detection (LOD) is much better. The peaks are easier to distinguish due to the enhanced
Raman signals and the fluorescence quenching effect of the noble-metal surface [13]. After
assigning the molecule, information about isomerization, orientation and degree of aggregation
could be obtained [32].
Limitations
Considering that SERS is a surface method, it is highly sensitive to matrix effects and
contaminations [33]. The vulnerability of the substrates and sample to get contaminated by
molecules in the air is constrictive. It could distort results and can make identification more
complicated. Besides, other random adsorbed molecules can broaden the measured Raman
signals. Hence, it can be difficult to distinguish between which Raman signals are from the
target molecule and which could be caused by contaminations [27].
Both Leona et al. and Brosseau et al. mention that pH values can influence the interpretation
of the spectra. It may be necessary to run experiments at different pH values to do a correct
interpretation [13, 31] Furthermore, SERS is an invasive method, thus application in art
research might be limited when sampling is restricted. When taking a sample is restricted,
Raman can be used instead.
246. Other Raman techniques applied in art conservation
6.1 Tip-Enhanced Raman Spectroscopy
Tip-Enhanced Raman Spectroscopy (TERS) uses the same underlying theory as SERS and
combines the surface analysis technique Atomic Force Microscopy (AFM) with the molecular
identification of Surface-Enhanced Raman, see Figure 19. The tip of the AFM probe is coated
with precious metal, such as gold, to enhance the induced dipole [34]. Measurements with the
probe are done directly on the surface of the sample. The probe is withdrawn from the surface
without leaving behind residue [35]. The probe is connected to a spectrometer to accumulate
the obtained data. The data is used to determine the chemical composition of the sample and
to form an image of the surface [34].
Figure 19: Schematic depiction of TERS. Source: [28].
In SERS spectroscopy, the obtained signal is accumulated from a group of molecules. With
TERS, single-molecule detection is possible. The spectra are obtained from the molecules that
are within a short distance (few angstroms to several nanometres) of the tip. This makes it
possible to tune the wavelength of the laser exactly to the corresponding frequency of the
plasmon [36]. A very small sample surfaces is sufficient.
Application
Various methods have been developed that can measure electromagnetic (long-range, several
nanometres) and chemical (short-range, few angstroms) enhancement regimes [36]. For
example, TERS was used to identify indigo and iron gall ink on dyes paper. Measurements on
both reference and historic sample were possible [35]. Another example is the application of
TERS to detect an ink, brilliant cresyl blue, on a glass [36]. An increase of more than thirty
times in Raman signal was visible when the top was in contact with the brilliant cresyl blue ink,
see Figure 20. Both these applications show a proof-of-concept. TERS could be applied for
the identification of colourants (such as brilliant cresyl blue, indigo and iron gall) in cultural
heritage.
25Figure 20: TERS spectra of brilliant cresyl blue. The Raman spectra were measured with (a) the tip retracted and
(b) the tip in contact with the sample surface. Source [36].
6.2 Alternative Raman Spectroscopy techniques
Micro-Raman spectroscopy [37]
Micro-Raman spectroscopy is a technique that uses a microscope lens. This allows analysis
of samples as small as one micrometre in diameter. Which is an advantage over Raman
spectroscopy when measuring inhomogeneous samples. The smaller measurement area
limits the amount of possible measured molecules. An example of an application is the analysis
of pigment sample from an artist’s paintbox. The pigment samples were powdered. Figure 21
shows the spectrum that was used for the interpretation of white-2 pigment, zinc oxide.
Figure 21: Spectrum of the powered white-2 pigment from the paintbox, produced by a micro-Raman setup. Source: [37].
Micrometre-scale spatially offset Raman spectroscopy
Micrometre-scale spatially offset Raman spectroscopy (micro-SORS) is a technique that can
determine the chemical composition of several layers below the surface. The principle is based
on measuring the Raman signal from a point that is displaced from the point of excitation. This
26is done on the sample surface or further down on the z-axis of illumination. Then it is possible
to separate the spectral contributions of the different layers [38].
Figure 22: (a) sample of the red mantle of the terracotta sculptures 'Christ's disciples', white square indicates the analyzed
area. (b) close-up image and stratigraphy. Source: [39].
Conti et al. applied this technique to a sample of the terracotta sculptures ‘Christ’s disciples’
[39]. This sculpture has been repainted many times, resulting in many overlapping layers of
red pigments, see Figure 22. The Raman spectra in Figure 23 show that the composition of
the pigment changes depending on the depth of the measurement. The uppermost late is
mainly red lead, deeper layers reveal peaks of lead white and cinnabar.
Figure 23: Spectra for various distances. The lined markers emphasize the change of pigment composition. The red lead and
cinnabar reference spectra were obtained with conventional Raman spectroscopy. Source: [39].
Ultraviolet-surface enhanced Raman spectroscopy [28]
Ultraviolet-surface enhanced Raman spectroscopy (UV-SERS) is an application that could be
desirable for art applications. Measuring in the ultraviolet range enables resonance detection
of a multitude of molecules. These molecules include protein residues.
UV-SERS comes with a few challenges. The first is finding a substrate material that supports
the surface enhancement in the UV-region. Materials including Aluminium, Cobalt,
Lead/Platinum, Rhodium, Ruthenium were explored. Enhancement factors of these materials
only reach ~102, which is low compared to Ag and Au in the visible region.
The other challenges would be avoiding photodegradation and the need for highly efficient
optical elements. UV-SERS could potentially broaden the scope of SERS if these challenges
are overcome.
277. Conclusions
This literature review showed the value of Raman spectroscopy techniques in the analysis of
pigments and some of its degradation products in works of art. Raman can identify the
chemical composition of different coloured pigments in complex samples. Additionally, Raman
makes it possible to identify which painting technique is used [1]. The colours, material and
painting technique used can give an indication about the time from which the art object comes,
whether it is authentic, and it can help with conservation and if necessary, restoration [1].
The application of Raman has been further developed over the years, including additions such
as the CCD detector, new fibre optics, and increasing knowledge about signal treatment and
statistical data analytics [14, 19]. Both organic and inorganic components can be identified and
quantified. These components can be labelled using reference spectra in databases, but these
databases are mostly limited to references from pure components. The number of reference
spectra of degradation products is growing but currently very minimal [1].
SERS is a powerful technique to measure components at low concentrations. It can provide
rich structural information because of the high sensitivity of the technique. The SERS
enhancement depends on the substrate preparation and varies across the sample due to
inhomogeneity. This is a limit to its applicability and possibility of quantitative measurements.
Techniques such as TERS can overcome these shortcomings with single-molecule
measurements by replacing the substrates with a probe [36]. There are currently developments
in the field of Raman spectroscopy such as micro-Raman [37], micro-SORS [39] and UV-SERS
[28].
Combinations of multiple analytical techniques are necessary to obtain a complete picture. A
SERS or Raman spectrum can only detect so much. Various techniques have been applied
for the aforementioned intend, such as XRF and SEM-EDX for elemental analysis, micro-
Raman spectroscopy for identification and IR spectroscopy for characterization [7]. MS-based
techniques are used for the identification of proteinaceous binders, necessary because of the
complexity of the samples [11].
Techniques that could be used for research on colour changes and ageing processes
include infrared spectroscopy Fourier-transformed (FTIR) in the attenuated total reflection
(ATR) mode, UV–Vis spectroscopy, gloss and colourimetric measurements. Multivariate data
analysis (MVDA) could be applied to a combination of Raman data with other techniques. This
could provide insight into the most complex samples [11].
7.1 Recommendation for further research
Future experiments could involve artificial weathering of paint reconstructions to, for example,
understand the mechanisms of delamination [7] and the further development/expansion of
databases. The spectra in these databases could be used as reference spectra of components
and degradation products used in art [1]. Furthermore, this research could be extended to
include experiments with non-invasive Raman options, such as portable/handheld Raman to
research on location [40, 41]. It may be interesting to investigate the new developments in
SERS substrates [29] and the combination of analysis techniques using MVDA.
28Literature
[1] S. Lin, “Investigation into the Use of Surface-Enhanced Raman Spectroscopy (SERS) for
Organic Dye Analysis,” Department of Materials Science and Engineering, Massachusetts
Institute of Technology, 2015.
[2] Research project REVIGO, “Original colours of Van Gogh's paintings,” [Online]. Available:
https://www.vangoghmuseum.nl/en/about/knowledge-and-research/completed-research-
projects/revigo/research-results-revigo-paintings. [Accessed 02 December 2020].
[3] V. Bozhulich, “The Chemistry of Pigments and How Scientists Prevent Color Degradation,”
InChemistry, 23 June 2020. [Online]. Available:
https://inchemistry.acs.org/content/inchemistry/en/atomic-news/chemistry-of-pigments.html.
[Accessed 3 December 2020].
[4] H. Ravikumar, S. S. Rao and C. Karigar, “Biodegradation of paints: a current status,” Indian
Journal of Science and Technology, vol. 5, no. 1, pp. 1977-1987, 2012.
[5] R.-M. Ion, A. Nuta, A.-A. Sorescu and L. Iancu, “Photochemical Degradation Processes of
Painting Materials from Cultural Heritage,” in Photochemistry and Photophysics - Fundamentals
to Applications, IntechOpen, 2018, pp. 161-178.
[6] K. Keune, R. P. Kramer, Z. Huijbregts, H. L. Schellen, M. H. Stappers and M. H. van Eikema
Hommes, “Pigment Degradation in Oil Paint Induced by Indoor Climate: Comparison of Visua
and Computational Backscattered Electron Images,” Microscopy and Microanalysis, vol. 22, pp.
448-457, 2016.
[7] E. Platania, N. L. Streeton, A. Lluveras-Tenorio, A. Vila, D. Buti, F. Caruso, H. Kutzkee, A.
Karlsson, M. P. Colombini and E. Uggerud, “Identification of green pigments and binders in late
medieval painted wings from Norwegian churches,” Microchemical Journal, no. 156, 2020.
[8] S. Sunder Sharma, K. Sharma, R. Singh, S. Srivastava, K. Bihari Rana and R. Singhal, “Natrual
pigments: Origin and applications in dye sensitized solar cells,” Materialstoday: Proceedings, no.
2019, pp. 1-5, 2020.
[9] H. Bhajan Singh and K. Avinash Bharati, “Introduction,” in Handbook of Natural Dyes and
Pigments, Woodhead Publishing India, 2014, pp. 1-3.
[10] B. van Driel, K. van den Berg, M. Smout, N. Dekker, P. Kooyman and J. Dik, “Investigating the
effect of artists’ paint formulation on degradation rates of TiO2-based oil paints,” Heritage
Science, vol. 21, no. 6, 2018.
[11] C. Calvano, E. Rigante, R. Picca, T. Cataldi and L. Sabbatini, “An easily transferable protocol for
in-situ quasi-non-invasive analysis of protein binders in works of art,” Talanta, no. 215, p.
120882, 2020.
[12] F. Casadio, M. Leona, J. R. Lombardi and R. Van Duyne, “Identification of Organic Colorants in
Fibers, Paints, and Glazes by Surface Enhanced Raman Spectroscopy,” Accounts of Chemical
Research, vol. 43, no. 6, pp. 782-791, 2010.
[13] C. L. Brosseau, F. Casadio and R. P. Van Duyne, “Revealing the invisible: using surface-
enhanced Raman spectroscopy to identify minute remnants of color in Winslow Homer's
colorless skies,” Journal of Raman Spectroscopy, no. 42, pp. 1305-1310, 2011.
[14] D. Bersani, C. Conti, P. Matousek, F. Pozzi and P. Vandenabeele, “Methodological evolutions of
Raman spectroscopy in art and archaeology,” Analytical Methods, no. 8, pp. 8395-8409, 2016.
29You can also read