Cultural and Creative Sectors - Introduction - Bogota - May 8th, 2019 - Deloitte
←
→
Page content transcription
If your browser does not render page correctly, please read the page content below
Cultural and Creative Sectors
Introduction – Bogota – May 8th, 2019
The Global Art Market is in the midst of a significant transformation, creating new
opportunities
                                                                                                         Arttrends                       Finance trends

                                                                                        Globalization&                                                 Expanding class ofultra-high- net-worth (UHNWI)
                                                                                       democratization                                                 buyers

                                                                          Transparency,                                                                                         Financialization:
                                                                             regulation,                                                                                        art as a capitalasset
                                                                        professionalism

                                                                                                                                    Art &
                                              Art       &        technology,                                                       Finance                                                 Art secured
                                                    digitization          &                                                                                                                lending
                                                    virtualization

                                                                                                                                                                                   Tax and
                                                     New economicreality for public
                                                                                                                                                                                   estate assistance
                                                  cultural institutions, softpowerof
                                             culture, economic driver, world cultural
                                                        heritage, cultural district, etc

                                                                                            New business models& sales channels,             Risk management, collection management
                                                                                               creative sectors, culturalcitizenship         and asset allocation

                   Source : Deloitte Luxembourg - Art & Finance Report
                   2017
                                                                                                                                                                                                         2
Introduction – Bogota – May 8th, 2019
Art & Finance is uniquely positioned at the intersection of three interconnected sectors

                                                                                                                                                  Culture
                              Finance                                                                                                             • Large public museums
                              • Private bankers                                                                                                   • Private museums
                              • Wealth managers
                                                                                                                                                  • Corporate collectors
                              • Family offices                                                                                                    • Private collectors
                                                                                                          Art &
                              • Private investors/collectors                                             Finance                                  • Public authorities (country,
                              • Art/collectible fund promoters                                                                                      region, city, etc )

                              • Art insurance companies                                                                                           • Etc.

                              • Art trading companies

                              • Etc.

                                                                 Business

                                                                 • Companies selling art                    • Art & media companies
                                                                 • Digital art companies                    • ArtTech companies
                                                                 • Art logistics companies                  • Creative industries
                                                                 • Art fairs                                • Etc.

                                                                                       Source : Deloitte Luxembourg - Art & Finance Report 2017
                                                                                                                                                                                   3
Introduction – Bogota – May 8th, 2019
Global UHNWI Art & collectibles Wealth 2016 to 2026 Estimates
US$ 1.622 billion in 2016 to US$2.706 billion in 2026

                          Source: Deloitte Luxembourg &
                          ArtTactic Art & Finance Report 2017

                                                                4
Introduction – Bogota – May 8th, 2019
The Deloitte Art & Finance involves today more than 24 countries in 6 continents

                                   Deloitte Luxembourg   Deloitte UK   Deloitte Belgium   Deloitte Holland        Deloitte         Deloitte Poland
                                                                                                                  Germany

                                                                                                                                                            Deloitte Austria
                   Deloitte Canada

                                                                                                                                                            Deloitte Hungary

                   Deloitte USA
                                                                                                                                                            Deloitte Italy

                   Deloitte Colombia
                                                                                                                                                            Deloitte Monaco

                                                                                                                                                            Deloitte Japan

                   Deloitte Spain                                                                                                                           Deloitte China

                   Deloitte Switzerland

                   Deloitte France

                   Deloitte Portugal

                                                                                 Deloitte Nigeria    Deloitte Israel   Deloitte United Deloitte Singapore      Deloitte
                                                                                                                       Arab Emirates                         New Zealand
                                                                                                                                                                               5
Introduction – Bogota – May 8th, 2019
Technological trends : Six forces that are practically shaping everything

                                         Automation    Game Changing
                                                       Technology

                                        Experience
                                                         Cyber Security
                                        Innovation

                                        Connectivity   Real-time
                                                       Data
                                                       Intelligence

                                                                            Public   66
Introduction – Bogota – May 8th, 2019
Case study : Art & Technology – Six keys facets – ARTTECHS

                                                           Analytics

                                                         Big Data: Better
            Chart title runs here                       data and analytics
                                        Digitization    shifts the balance       Security
                                                             of power
                                   New technology                             Transparency,
                                     brings new                                traceability,
                                    mediums for                              copyrights, KYC-
                                       artists                                     AML
                                                             Art +

                                        Experience
                                                          Technology
                                                                               Geography
                                                                                                   Blockchain
                                    Technology is
                                  making it easier to
                                                                             Reach: technology
                                                                              connects artists
                                                                                                   Use Cases
                                                                                                   August 2016
                                  access and enjoy
                                         art
                                                              Social

                                                           Social media
                                                                             and diffuses art on
                                                                               a global scale      ArtTracktive
                                                                                                   https://www.youtube.com/watch?v=u5SBhWgEE80

                                                        influences art and
                                                         promotes artists
                                                              Social               https://www.youtube.com/watch?v=u5SBhWgEE80
                                                           communities

                                                                                                                                                 7
Introduction – Bogota – May 8th, 2019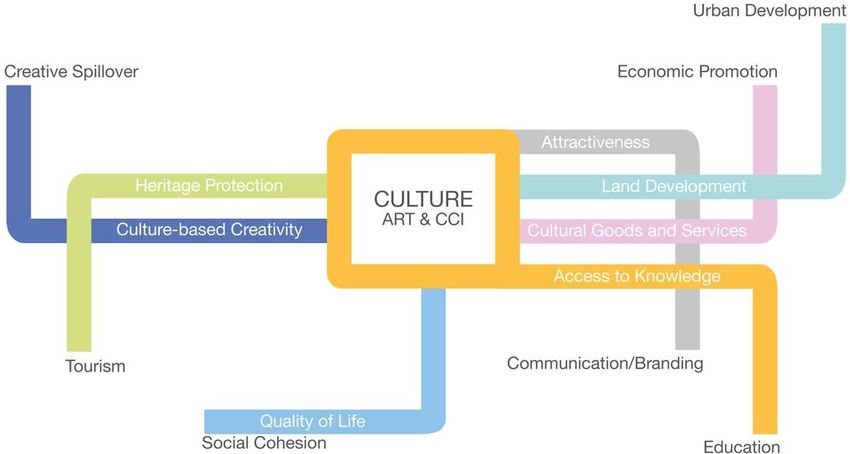
Digital Technology has changed the field of art, in its production, distribution and
reception

    •     Digital art has expanded to include browser-based     The Mori Building Digital Art Museum
          art, light art, generative or 3D video, interactive   https://borderless.teamlab.art/
          works or those using virtual reality

    •     Do we have a market for it ? Is-it on the radar of
          the elites ?

    •     Video Art : Bill Viola
          https://www.bing.com/videos/search?q=digital+art
          works+bill+viola+&&view=detail&mid=05986F279
          B87CDA9A7AB05986F279B87CDA9A7AB&&FORM=
          VRDGAR

                                                                                                       8
Introduction – Bogota – May 8th, 2019
Louvre Abu Dhabi : the world’s first and only radio guided highway art gallery

                                                                                 9
Introduction – Bogota – May 8th, 2019
Louvre Paris - Song APESHIT; Artist THE CARTERS

Visitor trails JAY-Z and Beyoncé at the Louvre

Thematic trail - Length: 1h30 - Tour days: Wednesday Thursday Saturday Sunday

Source Youtube

                                                                                10
 Introduction – Bogota – May 8th, 2019
Cultural infrastructure in 2017
11
Introduction – Bogota – May 8th, 2019
Source : The Global Cultural Districts NetworkCase study : The Luxembourg Freeport will contribute to the development of the creative
economy in Luxembourg Art cluster
Art experts
Galleries
Finance cluster
Islamic
(U)HNWIs Art fairs The Luxembourg Freeport will
finance
storage Perishable Fund have a positive impact on the
Auction services goods Logistic cluster custody financial, logistic, ICT &
houses logistic cultural sectors in
services
Luxembourg and will enhance
Luxembourg creative
Wealth
Electronic Security cluster economy:
transfer
and physical Hallmarking • Cultural assets
data storage of jewellery
High tech • Valuable tangible assets
logistic
• Data centers for digital
Listing & assets (music, film,
Art
trading of ETFs artworks, e-books, etc)
financing
on Lux S/E
Fine Art • Attract online companies in
logistic the art space
Mounting • New art businesses to
and framing Luxembourg
Cash • New financial products and
Art
processing for services
advisory
services foreign Credit card • New financial players
currency personalised
centre Insurance • New logistic services
cies • Etc
Art stock Pharmacy
Museums logistic Pick and pack
Restoration • The storage facility should
exchange be viewed as the first piece
jewellery for
distribution of a multi-dimension puzzle
Artists Central Research
depository /laboratories
12
Introduction – Bogota – May 8th, 2019Long term trends: Development strategies must cope with the far-reaching cultural and
technological shifts under way in our society
Creativity
Support the ability to
Globalisation create and circulate
Culture intellectual capital and
Increased generate:
interaction • economic growth,
between • employment,
• trade,
Connectivity Economy • Innovation
• social cohesion
• cultural diversity
• human development
Technology
Source: UNCTAD, Creative Economy report 2008
13
Introduction – Bogota – May 8th, 2019Long term trends : new markets emerge to meet the new needs generated by the
economic expansion
Maslow pyramid Creative economy drivers Supply side
Demand for manual labor
Need for self- The underlying is down young people are
fulfillment : cause of looking to the creative
knowledge and expansion in both sectors which offer an
beauty (aesthetics) the supply and the attractive lifestyle and
demand curves is above-average economic
People whose the increase : rewards
materials needs are • in the numbers of
largely satisfied and college-educated
who have a high people and their
level of disposable desire to make Demand side
income remix their and buy creative
ambitions and put products. Most rich countries spend
a premium on • in internet reach more on culture and
matters of the and the power of recreation than on foods
mind search-and-share or clothing
Digital technologies have created new opportunities for content, a new universe of
online networks, user-generated content and interactive media, hungry for
information, images and stories
Introduction – Bogota – May 8th, 2019 Source: John Howkins, «The creative economy, how people make money from ideas» Penguin business 2013 14The term creative industries group the following sectors:
Other dimensions : Regional – National / Private – Public / Companies – Private individuals
Art & Culture $ 485 bn Design $ 365 bn
1. Art 1. Architecture
2. Books 2. Design
3. Crafts 3. Fashion
4. Film 4. Toys/Games
5. Music
6. Performance
7. Video games Creative sector
$3.6 trillion in 2012
5% of Worldwide GDP
From $2.3 trillion in
Media $ 792 bn 2002 Innovation $ 2,021 bn
1. Ad agencies 1. R&D
2. Magazines 2. Software
3. Newspapers 3. Dotcoms
4. Radio
5. TV
Source: John Howkins, «The creative economy, how people make money from ideas» Penguin business 2013
15
Introduction – Bogota – May 8th, 2019Creative economy in numbers and by core markets
2012 $ billions America Europe* Britain China Global
Art & Culture 485
Art 18 21 13 14 56
Books 37 48 6 13 135
Crafts 6 6 1 8 42
Film 33 25 6 3 90
Music 15 19 4 ** 49
Performance 18 18 4 4 52
Video games 15 18 4 8 61
Design 365
Architecture 26 15 3 24 95
Design 41 39 8 25 165
Fashion 8 15 4 7 45
Toys/Games 21 17 4 9 60
Media 792
Ad agencies 24 20 7 3 58
Magazines 50 29 5 5 98
Newspapers 32 52 9 18 164
Radio 18 15 2 2 47
TV 145 105 18 22 425
Innovation 2,021
R&D 419 310 42 197 1,469
Software 137 78 31 35 310
Dotcoms n/a n/a n/a n/a 242
Total 1,043 850 171 397 3,663
Source: John Howkins, «The creative economy, how
* The figures for Europe include Britain
people make money from ideas» Penguin business
** Under $0.5 billion 2013
16
Introduction – Bogota – May 8th, 2019UNESCO Approach : The Creative Industry Sectors – 11 sectors
Description
The Creative Industry Sector (CIS) can be described as the aggregation of the following 11 sub-sectors :
Books Fine arts & Music Publishing
Design
Television Advertising Movies Performing Arts
Radio Architecture Videogames/
Softwares
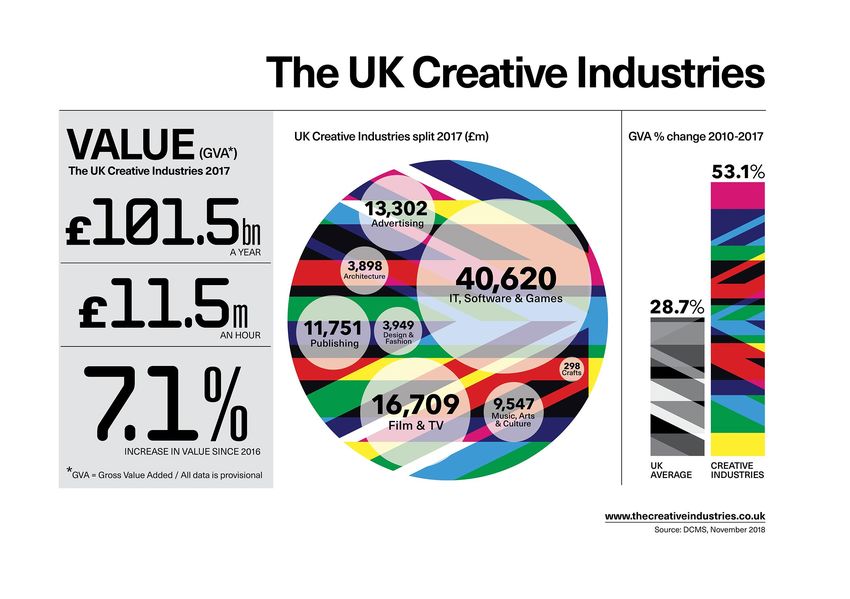
US$ 2,250b of revenues & 29,5% million jobs worldwide, 1% of the world’s active population – CCI revenues worldwide exceed
those of telecom services (US$ 1,570 b globally)
The biggest geographic areas contributing to the revenue are (b: Top three revenue :
billion) : • Television: $477b
• Asia/Pacific: $743b • Visual art and design: $391b
• Europe: $709b • Newspaper and magazine: $354b
• North America: $620b
• Latin America/Caribbean: $124b Top three employers :
• Africa/Middle East: $58b • Visual art and design : 6.73 m
• Books: 3,67 m
• Music: 3.98 m
17
Introduction – Bogota – May 8th, 2019Market Analysis of the Cultural and Creative Sectors in Europe (CCS)
Cultural Activities Creative Industries
Correspond to “those activities, whether ending in themselves or contributing to the Correspond to “those industries that use culture as an input and have
production of cultural goods and services, which embody or convey cultural a cultural dimension, although their outputs are mainly functional.
expressions, irrespective of the commercial value they may have” (UNESCO) They include architecture and design, which integrate creative
AND/OR “industries producing and distributing goods or services that, at the time elements into wider processes, as well as sub-sectors such as graphic
they are developed, are considered to have a specific attribute, use or purpose that design, fashion design, or advertising” (EC 183/2010)
embodies or conveys cultural expressions, irrespective of the commercial value they
may have. Besides the traditional arts sectors, they include film, DVD and video,
television and radio, video games, new media, music, books and press (EC
183/2010)
Cultural and Creative Sectors
CCS means all cultural and creative sectors whose activities are based on cultural values and/or artistic and other creative expressions, whether
those activities are market- or non-market-oriented, whatever the type of structure that carries them out, and irrespective of how that structure is financed.
Those activities include the development, the creation, the production, the dissemination and the preservation of goods and services which embody cultural, artistic
or other creative expressions, as well as related functions such as education or management. The cultural and creative sectors include inter alia architecture,
archives, libraries and museums, artistic crafts, audio-visual (including film, television, video games and multimedia), tangible and intangible cultural heritage,
design, festivals, music, literature, performing arts, publishing, radio and visual arts (EIF)
Other cultural and
Heritage, Archives Audio Visual & Education &
Books and Press Visual Arts Architecture Performing Arts creative sectors
and Libraries Multi media Memberships
activities
Library and Books’, Artistic creation Architectural Operation of Production, Tertiary Wholesale of
archives newspapers’ and Photographic activities arts facilities recording and education musical
activities journals’ activities (advisory, Performing arts distribution of Cultural instruments
Museums publishing Specialised technical and its support motion picture, education Retail activities of
activities activities and design activities consultancy, activities video and music Activities of auctioning houses
Operation of retail sales in design and Radio and TV professional Renting of
historical sites specialised planning) broadcasting membership jewellery, musical
and buildings stores Publishing of organisations instruments,
computer/video Activities of scenery and
games other costumes
membership Repair of books,
organisations musical
instruments
18
Introduction – Bogota – May 8th, 2019The European CCS are renowned on a global scale and rank among the top performers
Key observations about the European CCS:
European CCS companies count among the leading world brands e.g. Universal,
Bertelsmann, Pearson, LVMH, Gucci, Sotheby's, Rovio, Pathé, Nordisk, Spotify, KING,
Supercell and many more
European CCS activities achieve a significant market share: TV programme,
Animation, Film, Music, Publishing, Art market, Fashion (international and local market)
Europe hosts a thriving, agile and highly creative independent sector e.g. film,
music, publishing, games
Europe is renowned for excellence in Arts management and Live Events e.g.
Museums/Festivals/Events
European festivals and international trade fairs are amongst the largest in the world e.g.
Frankfurt Book Fair, Cologne “Gamescom”, “Sonar” Barcelona, Cannes
(Midem/MIPTV/Film Market), “Art” Basel, Salone Mobile/ Milano, Sziget
European Art and Design schools rank among the best in the world e.g. Royal
College of Art (UK), Aalto (FI), Politecnico di Milano (IT)
Europe is home to a great number of heritage and gastronomic sites/tourism sites
(most visited sites) – 50% of UNESCO sites
19
Introduction – Bogota – May 8th, 2019The CCS represents a key market for the EU in terms of size, employment and value
added
CCS Share of employment
out of total employment* Key Observations
≥4.0% In 2016:
3.0 – 4.0% The CCS represents more than 6.7 million
2.0 – 3.0% employees in the EU
1.0 – 2.0% The CCS accounts for 2.45 million
companies
Total value added amounts to EUR 290
billion
CCS employment represents:
≥ 4.0 % of total employment in 1
country
3.0 – 4.0% of total employment in 11
countries
2.0 – 3.0% of total employment in 13
countries
1.0 – 2.0% of total employment in 3
countries
*Source Eurostat, data for 2015
20
Introduction – Bogota – May 8th, 2019The CCS’ economic weight is comparable to that of ICT and the accommodation and
food services sectors
Accommodation and food
Criteria ICT CCS
services
Percentage of EU GDP (2015) 4%(2015) 4%(2015) 4.2%(2014)
Value added EUR 570 billion(2015) EUR 252.9 billion(2015) EUR 290 billion(2016)
Employment 6.3 million(2015) 11.1 million(2015) 6.7 million(2016)
Number of companies 1.1 million(2015) 1.9 million(2015) 2.45 million(2016)
Average company size 5.73 employees per company(2015) 5.84 employees per company(2015) 2.7 employees per company(2016)
(Employment /Number of
companies)
Key Observations
CCS’ contribution to GDP is similar to the sectors of ICT and Accommodation and food services
CCS generates a higher level of value added than the Accommodation and food services sector
The number of companies in CCS exceeds those in ICT and Accommodation and food services
21
Introduction – Bogota – May 8th, 2019The CCS experienced overall positive growth in terms of the number of companies in
most EU countries
Evolution of CCS companies per country and growth rate between 2008-2016
0.4 60%
Number of companies (Millions)
CAGR between 2008-2016
0.35 50%
0.3 40%
0.25 30%
0.2 20%
0.15 10%
0.1 0%
0.05 -10%
0 -20%
Countries
2008 2012 2016 CAGR 2008-2016
Key Observations
Overall, the number of CCS companies has steadily increased over the period 2008-2016 with a CAGR of 4%
In the EU, 22 countries experienced growth in the CCS between 2008 and 2016. Only 6 countries* saw a decrease
in the number of CCS companies
Regarding CAGR, the Netherlands, Slovakia, Lithuania and Estonia are the top performing countries (over 10%
growth)**
In 2016, the countries counting the most CCS companies were Italy (355,836), France (324,579), Germany
(267,118), Spain (244,762), the United Kingdom (239,062) and the Netherlands (221,031)
Source: Eurostat (figures based on NACE codes shown in Appendix) reference period leading to an overestimation. The same applies to France where the total number of
Introduction – Bogota – May 8th, 2019 *The 6 countries that saw a decrease in CCS companies over the period 2008-2016 are: Italy, Greece, CCS companies in 2008 is underestimated due to unavailability of data in that year for several sub- 22
Malta, Austria, Poland and Portugal sectors.
** Please note that the high CAGR for Czechia is due the unavailability of data at the start of theCCS companies play an important role in the majority of European economies as
their share out of total service companies reaches at least 10% in most countries
Share of CCS companies out of total services companies in 2016
3.5 25%
Number of companies (Millions) 3
Share of CCS companies
20%
2.5
2 15%
1.5 10%
1
5%
0.5
0 0%
Countries
CCS Total Services
Key Observations
The Netherlands, Hungary, Lithuania and Slovenia are amongst the countries with the highest share of
CCS companies in their economies
On average the share of CCS companies out of all companies (i.e. total services) across the EU28
exceeds 10% making it an important contributor to local economies
Source: Eurostat (figures based on NACE codes shown in Appendix)
23
Introduction – Bogota – May 8th, 2019All CCS sub-sectors have seen an increase in the number of companies in past years
Distribution of companies by CCS sub-sector in 2016
15,249 179,812
786,077
299,918
2,450,237 582,496
372,465
214,220
Total number of Heritage, Audio-visual & Performing arts Architecture Visual Arts Books & Press Other cultural
companies in Archives & Multimedia and creative
CAGR CCS Libraries sectors activities
2008-
2016 +4% +4% +6% +6% +1% +6% +1% +3%
Key Observations Visual Arts
Books & Press
In the EU28 the number of companies has grown Architecture
by 4% (CAGR) in the period 2008-2016 across all Sub-sectors with the strongest growth rates:
sub-sectors
Audio-visual & Multimedia
In 2016, the largest sub-sectors in terms of Performing arts
number of companies are: Visual Arts
Performing Arts
Source: Eurostat (figures based on NACE codes shown in Appendix)
24
Introduction – Bogota – May 8th, 2019Overall, employment in CCS has grown since 2008 with some sub-sectors seeing
significant growth rates
Distribution of persons employed by CCS sub-sector in 2016
160,862 754,099
1,611,426
603,538
1,271,468
6,728,985
1,507,896
819,696
Total persons Heritage, Audio-visual & Performing arts Architecture Visual Arts Books & Press Other cultural
employed in CCS Archives & Multimedia and creative
CAGR Libraries sectors activities
2008-
+1% +3% +3% +2% +1% +3% -3% +4%
2016
Key Observations The sub-sectors Other cultural and creative
sectors activities, Audio-visual & Multimedia,
Total employment in CCS amounts to more than Visual arts and Heritage, Archives & Libraries
6.7 million in 2016. It has remained stable over have seen the highest CAGR over the reference
the period 2008-2016 with a CAGR of 1% period
The sub-sectors with the highest number of The sub-sector Books & press has seen a decline
persons employed are Books & Press, Performing in the number of persons employed over the
arts, Visual arts and Audio-visual & Multimedia reference period
Introduction – Bogota – May 8th, 2019 Source: Eurostat (figures based on NACE codes shown in Appendix) 25Value added in the CCS has seen constant growth in past years reaching EUR 290
billion in 2016
Value added at factor cost 2016 (million Key Observations
EUR)
In 2016, total gross value added at factor cost
Average (accross all sub-sectors) 41,747 € amounts to EUR 290.2 billion. The average gross
value added across CCS sub-sectors amounts to 41.7
Other cultural and creative sectors billion Euro
36,565 €
activities
Over the reference period (2008-2106) the gross
Audio-visual & Multimedia 63,507 € value added has consistently grown with a CAGR of
more than 2%
Performing arts 47,629 € Out of the 6 CCS sub-sectors for which data on gross
value added was available, 5 have seen an increase in
Architecture 25,674 €
the gross value added over the reference period. The
only sector that has experienced a moderate decline
in gross value added is Books & Press
Visual Arts 40,597 €
The sub-sectors Books & Press and Audio-visual &
Multimedia achieve the highest gross value added.
Books & Press 76,242 €
Furthermore Audio-visual & Multimedia achieves the
highest compound average growth rate over the
0 € 20,000 €
40,000 €
60,000 €
80,000 100,000
€ €
reference period in gross value added
Value added at factor cost
26
Introduction – Bogota – May 8th, 2019Value added in the audio-visual and multimedia sub-sector has seen tremendous
growth over the past years
Distribution of value added in the AVM** sub-sector in 2016 (Million EUR)
22,328
2,780
4,447 29,512
63,507
2,165
221 601 696 757
Total Television Radio Sound Motion Publishing of Retail sale of Repair of Manufacture Reproduction
programming broadcasting recording and picture, video computer music and other of musical of recorded
and music and television games video equipment instruments media
broadcasting publishing programme recordings in
activities activities activities* specialised
CAGR stores
2008-
2016 +5% +2% - 5% +10% +10% +26% -10% +10% +2% -10%
Key Observations
In 2016, nearly half of the gross value added in the AVM sub-sector is generated by Motion picture, video
and television programme activities
Activities related to Television programming and broadcasting activities, Sound recording and music
publishing as well as Publishing of computer games contribute more than 40% to total gross value added
While overall gross value added has seen a constant growth with a CAGR of more than 5%, Publishing of
computer games has seen the strongest growth in the reference period amounting to over 26% (CAGR)
27
Introduction – Bogota – May 8th, 2019 Introduction – Bogota – May 8th, 2019The surplus in the EU trade balance for cultural goods indicates an increased
demand for EU cultural goods
Key Observations
Cultural goods are the products of artistic
Exports: 10,535 creativity that convey artistic, symbolic
and aesthetic values; examples are
antiques, works of art, books,
Imports: 12,603
newspapers, photos, films and music
Balance in 2008 The EU’s cultural goods trade balance
-2,068 switched from a trade deficit of EUR 2.068
million in 2008 to a trade surplus of EUR
1.857 million indicating an increased
demand for EU cultural goods
This change can be explained by an
increase in exports (+3,2%) and a
decrease in imports (-2.4%)
Imports: 10,868
The main contributors to the surplus in
the balance of trade for cultural goods are
Exports: 12,725 works of art and books
Balance in 2016 Cultural goods make up 0.65% of the
1,857
total EU imports in 2014
Cultural goods accounted for a 0.75% of
In EUR million total EU exports
Introduction – Bogota – May 8th, 2019 Source: European Commission 28Survival rates of companies in most CCS sub-sectors outperform the benchmark of
service enterprises in the EU
Survival rates of CCS companies after 1, 3 and 5 years Survival rates of CCS companies after 1, 3 and 5
compared to a benchmark of all services enterprises compared to other industries
90 Retail sale of cultural and recreation
goods in specialised stores 90
80 B&P
80
Survival rate after 1,3 and 5 years (%)
70
Survival rate after 1,3 and 5 years (%)
Motion picture, video and television 70 CCS
programme production, sound
60 recording and music publishing activities
Programming and broadcasting activities 60
50
Architectural activities 50 Accomodation
40 and food
Specialised design activities 40
30
Photographic activities
30 Information and
20 Communication
20
10 Perfoming arts Technologies
10
0 Libraries, archives, museums and other
cultural activities
1 Year 3 Years 5 Years 0
Renting and leasing of other personal
and household goods
1 Year 3 Years 5 Years
Key Observations Key Observations
Survival rates* for service enterprises** across the EU were: In the EU, CCS SMEs have similar survival
83% after 1 year rates after 1 and 5 years as companies in the
59% after 3 years ICT sector
45% after 5 years After 3 years, CCS companies still have a
The CCS sub-sectors with the highest survival rates after 5 higher survival rate than the
years are Architectural activities and Motion picture, video accommodation/food sector
and television programme production, sound recording and
music publishing activities
* Survival rates are calculated based on an unweighted average across EU28 countries *** Motion picture: Motion picture, video and television programme production, sound recording 29
Introduction – Bogota – May 8th, 2019
** “Service enterprise”: services of the business economy except activities of holding companies and music publishing activitiesApart from financial and risk considerations, CCS investment decisions should also
take into consideration the social impact of CCS projects
1 CCS is important for young employment, inclusion and entrepreneurship
CCS in the EU employs more people aged 15–29 years than any other sector
2 CCS encourages the participation of women compared to other sectors
For instance, in the UK, in 2014, the share of women amounted to more than
50% of employees in the music industry
3 The CCS is driven by small businesses or individuals, which attracts agile and
innovative employers
4 The CCS enhances the attractiveness of cities
It provides the opportunity to engage in large urban development projects
It has a positive impact on tourism
It contributes to the creation of a local identity supporting social cohesion
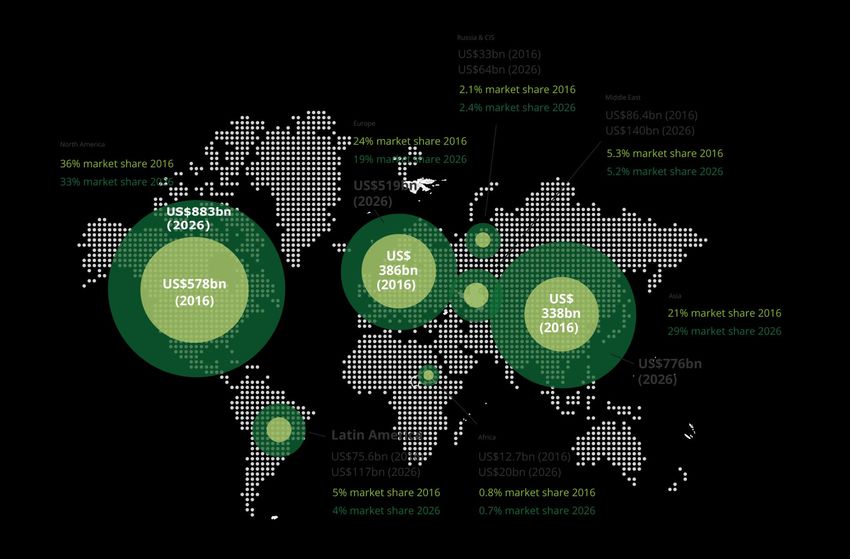
Introduction – Bogota – May 8th, 2019 Introduction – Bogota – May 8th, 2019 30Cities are main investors in CCS to develop territorial attractiveness/regeneration and
to support entrepreneurship
“I have long believed that
talent attracts capital far
more effectively and
consistently than capital
attracts talent. The most
creative individuals want to
live in places that protect
personal freedoms, prize
diversity and offer an
abundance of cultural
opportunities.”
Michael Bloomberg, former
mayor of New York City and
founder of Bloomberg
CCS are at the heart of urban development strategies and a main contributor to urban economies and social development:
CCS increase cultural offers and make cities attractive to talents, tourists as well as investors
CCS encourage innovation (fablabs*, makerspace, cultural hubs and clusters) and hybridisation acting as laboratories to the new
economy
In large European cities 1 in 7 jobs are in the cultural and creative sectors
In Greater London gross value added from CCS activities has risen from EUR 23 billion in 2003 to nearly EUR 47 billion in 2015
Introduction – Bogota – May 8th, 2019*Fablab: fabrication laboratory
31Trends : The Global Art Market* : Value (€m) and Volume of transactions (m)
80,000 60
Value (€m) Volume (m) 68,237
70,000 67,380
65,875 64,550 63,287 63,751 63,683 50
62,020
60,000 57,025 56,698 56,948
54,425
40
50,000
39,511
40,000 30
35,903
30,338
30,000
20
21,052 21,074
20,000
10
10,000
0 0
2002 2003 2004 2005 2006 2007 2008 2009 2010 2011 2012 2013 2014 2015 2016 2017 2018
Global Art Auction Market: 29,1 $bn
Fine Art sectors: 14,4 ($bn) (21%):
Source : Tefaf Art Market Reports & The Art Basel & UBS Art Market Reports Post War & Contemporary : 7,2 ($bn)
*Global Art Market = fine and decorative art and antiques Modern : 4,2($bn)
Impressionist and post impressionist :2,1 ($bn) 32
Introduction – Bogota – May 8th, 2019 Old Master : 0,9 ($bn)Trends : The subscription model is replacing the traditional ownership model, giving
CCS new growth opportunities
Number of paying Spotify subscribers worldwide from July 2010 to January 2018
(millions)
80
70
Paying subscribers in millions
70 65
60
57
60
50
50
39 40
40
30
30
20
20 12.5 15
10
10 4 5 6
0.5 1 1.5 2.5 3
0
New Ways to Generate Revenues
The subscription business model is gradually replacing the ownership model and becoming the main point of
access to content e.g. Spotify, Apple Music, Amazon, Netflix, Google, Deezer, etc.
Spotify has seen an increase in paying users from 40 million in September 2016 to 70 million in June 2018.
There is an increased importance of social media, merchandising and live performances to generate revenues
The main victims of this trend are retailers as well as actors in the lucrative home video market and CD sales
In general, it can be observed that the younger generation shows new consumption patterns (more mobile in taste
and usage)
Sources: Spotify: Music Business Worldwide © Statista 2018 33
Introduction – Bogota – May 8th, 2019
Additional information: Worldwide; Spotify, July 2010 to January 2018Trends : Global recorded music industry revenues 2010-2017 (USD
billions)
20
18
16
14
12
10
8
6
4
2
0
2010 2011 2012 2013 2014 2015 2016 2017
Physical Digital (excluding streaming) Streaming
Performance Rights Synchronisation Revenues
Source: IFPI Global Report 2018
34
Introduction – Bogota – May 8th, 2019Trends : Growth forecast for entertainment and media predict fast growth for virtual
reality (VR) and over-the-top videos (OTT**)
Total E&M* revenue with and without access spending***, 2017-2022)
3000
2500 2375 2400
2250
2125
2010
2000 1900
USD billion
1675
1500 1530 1570
1480
1500 1375 Total E&M
Excl. Access
1000
500
0
2017 2018 2019 2020 2021 2022
Growth and productivity
Total global Entertainment and Media (E&M) revenue will see a 4.4% CAGR rise over the five year
forecast period through 2022, reaching USD 2.4 trillion in that year, from USD 1.9 trillion in 2017
In the EU, the video on demand (VOD****) market has grown from revenues worth EUR 1.165 million
in 2013 to EUR 5.131 million in 2017. In particular, SVOD***** revenues have experienced
exponential growth, from EUR 363 million to EUR 3.649 billion
Magazines and Newspapers are experiencing a negative trend
Source: Global Entertainment and Media Outlook, 2018 *** With access spending refers to the total spending of accessing content
*E&M : Entertainment and Media including the subscription cost required to access content (e.g. broadband
**OTT: over the top videos – OTT refers to content providers that distribute access and mobile internet) without access spending excludes these costs
streaming media as a standalone product directly to viewers without *** VOD: Video-on-Demand
dedicated distributors/telecommunications, broadcasting companies etc. ****SVOD: Subscription-Video-on-Demand
35
Introduction – Bogota – May 8th, 2019Trends : Increased demand for content from global media/tech platforms
160 35%
140 30% Netflix announced USD 10 billion
investment in content (2018), 1 billion
Hours commissioned content
120
Int’l share of hours (%)
25% in Europe (Source FT 18/04/2018)
100 Alphabet/Google and Apple are
20% announcing huge investment to produce
80
content on dedicated platforms (FT
15%
60 05/02/2019 & FT 19/03/2019)
10% Subscription VOD service revenue in
40
Europe grew by 128% annually between
20 5% 2011 and 2016 (EAO, 2019)
0 0%
2013 2014 2015
USA International Share int'l hours
36
Introduction – Bogota – May 8th, 2019Trends : In luxury and fashion, global sales have seen a strong rise in recent years
and EU based players are among the key players
Luxury goods global sales between 1996 and 2017 (in Market leaders pulling smaller actors
EUR billion) Europe is leading in fashion, with several
multinational firms such as LVMH, Gucci,
Hermes, Burberry or Richemont
Global sales of luxury goods were almost
multiplied by three in the last twenty years
Important investment in craftsmanship
(France, Italy) to keep up with demand on
quality products (leather, glass, ceramics,
embroidery)
Demand fuelled by consumers in developing
economies (China notably)
Significant M&A in the sector (Versace but also
smaller brands largely foreign acquisitions)
Importance of E-commerce platform (Zalando)
Source: FT, “How Europe has become a powerhouse in luxury” 37
Introduction – Bogota – May 8th, 2019Trends : The global video games market is growing rapidly due to the expansion of
new technologies
Global video games market revenues (EUR, European video games market revenues
billion) (EUR, billion)
154.84
146
133 4.1 4
121
107
94 57%
57%
82 54% 2.7
75 51%
62 67 40%
46%
34%
23% 29% 1.8 1.8
18%
22% 21% 19%
34% 30% 27% 24%
37% 38% 36%
45% 30% 27% 25% 24% 23% 22%
39% 35% 32% 0.4
0.2
2012 2013 2014 2015 2016 2017 2018 2019 2020 2021
Germany UK France Spain Italy Poland Romania
Console games PC games Mobile games
Key Observations Key Observations
The global video games market is growing. In The biggest EU players account for around
2018, it was worth around EUR 121 billion and EUR 15 billion of the total EU market
is projected to grow by 27% until 2021 representing around 12% of the global market
Mobile gaming is the largest segment The biggest markets are Germany, UK followed
accounting for around 50% of the market in by France, Spain and Italy
2018
Introduction – Bogota – May 8th, 2019 Introduction – Bogota – May 8th, 2019 38Trends : The EU entertainment software industry has seen a constant growth of yearly
revenues and EBITDA margins outperformed those of the EU Software and ICT services
industry
EBITDA Margin (%) Revenues – Yearly growth (%)
29.8%
27.4% 139
CARG 11.5%
19.6% 21.8%
100 104
98
12.6% 12.2% 13.2% 12.2%
CY2014 CY2015 CY2016 CY2017
EBITDA Margin EU Entertainment software industry (%)
CY2014 CY2015 CY2016 CY2017
EBITDA Margin EU Software and and ICT services industry… Revenue growth (100 basis)
Key Observations Key Observations
The EU entertainment software industry had a The entertainment software industry in the EU
higher EBITDA margin than the EU had a CAGR of 11.5% for the last 4 years
software and ICT services industry during
the last 4 years The entertainment software industry’s total
revenue growth in EU increased by 39% since
The industry in EU reached a record EBITDA 2014
margin of 29.8% in 2015 and has decreased
ever since to a level of 21.8% in 2017
Introduction – Bogota – May 8th, 2019 Introduction – Bogota – May 8th, 2019 39Case study : CCS Guarantee Facility – Key features
Financial intermediary’s portfolio of CCS CCS GF’s capped (counter-)
related transactions to SMEs guarantee proposed features
Structured in the form of guarantees or
(Counter-) Guarantee counter-guarantees
Rate on a loan-by-
loan basis: usually Free-of-charge (counter-) guarantee
70%
(Counter-) Guarantee rate typically set at
max. 70%
Risk retained (Counter-) Guarantee cap rate: 10%, 18% or
by the 25%
Financial
Intermediary (Counter-) Guarantee term: 10 years
minimum (Counter-)
20% of the
Pari-passu ranking
Guarantee Cap
original Rate: 25% ,18% State aid consistent
portfolio or 10% based on
EIF’s professional Free-of-charge customised capacity
judgement) building services
EIB Global Loan could be used to partially fund
the portfolio (optional, subject to EIB
approval)
40
Introduction – Bogota – May 8th, 2019CCS Guarantee Facility - Eligible entities and Debt Financing
Debt Financing where
SMEs* and Small Public Enterprises** that: Max loan amount:
EUR 2m
Have a CCS NACE code; or
Min Maturity:
Intend to develop a CCS project with the debt
12 months
financing; or
Purpose:
In the last 24 months before the transaction
approval: Investment
Have been operating in the field of CCS and Business Transfer
intends to continue doing so; or Working Capital
Have received debt financing for a CCS project Max Collateral Requirements:
by European or national CCS institution/association;
Assets used for the business activity
or
Personal guarantee from the owner(s)
Have been awarded a CCS prize; or
Have filed copyrights, trademarks, distribution
rights, etc. in the CCS field; or
Have benefitted from tax credit/exemption
related to development of intellectual property
rights or CCS activities
41
Introduction – Bogota – May 8th, 2019The Capacity Building activities
Tailored to the needs & experience of each FI
Motivation behind Capacity Building:
While the risk-sharing mechanism of the CCS GF incentivizes Financial Intermediaries (FIs) to
extend loans to CCS companies, FIs require further support.
A main reason for this is FIs’ limited experience of engaging with CCS companies and
understanding of the underlying business models.
To overcome this, Capacity Building will help you…
…Understand the business models and specificities of operators of the CCS,
…Market financial products to the CCS market and build a prospecting strategy,
…Assess the credit risk associated with SMEs in the CCS within the specific context of CCS
value chains and B2B relationships,
…Broaden your financing activities to new sub-sectors within the CCS.
Within the context of the CCS Guarantee Facility, Capacity Building is optional, free of
charge, can be delivered on-site or virtually and will be tailor made to your specific
needs.
42CCS specifics and value chain example
The financing needs of CCS SMEs depend on their positioning on the value chain of the
different CCS sub-sectors
Typical CCS value chain
Exhibition/
Creation Publishing Dissemination/ Trade
Reception/ Transmission
Consumer
Production (physical) Retail
Distribution (physical)
management
Content Creation Publishing
Book opening events and
Production (digital) Distribution (digital)
exhibitions
Overview
Each CC sub-sector has its own specificities in terms of business model and market structure.
However, there are certain characteristics which are common for all CC sub-sectors:
Dependence on intangible assets and often intangible nature of the projects and production,
Value chain is dominated by a network of agreements with partners, and 2/3 of the revenues are based on
B2B relationships
Complex and evolving business models subject to external trends such as technology disruptions and
shift in consumer preference (digital distribution channels, impact of social networks, sharing vs. ownership-
based consumer consumption etc.)
Introduction – Bogota – May 8th, 2019 Source: Mapping the Creative Value Chains - A study on the economy of culture in the digital age, 2017 43Socially Responsible Investment (SRI)
Socially Responsible Investment (SRI) is an investment strategy that
incorporates environmental, social and corporate governance (ESG) factors
within the investment process
Is there a future for Socially Responsible Cultural Investments ?
44
Introduction – Bogota – May 8th, 2019The Creative Industry Sector
United Kingdom
The UK’s funding policy covers various commitments :
• Direct funding through the Arts Council England Development Funds (2018-22/£72.M per year)
• Approx. £13B of tax relief granted to the industry granted since 2010.
Funding
It is to be noted that the CIS is well established in the UK, to the point that private Creative venture specialists have
emerged and are also investing.
The UK masters the industry like no other and the government made a clear statement to be the leading nation for CIS.
On the top of extensive fundings, the UK strategy is also all across the board:
• Inclusion of Creative careers programs in existing schools (London Screen Academy) and a dedicated school opening
(Arts & Media School – Islington)
Initiatives • Online piracy and copyright infringement campaign
• Numerous Music education hubs across the country
• Access to finance
• Education and Skills
• Communications / Digital Infrastructures
• Intellectual property : Robust support for copyright – effective enforcement – Intellectual Property Office
• International : Export and inbound Foreign direct investment
The UK creative economy is mature enough to have its own professional association at the Macro level (i.e. not only sub-
Organizations sectors), the Creative Industries Federation.
Besides, every CIS is supported by one or several professional association, which has a clear scope and strategy.
4546
Government interventions across the value chain

                          Supply Side               Market efficiency                               Demand Side
Create capabilities for talent to build   Ensure that the market is operating             Drive demand and protect and
        sustainable careers                 smoothly, especially for SMEs                      increase domestic IP

Talent development                        Smart government                             Branding
Provide skills to monetize talent         Offer digital one stop shop for processes    Establish city-level brand and national
                                          (for example permits)                        status
Education                                 Inclusive policy building                    Market access
Provide formal and technical training     Form a single office to represent specific   Support fairs, festivals, and international
                                          interests                                    trade
Investment                                Cluster development                          IP development
Subside training, studios, trips and      Build focused hubs to reduce                 Use diplomatic and legal levers to
more, co-fund innovation                  market access costs                          retain and protect

 Tax incentives                           Access to finance for SMEs
 Offer rebates on expenses and tax        Provide low-cost loans to reduce
 holidays for top talent                  capital barriers

                                                                                                                                 47
 Introduction – Bogota – May 8th, 2019
Case study : Luxembourg steps to develop the cultural and creative sectors
• Bottom-up approach – listen to the stakeholders
• Strong leadership – define objectives
• Sectors mappings – who does what in which field – what are the strengths of the countries
• Federate stakeholders – Digital platform – networking event – directory
• Awareness that CCI is one sector and be able to speak with one voice – Sector starts to better organizing
itself
• Develop financing tools (bridge financing for the production) grants, - Understand the value chain – creating
the bridge between the creative world and the finance world
• Promote at national & international events CCS – Marketing & communication
• Develop education programs (creative – business – commercial – marketing/communication) addressing the
lack of knowledge
• Create a resources center – data – template – communicate on the helps, etc
• Art Incubators (hacker spaces, accelerators, fab labs, co-working spaces
• Develop a legal status for the “creative” persons
• Cross-border collaboration
• Digital environment and regulation (e-commerce- Fair streaming : Rights distribution keys to establish
greater transparency and economic justice)
• Tax regulation – tax credits, tax shelters,
• IP regulation and infringement management and enforcement services
• Regulatory environment to be a competitive place to do business / Censorship limited
48
Introduction – Bogota – May 8th, 2019The Creative Industry Sector
The Netherlands
The Netherlands have made a point to be one the most Creative economy in Europe by 2020. Accordingly, the State has
setup public and semi-public investment funds dedicated to certain CIS:
Funding The Performing Arts Fund (EUR 43 M), the Cultural Participation Fund (EUR 20M), the Mondriaan Fund (EUR 26M), the
Netherlands Film Fund (EUR 49M), the Dutch Foundation for Literature (EUR 10M), the Creative Industries Fund (EUR 15M).
Since the financing of the CIS is well structured into the funds listed above, the State has a low engagement, but the
funds are helping businesses through their own initiatives. Some of them have shown ingenuity, to reward CIS actors and
foster the collaboration at the same time :
Initiatives • The Netherland Film Fund offers a EUR 50k value post-production service to an award-winning film maker,
• HiphopHuis is a foundation advocation for the music production and education, which has directly beneficiated from
financial advisory of the Culture + Entrepreneurship (the knowledge center for entrepreneurship in the cultural sector)
• The Mondriaan Funds organizes the Prix de Rome, rewarding best young visual artists.
Professional associations represent various CIS in the Netherlands :
• Architecture : Association of Dutch Designers
Organizations • Games : Dutch Games Association
• Advertisers : bondvanadverteerders
• Television : Nederlansde Berôepsvereniging van Fim en Televisimakers
49The Creative Industry Sector
China
China economic strategy is known to be supporting its growth by two means :
• Protectionism policies such as restriction or high taxation to foreign investments China’s
• Collaborating with leading foreign organization in order to acquire industry knowledge.
In 2011, the government launched its first national cultural industry fund, scaled at EUR 2,6 B EUR.
Funding In 2017, the government published its Film Industry promotion law supporting national productions. A Film School was
created in 2014.
The Chinese government supports and funds international exhibitions to tour national public museums in China.
Exhibitions usually include an exchange of expertise between public museums and are seen as a way of building
international cooperation and domestic capacity through knowledge exchange.
Despite the primacy given to national production, regulation has recently been loosened to facilitate the inflow of foreign
capital :
• Until 2015 game consoles were banned. Currently Foreign game developers must work with local publishers to
distribute games in China
Initiatives • In August 2016, the National Development and Reform Commission announced plans to establish a national VR/AR lab
• Incentives include a reduction in import duty on foreign art, from 12% to 3%
• Chinese government supports the ‘internationalization’ of theatre sector : Loosening restrictions on foreign
‘performance agencies’
Almost every professional association in China is state-owned and is aimed to serve the national strategy rather than
defending the interests of industry members :
• Software and video games : China software industry association
Organizations • State Film Bureau
• General Administration of Press and Publication
• Beijing Industrial Design Center
50The Creative Industry Sector
South Korea
Although the country has been growing exponentially over the past decades, especially in the development of technologies
and digital creative content the government has not officially publicized its funding commitment to this growth.
• In 2016, the Government participated to a EUR 51 Million investment in the region of Pangyo, to build Korea’s “Sillicon
Funding Valley”, hosting 1,300 companies, including broadcasting networks, video game developers, software developers.
• It is to be noted that the South Korean government, by mean of several ministries, has invested the equivalent of EUR 2,7
billion in the Korea Fund of Funds, which invests in Korean films, Broadcasting, Multimedia content.
• South Korea has invested in venues such as the $200 million Gocheok Sky Dome, used for K-pop concerts that attract
national and global stars.
Other non-financial initiatives have been led to foster the growth of CIS, notably :
• In 2014, the Center for Creative Economy and Innovation (CCEI) with the ambition to operate institutional programs
to help businesses expand internationally. CCEI has offices in every Korean region to facilitate local inclusion.
Initiatives • South Korea and UK have signed a agreement in order to jointly explore new markets for creative industries.
• Recently, the government also allowed the creation of crowdfunding platforms through the Capital Markets Act.
• South Korean has also established South Korean cultural centers globally, in major countries to spread the popularity of
Korean culture
Professional associations are involved to produce market researches, and a platform for member’s collaboration
• Software : Korea Software Industry Association
• Music : Record Label Industry Association of Korea
Organizations • Movie : Korean Film Council
• Video Games : Korea Game Developers Association
• Architects : Korea Institute of Registered Architects
51The Creative Industry Sector
United States
The US trade policy being historically so liberal, government support is overall limited at the federal level. The support Is
embodied through the National Endowment for the Arts budget which budget available for funding in 2017 was only US$
128M, of which only US$11M were used for the sub-program “creation of art”.
Funding Other funding policies come from local authorities (states and cities) which help to foster local economy, such as :
• The California Arts Council has a US$ 21M budget to support art creation
• The Los Angeles development fund disburse loans to businesses for an undisclosed amount
Public help to support the export of American productions can be hardly found.
Support does exist at the local level :
• Nashville has an extensive list of non-financial resources to connect artists from the music industry together
• New York has its own Office of Media and Entertainment, and has set up a fund dedicated to women’s movie
Initiatives production, facilitates trainings for movie production, helps with the promotion of locally made movies.
• Film LA is specialized in helping the planning and management of logistical aspects in filming a movie in Los Angeles.
• San Francisco’s Office of Economic and Workforce Development conduct various initiatives including minor funding of
local bookstores
Many groups work at the federal level to defend each CIS member interest :
• Movies : Motion Picture Association of America
• Softwares and gaming : Entertainment Software Association
Organizations • Interior designers : American Society of Interior Designers
• Fashion : Council of Fashion Designers of America
• Advertising : American Association of Advertising Agencies
• Publishing : Association of American Publishers
52The Creative Industry Sector
Canada
Canada’s strategy – “Creative Canada” to grow the CIS is well defined and is based on three pillars : Invest in Canadian
Creation, Export Canadian content, and strengthen public broadcasting. and clearly turning to abroad.
Funding Although the total budget of this policy is unknown, there are many funds dedicated to help specific CIS, such as the book
fund, the media fund, the music fund, the periodical fund, the travelling exhibitions indemnification program, the Film or
Video Production Tax Credit, creative export program, and the movable cultural property grant.
Funds listed above have a very straight forward approach as it the case for the creative export program which makes the
country CIS growth successful. Initiatives of this program implies direct contact with other countries :
• in 2018, under the influence of the government, a mission name “Canadian Heritage” involving 60 CIS businesses
toured in China to export Canada’s creative content. The operation tallied CAD 125M worth of trade agreements.
Initiatives
• The action is to be repeated in 2019 in Mexico, Argentina and Colombia. Others past and future destinations are
proudly disclosed by the government.
Additionally, the government has provided mandate to the BC Immigrant Investment Fund Ltd. to support the video game
industry. In 2018, the fund held CAD$ 34M of investment and CAD$ 90M of loans^.
Canada’s professional associations are many and have a clearly stated vision for their respective CIS:
• Medias : Canadian Media Producers Association (CMPA)
• Architecture : Royal Architectural Institute of Canada
Organizations • Design : Registered Graphic Designers
• Publishers : magazines Canada
• Video Games : the entertainment software association
• Music : Canadian Music Publishers Association
53The Creative Industry Sector
United Arab Emirates
Through the Dubai holding umbrella organization the government is directly involved in CIS; with sub-organization ruling
certain industry, such as TECOM, involved in movie and media production.
Dubai Creative Cluster Authority was created in 2014 (renamed Dubai Development Authority since), and manages 3 child
Funding agencies : Dubai International Film Festival, Dubai Design and Fashion Council, Dubai Film and TV commission. Although
the financial involvement of these organizations into CIS is unknown, they rather act as accelerators for new and existing
businesses, by providing business assistance.
Dubai Creative Industry Sector is strongly focused on forward-looking technologies (see below).
Indeed, the government has made the bold statement to be “10 years ahead of any other city”. This strategy takes form
in very innovative projects :
Initiatives • First fully 3D-printing office in the world, as part of the 3D-printing worldwide hub strategy
• Fast-tracked accelerator program
• Foster the creation of innovative technologies for the launch of the museum of the future
• Bolster the creation of innovative drones, during the drones for good award
• Help the creation of Artificial Intelligence and Robotic solutions with the AI & robotics award for good
Thanks to the umbrella setup of the holding, businesses are integrated into clusters :
• Design : the Dubai Design District
• Movie production : Dubai studio city
Organizations • Press : Dubai Press Club
54The Creative Industry Sector
Saudi Arabia
Saudi Arabia has a very audacious development plan “Vision 2030”. The strategy for CIS growth mostly takes place in its
Public Investment Fund (PIF). In 2017 the fund was worth EUR 200 billion in assets.
Funding The Kingdom has a clear strategy to develop cultural heritage, as part of the sub-program Quality of Life. The 2020
targets are to provide the EUR 64.1 million grant in film sub-sector, EUR 45.3 million grant in performing arts sub-sector,
EUR 16.7 million grant in literature sub-sector, and EUR 14,3 million grant in visual arts sub-sector in addition to EUR 7
million cultural fund.
The PIF is financing various significant development initiatives (see below).
Saudi Arabia has invested massively on upcoming “Giga projects” which partly embeds CIS c:
- the Kingdom is about to open its own creative hub “Hayy : creative hub”. It is supposed to open by 2020.
- Neom project is US$ 500 Billion and aims to be the world’s future leading example on many aspect, including media
production, entertainment, digital sciences
Initiatives - Under the Qiddiya project, the PIF will invest up to EUR 2 billion for the creation of a large scale entertainment center
notably with a theme park, exhibition and performance facilities.
- In October 2017, KSA launched its own e-commerce-amazon-like website www.noon.com.
- The PIF is also investing in the semi-public fund “SoftBank Vision Fund”, across all technologies and geographies,
including worldwide.
Due to historical restrictions in the country, professional associations are scarce.
Organizations
55You can also read