Buckinghamshire Labour Market and Skills Analysis: 2021 - March 2021
←
→
Page content transcription
If your browser does not render page correctly, please read the page content below
Buckinghamshire Labour Market and
Skills Analysis: 2021

March 2021
About
This slide deck has been produced to share analysis of Buckinghamshire’s labour
market and skills needs in an accessible way.

Much of the information presented within this deck is also available in Annex A
and B of Buckinghamshire Local Skills Report – 2021.

Links to source data are provided wherever possible.

If you have any queries, feedback or suggestions for further analysis, please
contact Caroline Perkins – caroline.perkins@buckslep.co.uk

What would you like to know?

At a glance

• Buckinghamshire’s labour market and skills strengths
• Buckinghamshire’s labour market and skills challenges
What would you like to know?
Section 1: About the economy

•   What kind of economy does Buckinghamshire have?
•   What are Buckinghamshire’s largest sectors?
•   What are Buckinghamshire’s sector specialisms?
•   Which sectors are predicted to create the most jobs in Buckinghamshire over the next 10
    years?
•   How many people work in Buckinghamshire’s key sectors?
•   Which sectors have been hard-hit by Covid-19?
•   Who are Buckinghamshire’s biggest employers?
•   How many people commute into and out of the county for work?
•   What is the occupational profile of the Buckinghamshire workforce?
•   What are the occupations of Buckinghamshire residents?
•   What are Buckinghamshire’s occupational specialisms?
•   What are the occupations of Buckinghamshire’s self-employed workforce?
What would you like to know?
Section 2: About the labour market

• What levels of economic activity and inactivity are there within Buckinghamshire?
• How has Covid-19 impacted unemployment in Buckinghamshire?
• How has unemployment in Buckinghamshire changed over time?
• How many people are claiming unemployment benefit?
• How many people have been furloughed in Buckinghamshire?
• To what extent has productivity been growing in Buckinghamshire in recent years?
• To what extent have wages been growing in Buckinghamshire in recent years?
• What is Buckinghamshire’s demographic profile?
• To what extent is there deprivation within Buckinghamshire?
What would you like to know?
Section 3: Skills available for local economy

• How qualified is the local labour pool?
• Who are Buckinghamshire’s main providers of education and training?
• What are Buckinghamshire’s apprenticeship take-up levels?
• How have apprenticeship reforms and the Covid-19 pandemic affected the take-up of
  apprenticeships in Buckinghamshire?
• What subjects have been studied by those graduating from Buckinghamshire’s Higher
  Education Institutions?
• What to those graduating from Buckinghamshire’s Higher Education Institutions do next?
• Where do Buckinghamshire graduates live after graduating?
• To what extent do Buckinghamshire employers provide training to their staff?
• How do employers fill vacancies and develop talent pipelines?
What would you like to know?
Section 4: Skills demand within the local economy

• How can demand for skills be measured?
• What types of jobs are in greatest demand in Buckinghamshire?
• How did Covid-19 affect the job market? And will there be any long-lasting changes?
• Which sectors are predicted to create the most jobs in Buckinghamshire over the next 10 years?
• What skills need developing in Buckinghamshire?
• What is the demand for digital skills within Buckinghamshire?
• In which sectors and occupations should we prioritise skills activities to meet current and future
  demand within Buckinghamshire?
• What other occupations have been identified by employers locally as being in particularly high
  demand or being difficult to recruit into?
• What specific skills have been reported by Buckinghamshire employers as being difficult to
  source or requiring focus due to anticipated future demand?
• What training do Buckinghamshire employers find most valuable?
What would you like to know?
Section 5: The extent of skills mismatches within Buckinghamshire

• To what extent do Buckinghamshire employers struggle to fill vacancies, and why?
• To what extent are there skills mismatches within the existing workforce?
At a glance…
Buckinghamshire’s labour market and skills strengths

•   Significant job growth anticipated in a variety of sectors.

•   Clear long-term economic growth aspirations set out in the Buckinghamshire Local Industrial Strategy.

•   High levels of employer involvement in the local skills agenda.

•   A strong collaborative culture (between education institutions, and between employers and educators).

•   Further and Higher Education Institutions with a strong history of business engagement, and a focus on
    applied learning and employability.

•   A top performing Careers Hub.

•   High performing schools.

•   High levels of qualifications amongst residents.

•   Individuals with cutting edge engineering, technology and creative skills that cross sectors and can create
    opportunities for innovation.
Buckinghamshire’s labour market and skills challenges (1) • Retaining and attracting talent (school leavers, graduates and high skilled residents). • Greater gap between the demand for skills and labour within the local economy, and the skills and jobs sought by local residents than elsewhere in the country. Particularly at ‘associate professional’ level. • Low take-up of apprenticeships. • A lack of engineering training provision within the county. • Low levels of interest in construction and health and social care careers, resulting in employers struggling to fill vacancies. • The ‘work-readiness’ of young people, exacerbated by Covid-19. • Temporary and permanent shifts within the labour market (due to the Covid-19 pandemic) and related shifts in skills requirements. • Pockets of inequality and poor social mobility.
Buckinghamshire’s labour market and skills challenges (2)
• A wider than national average gender pay gap.

• Lower than average levels of training by County employers

• A large proportion of SMEs, who often do not employ learning and development professionals and can therefore
  find it difficult to navigate government funded training provision.

• Slow productivity growth in recent years.

• The ever-growing and evolving demand for digital skills.

• The need to ensure strong talent pipelines for growing sectors (including life sciences, health and social care;
  creative industries; construction; high performance engineering; and space).
• A need to ensure opportunities in growth sectors are accessible to all.
Section 1: About the economy
What kind of economy does Buckinghamshire have?

                                                                                           100%

 As with most of the developed world, Buckinghamshire’s                                    90%

 economy is dominated by the service sector, which provides                                80%

 85% of all local employee jobs1. Three in every five jobs in       42% of the workforce   70%
                                                                                           60%
 Buckinghamshire exist in the ‘foundational economy’ with           work for micro firms
                                                                                           50%
 the remainder being within the ‘tradable economy’.                (employing fewer than
                                                                                           40%
                                                                    10 people) compared    30%
                                                                     to 32% nationally2.   20%         42%
 Defining features of Buckinghamshire’s economy are:                                                                        32%
                                                                                           10%

 •    The predominance of small businesses2.                                                0%
                                                                                                  Buckinghamshire            UK

 •    High levels of self-employment, particularly within the                                 Micro employer        All other employers
      county’s creative and construction sectors.
 •    World-class economic assets and high performing
      clusters of business activity in the areas of film and TV,   1 in every 7 people working in the Buckinghamshire
      high-performance engineering, space and MedTech.             economy is self-employed3
 •    A large wholesale sector (particularly the wholesale of
      pharmaceutical goods, machinery and equipment,
      computers and software)1.
 •    A larger than average digital sector1.

 1 Business Register and Employment Survey, 2019, ONS
 2 Inter Departmental Business Register, ONS
 3 Annual Population Survey (Oct 19 – Sept 20), ONS
What kind of economy does Buckinghamshire have?
The number of VAT / PAYE registered businesses
(enterprises) in Buckinghamshire increased by 2% between % of firms ‘born’ in 2014 operating 5 years later
2018 and 2019, from 33,565 to 34,105. These businesses 100.0
operate from 34,550 premises within the County1. 90.0
80.0
Between 2014 and 2019, the rate of business births in 70.0 43% 48%
60.0
Buckinghamshire exceeded the rate of business deaths2.
50.0
40.0
In recent years, business survival rates in Buckinghamshire 30.0
have been higher than the national average. Pre-Covid-19, 20.0
fewer businesses were being created and fewer businesses 10.0
were closing in Buckinghamshire (as a proportion of all 0.0
existing business) than the national average. 1-year 2-year 3-year 4-year 5-year
England Bucks
In 2019, the number of business start ups as a proportion of
all businesses was lower than the national average (10.6%
versus 13.2%). However, business start ups as a proportion Business survival rates in Buckinghamshire are higher than
of the local population were higher in Buckinghamshire than the national average. For example, 48% of firms ‘born’ in
nationally (6.7 per 1,000 people versus 6.2). Buckinghamshire in 2014 were still operating 5 years later,
compared to 43% nationally2.
In 2019, there were slightly more high growth businesses in
Buckinghamshire (as a proportion of all businesses 1 UK Business Count, 2020, ONS
employing more than 10 people) than the national average2. 2 Business Demography, 2019, ONSWhat are Buckinghamshire’s largest sectors? (in terms of
employment)
Proportion of the workforce employed in different sectors
0% 2% 4% 6% 8% 10% 12% 14%
Health
Business admin & support services
Retail
Professional, scientific & technical
Education
Manufacturing
Wholesale
Hospitality Buckinghamshire’s largest sector in terms
Construction the number of jobs it provides is the
Digital tech health and social care sector. Followed by
Arts, entertainment & recreation business admin and support services;
Public admin & defence retail; professional, scientific and technical;
Motor trades and education.
Transport & storage
Financial & insurance
Property Sector definitions can be found here.
Farming etc
Utilities etc
Buckinghamshire England
Source: Business Register and Employment Survey, 2019, ONSWhat are Buckinghamshire’s largest sectors? (in terms of
employment)
Number of full and part-time workers by sector
Health
Business admin & support services
Education
Professional, scientific & technical
Retail
Manufacturing
Wholesale The prevalence of part-time working
Hospitality varies considerably by sector.
Construction
Buckinghamshire’s retail and health and
social care sectors employ the largest
Digital tech
number of people on a part-time basis.
Arts, entertainment & recreation
Buckinghamshire’s manufacturing,
Public admin & defence wholesale and professional, scientific and
Motor trades technical sectors employ the most people
Transport & storage on a full-time basis.
Financial & insurance
Full time Part time
Property
Sector definitions can be found here.
Utilities etc
Farming etc
0 5,000 10,000 15,000 20,000 25,000 30,000
Source: Business Register and Employment Survey, 2019, ONSWhat are Buckinghamshire’s sector specialisms?
Employment location quotients
The chart to the right shows how the structure of Farming etc
Arts, entertainment & 2
Buckinghamshire’s economy differs to the national recreation
Utilities etc
1.8
economy, based on the number of people
Health 1.6 Manufacturing
employed in different sectors. 1.4
1.2
The purple ring is the national average, and the Education Construction
1
blue ring is employment within the 0.8 1.3
Buckinghamshire economy. Where the blue ring 0.6
sits outside the purple ring, Buckinghamshire has a Public admin & defence 0.4 1.3 Motor trades
higher proportion of people employed than the 0.2
0
national average.
Business admin & support
Wholesale
The numbers on the chart are location quotients. A services
1.9
location quotient over 1 shows a local specialism.
The four broad sectors* of the economy in which Professional, scientific &
Retail
technical
Buckinghamshire has a specialism are: wholesale
(1.9 times more employment in this sector locally 1.3
Property Transport & storage
than nationally), motor trades (1.3 times more),
digital tech (1.3 times more), construction (1.3 Financial & insurance Hospitality
times more). Digital tech
Bucks England
*this analysis uses broad Standard Industrial Classification codes. The analysis on the following pages provides more granular insightWhat are Buckinghamshire’s sector specialisms?
Some sectors or clusters of business activity are not well There are twice as many creative
defined within the Standard Industrial Classification (SIC) code industry jobs within the
system or are not captured well when using the broad Buckinghamshire economy than
classification codes (see previous pages). the national average, many of
which are in the film and TV sector.
However, using 4 and 5 digit SIC codes, along with our Buckinghamshire also has higher
knowledge of the local economy, we can dig deeper to gain a than average levels of employment
more granular understanding of Buckinghamshire’s sector in advertising, specialist design,
specialisms and the demand for labour and skills within them. artistic creation and sound
recording / music publication1.
For every 10 people working in the core life sciences
sector in England there are 13 people working in the
sector in Buckinghamshire. In addition, companies
involved with the wholesale of pharmaceuticals goods
employ nearly 9 times as many people in
Buckinghamshire than the national average1.
The Silverstone Technology Cluster, a world leading
local cluster of high-tech businesses, has grown
significantly in recent years. Over 4,000 companies
operating in precision engineering alone are located
1 Business
within a one-hour radius of Silverstone.
Register and Employment Survey, 2019, ONSWhich sectors are predicted to create the most jobs in
Buckinghamshire over the next 10 years?
Key growth sectors (from an employment perspective) within
Buckinghamshire over the next 10 years will be: The construction, creative and health and social care
sectors are expected to create the greatest volume
• Construction (in part due to HS2, East West Rail, Aylesbury of jobs over the next five years.
Garden Town related construction activity, and a large house
building programme)
• Creative Industries (linked to expansion plans at Pinewood
Pinewood Studios’ expansion plans are predicted to
Studios, plus the continuing growth of the West of London create 3,500 new jobs, including 1,500 construction
Screen Cluster with many new sound studios opening within jobs.
the next few years)
• Life sciences, health and social care (linked to both the
The construction of HS2 is expected to create around
health needs of an ageing population and the need to 4,000 jobs in Buckinghamshire and the surrounding
respond to the aftermath of the Covid-19 pandemic) areas.
• Space (linked to expansion of the Westcott Space Cluster)
• High performance engineering (linked to expansion of the
Silverstone Enterprise Zone and an increasing focus on the
need for green technologies to combat climate change) It is anticipated that the 10-year plan for the
Westcott Space Cluster will create over 2,000 jobs.
The Space, Creative Industries, High Performance Engineering and
MedTech sectors are identified within Buckinghamshire’s Local
Industrial Strategy as key sectors. Each has a significant ‘asset’ See the Buckinghamshire LEP website for more
located within the County (Westcott Space Cluster, Pinewood detailed analysis of workforce trends, skills shortages
Studios, Silverstone Park and Technology Cluster and Stoke and local training provision within these sectors.
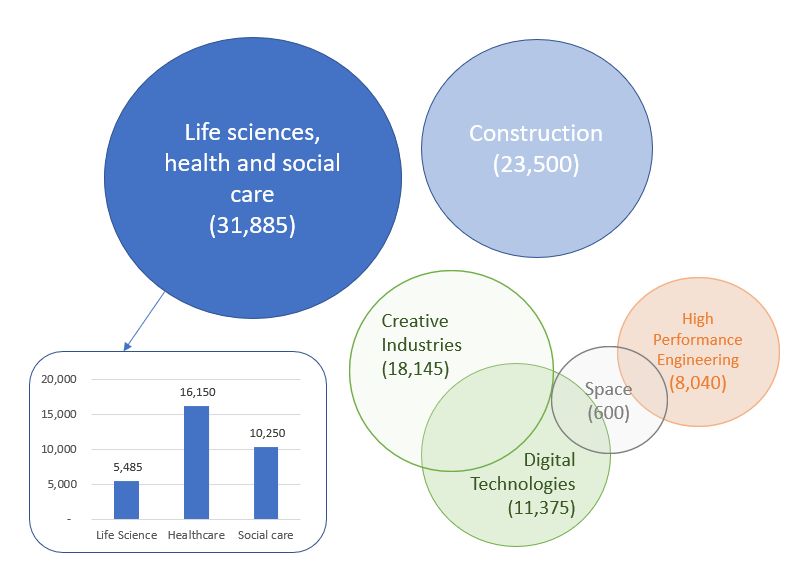
Mandeville hospital) and strong long-term growth prospects.How many people work in Buckinghamshire’s key sectors?
In total, approximately 40% of all those
working in the Buckinghamshire economy
work in the county’s key sectors.
These sectors vary considerably in size, with
health and social care currently the largest
and space the smallest.
Business Register and Employment Survey, 2019, ONS
Note 1 - whilst the digital technology sector is not expected to grow significantly in Buckinghamshire over the next decade, it does
employ more people locally than nationally, and is a growing sector globally. Note 2 – It is difficult to measure how many people are
employed in the space sector in Buckinghamshire. The figure provided is an estimate.Which sectors have been hard-hit by Covid-19? Sectors that have been most severely affected by the Covid-19 pandemic locally include: • Aviation • Live events • Hospitality • Travel & transport (including inbound tourism) • Leisure & entertainment (including visitor attractions) • Personal services (including hair and beauty) • Arts & culture (including theatres) • Suppliers to the above • Suppliers to the education sector See Buckinghamshire LEP’s latest Impact of Covid-19 on the Buckinghamshire Economy analysis for further details.
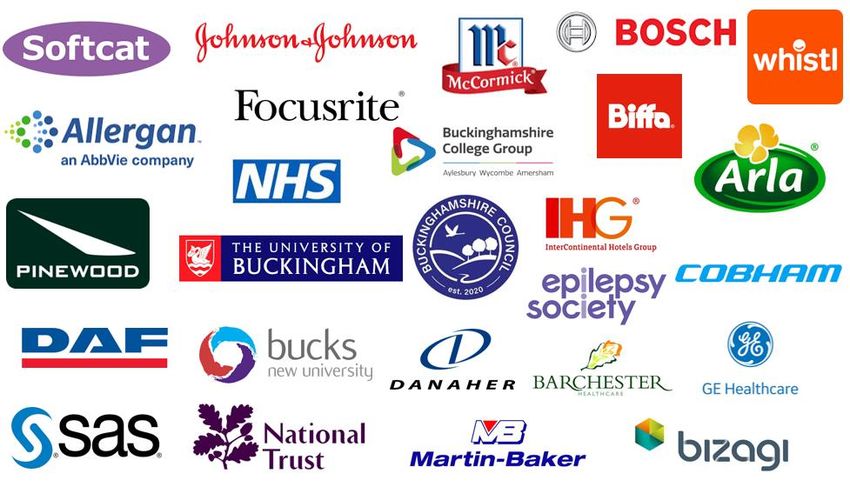
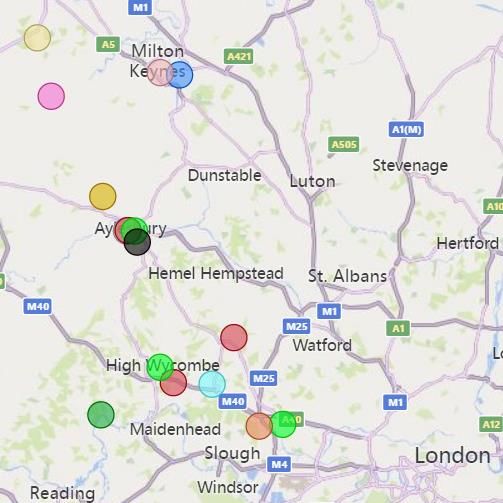
Who are Buckinghamshire’s biggest employers?

  In addition to the above, national companies who employ large numbers of people within the local economy include national
  construction companies, national retail chains, national hospitality chains, national care home chains and global film
  production companies.
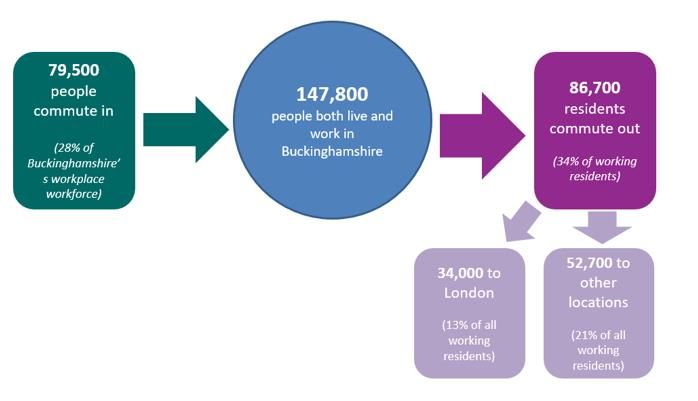
How many people commute into and out of the county for work?

Commuting patterns matter when
undertaking local labour market and skills
analysis, particularly when trying to
compare data on the demand for, and
supply of, skills. For example, whilst
Buckinghamshire may have a large number
of highly qualified residents, high levels of
out-commuting, often for high paid jobs,
means that the skills of many of these
residents are not available to
Buckinghamshire employers, nor are these
individuals directly contributing to the
output and productivity of the local
                                                    Source: Census 2011, ONS
economy.

Buckinghamshire has one of least ‘self-contained’ labour markets in       There are some sector specific commuting patterns. Within the
England. Pre-Covid-19, around a third of working residents travelled      film and TV sector for example (which is concentrated in the
out of the county for work whilst 28% of all those working within the     south of the county), film crews of up to 1,000 per large
Buckinghamshire economy travel into the county from elsewhere. In         production, primarily freelancers, move between studios.
total, 34,000 Buckinghamshire residents usually work in London.

It remains to be seen how the Covid-19 pandemic will affect commuting patterns in the long term. It seems likely that whilst out-
commuting professionals will reduce the number of days they commute to city offices, an increased acceptance of home working could
result in more residents taking-up higher paid out-of-County roles than previously. The shift of professionals from offices into their homes
however takes their demand for locally consumed services (e.g. coffee shops, cafes, gyms, retail) with them. This could lead to increased
demand for people locally with consumer service sector skills.
What is the occupational profile of the Buckinghamshire workforce?
Managers, Directors and Senior Officials
This chart shows how the broad occupational profile
of Buckinghamshire’s workforce compares to the
occupational profile of England as a whole.
Professional
The largest occupational group in Buckinghamshire is
Associate Prof & Tech
‘professional’. A similar proportion of the workforce
work in professional roles locally than nationally.
Administrative and secretarial
The second largest occupational group in
Skilled Trades
Buckinghamshire is ‘managers, directors and senior
officials’. A large proportion of the workforce work in
Caring, Leisure and Other
this occupational group locally than nationally (16%
versus 12%). This is likely linked the high proportion
Sales and Customer Service of self-employed business owners in the county.
Process, Plant and Machine Fewer people work in ‘lower skilled’ occupations
(elementary occupations and process, plant and
Elementary machine operatives) in the Buckinghamshire economy
than nationally
0% 5% 10% 15% 20% 25%
England Bucks Workers
Annual Population Survey (Oct 19 – Sept 20), ONSWhat are the occupations of Buckinghamshire residents?
This chart shows how the occupational profile of
Managers, Directors and Senior Officials
Buckinghamshire residents differs to the
Professional
occupational profile of Buckinghamshire-based
workers.
Associate Prof & Tech
The biggest difference is at the top end. 19% of
Administrative and secretarial
Buckinghamshire residents work as ‘managers,
directors and senior officials’, compared to 16%
Skilled Trades within the local economy and 12% nationally.
Caring, Leisure and Other Buckinghamshire residents are slightly less likely to
work in professional and associate professional
Sales and Customer Service roles than those working in the Buckinghamshire
economy.
Process, Plant and Machine
Buckinghamshire residents are also less likely to
Elementary work in mid-skilled and lower skilled roles than
Buckinghamshire workers. With the exception of
0% 5% 10% 15% 20% 25% ‘sales and customer service’ occupations.
Bucks Residents Bucks Workers
Annual Population Survey (Oct 19 – Sept 20), ONSWhat are Buckinghamshire’s occupational specialisms?
This table provides a more granular picture. It lists Location
Description 2018 Jobs
Buckinghamshire’s top 10 occupational specialisms Quotient
(number of employee jobs as a proportion of all Artistic, Literary and Media Occupations 2,300 1.9
employees).
Animal Care and Control Services 1,100 1.5
The top occupation is ‘artistic, literary and media’, in which
twice as many people are employed locally than the Hairdressers and Related Services 1,600 1.5
national average. This is likely linked to the presence of Cleaning and Housekeeping Managers and
900 1.4
Pinewood Studios in the south of the County. Supervisors
Sports and Fitness Occupations 1,300 1.3
The next four occupational specialisms reflect the relative
affluence of Buckinghamshire residents, and their level of Sales, Marketing and Related Associate
11,400 1.3
discretionary spend. These are: animal care; hair and Professionals
beauty; cleaning and sports / fitness occupations. Agricultural and Related Trades 1,600 1.3
Three ‘knowledge-economy’ occupations make the top 10: Elementary Cleaning Occupations 8,700 1.3
sales and marketing; design; and IT and telecoms
professionals. Design Occupations 1,000 1.3
Information Technology and Telecommunications
The final occupation on the list is agricultural occupations, 8,900 1.3
Professionals
this reflects the rural nature of the County.
Seven of Buckinghamshire’s top 10 occupational Location quotients (LQ) are a way of quantifying how concentrated a
particular sector or occupation is in a local area as compared to the nation.
specialisms are likely to have been severely impact by the
A LQ greater than 1 indicates a specialism. A LQ of 2 would show that
Covid-19 pandemic.
twice as many people are employed in a certain sector or occupation
locally than nationally.
Annual Population Survey (Oct 19 – Sept 20), ONSWhat are the occupations of Buckinghamshire’s self-employed
workforce?
The table to the right provides estimates of the number of Self-
people working in different occupations on a self-employed Occupation employed
basis within Buckinghamshire. Many of these occupations Taxi and cab drivers and chauffeurs 2,300
sit within the construction and creative sectors. The Construction and building trades (not elsewhere classified) 1,800
majority of those who are self-employed do not have any Carpenters and joiners 1,600
employees.
Cleaners and domestics 1,600
The extent to which those who are self-employed have Hairdressers and barbers 1,400
been economically impact by the Covid-19 pandemic has Photographers, audio-visual and broadcasting equipment operators 1,300
depended on the following factors: Painters and decorators 1,300
• Ability to work from home. Gardeners and landscape gardeners 1,300
• Eligibility for the Self-Employed Income Support Actors, entertainers and presenters 1,200
Scheme (SEISS) (based on earnings and length of time Arts officers, producers and directors 1,100
self-employed).
Animal care services occupations (not elsewhere classified) 1,100
• Whether or not individuals are company directors
Shopkeepers and proprietors – wholesale and retail 1,000
paid in part via dividends (those who are, have
experienced some of the biggest drops in income). Plumbers and heating and ventilating engineers 900
Childminders and related occupations 800
In terms of ability to work from home, of the top
occupations undertaken by self-employed people listed in Authors, writers and translators 800
the table, it is likely that only those in two occupational Teaching and other educational professionals (not elsewhere
classified) 700
groups (‘authors, writers and translators’, and ‘management
Managers and directors in retail and wholesale 700
consultants and business analysts’) could easily work from
home. Management consultants and business analysts 700
Managers and proprietors in other services (not elsewhere classified) 700
Estimates based on national data along with local data from EMSI AnalystSection 2: About the labour market
What levels of economic activity and inactivity are there within
Buckinghamshire?
 At present (March 2021), it is very
 difficult to measure Buckinghamshire
 resident’s levels of economic activity.
 The diagram sets out the pre-Covid-
 19 situation. Pre-Covid-19,
 Buckinghamshire residents enjoyed
 high levels of employment and low
 levels of unemployment and
 economic inactivity. Those who
 were inactive were more likely to be
 so because they were studying
 rather than because they were sick.

 • Buckinghamshire’s employment rate had been consistently higher than the national rate over
   the last 15 years.

 • Unemployment, which is difficult to accurately measure within Buckinghamshire*, was lower
   than the national average but had been rising since 2017.

 • Of those who were economically inactive, the majority did not want a job.

 • In total, there were approximately 21,000 working age residents who were not working but
   wanted a job (unemployed people plus those who were inactive but wanted a job).

Source: Annual Population Survey (Oct 19 – Sept 20), ONS
How has Covid-19 affected unemployment in Buckinghamshire?

It has historically been difficult to accurately measure how many Buckinghamshire                       Definitions
residents are unemployed. And it is currently (March 2021) even more difficult to do so
than normal.                                                                                 Someone is officially classified as
                                                                                          being unemployed if they do not have
Why?                                                                                      a job, have been actively seeking work
                                                                                              for at least four weeks and are
In the UK, unemployment is measured using data collected from the ONS Annual              available to start work within the next
Population Survey (APS). The sample size for Buckinghamshire is pretty small, which                      two weeks.
results in estimates that are not particularly reliable.
                                                                                             The unemployment rate is the
The estimates are based on data collected over a 12-month period and there are a few           number of people who are
months between collection and publication. In March 2021, the latest published data       unemployed divided by the number of
covered the period October 2019 to September 2020. It therefore included some data         people who are economically active.
collected pre-Covid and some data collected during the Covid-19 pandemic.

Local unemployment data derived from the APS is therefore not particularly reliable           If you are conducting analysis of
and is not timely enough to measure the impact of Covid-19 in real or near time.                   unemployment data for
                                                                                           Buckinghamshire, ONS recommend
To try to deal with the accuracy issue, for some smaller geographies (including            using the model-based estimates of
Buckinghamshire), ONS produce an alternative estimate, which combines the APS               unemployment within NOMIS and
estimate with administrative data on the number of people claiming unemployment            selecting Buckinghamshire from the
related benefits. This is referred to as model-based estimates of unemployment. As          local authorities: district / unitary
with the APS estimates, model-based estimates cover a 12-month period.                     menu, rather than county / unitary.
                                                                                             This is judged to provide the most
This results in there being two different unemployment estimates for Buckinghamshire,                 accurate estimate.
with neither being particularly useful in the current situation.
0.0
1.0
2.0
3.0
4.0
5.0
6.0
8.0
9.0
7.0
Jan 2004-Dec 2004
Apr 2004-Mar 2005
Jul 2004-Jun 2005
Oct 2004-Sep 2005
Jan 2005-Dec 2005
Apr 2005-Mar 2006
Jul 2005-Jun 2006
Oct 2005-Sep 2006
Jan 2006-Dec 2006
Apr 2006-Mar 2007
Jul 2006-Jun 2007
Oct 2006-Sep 2007
Jan 2007-Dec 2007
Apr 2007-Mar 2008
Jul 2007-Jun 2008
Oct 2007-Sep 2008
Jan 2008-Dec 2008
Apr 2008-Mar 2009
Jul 2008-Jun 2009
Oct 2008-Sep 2009
Jan 2009-Dec 2009
Apr 2009-Mar 2010
Jul 2009-Jun 2010
Oct 2009-Sep 2010
England - APS
Jan 2010-Dec 2010
Apr 2010-Mar 2011
Jul 2010-Jun 2011
Oct 2010-Sep 2011
Jan 2011-Dec 2011
Apr 2011-Mar 2012
Jul 2011-Jun 2012
Source: Annual Population Survey (Oct 19 – Sept 20), ONS
Oct 2011-Sep 2012
Jan 2012-Dec 2012
Apr 2012-Mar 2013
Bucks - APS
Jul 2012-Jun 2013
Oct 2012-Sep 2013
Jan 2013-Dec 2013
Apr 2013-Mar 2014
Jul 2013-Jun 2014
Oct 2013-Sep 2014
Jan 2014-Dec 2014
Apr 2014-Mar 2015
Jul 2014-Jun 2015
Oct 2014-Sep 2015
Jan 2015-Dec 2015
Apr 2015-Mar 2016
Bucks - Modelled
Jul 2015-Jun 2016
Oct 2015-Sep 2016
Jan 2016-Dec 2016
Apr 2016-Mar 2017
Jul 2016-Jun 2017
Oct 2016-Sep 2017
Jan 2017-Dec 2017
Apr 2017-Mar 2018
Jul 2017-Jun 2018
Oct 2017-Sep 2018
Jan 2018-Dec 2018
Apr 2018-Mar 2019
Jul 2018-Jun 2019
Oct 2018-Sep 2019
Jan 2019-Dec 2019
Apr 2019-Mar 2020
Jul 2019-Jun 2020
Oct 2019-Sep 2020
model-based data is available from 2016.
This chart shows how the unemployment rate in
How has unemployment in Buckinghamshire changed over time?
recent years in 2019. The latest data is
beginning to show a Covid-19 related uptick.
trends but at a lower level, rising following the
last decade and a half has been lower than the
Great Recession and falling to its lowest rate in
Buckinghamshire is estimated to have changed over the last 16
Buckinghamshire’s unemployment rate over the
national average. Overall, it has tracked national
years, in comparison to the national average. The more accurateHow many people in Buckinghamshire are claiming unemployment related benefits? The Claimant Count combines the number of people claiming Jobseeker's Allowance with those who claim Universal Credit and are required to seek work and be available for work. Whilst the Claimant Count is not a measure of unemployment, it is a useful proxy at the local level as it is based on administrative data rather than survey estimates. It is also a timely measure as data is released on a monthly basis. Data released in the second week in April 2021, for example, measures the number of claimants in the month to the second week in March 2021. Some things to bear in mind when using Claimant Count data: 1. Not all those who are unemployed claim benefits. This is largely due to people finding new work quickly or having other sources of financial support (such as a partner’s income, a redundancy payoff or savings). 2. In normal (non-pandemic) times, it is estimated that around 55% of unemployed Buckinghamshire residents claim benefits and are therefore counted within the Claimant Count. A much lower proportion than the national average. 3. Not all those counted within the Claimant Count are unemployed. Some are working a small number of hours and / or are earning a low income. Changes made at the beginning of the pandemic means that more people are eligible for the Claimant Count than previously. Due to the phased nature of recent changes to the benefits system, the Claimant Count cannot be used to accurately measure historical trends. To deal with this issue, the Department for Work and Pensions (DWP) publish the Alternative Claimant Count, which models what the count would have been if Universal Credit had been in place since 2013. This data is less timely than the Claimant Count itself. For example, data for August 2020 was published in October 2020. And is published quarterly rather than monthly. It does provide information on the flow of individuals onto and off the Claimant Count however, which is useful and not available for the standard Claimant Count data.
How many people in Buckinghamshire are claiming unemployment
related benefits?

The number of Buckinghamshire
                                                                  7.0                                              18,000
residents claiming unemployment
related benefits shot up following the                                                                             16,000
                                                                  6.0
onset of the Covid-19 pandemic. In
                                                                                                                   14,000

                                            Claimant Count Rate
January 2021, 14,855 people were

                                                                                                                            Number of Claimants
                                                                  5.0
claiming, 9,315 more than in March                                                                                 12,000
2020.                                                             4.0                                              10,000
Buckinghamshire’s claimant count rate                             3.0                                              8,000
(claimants as a proportion of all
                                                                                                                   6,000
residents aged 16-64) in January 2021                             2.0
stood at 4.5%, lower than the national                                                                             4,000
average of 6.3%                                                   1.0
                                                                                                                   2,000
Further analysis of Claimant Count and                            0.0                                              0

                                                                           October 2019

                                                                           October 2020
                                                                               July 2019

                                                                               July 2020
                                                                          February 2019
                                                                            March 2019
                                                                              April 2019

                                                                          February 2020
                                                                            March 2020
                                                                              April 2020
                                                                            August 2019

                                                                         December 2019

                                                                            August 2020

                                                                         December 2020
                                                                              June 2019

                                                                        November 2019

                                                                              June 2020

                                                                        November 2020
                                                                           January 2019

                                                                              May 2019

                                                                           January 2020

                                                                              May 2020

                                                                           January 2021
                                                                        September 2019

                                                                        September 2020
Alternative Claimant Count data is
presented on the following pages. As
this data is released on a monthly basis,
please download Buckinghamshire LEP’s
Monthly Claimant Count Report for the
latest data.                                                                Bucks - number   Bucks %   England %

Source: Claimant Count, 2021
Claimant Count Rate
1.0
2.0
3.0
4.0
5.0
6.0
7.0
8.0
9.0
10.0
0.0
Black Country areas?
Greater Birmingham and Solihull
London
Tees Valley
Greater Manchester
Liverpool City Region
North East
Source: Claimant Count, 2021
Humber
Lancashire
Leeds City Region
Sheffield City Region
South East
South East Midlands
Greater Lincolnshire
Solent
Cornwall and Isles of Scilly
Coventry and Warwickshire
Derby, Derbyshire, Nottingham and…
Stoke-on-Trent and Staffordshire
Coast to Capital
Dorset
Thames Valley Berkshire
Worcestershire
Leicester and Leicestershire
New Anglia
Hertfordshire
Cheshire and Warrington
Heart of the South West
West of England
Greater Cambridge and Greater…
The Marches
Buckinghamshire
Gloucestershire
Swindon and Wiltshire
Cumbria
Enterprise M3
had the 4th lowest Claimant Count.
Oxfordshire
York, North Yorkshire and East Riding
How does Buckinghamshire’s Claimant Count rate compare to other
In January 2021, Buckinghamshire had the 7th
At the start of the pandemic, Buckinghamshire
lowest Claimant Count rate of the 38 LEP areas.Which areas have seen the biggest increases in Claimant Count rates
since the onset of the pandemic?
Buckinghamshire’s Claimant Count rate was 2.8
percentage points higher in January 2021 than in
March 2020. This places Buckinghamshire mid-table
Percentage Point Increase in Claimant
in terms of the impact of Covid-19 on Claimant Count
Count Rate (Mar 2020 to Jan 2021)
rates. London experienced the greatest increase, with
Cumbria and York, North Yorkshire and East Riding
experiencing the smallest increases.
Source: Claimant Count, 2021How does the Claimant Count rate vary within Buckinghamshire and by age?
Area March 2020 January 2021 March - January 2021
Parliamentary
Number Rate (%) Number Rate (%) Change % point change
constituency
Within Buckinghamshire, the Claimant Aylesbury 1,420 1.8 3,425 4.3 2,005 2.5
Count rate is highest (January 2021) in Beaconsfield 820 1.4 2,630 4.4 1,810 3.0
the Wycombe parliamentary Buckingham 710 1.1 2,145 3.3 1,435 2.2
constituency area at 6.5%. Wycombe’s
Claimant Count rate is higher than the Chesham & 750 1.4 2,160 3.9 1,410 2.5
national average. Buckingham has the Amersham
lowest Claimant Count rate at 3.3%. Wycombe 1,840 2.6 4,495 6.5 2,655 3.9
Buckinghamshire 5,540 1.7 14,855 4.5 9,315 2.8
England 1,063,505 3.0 2,200,965 6.3 1,137,460 3.3
Age March 2020 January 2021
Number Share of total Number Share of total
Over half of all those claiming ‘out-of-work’ related
Aged 16-24 885 16% 2,590 17% benefits are aged between 25 and 49. The number of
young people (age 16-24) claiming has increased at a
Aged 25-49 3,065 55% 8,285 56% greater rate than older people (aged 25 plus)
Aged 50+ 1,590 29% 3,980 27%
All ages 5,540 100% 14,855 100% Source: Claimant Count, 20210.0%
1.0%
2.0%
3.0%
4.0%
5.0%
6.0%
January 2013
March 2013
May 2013
July 2013
September 2013
November 2013
January 2014
March 2014
May 2014
July 2014
September 2014
November 2014
January 2015
March 2015
May 2015
July 2015
September 2015
November 2015
January 2016
March 2016
May 2016
July 2016
September 2016
November 2016
January 2017
March 2017
May 2017
July 2017
September 2017
November 2017
January 2018
March 2018
What is the historic Claimant Count trend?
May 2018
July 2018
September 2018
November 2018
January 2019
March 2019
May 2019
July 2019
September 2019
November 2019
January 2020
Claimant Count fell from just over 3% to just under 2%.
March 2020
May 2020
July 2020
September 2020
November 2020
we see that Buckinghamshire’s Claimant Count rate was low (under 2%) for five
Using Alternative Claimant Count data (modelled data which estimates what the
Claimant Count would have been if Universal Credit had been in place since 2013),
years prior to the Covid-19 pandemic. Between 2013 and 2015, Buckinghamshire’s
Source: Alternative Claimant Count, DWPWhat have been the flows of people onto and off the Claimant Count?
7,000
On flow Prior to the Covid-19 pandemic,
6,000
Off flow approximately 1,000 people flowed onto
5,000 the Claimant Count and 1,000 people
flowed off the Claimant Count every month.
4,000 April and May 2020 saw massive increases
in the number of people flowing onto the
3,000 Claimant Count. With few people flowing
off the Count. Between June and
2,000 November 2020, more people have been
flowing off the Claimant Count every
1,000 month, but the numbers flowing onto the
Count remain relatively high too.
0How many people have been furloughed in Buckinghamshire?
We estimate that nearly 75,000
Buckinghamshire residents spent some of Number of people furloughed by day (South East region)
2020 on furlough leave, approximately a
third of all employees. At the end of January 900,000
2021, 38,600 Buckinghamshire residents
800,000
were on partial or full-time furlough. This
equates to 15% of employees, in line with 700,000
the national average. 600,000
National data on the take-up of the Job 500,000
Retention Scheme (furloughing) by sector
400,000
shows that, in terms of volume, take-up was
highest in the hospitality and retail / 300,000
wholesale sectors. Whilst proportionally 200,000
(i.e. the percentage of a sector’s workforce
100,000
on furlough leave) take-up was highest in
the arts, entertainment and leisure (23%), 0
hospitality (22%) and ‘other services’ (19%) 01 July 2020 01 August 01 September 01 October 01 November 01 December 01 January
2020 2020 2020 2020 2020 2021
sectors.
Source: HMRC, 2021To what extent has productivity been growing in Buckinghamshire in
recent years?
In recent years, Buckinghamshire has been outpaced by other areas of the UK in terms of productivity growth. The
result being a drop in position from 4th out of 38 LEP areas in 2010, to 9th in 2018. Buckinghamshire’s productivity is
now in line with the national average, or 7% below the national average if the influence of the housing market is
stripped out (see Buckinghamshire’s Economic Recovery Plan Evidence Base and the Buckinghamshire Productivity
Story for further details). Buckinghamshire has seen greater employment growth in low productivity sectors than in
high productivity sectors in recent years.
£40
The Covid-19 pandemic could have positive and
£35 £35.0
negative effects on productivity. In the short-
£35.0
term, redundancies and/or recruitment freezes,
along with investment in technology, could
£30
enable firms to maintain or increase output with
fewer employees. On the other hand,
£25 companies that have taken on debt to get
through the pandemic may put investment plans
£20 (be that investment in capital, R&D or skills) on
Buckinghamshire Thames Valley LEP UK hold, which would negatively impact
£15 productivity.
2004 2005 2006 2007 2008 2009 2010 2011 2012 2013 2014 2015 2016 2017 2018
Source: Subregional Productivity, ONS, 2020To what extent have wages been growing in Buckinghamshire in
recent years?
Wages for both Buckinghamshire residents
£700.0
£670.8 and Buckinghamshire workers are higher
£650.0
than the national average. Buckinghamshire
£627.8
£611.8 residents earn more than those working in
£589.9 the Buckinghamshire economy .
£600.0
Between 2014 and 2020, wages within the
£550.0 £534.7
Buckinghamshire economy grew at a faster
£523.5 rate (17%) than did the wages of residents
£500.0
(10%) and wages cross the country as a
whole (13%). This could be linked to
£450.0
Buckinghamshire employers finding it
£400.0
difficult to recruit and needing to increase
2014 2015 2016 2017 2018 2019 2020 wages to attract those who could commute
to higher paying localities such as London.
Residents - Gross weekly pay (Buckinghamshire Thames Valley)
Workplace - Gross weekly pay (Buckinghamshire Thames Valley)
Workplace - Gross weekly pay (England)
Buckinghamshire has a wider gender pay gap than the national
average (25% compared to 19%). This is likely linked to the above
national average rates of women in part-time roles in
Source: Annual Survey of Hours and Earnings, 2014 - 2020 Buckinghamshire. These roles are typically lower paid.What is Buckinghamshire’s demographic profile?
Approximately 544,000 people currently live
in Buckinghamshire, of whom 60% are of
working age (lower than the national average
of 62%). Buckinghamshire has a lower 25%
proportion of 20–34-year-olds than the
national average and a greater proportion of 20%
people aged 35 and over, and under 16 (see
chart).
15%
A comparatively high proportion of the local
population are over the age of 90. Analysis
10%
by Buckinghamshire Council suggests that
between 2018 and 2038, the county will
experience a 147% growth in people aged 5%
over 90, and a 40% growth in people aged
over 60. There are also expected to be 10% 0%
more 8- to 18-year-olds, but fewer people Under 16 16-19 20-24 25-34 35-49 50-64 65+
still in the 20-35 age bracket. In 2018 there Age group (years)
were three working age people per older
Buckinghamshire England
dependent (aged 65+) in Buckinghamshire.
By 2038, this is predicted to reduce to two.
Source: ONS Mid-Year Population Estimates, 2019What is Buckinghamshire’s demographic profile? How might the age profile of the Buckinghamshire population impact economic growth and the demand for labour and skills? Ageing population An ageing population and shrinking relative size of the economically active population will have long-term implications for the health and social care sector, which has experienced a high level of strain in 2020 due to the Covid-19 pandemic. The sector has traditionally experienced recruitment difficulties, particularly in the social care segment, and in recent years has relied more and more on overseas workers to fill vacancies. The higher profile of the sector during the pandemic, and the availability of jobs, is likely to ease recruitment difficulties to some extent. Retaining staff will be key, particularly as recruiting EU citizens will be more difficult following the UK’s exit from the EU. Availability of housing The availability of housing is a challenge for economic growth and could be further impacted by an ageing population. People are living longer, and retirees often choose to continue residing in their family home rather than downsizing, due to a lack of availability of suitable housing and / or high costs of retirement homes (Demos, 2014). This creates dual pressure on councils and house builders to supply enough homes for working age families, along with supplying enough retirement homes to encourage retirees to downsize. The Aylesbury Vale area of Buckinghamshire has seen some of the highest rates of housebuilding in the country in recent years (Aylesbury Garden Town Socio-Economic Study, 2020 (forthcoming)). Much of this housing has been aimed at working age families and is therefore likely to help increase the size of the labour pool for local employers. Town centre appeal Despite being home to three Higher Education Institutions, attracting and retaining young people in Buckinghamshire has traditionally been a challenge, particularly given the social and cultural lure of London and other major cities. The lack of appeal of Buckinghamshire’s main town centres to young people is often cited as a contributary factor.
To what extent is there deprivation within Buckinghamshire?
 At an aggregate level, Buckinghamshire’s deprivation levels are low. However, there are of pockets of
 deprivation within the county (particularly in Wycombe, Aylesbury and Chesham) and there is evidence of
 inequality.
 With a 2019 Index of Multiple Deprivation (IMD) deprivation score of 10.1, Buckinghamshire is deemed the least deprived LEP
 area in England.
 None of Buckinghamshire’s neighbourhoods are included in the 10% most deprived nationally for income or employment.
 However, 6% of neighbourhoods in Aylesbury Vale, and 1% of neighbourhoods in Wycombe are in the 10% most deprived
 neighbourhoods nationally in terms of education.
 Within Buckinghamshire, pupils at non-selective schools achieve much lower attainment 8 scores than those at grammar schools,
 and leavers are less likely to continue in education. Additionally, young people eligible for Free School Meals (FSM) on average
 achieve a lower attainment 8 scores in Buckinghamshire than nationally (DfE, 2019).
 These findings are reinforced by a report from the Social Mobility Commission (2019), which found that Wycombe, South Bucks
 and Chiltern have some of the largest education gaps in England, with Chiltern having the lowest social mobility in England.
Section 3: Skills supply
How qualified is the local labour pool?
                                                                           45% of Buckinghamshire’s working age population have a
 50%                                           45%                         Level 4 or higher qualification (see chart). The majority of
 45%
                                                  40%                      these people will be degree holders. This is five percentage
 40%
 35%
                                                                           points higher than the national average. A similar
 30%                                                                       proportion are qualified to Level 2 and 3 as the national
 25%                                                                       average, whilst fewer have no qualifications or are qualified
 20%                      16%16%    17%17%                                 to Level 1.
 15%
                  9%10%                                                    The table below describes what these levels mean in
 10%     6% 7%                                                   5%
                                                                      7%
                                                         2% 3%
                                                                           practice.
  5%
  0%                                                                       There tends to be higher demand from employers for
                                                                           people with higher-level technical qualifications (at Levels
                                                                           3, 4 and 5) than the number of people achieving or entering
                                                                           the labour market on achieving qualifications at these
                                                                           levels.
                          Buckinghamshire    England                       Sectors in which there is a high demand for people with
                                                                           qualifications at higher technical level include: high
       Level         Description                                           performance engineering, space, film and TV and digital
                                                                           technologies.
       Level 1       Fewer than 5+ GCSEs / NVQ 1
                                                                           In some sectors, employers seek recruits who hold a
       Level 2       5+ GCSEs / NVQ 2 or equivalent                        degree, despite a degree not necessarily being required to
       Level 3       2+ A-levels / NVQ 3 or equivalent                     undertake the role.

       Level 4+      HNC, HND, NVQ 4 and 5, degree or higher                   Source: Annual Population Survey (Oct 19 – Sept 20), ONS
Who are Buckinghamshire’s main providers of education and training?
Secondary schools Higher Education (HE)
Buckinghamshire is one of the last remaining counties in England Buckinghamshire has three Higher Education Institutions:
where education is selective. There are 13 grammar schools and
21 upper schools in the County. The County also has one Free • University of Buckingham
School and one University Technical College (Buckinghamshire • Buckinghamshire New University
UTC - which focuses on construction and digital provision) • National Film and Television School
The University of Bedfordshire also has a presence in the County,
Further Education (FE)
delivering nursing and midwifery qualifications from its Stoke
Mandeville campus.
Buckinghamshire College Group is the largest provider of 16-18
full-time education and training in Buckinghamshire, with 30% of
the county’s 16–18-year-olds studying at the college. Adult Education
The College also caters for adult (19+ learners). Buckinghamshire has a County-wide adult education service -
Buckinghamshire Adult Learning.
Apprenticeships Bordering Bucks
Buckinghamshire College Group is the largest provider of In addition to the above, the Silverstone UTC, the South Central
apprenticeship training within Buckinghamshire. A significant Institute of Technology and Henley Business School are situated
proportion of apprenticeship provision in Buckinghamshire is on the Buckinghamshire border.
delivered by out of area providers.
Pinewood Studios
There are a dozen private training companies serving the creative
industries and its supply chain located at Pinewood Studios.Who are Buckinghamshire’s main providers of education and training?
What do young people in Buckinghamshire do after Year 11, or after
16-18 education?
 Following Year 11 (Key Stage 4), in 2018/19 most young people               80%
                                                                                                68%
 from state funded mainstream schools (64%) entered a school sixth           70%
 form. This much higher than the national average of 38%.                    60%
 Nationally, more young people entered Further Education (35%                50%
                                                                                                                38%
                                                                             40%
 compared to 22% in Buckinghamshire) and Sixth Form Colleges
                                                                             30%
 (13% compared to 4% in Buckinghamshire). Overall, 91% entered
                                                                             20%
 sustained education in Buckinghamshire, compared to 87%                     10%
 nationally. Moving into apprenticeships and employment are less              0%
 common in Buckinghamshire than nationally.                                               Enter school sixth form after Y11

 Source: Key Stage 4 destinations, DfE, 2020                                               Buckinghamshire      England

                                                                The university destination is deeply ingrained in Buckinghamshire as
        70%               62%                                   the pathway of choice after school, and to a lesser extent after
        60%                              54%
                                                                college. In 2018/19, 62% of young people in Buckinghamshire went
        50%                                                     from a state funded mainstream school to university, much higher
        40%                                                     than the national average of 54%.
        30%
        20%                                                     Over a third (36%) of those leaving college in Buckinghamshire in
        10%
                                                                2018/19 entered work, higher than the national average of 28%,
                                                                and likely a reflection of the vocational focus of Buckinghamshire
         0%
                      Go to University after school
                                                                College Group.

                    Buckinghamshire       England               Source: 16-18 destinations, DfE, 2020
What are Buckinghamshire’s apprenticeship take-up and achievement
levels?
Number of apprenticeship starts
2016/17 to 2019/20
2016/17 2017/18 2018/19 2019/20
change
Buckinghamshire 2,960 2,600 2,860 2,270 -23%
England 494,880 375,760 393,380 322,530 -35%
Source: Apprenticeship statistics, DfE
Buckinghamshire has historically had a small but stable number of people taking apprenticeships. Pre-Covid-19, there were fewer
apprentices in the local workforce than the national average, and fewer young people choosing apprenticeships at the ages of 16 or 18.
Apprenticeships starts decreased between 2016/17 and 2019/20, likely due to funding reforms, including the introduction of the
Apprenticeship Levy. However, starts did not decreased in Buckinghamshire as sharply as they did nationally. With numbers down 23%
in Buckinghamshire compared to 35% nationally.
In 2019/20 a higher proportions of apprenticeship achievements in Buckinghamshire were in ‘Information and Communication
Technology’ (9%) and ‘Health, Public Service and Care’ (25%) apprenticeships compared to the national average (6% and 23%
respectively).
There were fewer ‘Engineering and Manufacturing Technology’ apprenticeship achievements in Buckinghamshire than nationally (14% v
18%), despite relatively high levels of demand from employers. Local intelligence suggests that Buckinghamshire had a strong Level 2 /
Level 3 engineering training base until 2007 when funding cuts led to a decline in provision. There were also fewer construction
apprenticeship achievements in Buckinghamshire in 2019/20 than nationally (3% versus 6%). This is a concern given the high number of
construction job openings the County is expected to see over the next decade as a result of major infrastructure works and house
building programmes.How have apprenticeship reforms and the Covid-19 pandemic affected the take-up of apprenticeships in Buckinghamshire? Apprenticeship reforms Several reforms to apprenticeships came into effect in 2017. These included a move to employer designed standards, a requirement for 20% off-the-job training and the introduction of a levy for larger employers. Buckinghamshire has a relatively small number of apprenticeship levy paying organisations (estimated to be in the region of 280), and a disproportionately high number of SME, particularly micro-sized businesses, who typically need more support to recruit and manage apprentices. In terms of the impact of reforms, local providers report witnessing greatest change amongst large employers wishing to spend their levy. Within the public sector in particular, employers such as the local health trust and the police force have been keen to grow apprenticeship provision to spend their levy. Further reforms were announced at the Spring 2021 budget. These include apprenticeship levy transfer changes and increased financial incentives for smaller employers to take on new apprentices. Impact of Covid-19 Covid-19 negatively impacted the apprenticeship experience for some of those part-way through their apprenticeships and led to a decrease in the number of new apprenticeship vacancies (an estimated drop of 45% in 2020 in Buckinghamshire compared to 2019). Some apprentices were furloughed, whilst others had their on and off-the-job activities re-timetabled to fit with the situation the sector they were working in was facing (for example, health and social care apprentices were required to work rather than study, whilst some construction apprentices were required to study rather than work).
What subjects have been studied by those graduating from
Buckinghamshire’s Higher Education Institutions?
                                                                                          In 2018/19, Higher Education qualifiers (those successfully
                                                                                          completing Higher Education qualifications) from Buckinghamshire
             Medicine and dentistry          2%                                           HEIs were concentrated in three subject areas: business and
         Subjects allied to medicine                                          22%         administrative studies (24%), subjects allied to medicine (22%) and
                 Biological sciences                    7%                                education (20%). In contrast, the proportion of Higher Education
                 Veterinary science     0%
   Agriculture and related subjects     0%
                                                                                          qualifiers in England are distributed across a wider range of subject
                   Physical sciences    0%                                                areas, with smaller concentrations in business and administrative
             Mathematical sciences      0%                                                studies (18%), subjects allied to medicine (11%) and education
                  Computer science           3%
                                                                                          (8%).
        Engineering and technology           2%
Architecture, building and planning     0%                                                The high number of qualifiers undertaking subjects related to
                       Social studies                  6%
                                 Law          3%
                                                                                          business and administrative studies is attributed to the presence of
Business and administrative studies                                                 24%   the University of Buckingham Business School, along with a range
         Mass communications and…                  5%                                     of business degrees offered by Buckinghamshire New University.
                          Languages      1%
Historical and philosophical studies      2%                                              Undergraduate health and medical courses within Buckinghamshire
            Creative arts and design              4%
                                                                                          are provided by the University of Buckingham (Medical School),
                           Education                                         20%
                           Combined     0%                                                Bucks New University (nursing, health and social care, health and
                                                                                          social science, operating department practice, public health) and
                                    0        200        400   600   800   1,000 1,200
                                                   Number of HE qualifiers
                                                                                          the University of Bedfordshire (Stoke Mandeville campus) (nursing
                                                                                          and midwifery).
                                                                                          The newly established Buckinghamshire Health and Social Care
 Source: HESA, 2018/2019 qualifiers (published 2020)                                      Academy helps facilitate partnership working between these
                                                                                          institutions and health providers.
You can also read