Modeling pluralism and self regulation explains the emergence of cooperation in networked societies - Nature
←
→
Page content transcription
If your browser does not render page correctly, please read the page content below
www.nature.com/scientificreports
OPEN Modeling pluralism
and self‑regulation explains
the emergence of cooperation
in networked societies
Dario Madeo1, Sergio Salvatore2*, Terri Mannarini3 & Chiara Mocenni1
Understanding the dynamics of cooperative behavior of individuals in complex societies represents
a fundamental research question which puzzles scientists working in heterogeneous fields. Many
studies have been developed using the unitary agent assumption, which embeds the idea that when
making decisions, individuals share the same socio-cultural parameters. In this paper, we propose
the ECHO-EGN model, based on Evolutionary Game Theory, which relaxes this strong assumption
by considering the heterogeneity of three fundamental socio-cultural aspects ruling the behavior of
groups of people: the propensity to be more cooperative with members of the same group (Endogamic
cooperation), the propensity to cooperate with the public domain (Civicness) and the propensity to
prefer connections with members of the same group (Homophily). The ECHO-EGN model is shown to
have high performance in describing real world behavior of interacting individuals living in complex
environments. Extensive numerical experiments allowing the comparison of real data and model
simulations confirmed that the introduction of the above mechanisms enhances the realism in the
modelling of cooperation dynamics. Additionally, theoretical findings allow us to conclude that
endogamic cooperation may limit significantly the emergence of cooperation.
The modelling of the evolution of cooperation in social networks is a consolidated stream of research at the
boundary of mathematics and social sciences. The main focus of this line of work is the understanding of how
cooperation can develop in a population of agents based on selfish motivations. Evolutionary Game Theory
assumed the role of main framework (e.g.1), with many studies adopting the Prisoner Dilemma as analytical tool
to model the emergence of mutually beneficial interactions among decision m akers2–7.
These studies model the population dynamics under the basic assumption of the unitary agent, namely the
idea that the social network is comprised by agents following the same model of decision making, based on the
optimization of own utility. This assumption finds expression in two main computational settings—first, the
invariance of the decision-maker—i.e. all agents follow the same model of choice, for instance that based on the
maximization of utility; second, the well-mixed population design—i.e. the fact that the agent has generally the
same chance of interaction with all others.
The first aspect has been relaxed in several studies, where individuals with heterogeneous decision making
rules—for example, that players use different types of payoff matrices8,9, or heterogeneous decision-making
functions10,11—have been considered. Moreover, it has been shown that cooperation is fostered when imitative
and innovate decision-making r ules12 coexist.
Regarding the second aspect, it has to be noted that in recent years more complex models of population
have been introduced, characterized by spatial structures, like l attices13. Additionally, more complex organized
structures have been taken into account, assuming that agent interactions take place according to the topology
of a network of inter-connections (e.g.6,7,14). Remarkably, the degree distribution of the underlying network is
able to affect the game dynamics14–16.
These developments provided a contribution to overcome the idealized approach implied in the unitary agent
assumption that limits the realism of research and therefore the chance to model natural social settings for the
sake of understanding the current and future actual evolution of historically concrete human groups, which are
1
Department of Information Engineering and Mathematics, University of Siena, Via Roma, 56, 53100 Siena,
Italy. 2Department of Dynamic, Clinic and Health Studies, Sapienza University of Rome, Via degli Apuli, 1,
00183 Rome, Italy. 3Department of History, Society and Human Studies, University of Salento, Via di Valesio,
73100 Lecce, Italy. *email: sergio.salvatore@uniroma1.it
Scientific Reports | (2021) 11:19226 | https://doi.org/10.1038/s41598-021-98524-5 1
Vol.:(0123456789)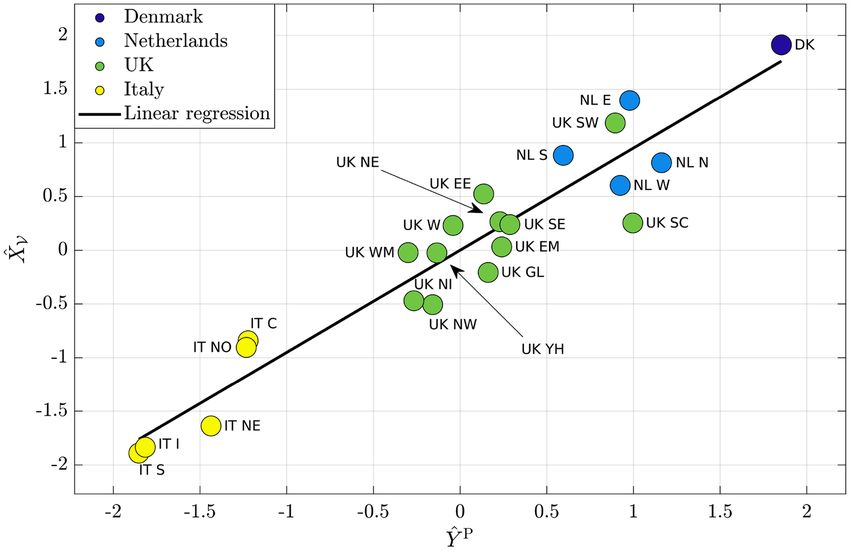
www.nature.com/scientificreports/
inherently plural (e.g.17–19). The latter aim requires an output-centered approach, namely an approach which is
mainly interested in understanding the potential evolution of given input states, and to draw from it the identi-
fication of structural and individual conditions improving the overall level of cooperation.
The aim of this paper is to present a contribution in that direction, by proposing an evolutionary game model
of cooperation that takes into account the self-regulation characteristics of the actors and the cultural plural-
ism of societies. The model, called ECHO-EGN, integrates the psycho-social theory of the inherent pluralism
of social networks in the framework of Evolutionary Game Theory. ECHO-EGN is an output-centered model,
which is expected to have both theoretical and application values. From a theoretical perspective, it increases
the ecological validity of current models, and in so doing it makes the formal analysis of cooperative dynamics
more complete. From an application standpoint, it enables efficacious simulations of the evolution of cooperative
scenarios for the sake of policy decision making.
The purpose of the paper is twofold. First, it intends to present and to validate ECHO-EGN; second, based on
this first result, it analyses the model in order to highlight its capacity to identify relevant conceptual properties
of the evolution of cooperation in social networks.
The paper is organized in the following way. First, we discuss critically the unitary agent assumption in
the light of the psycho-social conceptualization of the relation between mind, culture and society. Second,
the ECHO-EGN model is presented, proposed as an extension of a previous model (EGN) aimed at accounting
for the presence of different groups of agents. Third, an empirical validation of the model is provided, based
on a simulation design—the observed levels of cooperation in a cluster of actual social networks is compared
with the levels obtained by corresponding ECHO-EGN simulations. Fourth, analytic components of the model
are developed in order to shed light on the properties of cooperative dynamics. Discussion and conclusions are
devoted to highlighting the elements of interest of ECHO-EGN as well as limitations and perspectives of the
current stage of its development.
The cultural variability of social networks
The last three-four decades have witnessed the progressive rediscovering of the role culture plays in political
and economic affairs by all social sciences (e.g.20–24). At the boundaries between psychology, economics, politi-
cal science and sociology, the concept of social c apital25,26 has provided a view of social behavior, and more in
general of the functioning of society and institutions, as depending on the incidence of trust—namely, a factor
deeply rooted in cultural contexts.
Within this general perspective, several authors have proposed a view of culture as the source of human
variability. According to this view, culture is a network of complementary and conflicting meanings (e.g.17,24);
members of a population share the same network of meanings, yet they assume different positions in it—i.e.
they adhere to a certain subset of meanings (e.g. a given worldview27, a system of values23), thus rejecting the
conflicting ones. As result, each subset of meanings frames the way of thinking and acting of the segment of the
population adhering to it. In doing so, the shared network of meanings works as both the basic common ground
and what makes members of the social group different from each other.
ECHO-EGN focuses on three major sources of cultural pluralism of the social group (for a recent analysis of
the role these three factors play in the cultural differentiation of a set of European societies, s ee28,29).
Homophily. Homophily is the propensity of an individual to prefer connections with members of the same
group instead of the out-groups. For instance, McPherson and colleagues(30, p. 416) define it as the tendency for
friendships “between similar people [to occur] at a higher rate than among dis-similar people”. As it was high-
lighted (e.g.31,32) Homophily is distributed heterogeneously within the social group, as a result of cultural drivers.
Endogamic cooperation. Here we use this concept in the broad sense, to denote the propensity to be
more cooperative with members of one’s group than with members of other groups. Cultural segments differ as
to the degree of endogamic cooperation. Familist c ultures33 as well as cultures fostering identity m
otives34 tend
to increase the member’s endogamic cooperation, namely to make them more inclined to cooperate with in-
group members than with out-group members. In contrast, universalist values make adherents cooperate with
in-group and out-group similarly35.
Civicness. Any social interaction is embedded in a web of institutions—formal and informal norms and
underpinning meanings that make individual actions interconnected. As used here, Civicness consists of the
valorisation of such embeddedness34,36. Accordingly, Civicness can be conceived of as the extension of the pro-
pensity to cooperate to the public domain—namely, to the relation with what is extraneous (17, chapter 9): it
consists of the actors’ capacity of self-regulation, by reason of the rules of the collective game underlying the
production of common goods37.
Evolutionary games for culturally plural social groups: the ECHO‑EGN Model
The ECHO-EGN Model is a development of a previous model. In its first version—the Evolutionary Game
on Network equation (EGN), it was designed to account for specific characteristics of individuals, beyond the
assumption of the unitary agent. EGN described the dynamical evolution of the cooperation of each player,
located inside a network of connections, which is engaged in several 2-player games with neighbors over time.
Thus, EGN introduced a variable distribution of connections in the mathematical modelling of social networks
(cf.38,39). A further element able to foster the presence of differences among individuals was introduced in subse-
quent papers, where self-regulation mechanisms were considered in the framework of the prisoner’s dilemma40.
Scientific Reports | (2021) 11:19226 | https://doi.org/10.1038/s41598-021-98524-5 2
Vol:.(1234567890)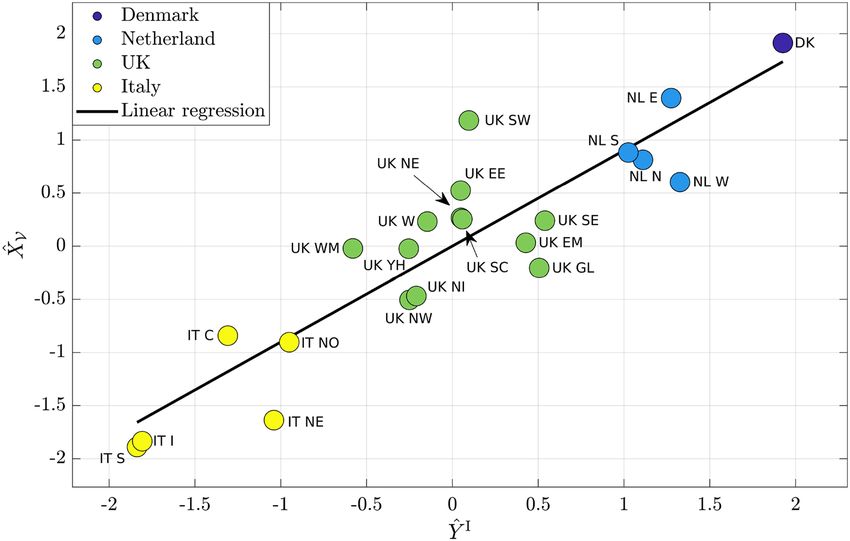
www.nature.com/scientificreports/
Specifically, the self-regulation mechanisms act as fundamental drivers able to promote cooperation at the local
and global levels41.
The extended version of the original model (called SR-EGN)41 considers a population of N individuals,
v ∈ {1, . . . , N} = V arranged on an undirected graph of connections, defined by the symmetric adjacency matrix
A = {av,w } ∈ {0, 1}N×N . When av,w = 1, then v and w are neighbors, while av,w = 0 means that v and w are not
connected. We will refer to the number of neighbors of a generic player v as its degree, then kv = N v=1 av,w .
The topology of the connection network among individuals is assumed to be random with a scale-free distri-
bution and average degree k3,42,43. Of note, the random distribution makes agents differ as to their connectivity;
this is consistent with the assumption that connectivity is distributed heterogeneously over the social group, as a
result of cultural norms—(e.g.31,32). Moreover, assumption of a power-law distribution of connections (scale-free
network) is grounded on well-established findings on real world c ommunities42. This fact has been also confirmed
in other studies, when heterogeneous groups are present within the social n etwork46.
Each member of the population plays 2-player games with all its neighbors continuously over time. The
games played are assumed to be Prisoner’s dilemmas, where the payoff earned by player v against w is described
by the matrix:
R S
Bv,w = v,w v,w ,
Tv,w Pv,w
where Rv,w is the reward for mutual cooperation, Tv,w is the temptation to defect when the opponent cooperates,
Sv,w is the sucker’s payoff earned by a cooperative player when the opponent is a free rider, and Pv,w is the punish-
ment for mutual defection. A Prisoner’s dilemma game is characterized by the relation Tv,w > Rv,w > Pv,w > Sv,w .
In this work, we assume that Rv,w = 1, Pv,w = 0, Tv,w > 1 and Sv,w < 0. Moreover, we assume that the temptation
to defect is stronger than the fear of being betrayed, i.e. Tv,w − 1 > −Sv,w.
According to41, each player plays also a game against itself, which acts as a self-regulatory term. Indeed, it
is known that in human societies and animal groups, self-mechanisms are recognized able to contrast selfish
behaviors, thus making possible the pursuit of cooperation resulting from personal awareness and culture44,45.
Using self-games is a simple way to embed into the mathematical model internal evaluations, such as “what kind
of reward would I earn if I use a given strategy against myself?”. We denote with Bv,v the payoff matrix related
to this game, and with βv the strength of the self game. Notice that the self-game can be different with respect
to the standard game41.
Thus, taken as a whole, the level of cooperation of a generic player v is denoted by xv ∈ [0, 1], and its dynamics
is ruled by the following equation:
N
ẋv = xv (1 − xv ) av,w (1 − Tv,w − Sv,w )xw + Sv,w
w=1 (1)
− βv (1 − Tv,v − Sv,v )xv + Sv,v ,
where ẋv denotes the time derivative of xv , i.e. ẋv = dxv /dt.
In a nutshell, this equation states that the steady state level of cooperation is one among full defection, full
cooperation and intermediate values of cooperation/defection. The effective level of cooperation is then reached
according to a selection mechanism ensuring the maximization of the population reward, together with the
satisfaction of self-regulation mechanisms depending on parameter βv . Thus, the latter acts as an inertial factor
able to counteract the natural tendency of individuals towards defection.
The ECHO‑EGN group‑specific features of cultural variability. In order to represent the cultural
variability of the social network—i.e. the culturally driven heterogeneous distributions of Homophily, Endo-
gamic cooperation, and Civicness among agents—the ECHO-EGN model adopts a grouped population design.
The population V is assumed to be subdivided into M groups, namely G1 , . . . , GM , such that M
g=1 g = V ,
G
and Gg ∩ Gj = ∅, for all g = j. The size of group Gg is Ng . Hence, the share of population belonging to group Gg is
N
δg = Ng ∈ (0, 1). Each group is assumed to have a scale-free distribution of the degrees, with average equal to kg .
When playing a game, the individual distinguishes between members of the same (affine) and of different
(non affine) groups. From now on, the corresponding quantities will be indicated by the superscript A for affine
players, and N for non affine players. For example, the number of links of player v with affine and
kvA and kvN are
non-affine players, respectively, i.e. kvA = w∈Gg av,w and kvN = w∈V \Gg av,w . Notice that kv = kvA + kvN.
In the following subsections, the ECHO-EGN model specifications of Homophily, Endogamic cooperation,
and Civicness will be introduced.
Homophily. As stated above, Homophily is the propensity of an individual to prefer connections with mem-
bers of the same group. In order to account for this property, a rewiring process has been carried out to modify
the initial network of connections, according to a given probability, specific for each group, and denoted by the
Homophily factor hg ∈ [0, 1]. All details on the algorithm used for the rewiring phase are given in Appendix A.
Endogamic cooperation. As stated above, Endogamic cooperation is the tendency of individuals to be more
cooperative with members of the same group (affine players). The parameter eg affects the structure of the payoff
matrix played in games with affine individuals. Specifically, given v ∈ Gg and w ∈ V with av,w = 1, we define:
Scientific Reports | (2021) 11:19226 | https://doi.org/10.1038/s41598-021-98524-5 3
Vol.:(0123456789)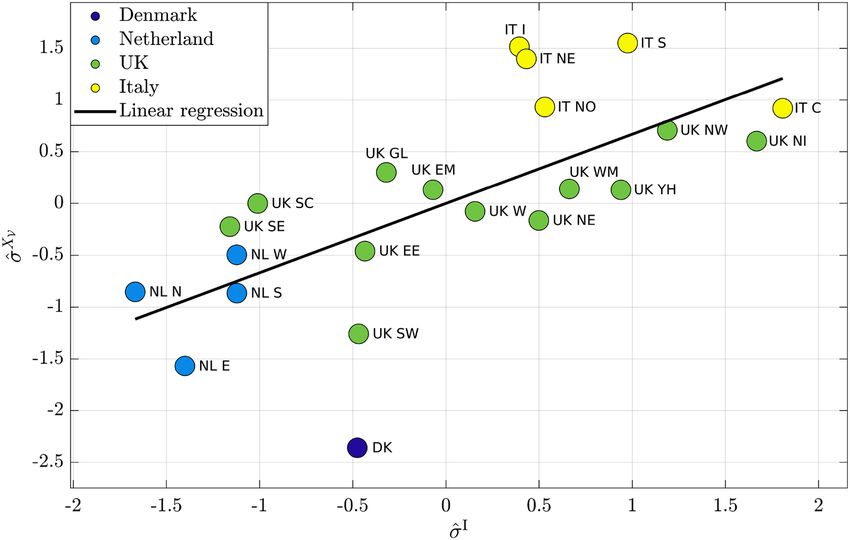
www.nature.com/scientificreports/
Figure 1. Pictorial representation of the′
function βv reported in (4) (blue) in comparison with a linear scaling
(red). βv exceeds the critical value ρ N kg for cg > 0 in the linear case (red dot), and for cg > 0.4 in the quadratic
case (blue dot).
BN if w �∈ Gg
Bv,w = ,
BA
g if w ∈ Gg
where
1 SN
BN =
TN 0
is the payoff matrix used with non affine players, and
1 SgA
BA
g = ,
TgA 0
is the payoff matrix used with affine players, where
TgA = (1 − eg )T N (2)
and
SgA = (1 − eg )SN . (3)
Coherently, the payoff matrix of the self-game is Bv,v = g.
BA
Civicness. An important assumption of the present model is that different groups show different levels of Civic-
ness, named cg . In the SR-EGN model, Civicness is naturally embodied by parameter βv , which maps the self-
regulation mechanism constraining the agent’s selfish attitude.
Moreover, we assume that all members of a given group share the same self-regulation parameter, which
depends on the Civicness value cg of the group, according to the following formula:
′ (1 + cg )2
βv = ρ N kg ∀v ∈ Gg . (4)
2
N ′
where ρ N = 1−T SN
and kg is the effective average degree of group g.
This equation assumes that the Civicness parameters cg determine an increase (when cg > 0.4), a reduction
(when cg < ′
0.4 ) or no change (when cg = 0.4 ) in the self-regulation parameters βv with respect to a critical
value ρ N kg , introduced by Theorem 5 o f41. Recalling Theorem 5′ o
f41, and assuming N
that temptation is stronger
than the fear being betrayed (T N − 1 > −SN), the quantity ρ N k , where ρ N = 1−T S N > 1, represents the average
threshold for ensuring the global asymptotic stability of the equilibrium x ALLC = [1, . . . , 1]⊤ (i.e., the steady state
where all individuals fully cooperate).
Based on this result, in the ECHO-EGN model with groups,′ we assume that the self-regulation parameter
of a player v in group g depends on the average threshold ρ N kg and on the Civicness value cg as reported in
equation (4).
Scientific Reports | (2021) 11:19226 | https://doi.org/10.1038/s41598-021-98524-5 4
Vol:.(1234567890)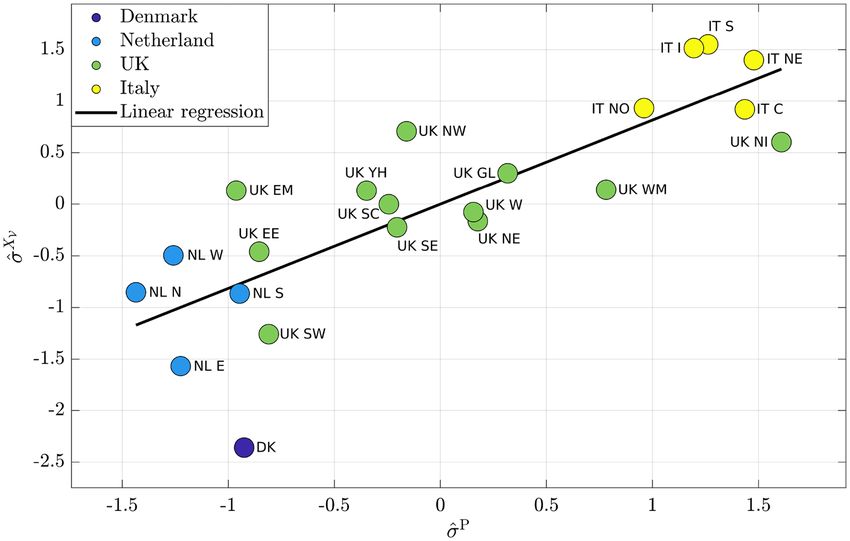
www.nature.com/scientificreports/
The meaning of the self-regulation parameters βv is discussed in section “Analytical results”. The′ choice of a
quadratic function, reported in blue in Fig. 1, is reasonable since βv exceeds′ the critical value ρ N kg for higher
values of the Civicness parameter with respect to a linear scaling factor ρ N kg (1 + cg ) (see red line in Fig. 1). In
this way, since values of βv lower than the critical value do not guarantee the convergence of the highest level of
cooperation (i.e. xv = 1), using the quadratic function (4) individuals are more free to choose their orientation
towards cooperation.
Thus, the label “ECHO-EGN” can be intended both to mean the model’s main purpose—the increase of
ecological validity—and the reference to the three parameters of cultural variability—Endogamic cooperation,
Civicness, and HOmophily.
The ECHO‑EGN equation. Using these assumptions, Eq. (1) for player v ∈ Gg can be rewritten as follows:
ẋv = xv (1 − xv ) kvA 1 − TgA − SgA x A A
v + Sg
+ kvN 1 − T N − SN x N N
(5)
v +S ,
− βv 1 − TgA − SgA xv + SgA
where
1
xA
v = av,w xw
kvA
w∈Gg
is the affine equivalent opponent of v, and
1
xN
v = av,w xw
kvN
w∈V \Gg
is the non affine equivalent opponent of v. More details are available in Appendix B.
Notice that equation (5) is similar to equation (1), provided that the Endogamic cooperation, Homophily
and Civicness parameters have been embedded, as described above.
Model setup and validation
In this section we present the empirical analyses developed for testing ECHO-EGN’s ecological validity, namely
its capacity to represent natural social networks. To this end, we adopted a simulation design—we set a cluster
of ECHO-EGN models up, in order to make each of them simulate a natural social network corresponding
to a European regional area; then, we compare the level and distribution of cooperation of the actual social
networks with those of the corresponding ECHO-EGN simulations. Moreover, in order to test that the efficacy
of the ECHO-EGN simulation was due to the parameters embedding the cultural variability (i.e. Endogamic
cooperation, Civicness and Homophily), the performance of the ECHO-EGN simulations was compared with a
control condition—namely, a corresponding simulation carried out by a model approximating the unitary agent
assumption. In what follows details, of the method and findings are reported.
The set‑up of ECHO‑EGN. The first step for setting up the parameters of the ECHO-EGN equation con-
sists of the generation of the network of connections among agents. The network is generated in two steps.
Initially, for each group g, a scale-free random network of size Ng and average degree kg is generated. Secondly,
a rewiring process is implemented for embedding the Homophily property. Further details of this procedure are
reported in Appendix A.
In order to avoid any a priori bias in the group connectivity other than the diversity due to the natural
degree distribution of scale-free networks, we assume that all groups share the same average degree, specifically
kg = k = 4. This can be done without loss of generality using the theoretical findings of41, for which the thresh-
olds for full cooperation are scalable with respect to the average degree k.
We assume that individuals play Prisoner’s dilemma games. In particular, the base payoff parameters have
been set to T N = 4 and SN = −1. The values of TgA and SgA for each group, incorporating the Endogamic coopera-
tion parameters, are reported in Table 3.
The set‑up of cultural parameters. The three cultural parameters (Homophily, Endogamic cooperation, and
Civicness) of the ECHO-EGN models were estimated in accordance to the recent cultural map of European
societies carried out by Salvatore and c olleagues28. They surveyed national representative samples of a set of
European countries.The investigation led to the identification of five basic worldviews—defined “symbolic uni-
verses”—each of them characterizing a cultural group of the population. Moreover, the study provided the dis-
tribution of the symbolic universes in each NUTS2 region (see Table 1). The distribution is given in terms of the
size of the segments of population, each of them defined by individuals characterized by one of five symbolic
universes described below.
1. Ordered universe group (G1). The world is a nice place to live; The positive view concerns every aspect: institu-
tions, services, future, perceived as trustworthy. Endorsement of transcendent values (e.g., justice, solidarity).
Scientific Reports | (2021) 11:19226 | https://doi.org/10.1038/s41598-021-98524-5 5
Vol.:(0123456789)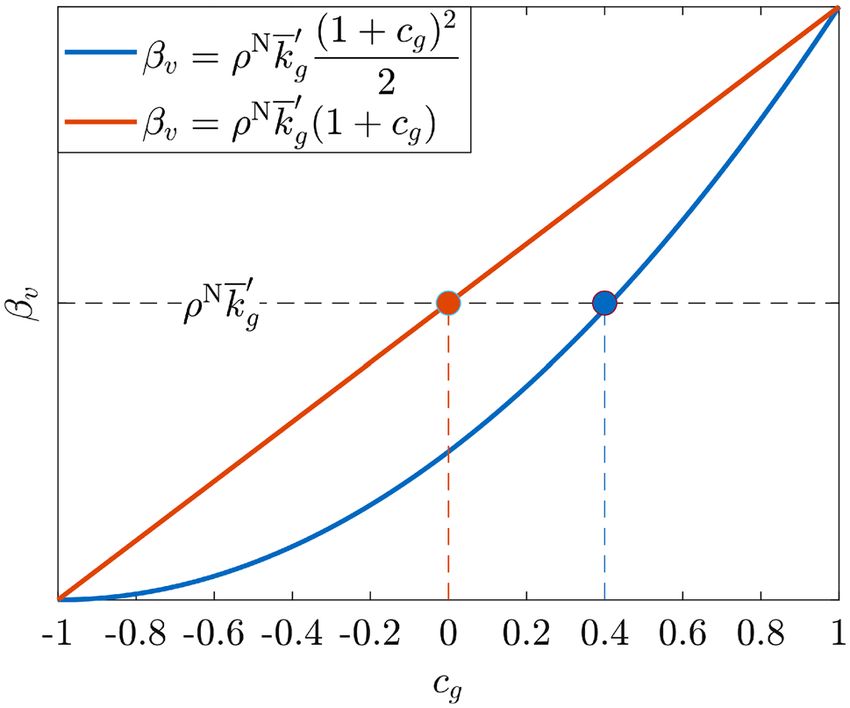
www.nature.com/scientificreports/
Region names and acronyms
Denmark Netherlands United Kingdom Italy
Denmark North Netherlands East Midlands Center Italy
(DK) (NL N) (UK EM) (IT C)
East Netherlands East of England South Italy
(NL E) (UK EE) (IT S)
West Netherlands Greater London North East Italy
(NL W) (UK GL) (IT NE)
South Netherlands North East England North West Italy
(NL S) (UK NE) (IT NO)
North West England Italian Islands
(UK NW) (IT I)
Northern Ireland
(UK NI)
Scotland
(UK S)
South East England
(UK SE)
South West England
(UK SW)
Wales
(UK W)
West Midlands
(UK WM)
Yorkshire and the Humber
(UK YH)
Table 1. The 22 regions analyzed (NUTS2 territories) divided by country.
2. Interpersonal bond group (G2). Interpersonal bonds and the emotional experience of being involved in them
is what matters in life.
3. Caring society group (G3). Institutions are responsive to individual needs. They support people in accomplish-
ing their projects.
4. Niche of belongingness group (G4 ). The world is a threatening place. The primary network is the shelter from
it. Belongingness is the way to survive.
5. Others’ world (G5). Generalized distrust, hopelessness, lack of agency, anomy. The world belongs to others,
who have power. People have to accept this situation in order to avoid suffering even more.
Symbolic universes are more than beliefs—each of them defines a mode of being-in-the-world that shapes the
actor’s way of feeling, thinking, and acting—in the final analysis, his/her social identity28. Several studies have
highlighted the role played by symbolic universes in motivating and channelling social and political behaviour.
They proved to orient voting behavior both in Italy47 and at the Brexit r eferendum48; again, they proved to be
associated with the way relevant topics (immigration, Islam, homosexuality, health, participation and democ-
racy, subjectivity) are represented in newspapers29 as well as with the attitude towards vaccination49. Moreover,
symbolic universes show different levels of trust in institutions, preference for in-group over out-group mem-
bers, sense of community, perceived quality of the interpersonal bond, attitudes towards foreigners, adhesion to
universalist versus self-centered v alues28,50
Taken as a whole, the findings reported above provide convergent support to the conclusion that the map
of symbolic universes supplies a reliable way of measuring the three parameters of ECHO-EGN which embed
cultural pluralism. For each NUTS2 population, we set the size of the ECHO-EGN groups in accordance to the
size of the symbolic universes in that population (see Table 2). Moreover, the levels of Homophily, Endogamic
cooperation, and Civicness of each ECHO-EGN cultural group was set in accordance to psycho-social and
cultural characteristics of the corresponding symbolic universes, as measured by Salvatore and c olleagues29
(Endogamic cooperation-cf. table 4.10, p. 156), and Mannarini and c olleagues47 (Homophily and Civicness: data
not reported by the study, available on request)
More particularly, each group’s Endogamic cooperation was measured in terms of the corresponding symbolic
universe’s average level of Positive Attitude Towards Foreigners (PATF). This measure is a 4-item subscale of the
Prejudice Scale estimating the self-reported propensity to engage with foreigners in social and work c ontexts51.
Accordingly, we adopt it as a proxy of the propensity to cooperate with out-group members. For the purpose of
Scientific Reports | (2021) 11:19226 | https://doi.org/10.1038/s41598-021-98524-5 6
Vol:.(1234567890)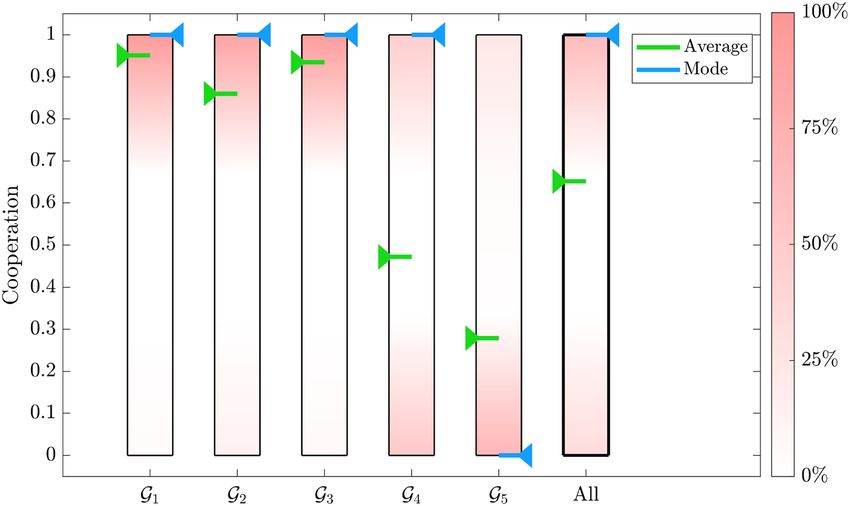
www.nature.com/scientificreports/
r Acronym δG1 ,r δG2 ,r δG3 ,r δG4 ,r δG5 ,r
1 DK 0.13 0.34 0.17 0.27 0.09
2 NL N 0.03 0.27 0.27 0.30 0.13
3 NL O 0.09 0.29 0.22 0.30 0.09
4 NL W 0.05 0.28 0.21 0.37 0.10
5 NL S 0.04 0.36 0.16 0.36 0.09
6 UK EM 0.10 0.33 0.05 0.41 0.11
7 UK EE 0.11 0.38 0.06 0.33 0.12
8 UK GL 0.13 0.32 0.06 0.32 0.17
9 UK NEE 0.11 0.34 0.07 0.35 0.13
10 UK NWE 0.10 0.22 0.08 0.49 0.11
11 UK NI 0.16 0.26 0.05 0.37 0.16
12 UK S 0.11 0.17 0.16 0.49 0.06
13 UK SEE 0.13 0.32 0.11 0.25 0.19
14 UK SWE 0.14 0.35 0.08 0.35 0.08
15 UK W 0.05 0.35 0.10 0.39 0.11
16 UK WM 0.04 0.31 0.15 0.34 0.15
17 UK YH 0.16 0.24 0.13 0.32 0.16
18 IT C 0.16 0.26 0.01 0.39 0.18
19 IT S 0.12 0.20 0.00 0.42 0.26
20 IT NE 0.11 0.22 0.02 0.42 0.23
21 IT NO 0.10 0.29 0.02 0.40 0.18
22 IT I 0.12 0.22 0.03 0.36 0.27
Table 2. Distribution of the Symbolic Universes in each of the sampled 22 regional populations. The reported
values are approximated to the second decimal place, and hence some rows may not exactly sum up to 1.
SU name eg cg hg TgA SgA
Ordered universe (G1) 0.22 0.38 0.25 3.11 −0.78
Interpersonal bond (G2) 0.37 0.06 0.48 2.52 −0.63
Caring society (G3) 0.34 0.64 0.34 2.63 −0.66
Niche of belongingness (G4) 0.51 −0.22 0.58 1.97 −0.49
Others’ world (G5) 0.71 0.90 0.52 1.17 −0.29
Table 3. Parameter setting for each Symbolic Universe. The values TgA and SgA are evaluated according to
equations (2) and (3). The value of T N is 4, while SN = −1.
1−PATF
the model, we computed the scores in accordance to the following formula: eg = 2
g
. Thus, the higher the
value of eg , the higher the Endogamic cooperation.
Homophily was measured in terms of each symbolic universe’s average level on the Ethnic scale (ES). The
Ethnic scale is one of the two subscales of the National Identity Scale52. It measures the view of identity as based
on ethnic and blood linkages, juxtaposed to the universalist view of nationality as based on adhesion to rule of
law and citizenship. Accordingly, this index lends itself to be interpreted as a proxy of the preference to relate with
the in-group with respect to the out-group (for data supporting this interpretation, s ee53 and54). For the purpose
1+ES
of the model, we computed the scores in accordance to the following formula: hg = 2 g .
Civicness was measured in terms of each symbolic universe’s average level on the Civic Involvement Scale(CIS).
The Civic Involvement Scale is a measure focused specifically on the estimation of the level of valorization of
civic rules. To fit the meaning of the measure, scores were inverted55.
Table 3 reports the values of Endogamic cooperation eg , Homophily hg and Civicness cg parameters, as well
as the the payoff parameters TgA and SgA for each symbolic universe.
Moreover, a further measure of groups was used: Individual Propensity to Cooperate (IPC). It was estimated in
terms of each symbolic universe’s average level of Agreeableness—a self-report measure of the subject’s propensity
to be trustful, open to cooperation (cf.29, p. 155). Agreeableness is one sub-scale of the TIPI questionnaire56, a
short instrument (10 items) used for assessing the Big Five dimensions of personality. IPC was used for valida-
tion purposes, rather than for setting the models’ parameters.
Estimation of the symbolic universes’ levels of attitudes towards foreigners and Agreeableness were retrieved
from Salvatore and colleagues (29, Annex 3, tables 4.3 and 4.10); data concerning the Ethnic Scale and the Civic
Involvement Scale were obtained from Mannarini and c olleagues47, a study performed on an Italian sample.
Scientific Reports | (2021) 11:19226 | https://doi.org/10.1038/s41598-021-98524-5 7
Vol.:(0123456789)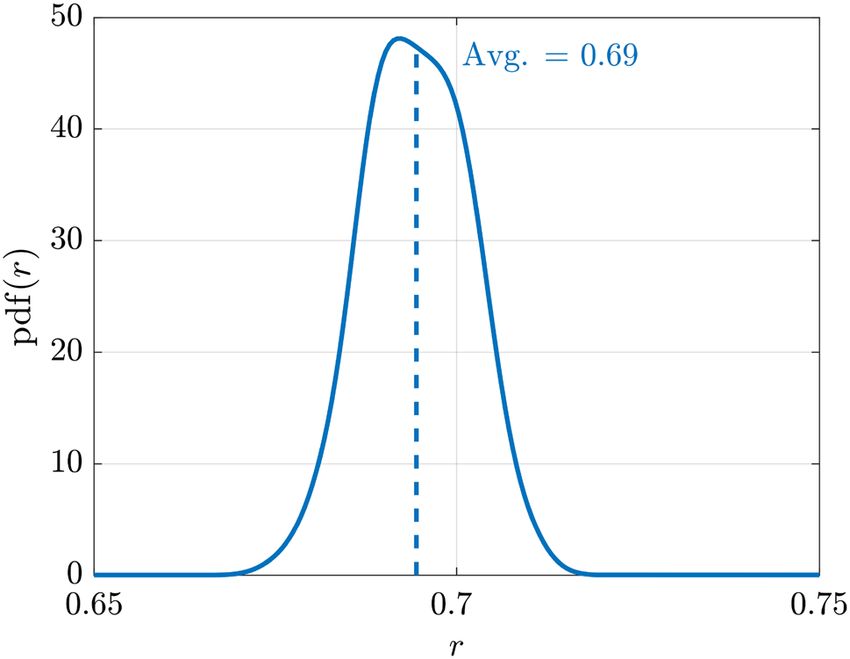
www.nature.com/scientificreports/
(a)
Region YP YI σP σI
DK 20.20 42.31 4.44 11.86
NL N 18.83 38.45 4.09 10.32
NL E 18.46 39.23 4.24 10.67
NL W 18.35 39.47 4.21 11.03
NL S 17.70 38.05 4.42 11.03
UK EM 16.99 35.22 4.41 12.39
UK EE 16.79 33.42 4.49 11.92
UK GL 16.84 35.59 5.28 12.06
UK NE 16.97 33.43 5.19 13.12
UK NW 16.20 32.01 4.96 14.01
UK NI 15.99 32.20 6.16 14.63
UK SC 18.50 33.47 4.90 11.17
UK SE 17.09 35.74 4.93 10.98
UK SW 18.30 33.64 4.52 11.87
UK W 16.44 32.50 5.17 12.68
UK WM 15.92 30.45 5.60 13.33
UK YH 16.25 31.99 4.83 13.69
IT C 14.08 27.00 6.04 14.81
IT S 12.83 24.49 5.93 13.74
IT NE 13.66 28.27 6.07 13.04
IT NO 14.06 28.69 5.72 13.16
IT I 12.91 24.63 5.88 12.99
Table 4. Validation data: trust in people Y P, trust in institution Y I and the corresponding standard deviations
σ P and σ I for each region considered.
Group IPC αg
G1 10.00
G2 9.77
G3 10.28
G4 9.48
G5 9.75
Table 5. Validation data: IPC (agreeableness) data for each symbolic universe.
Validation dataset. We consider populations of R = 22 regions, corresponding to 22 NUTS2 territories
comprising four European countries—Denmark, Italy, Netherlands, and UK—as reported in Table 1. These
populations were selected on the basis of a convenience criterion—populations included are those for which
reliable recent information on cultural pluralism were available by Salvatore and colleagues29 and Mannarini
and colleagues47.
Indexes of population’s cooperation. As proxy of the observable level of cooperation, two ad hoc
indicators were used: Trust in people and Trust in institutions, according to the European Social Survey (ESS)
dataset57 (cf. Table 2). Hereafter, these two indicators will be referred to as Y P = [Y1P , . . . , YrP , . . . , YRP ] and
Y I = [Y1I , . . . , YrI , . . . , YRI ], where each element stands for one of the R regions considered. More specifically, the
value YrP was obtained as the sum of the 3 items concerning the perception of trustworthiness of people—(a)
people can be trusted, (b) people try to be fair, (c) people try to be helpful-, in the r-th region, and it ranges in the
interval [0, 30], while the value YrI relative to the r-th region, is the sum of the 7 EES items concerning the level of
trust in regional, national and supranational institutions—(a) country’s Parliament, (b) legal system, (c) police,
(d) politicians, (e) political parties, (f) European Parliament, (g) United Nations-, and it ranges in the interval
[0, 70]. Data from all populations were obtained by ESS round 8 (2016–2017), with the exception of Denmark,
having round 7 (2015–2016) as source (the 2016–2017 round not being available in that case). For both Y P and
Y I data, also the corresponding standard deviations, σrP and σrI for all the R regions, were considered.
All validation data Y P, Y I, σ P, σ I and α (IPC) are reported in Tables 4 and 5, respectively.
Scientific Reports | (2021) 11:19226 | https://doi.org/10.1038/s41598-021-98524-5 8
Vol:.(1234567890)www.nature.com/scientificreports/
Figure 2. Comparison of standardized dataset Ŷ P with standardized simulation X̂V.
Procedure. Using the above setup, for each region, the ECHO-EGN model (5) was simulated until a steady
state was reached. For each simulation, cultural parameters were set in accordance to the values reported in
Table 3. More particularly, for each region, several numerical experiments were performed by developing 100
numerical solutions of the model. For each solution, the initial condition provided was randomly generated with
uniform distribution in the set (0, 1)N . Analogously, in each simulation the random networks were generated
according to the procedure described in Appendix A.
Control experiment. The control experiment was developed by assuming a model of social network
approximating the unitary agent assumption. To this aim, Endogamic cooperation and Civicness parameters
were set equal to the average evaluated over the SUs, thus assuming that all players have the same behavior, inde-
pendently of the group they belong to. Practically, the Endogamic cooperation and Civicness parameters were
set equal to the average of the values reported in Table 3 for all SUs.
Finally, in order to enable the control simulation to provide between-regions variability, the Homophily
parameter was kept in the control model too. Thus, also in the control model the group differentiation was
maintained, but only for setting up the Homophily. In so doing, the control condition enabled a specific estimate
to be made of the difference of simulation performance due to two cultural parameters (Endogamic cooperation
and Civicness). Moreover, with this design, the control model was able to check the alternative hypothesis that
the efficacy of the ECHO-EGN simulation was due to the size of the groups.
For each region, the control outputs were obtained by means of the same procedure used for the ECHO-EGN
simulations, i.e. 100 experiments, with randomly generated initial condition.
Results. The average cooperation XV and its standard deviation σ XV obtained for each of the 100 numerical
solutions of the ECHO-EGN model were compared with real dataset Y P, Y I, σ P and σ I by means of the Pearson
correlation coefficient r. Moreover, the Pearson correlation coefficient was computed as a measure of the associa-
tion between the level of cooperation (i.e. the values α of IPC, reported in Table 5) of each natural group/sym-
bolic universe over the whole R = 22 sample, and the corresponding level generated by the simulation models.
Figure 2 reports, for each region, the corresponding Y P value and the asymptotic simulated cooperation
averaged over the whole population. In particular, we report their standardized version, Ŷ P on x-axis and X̂V on
y-axis, where ẑ = z−�z�
σ z . Different colors have been used to distinguish among countries: dark blue for Denmark,
light blue for Netherlands, green for UK and yellow for Italy. The black line represents the linear regression, and
its closeness to data reveal the very strong correlation between real data and model simulations. Indeed, the
slope of the regression line, corresponding to the correlation coefficient, is 0.95, while the offset is almost 0. The
p-value, indicating the statistical significance of the correlation coefficient, is 1.3 · 10−11, while R2, representing
the quality of the regression line, is 0.99. It is interesting to observe the presence of clusters, clearly identifying
each country considered on both real data and model simulations. Denmark and Netherlands exhibit the highest
levels of cooperation, UK shows intermediate levels, while the lowest levels is observed for Italy.
In Fig. 3, standardized σ P, (σ̂ P on x-axis) and standardized σ XV (σ̂ XV on y-axis) are reported for all regions.
The slope of the regression line is 0.82, while the offset is almost 0. The p-value is 3.8 · 10−6, while R2 = 0.97.
Country clusters are present here too; in this case the highest levels of the standard deviation are shown by the
measures referring to Italy, denoting a higher heterogeneity of the Y P data and of simulated cooperation. UK
presents intermediate values, while Denmark and Netherlands prove to have the smallest ones.
Scientific Reports | (2021) 11:19226 | https://doi.org/10.1038/s41598-021-98524-5 9
Vol.:(0123456789)www.nature.com/scientificreports/
Figure 3. Comparison of standardized dataset σ̂ P with standardized simulation σ̂ XV.
Figure 4. Comparison of standardized dataset σ̂ I with standardized simulation σ̂ XV.
Similar results were obtained by analyzing Y I data. Figure 4 reports, for each region, the standardized Y I value
(Ŷ I on x-axis) and the standardized XV ( X̂V on y-axis). The slope of the regression line is 0.9, while the offset
is almost 0. The p-value is 9.8 · 10−9, while R2 = 0.99. The presence of country clusters is observed and again,
Denmark and Netherlands exhibit the highest levels of Y I data and the average simulated cooperation, UK shows
intermediate levels, while the lowest results are observed in Italy.
In Fig. 5, the standardized value of σ I ( σ̂ I on x-axis) and standardized σ XV ( σ̂ XV on y-axis) are reported
for each region. The slope of the regression line is 0.67, while the offset is almost 0. The p-value is 6.6 · 10−4 ,
while R2 = 0.89. Also in this case, highest levels of the standard deviation are reached by Italy, denoting higher
heterogeneity of data and simulations. UK shows intermediate values, while Denmark and Netherlands prove
to have the lowest ones.
The distribution of the cooperation level of each group and of the whole population observed in these experi-
ments are reported in Fig. 6, where high concentrations of individuals with a given cooperation level are repre-
sented by pink shading. Green and blue arrows denote the average and the mode calculated for each group and
over the whole population, respectively.
An additional validation was carried out by comparing the average cooperation level recorded for each group
of each simulation model and the average Individual Propensity to Cooperate (the variable α of Table 5) of
Scientific Reports | (2021) 11:19226 | https://doi.org/10.1038/s41598-021-98524-5 10
Vol:.(1234567890)www.nature.com/scientificreports/
Figure 5. Comparison of standardized dataset σ̂ I with standardized simulation σ̂ XV.
Figure 6. Distribution of the cooperation level of each group and of the whole population. Data refer to the
asymptotic cooperation of players belonging to all 22 regions, obtained by the 100 trials.
each corresponding natural group. The corresponding estimated probability density function of the correlation
r(XG , α) is depicted in Fig. 7. The average correlation is r = 0.69.
In order to validate the choice of the parameters, we performed a control experiment as described in sec-
tion “Control experiment”. In this way, we assumed that all players behave in the same way with respect to the
external individual (i.e. constant Endogamic cooperation), and with respect to their attitude to self-regulation
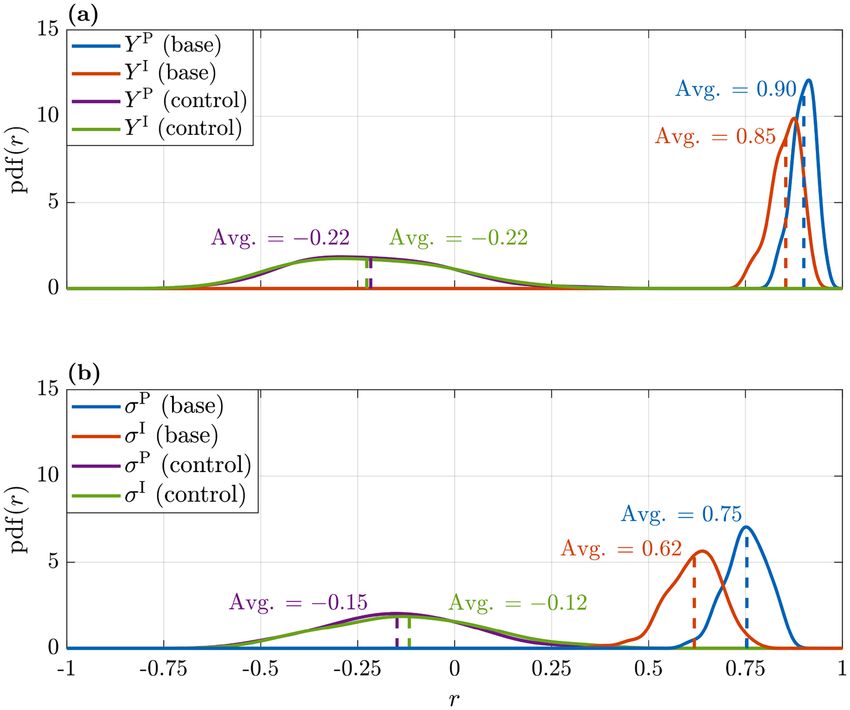
of defection (i.e. constant Civicness). Figure 8.a reports the estimated probability density function (pdf) of the
correlation coefficients r(XV , Y P ) (blue for the base experiment, purple for the control one) and r(XV , Y I ) (red
for the base experiment, green for the control one), while Fig. 8.b shows the estimated pdf of the correlation
coefficients r(σ XV , σ P ) (blue for the base experiment, purple for the control one) and r(σ XV , σ I ) (red for the base
experiment, green for the control one). The average correlation values correspond to the dashed vertical lines.
The highest correlations are observed for both the dataset Y P (r = 0.93) and σ P (r = 0.75) in the base experiment
(blue), while the control experiment (purple) produces uncorrelated results (r = −0.22 for Y P and r = −0.15
for σ P). High significant correlations are also found for the Y I (r = 0.85) and σ I (r = 0.65) datasets, while in the
control experiment we observe low values (r = −0.22 for Y I and r = −0.15 for σ I). It is clear that in all cases
investigated, the performances of the control experiment are much lower than those of the base model, where
Scientific Reports | (2021) 11:19226 | https://doi.org/10.1038/s41598-021-98524-5 11
Vol.:(0123456789)www.nature.com/scientificreports/
Figure 7. Probability density functions over 100 experiments of the correlations between the average group
cooperation XG and the IPC dataset α centered on the average correlation.
Figure 8. Probability density functions over 100 experiments. Subplot (a): correlations of model simulations
and Y P and Y I datasets (r(XV , Y P ) in blue and r(XV , Y I ) in red). The probability density functions obtained
with the control experiments are reported in purple and in green. In this case, eg = 0.43 ∀g and cg = 0.13 ∀g .
Subplot (b): correlations model simulations and the standard deviation of σ P and σ I datasets x (blue and red for
the base experiment, purple and green for the control one). Dashed vertical lines are centered on the average
correlations.
the different values of Endogamic cooperation and of Civicness are considered. One can also observe that the
dispersion of the distributions reported in panel (a) are lower than the ones reported in panel (b).
Discussion. The output of the simulation study provided convergent support to the ecological validity of
ECHO-EGN. The very high correlations between the level of cooperation of the natural groups and the cor-
responding ECHO-EGN models showed that the latter is able to simulate natural social networks quite effica-
Scientific Reports | (2021) 11:19226 | https://doi.org/10.1038/s41598-021-98524-5 12
Vol:.(1234567890)www.nature.com/scientificreports/
ciously. The ECHO-EGN’s simulation capacity resulted almost absolute when the trust in people index is used
(r = 0.93); it is however very high (r = 0.85) in the case of the trust in institution index. This difference may be
due to the fact that in the latter case the index involves institutions that are transversal to the territorial popula-
tions (e.g. European Union and United Nations) and therefore could be less reflective of the specificity of each
local population. The high correlation between the natural and simulated within-population variability of the
cooperation (r = 0.75 and r = 0.65, respectively for trust in people and trust in institutions) provides further
support to the ECHO-EGN ecological validity—this result highlights that the ECHO-EGN is not only able to
simulate the global cooperation level of the natural social networks, but also, more importantly, its distribution
within the population.
Again, it is worth noticing that the ECHO-EGN model proved able to simulate quite efficaciously the coop-
eration of the five segments of natural social groups defined by the symbolic universes (r = 0.69) too. This is a
further cross-validation of the ECHO-EGN, provided by an indirect source—namely an independent measure
(Individual Propensity to Cooperate) which was not involved in the model set-up.
This convergent evidence is still more significant if one considers that no fine tuning of the model parameters
was applied; indeed, parameters were set up by means of a priori knowledge only—i.e. the data on the size and
psycho-social characteristics of the cultural segments analyzed by Salvatore and c olleagues29 and Mannarini and
colleagues47. In this the findings of the validation test lead to conclude that the ECHO-EGN embeds significantly
the psycho-social processes, which drive the emergence of cooperation in social networks.
Finally, the fact that the control model—i.e. the model which embeds two out of three homogeneous cultural
parameters—proves to be unable to simulate natural social networks (correlation between control simulations
and actual populations is close to 0 or negative in all comparisons) supports the conclusion that the ECHO-EGN
ecological validity is due to the parameters mapping the cultural variability of population.
In sum, the main experiment presents significantly higher correlations, thus showing that the introduction of
the symbolic universes and the mechanisms of Endogamic cooperation, Civicness and Homophily in the math-
ematical model accounts reasonably well for traits which regulate the cooperative behavior in social networks.
Analytical results
Constraints on cooperation. In this section we report some theoretical results concerning the stabil-
ity of steady states of the ECHO-EGN equation (5), i.e. constant solutions to which the system dynamics will
eventually converge. These states can be found by assuming that ẋ = 0, and they embed peculiar properties of
asymptotic dynamics of individuals and population as well. In our study, we consider the steady states x ALLC and
x ALLD of system (5), which represent the situations where all players assume a fully cooperative or fully defective
asymptotic behavior, respectively.
Theorem 1 If βv > ηv ∀v ∈ V , where
1 − TN
ηv = kvA + kvN ,
1 − TgA
then the steady state x ALLC is asymptotically stable.
Remark 1 T N > TgA if and only if ηv > kv.
The Theorem essentially states that Endogamic cooperation restrains cooperation. Indeed, in a social network
without Endogamic cooperation, the asymptotic stability of x ALLC requires that the self-regulation parameters βv
exceed the degree of the player (see Theorem 3 in41). On the other hand, since ηv > kv in accordance to Remark 1,
to guarantee the asymptotic stability of the fully cooperative steady state x ALLC in presence of endogamic groups,
the members of these groups must have stronger self-regulation parameters, although they show a reduced
temptation to defect when playing with the members of the same group (TgA < T N).
Theorem 2 If βv < ζv ∀v ∈ V , where
SN
ζv = kvA + kvN ,
SgA
then the steady state x ALLD is asymptotically stable.
Remark 2 |SN | > |SgA | if and only if ζv > kv.
The Theorem essentially states that Endogamic cooperation fosters defection. Indeed, in a social network
without Endogamic cooperation, the asymptotic stability of x ALLD requires that the self-regulation parameters βv
is below the degree of the player (see Theorem 4 in41). On the other hand, since ζv > kv in accordance to Remark
2, despite the fact that affine players have less fear of being betrayed by individuals belonging to the same group
than all other individuals (|SgA | < |SN |), their behavior is still defective for larger values of the self-regulation
parameter than when all players use the same payoff matrix BN.
The proofs of Theorems 1 and 2 are reported in Appendix C.
Scientific Reports | (2021) 11:19226 | https://doi.org/10.1038/s41598-021-98524-5 13
Vol.:(0123456789)www.nature.com/scientificreports/
Name Avg. βv Avg. ηv Th. (1) Avg. ζv Th. (2)
βG1 16.1 5.5 Yes 5.1 No
βG2 9.6 6.2 Yes 5.4 No
βG3 15.6 6.5 Yes 5.6 No
βG4 5.3 7.8 No 6.0 Yes
βG5 10.6 41.4 No 9.8 No
Table 6. Relationship between average self-regulation parameters βv and the thresholds of Theorems 1 and
2. Col. 2: the value βv averaged over a given group, over the R = 22 regions and over the 100 trials. Col. 3:
the value of threshold ηv averaged over a given group, over the R = 22 regions and over the 100 trials. Col. 4:
Theorem 1 satisfaction (in average). Col. 5: the value the value ζv averaged over a given group, over the R = 22
regions and over the 100 trials. ηv averaged over a given group, over the R = 22 regions and over the 100 trials.
Col. 6: Theorem 2 satisfaction (on average).
Theorem interpretation. It is interesting to investigate the relationship between values of parameters βv
and the thresholds found in Theorems 1 and 2.
To this end, in Table 6 the self-regulation parameters βv , averaged over the regions and the simulation trials,
are reported in column 2 for each group. Moreover, these values are compared to the same averages of threshold
ηv , found in Theorem 1 (column 3). Additionally, the Theorem 1 satisfaction is indicated in column 4 for each
group. We observe that, on the average, all groups except for G4 and G5 satisfy Theorem 1. Columns 5 and 6
report similar results on full defection, related to Theorem 2. Notice that in this case, “yes” means that the value
of column 2 is lower than the value in column 5, and “no” the opposite, as shown in column 6. Only group G4
satisfies the requirements of Theorem 2. This means that for this group it is not only more difficult to cooperate,
but it is also more easier to defect.
Discussion. The formal analysis of ECHO-EGN leads to a rather counter-intuitive conclusion. The fact that,
as Theorem 1 states, Endogamic cooperation reduces the global level of cooperation, means that the in-group
identity and therefore in-group solidarity promotes cooperation locally (i.e. among in-group members) but
prevents it globally (i.e. at the level of the whole society). On the other hand, Theorem 2 ensures that when
Endogamic cooperation is active, the behavior of individuals can be defective even in the case of high self-
regulation. These results have a relevant theoretical implication. Indeed, it is consistent with those that criticize
the view of in-group bonds (e.g. conceptualized either as sense of c ommunity58 or bonding social c apital26) as
the lever to increase cooperation and trust in society. In opposition to this rather popular view (e.g.59,60), some
authors underline that—when not integrated by universtalist and civic attitudes and values—the involvement
in the community/in-group bonds can foster identity motives and closure towards the out-group - therefore,
paradoxically, to a global reduction of social cooperation and c ohesion61,62. Theorems 1 and 2 provide analytical
support to this criticism, by showing the role played by the relation with not-affine members and Civicness/self-
regulation as strategic resources for cooperation.
Conclusion
This paper focused on ECHO-EGN—a model of the evolution of cooperation in social networks designed to go
beyond the unitary agent assumption, which greatly weakens the realism of the analysis, reducing the ecological
validity of theoretical conclusions and related pragmatic implications.
ECHO-EGN models the variability of agents in terms of three major parameters, each of them mapping a
cultural component of the inherent pluralism of natural social networks: Homophily—i.e. preference to relate
with in-group members; Endogamic cooperation—i.e. the higher propensity to cooperate with in-group members;
the Civicness—i.e. the propensity to cooperate in the public domain. These components have been conceived as
cultural because they are fostered by cultural norms and related psycho-social drivers.
The validation test on ECHO-EGN shows that, thanks to these cultural parameters, the model reaches capacity
to simulate the level of cooperation of natural social networks—from almost full to very high, accordingly to the
index of cooperation adopted. Moreover, ECHO-EGN proves to be able to simulate efficaciously the within-pop-
ulation distribution of cooperation as well as the average level of the cultural segments’ propensity to cooperate.
The high performance on the simulation test leads to two complementary conclusions. On the one hand, it
supports the validity of the cultural parameters used by ECHO-EGN, legitimizing them as an effective way to map
the cultural and psycho-social processes underpinning the dynamics of cooperation. On the other hand, it pro-
vides further evidence of the theoretical and methodological soundness of the notion of symbolic universes28,50.
Indeed, this notion underlies the data used to set up the ECHO-EGN models simulating natural social networks.
Therefore, the success of the simulation is an indirect proof of the fact that the conceptual and methodological
concept of symbolic universe provides a valid and reliable approach to the cultural analysis of a social group.
The formal analysis of ECHO-EGN provides further food for thought. It shows that cooperation is prevented,
rather than fostered, by in-group identity and solidarity. This result is theoretically and practically relevant—it
integrates the idea of community as the fundamental resource for promoting social cooperation and develop-
ment. What the analysis specifically suggests is that valorized community bonds have to be integrated by the
restoration of forms of universalism in order to make societies more cohesive and i nclusive34.
Scientific Reports | (2021) 11:19226 | https://doi.org/10.1038/s41598-021-98524-5 14
Vol:.(1234567890)www.nature.com/scientificreports/
In general, the realism demonstrated by ECHO-EGN has important implications. At the methodological
level, it enables a forecast approach, aimed at mapping the impact of the variation of cultural factors on coopera-
tion. Such an approach could have a practical value too—it paves the way for the use of simulation and formal
analysis in the design of policies for social cohesion and cooperation. According to this view, ECHO-EGN can
be to estimate and/or to model the impact of cultural factors on the natural social networks’ level of cooperation,
for the sake of identifying critical drivers and/or setting strategic objectives and/or estimating the consequences
of interventions.
Before concluding, it is worth highlighting some limitations of the study. First, the simulation test was based
on a rather small sample of units of analysis, collected on a convenience criterion. Thus, even if the sample proved
to incorporate relevant geographical variability (it comprises territories from a Mediterranean country and
Northern-European countries as well), further analyses, based on more comprehensive samples of population
are required to support the generalization of the current conclusion. Second, the set-up of some of the cultural
parameters (more particularly, Homophily and Endogamic cooperation) were based on indirect indicators,
chosen on a criterion of convenience (i.e the availability of data). Thus, further studies are required to test dif-
ferent, more direct estimations of Homophily, Endogamic cooperation. On the other hand, it has to be noted
that if the current estimation of these two parameters should be proved to be imprecise, this would mean that
ECHO-EGN would have a further chance to empower its ecological validity. Third, the simulation test used
only two criteria (trust in people and trust in institutions) to estimate the convergence between simulated and
natural social networks. Further studies will be aimed at analyzing the ECHO-EGN’s ecological validity through
other indicators of cooperation—this will be done both to corroborate its realism and to identify the specific
aspects of cooperation the model is sensitive to. Finally, we are aware that other components of cultural pluralism
need to be taken into account, in order to enhance the ECHO-EGN ecological validity—e.g. the heterogeneous
propensity to socialize, further sources of the inherent differences in the agents’ propensity to cooperate, the
different temporality agents adopt as the frame of their decisions. The current findings of our work encourage
us to see these elements as sources of potential developments of ECHO-EGN, with the prospect of building a
mathematical model of the cultural dynamics of cooperation.
Appendix A: Network generation for grouped populations
Given the region r in the set of R = 22 populations considered in this study, we generated M = 5 scale-free net-
works, each of size Ng = δr,g N according to Table 2. The scale-free structure is obtained by employing preferential
attachment methods. In a nutshell, given the desired average degree kg , an initial fully connected network of
k
m = 2g is generated. Then, further nodes are added to the network, by connecting it via m links to the already
existing nodes. The probability that a new node is connected to one of the existing ones is proportional to the cur-
rent degree of those nodes. This procedure is repeated until the number of nodes in the networks is equal to Ng .
The networks obtained are not cross connected. In order to create inter-group links and to embed the Homo-
phily property, a rewiring process is implemented. Specifically, for each couple of connected players v and w,
where v belongs to group g, the link is removed with probability 1 − hg , and replaced by a new link between v and
a random player of a group different from g. Since the Homophily hg denotes the probability of one player being
connected to an affine one, then the probability of changing an affine link with a non affine one is 1 − hg . It can
therefore be seen that, due to the stochasticity of this process, kvA = hg kv ′and kvN = (1 − hg )kv on the average.
Due to the stochasticity of the network, the effective average degree kg of a group g is in general slightly
′
dif-
′
ferent than the average k g . To distinguish the two cases, we introduce the effective parameters k g and k as
′ ′
kg = N1g v∈Gg kv , and k = N1 v∈V kv .
According to the assumption discussed in section “Homophily”, for which the topology of the connection
network is random with a scale-free distribution, we notice that the network obtained by the above procedure
is still scale-free. Indeed:
M
�
P(kv = k) = P(kv = k|v ∈ Gg )P(v ∈ Gg )
g=1
M
�
= P(kv = k|v ∈ Gg )δg
g=1
M
� 1 2
= δg kg k−3 dk
2
g=1
M
1 � 2
= δg kg k−3 dk
2
g=1
1 2
= k k−3 dk,
2
M
2
where δg is the share of group g in the considered population and k =
δg kg is the average degree of the
g=1
resulting complete network.
Scientific Reports | (2021) 11:19226 | https://doi.org/10.1038/s41598-021-98524-5 15
Vol.:(0123456789)You can also read