Citi's 16th Annual Australian and New Zealand Investment Conference - London Presentation to Investors and Analysts 4-5 March 2019 - Macquarie Group

Page created by Franklin Sparks
 
CONTINUE READING
Citi's 16th Annual Australian and New Zealand Investment Conference - London Presentation to Investors and Analysts 4-5 March 2019 - Macquarie Group
Citi’s 16th Annual Australian and
New Zealand Investment Conference
London

Presentation to Investors and Analysts
4-5 March 2019

Sam Dobson
Head of Investor Relations
Kathryn Burgess
Chief Financial Officer, EMEA
Citi's 16th Annual Australian and New Zealand Investment Conference - London Presentation to Investors and Analysts 4-5 March 2019 - Macquarie Group
Macquarie  Citi's 16th Australian and New Zealand Investment Conference 2019  macquarie.com                         Overview of Macquarie                   Operating groups           3Q19 update               Outlook                   Appendix                 22

Disclaimer
This information has been prepared on a strictly confidential basis by Macquarie Group Limited ABN 94 122 169 279 (“Macquarie”) and may neither be reproduced in whole nor in part, nor may any of its contents be divulged, to any third party without the
prior written consent of Macquarie. Information in this presentation, including forecast financial information, should not be considered as legal, financial, accounting, tax or other advice, or a recommendation to investors or potential investors in rel ation to
holding, purchasing or selling securities or other financial products or instruments and does not take into account your particular investment objectives, financial situation or needs. Before acting on any information you should consider the appropriateness
of the information having regard to these matters, any relevant offer document and in particular, you should seek independent financial advice. All securities and financial product or instrument transactions involve risks, which include (among others) the
risk of adverse or unanticipated market, financial or political developments and, in international transactions, currency risk.
This information has been prepared in good faith and is not intended to create legal relations and is not binding on Macquarie under any circumstances whatsoever.
To the extent permitted by law, neither Macquarie nor its related bodies corporate (the “Macquarie Group”, ”Group”) nor any of its associates, directors, officers or employees, or any other person (together, “Persons”), makes any promise, guarantee,
representation or warranty (express or implied) to any person as to the accuracy or completeness of this information, or of any other information, materials or opinions, whether written or oral, that have been, or may be, prepared or furnished by Macquarie
Group, including, without limitation, economic and financial projections and risk evaluation. No responsibility or liability whatsoever (in negligence or otherwise) is accepted by any person for any errors, mis-statements or omissions in this information or
any other information or materials. Without prejudice to the foregoing, neither the Macquarie Group, nor any Person shall be liable for any loss or damage (whether direct, indirect or consequential) suffered by any person as a result of relying on any
statement in or omission from this information. The information may be based on certain assumptions or market conditions, and if those assumptions or market conditions change, the information may change. No independent verification of the information
has been made. Any quotes given are indicative only.
Other than Macquarie Bank Limited ABN 46 008 583 542 (MBL), any Macquarie group entity noted in this document is not an authorised deposit-taking institution for the purposes of the Banking Act 1959 (Commonwealth of Australia). That entity’s
obligations do not represent deposits or other liabilities of Macquarie and Macquarie does not guarantee or otherwise provide assurance in respect of the obligations of that entity, unless noted otherwise. Each of MBL, acting through its London branch,
and Macquarie Bank International Limited, is authorised and regulated by the Financial Conduct Authority and the Prudential Regulation Authority to carry on banking business in the United Kingdom. MBL, acting through its Seoul Branch, is authorised
and regulated by the Financial Services Commission in Korea to carry out banking business in Korea. MBL, acting through its Singapore Branch, is authorised and regulated by the Monetary Authority of Singapore to carry out banking business in
Singapore. MBL, acting through its Hong Kong branch, is authorised and regulated by the Hong Kong Monetary Authority to carry on banking business in Hong Kong. MBL maintains Representative Offices in Illinois, New York and Texas, but is not
authorized to conduct business in the US. With respect to matters pertaining to US securities laws, and to the extent required by such laws, Macquarie its worldwide subsidiaries consult with, and act through, Macquarie Capital (USA) Inc., a US-registered
broker-dealer and member of FINRA, or another US broker-dealer. With respect to matters pertaining to US futures laws, and to the extent required by such laws, Macquarie its worldwide subsidiaries consult with, and act through Macquarie Futures USA
Inc., a US-registered futures commission merchant and member of the National Futures Association, or other futures commission merchants.
The Macquarie Group or its associates, directors, officers or employees may have interests in the financial products referred to in this information by acting in various roles including as provider of corporate finance, underwriter or dealer, holder of principal
positions, broker, lender or adviser and may receive fees, brokerage or commissions for acting in those capacities. In additi on, the Macquarie Group and its associates, directors, officers or employees may buy or sell the financial products as principal or
agent and as such may effect transactions which are not consistent with any recommendations in this information.
Unless otherwise specified all information is as at 31 December 2018.
Certain financial information in this presentation is prepared on a different basis to the Macquarie Group Limited Financial Report, which is prepared in accordance with Australian Accounting Standards. Where financial information presented within this
presentation does not comply with Australian Accounting Standards, a reconciliation to the statutory information is provided.
This presentation provides further detail in relation to key elements of Macquarie Group Limited’s financial performance and financial position. It also provides an analysis of the funding profile of the Group because maintaining the structural integrity of the
Group's balance sheet requires active management of both asset and liability portfolios. Active management of the funded balance sheet enables the Group to strengthen its liquidity and funding position.
This presentation may contain forward looking statements including statements regarding our intent, belief or current expectations with respect to Macquarie’s businesses and operations, market conditions, results of operation and financial condition,
capital adequacy, specific provisions and risk management practices. Readers are cautioned not to place undue reliance on these forward looking statements. Macquarie does not undertake any obligation to publicly release the result of any revisions to
these forward looking statements to reflect events or circumstances after the date hereof to reflect the occurrence of unanticipated events. While due care has been used in the preparation of forecast information, actual results may vary in a materially
positive or negative manner. Forecasts and hypothetical examples are subject to uncertainty and contingencies outside Macquarie’s control. Past performance is not a reliable indication of future performance.
Any additional financial information in this presentation which is not included in the Macquarie Group Limited Financial Report was not subject to independent audit or review by PricewaterhouseCoopers.
Citi's 16th Annual Australian and New Zealand Investment Conference - London Presentation to Investors and Analysts 4-5 March 2019 - Macquarie Group
Macquarie  Citi's 16th Australian and New Zealand Investment Conference 2019  macquarie.com   Overview of Macquarie   Operating groups   3Q19 update   Outlook   Appendix            3

Agenda
  1 Overview of Macquarie
  2 Operating groups
  3 3Q19 update
  4 Outlook
  5 Appendix

                                                                                                                                                                    © MACQUARIE 2019
Citi's 16th Annual Australian and New Zealand Investment Conference - London Presentation to Investors and Analysts 4-5 March 2019 - Macquarie Group
Macquarie  Citi's 16th Australian and New Zealand Investment Conference 2019  macquarie.com   Overview of Macquarie   Operating groups   3Q19 update   Outlook   Appendix            4

01                         Overview of Macquarie

                                                                                                                                                                    © MACQUARIE 2019
Citi's 16th Annual Australian and New Zealand Investment Conference - London Presentation to Investors and Analysts 4-5 March 2019 - Macquarie Group
Macquarie  Citi's 16th Australian and New Zealand Investment Conference 2019  macquarie.com                                            Overview of Macquarie                          Operating groups               3Q19 update                    Outlook                        Appendix                 55

Macquarie overview

Diversified financial group providing clients with asset management and finance, banking, advisory and
risk and capital solutions across debt, equity and commodities
 Macquarie Group overview1                                                                                                                                                 Global locations
                   Annuity-style businesses                                                            Markets-facing businesses                                                            North
                                                                                                                                                                                                                                 Europe                                 Asia
                                                                                                                                                                                                                                   13                                    14
                        approx. 60%                                                                          approx. 40%                                                                   America                              locations                             locations
                                                                                                                                                                                             20                                                  Middle
                                                                                                                                                                                          locations                                               East
                                                                                                                                                                                                                                                    2
                                                                                                                                                                                                                                                locations

                                                                                                                                                                                                                                                                       Australia
                                                                                                                                                                                                                                                                          10
                                                                                                                                                                                                                                                                       locations
                                                                                                                                                                                          Latin                                                                                         New
                                                                                                                                                                                         America                                            Africa                                    Zealand
                                                                                                                                                                                            3                                                 2                                          1
                                                                                                                                                                                        locations                                         locations                                   location

       Listed on Australian Securities                                                       $A551.0b                                                 MBL                                                                                                15,110 employees,
          Exchange (ASX: MQG)2                                                                                                                                                            APRA primary regulator                                            operating in over
                                                                             assets under management                                                 A/A2/A
               Level I ADR: MQBKY                                                 as at 30 Sep 18                                                 credit rating                                     for MBL & MGL                                             25 countries

  Employees and global locations as at 31 Dec 18. 1. Net profit contribution is management accounting profit before unallocated corporate costs, profit share and income tax. Pie chart is based on 1H19 net profit contribution from operating groups as reported on 2 Nov 18 and has not been restated for
  business reorganisations affecting MAM, CAF and BFS that occurred during Dec 2018. 2. On 29 Jul 96, MBL listed its fully paid ordinary shares on the ASX.
Citi's 16th Annual Australian and New Zealand Investment Conference - London Presentation to Investors and Analysts 4-5 March 2019 - Macquarie Group
Macquarie  Citi's 16th Australian and New Zealand Investment Conference 2019  macquarie.com                                          Overview of Macquarie                          Operating groups              3Q19 update                    Outlook                       Appendix        66

Why Macquarie?

         Unbroken profitability                                                 Predictable earnings                                                    Geographically                                                         Strong return on equity
                                                                                 Annuity-style businesses represent
                                                                                                                                                        diverse                                                                1H19:
         1H19 net profit:                                                                                  1
                                                                                                                                                                                  international
        $A1,310m                                                                 ~60%                                                                   67%                       income in 1H19                              16.3%
         up 5% on 1H18                                                           of the operating groups’ performance
                                                                                 in 1H19                                                                67% in FY18; two-thirds of                                              16.8% in FY18
         FY18 net profit: $A2,557m                                                                                                                      income generated outside                                                up from 15.2% in FY17
         up 15% on FY17                                                          ~70%1 in FY18                                                          of Australia

         Earnings                                                               Strong financial position                                              Consistent dividend                                                     Strong shareholder
         growth                                                                 Group capital surplus
                                                                                                                                                       growth                                                                  returns

          25%                                                                  $A4.0b
                                                                                 strong funded
                                                                                                                             3
                                                                                                                                                       21%                                                                     Consistently outperformed
                                                                                                                                                                                                                               major indices since listing
                                                                                                                                                                                                                               ASX 204 – 2nd highest returns since listing

          5yr EPS              CAGR2                                             balance
                                                                                 at December 2018
                                                                                                 sheet                                                  5yr      CAGR2                                                         Diversified Financials4 – 1st
                                                                                                                                                                                                                               MSCI World Capital Markets4 – 1st
                                                                                                                                                                                                                               MSCI World Banks4 – 1st

                                      Underpinned by a long standing conservative risk management framework
   1. Based on net profit contribution from operating groups. Net profit contribution is management accounting profit before unallocated corporate costs, profit share and income tax. 2. Compound annual growth rate based on the period FY14 – FY18. 3. Calculated at 8.5% RWA including the
   capital conservation buffer (CCB), per APRA ADI Prudential Standard 110. The APRA Basel III Group capital surplus is $A5.2b calculated at 7% RWA, per the internal minimum Tier 1 ratio of the Bank Group. Based on materiality, the 8.5% used to calculate Group capital surplus does not
   include the countercyclical capital buffer (CCyB) of ~11bps. The individual CCyB varies by jurisdiction and the Bank Group’s CCyB is calculated as a weighted average based on exposures in different jurisdictions. In Nov 18 the CCyB in the United Kingdom increased from 0.5% to 1.0%
   increasing the Bank Group’s CCyB to ~11bps. 4. As at 28 Feb 19. Based on companies that have been continuously listed since Macquarie’s date of listing (29 Jul 96).
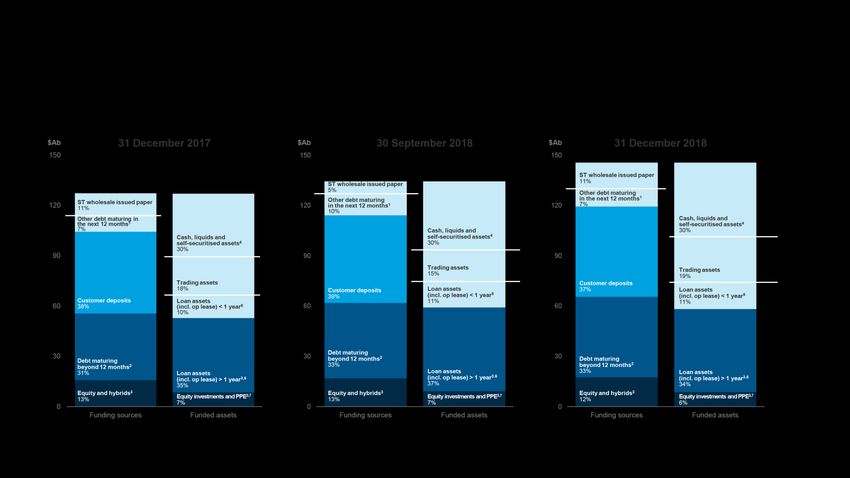
Citi's 16th Annual Australian and New Zealand Investment Conference - London Presentation to Investors and Analysts 4-5 March 2019 - Macquarie Group
Macquarie  Citi's 16th Australian and New Zealand Investment Conference 2019  macquarie.com           Overview of Macquarie         Operating groups     3Q19 update         Outlook                 Appendix   77

Macquarie’s evolution is driven by our people
Our people are closest to client needs and markets

  We seek to identify                          From positions of deep                       We are accountable                   We act with integrity and                We pursue opportunities
  opportunity and realise                      expertise, we pursue                         for all our actions to our           earn the trust of our clients,           that deliver real outcomes to
  it for our clients, community,               opportunities adjacent                       clients, our community,              colleagues, community and                achieve an appropriate and
  shareholders and                             to existing businesses,                      our shareholders and                 shareholders through the                 resilient long-term return
  our people                                   largely via organic growth                   each other                           quality of our work and our              on capital
                                                                                                                                 high ethical standards

                                                                         FY18

Evolution in the business
                                                                 67%
                                                           International income
                                                                                                                                 Group-wide standards and
                                                                                                                                 central support services
                                                                                                                                                                                                     Funding
                                                                                                                                                                                                   and capital

Macquarie has a global presence                                          FY98                                                                                     Supported
across operating groups                                                                                                                                             by the
                                                                      22%
                                                           International income
                                                                                                                                 Facilitating cross-group
                                                                                                                                 collaboration                    Corporate
                                                                                                                                                                                                       Risk
                                                                                                                                                                                                 management
                                                                                                                                                                   Centre

                                                                                                                                 Challenging ideas and                                    External stakeholder
                                                                                                                                 supporting execution                                            management

                                                                           Share of total income
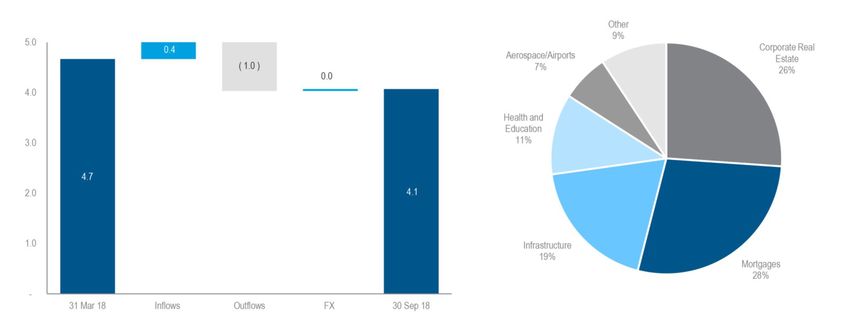
Citi's 16th Annual Australian and New Zealand Investment Conference - London Presentation to Investors and Analysts 4-5 March 2019 - Macquarie Group
Macquarie  Citi's 16th Australian and New Zealand Investment Conference 2019  macquarie.com                                                Overview of Macquarie                                       Operating groups                   3Q19 update                    Outlook                       Appendix                      88

 Unbroken profitability through adjacent growth

                                                                                                                                                                                                                                                                                                      FY16
                                                                                                                                                                                                                                                 FY07
                                                                                                                                                                                                                                                                                                             Esanda

                                                                                                                                                                                                                                                                                FY13
                                                                                                                                                                                                                                                        Thames Water1                                        Advantage Funding
                Profit                          Staff number                          Organic growth                         Acquisitions                                 Regional expansion                                                            Giuliani Capital
                                                                                                                                                                                                                                                                                       Received
                                                                                                                                                                                                                                                                                       a HK

                                                                                                                                                                                                                                                                                               FY15
                                                                                                                                                                                                                                                        Cards                          banking        AWAS          UK GIB

                                                                                                                                                                                      FY97

                                                                                                                                                                                                                                                                                                             FY17
                                                                                                                                                                                                                                                                                       license                      Cargill

                                                                                                                                                                                                                                         FY06
     $Ab                                                                                                                                                                                     IT equipment                                       Corona
                                                                                                                                                                                             financing
      2.6                                                                                                                                                                                                                                       Energy (UK)

                                                                                                                                                                                                                                                                                                                     FY18
                                                                                                                                                                               FY96
                                                                                                                                                                                                                                                                                                                            GIG

                                                                                                                                                                                                                                                        FY08
                                                                                                                                                                                        MBL listed

                                                                                                                                                                                                                                                                                FY12
      2.4                                                                                                                                                                                                                                                      Established             Onstream                                   Staff:
                                                                                                                                                                                        on the ASX
                                                                                                                                                                                                                                                               a UK bank,              MIDIS                                      14,469

                                                                                                                                                                                                                                  FY05
                                                                                                                                                                                                                                          Cook

                                                                                                                                                                        FY95
                                                                                                                                                                                                                                                               MBIL
      2.2

                                                                                                                                                                                                                                                                        FY10
                                                                                                                                                                               HK office                                                  Inlet
                                                                                                                                                                               opened                                                                                          Delaware FPK
                                                                                                                                                                                                                                          Energy
                                                                                                                                                                               DEFT                                                       Supply                               Tristone
      2.0                                                                                                                                                                                                                                                                      Mining and

                                                                                                                                                                                                                         FY04
                                                                                                                                                                                                                                ING Asian cash                                 medical

                                                                                                                                                                 FY94
      1.8                                                                                                                                                                Hills Motorway                                         equities                                       equipment
                                                                                                                                                                         Mortgage securitisation                                                                               financing
                                                                                                                                                                                                                                Gas
                                                                                                                                                                         Asset management                                                                                             Staff:
       1.6                                                                                                                                                                                                                      Railcar financing
                                                                                                                                                                                                                                                                                      14,657

                                                                                                                                                                                                                                                                                                                     1H19
                                                                                                                                                                         Premium funding                                                                                                                                    GLL

                                                                                                                    FY87

                                                                                                                                                                                                                                                               FY09
                                                                                                                           Lease                                         NY office opened                                                                             Constellation
       1.4                                                                                                                                                                                                                                                                                                                  ValueInvest

                                                                                                                                                                                                                     FY03
                                                                                                                           arranging                                                                                        Meters financing
                                                                                                                                                                                                                                                                      CAF Principal                                         Conergy
                                                                                                                                                                                                                            Oil                                       Finance
                         FY70

                                                                                                             FY86
                                                                                                                                                                                                                                                                                                                                Staff:
       1.2

                                                                                                                                                       FY93
                                   Staff:                                                                           First listed                                                                                                                                      CMA                                                       14,869

                                                                                                                                                                                                                  FY02
                                                                                                                                                               Motor vehicle
                                   4                                                                                property trust                                                                                        Sydney
                                                                                                                                                               financing
                                                                             1980’s

       1.0                                                                                                          Entered                                                                                               Airport1
                                                                                      Started
                  FY69

                                                                                                                    stockbroking

                                                                                                                                               FY92
                                                                                      commodities

                                                                                                                                                                                                      FY00
                         Hill Samuel                                                                                                                    Mortgages
                         UK opens                                                     platform                                                                                                                   Staff:
      0.8                branch office                                                Rates                                                                                                                      4,070
                                                                                                      FY85

                         in Sydney                                                                            Received an
                                                                                                                                     FY90

                                                                                                                                                                                               FY99
                                                                                      FX
      0.6                Started                                                      Futures
                                                                                                              Australian                    Aircraft
                                                                                                                                            financing
                                                                                                                                                                                                      BT Australia
                         corporate                                                                            Banking
                                                                                      Wealth                  license as                                                                              Wrap
                         finance and                                                                                                                  Staff:
       0.4               advisory;                                                    management              MBL
                                                                                                                                                      1,133
                         project finance                                                     Staff:           Equities
                                                                                                                             FY89

                                                                                             120
       0.2                                                                                                    Business               London office
                                                                                                              banking                opened

        -

                                                                           Underpinned by a strong risk management framework and capital position
Note: the above list is not exhaustive. 1. Acquired on behalf of managed funds and accounts.
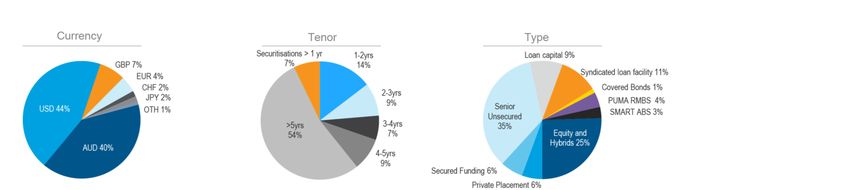
Citi's 16th Annual Australian and New Zealand Investment Conference - London Presentation to Investors and Analysts 4-5 March 2019 - Macquarie Group
Macquarie  Citi's 16th Australian and New Zealand Investment Conference 2019  macquarie.com          Overview of Macquarie     Operating groups   3Q19 update    Outlook          Appendix   99

Strong earnings growth

FY18 EPS of $A7.58                                                                                                    FY18 Operating income of $A10,920m
FY18 up 15% on FY17                                                                                                   FY18 up 5% on FY17

 $A                                                                                                                    $Am
8.00                                                                                                              12,000

7.00
                                                                                                                  10,000
6.00
                                                                                                                    8,000
5.00

4.00                                                                                                                6,000

3.00
                                                                                                                    4,000
2.00
                                                                                                                    2,000
1.00

   -                                                                                                                       -
              FY14            FY15             FY16            FY17             FY18            FY19                           FY14       FY15        FY16        FY17       FY18       FY19
                                                                                                          1H             2H
Citi's 16th Annual Australian and New Zealand Investment Conference - London Presentation to Investors and Analysts 4-5 March 2019 - Macquarie Group
Macquarie  Citi's 16th Australian and New Zealand Investment Conference 2019  macquarie.com      Overview of Macquarie         Operating groups        3Q19 update           Outlook              Appendix   10
                                                                                                                                                                                                                  10

 Macquarie's global footprint

                                                                                                                                                                                                           2

    Total staff1
                                                   Americas                                                      EMEA                                  Asia                          Australia
                                                   Staff                                                         Staff                                 Staff                         Staff
    15,110                                         2,758                                                         2,019                                 3,630                         6,703
                                                   CANADA           USA               Minneapolis                EUROPE       MIDDLE EAST              ASIA           Manila         AUSTRALIA    Newcastle
                                                   Calgary          Austin            Nashville                  Amsterdam    Abu Dhabi                Bangkok        Mumbai         Adelaide     Parramatta
                                                   Montreal         Boca Raton        New York                   Dublin       Dubai                    Beijing        Seoul          Brisbane     Perth
                                                   Toronto          Boston            Orlando                    Edinburgh                             Gurugram       Shanghai       Canberra     Sydney

    56%                                            Vancouver

                                                   LATIN AMERICA
                                                                    Chicago
                                                                    Denver
                                                                    Houston
                                                                                      Philadelphia
                                                                                      San Diego
                                                                                      San Francisco
                                                                                                                 Frankfurt
                                                                                                                 Geneva
                                                                                                                 London
                                                                                                                              SOUTH AFRICA
                                                                                                                              Cape Town
                                                                                                                              Johannesburg
                                                                                                                                                       Hong Kong
                                                                                                                                                       Hsin-Chu
                                                                                                                                                       Jakarta
                                                                                                                                                                      Singapore
                                                                                                                                                                      Taipei
                                                                                                                                                                      Tokyo
                                                                                                                                                                                     Gold Coast
                                                                                                                                                                                     Manly
                                                                                                                                                                                     Melbourne
                                                                                                                                                                                                  NEW ZEALAND
                                                                                                                                                                                                  Auckland
                                                   Mexico City      Jacksonville      San Jose                   Luxembourg                            Kuala Lumpur
    International staff                            Sao Paulo        Los Angeles                                  Madrid
                                                   Santiago                                                      Munich
                                                                                                                 Paris
                                                                                                                 Reading
                                                                                                                 Vienna
                                                                                                                 Zurich

1. As at 31 Dec 18. 2. Includes New Zealand.
Macquarie  Citi's 16th Australian and New Zealand Investment Conference 2019  macquarie.com                                             Overview of Macquarie                          Operating groups               3Q19 update                    Outlook                       Appendix                11
                                                                                                                                                                                                                                                                                                             11

Predictable earnings and geographically diverse

Annuity-style vs Markets-facing1                                                                                                                                Regional split of income2

                                   FY07                                                                        FY18                                                                        FY07                                                               FY18

                       MAM                                                                                                                                                                          Americas
                   CAF 15%                                                                                                                                                                            16%
                   4%                             CGM
                  BFS                             35%                                                                                                                       Australia3
                  6%                                                                                                                                                                                           Asia
                                                                                                                                                                              47%                              15%
                                                                                                      MAM
                              MacCap                                                                  33%                                                                                                                                                               Americas
                                                                                                                                                                                                    EMEA
                               40%                                                                                                CGM                                                                                                      Australia3                    27%
                                                                                                                                                                                                     22%
                                                                                                                                  18%                                                                                                        33%

                                                                                             CAF                                                                                                                                                                                    Asia
                                                                                             24%                              MacCap                                                                                                                                                11%
                                                                                                                               14%
                                                                                                                                                                                                                                                         EMEA
                                                                                                              BFS
                                                                                                                                                                                                                                                          29%
                                                                                                              11%

Data restated to reflect current business splits. 1. Annuity-style based on net profit contribution (calculated as management accounting profit before unallocated corporate costs, profit share and income tax) for MAM, CAF and BFS. Markets-facing based on net profit contribution for CGM and MacCap.
Data has not been restated for business reorganisations affecting MAM, CAF and BFS that occurred during Dec 2018. 2. Based on net operating income excluding earnings on capital and other corporate items. 3. Includes New Zealand.
Macquarie  Citi's 16th Australian and New Zealand Investment Conference 2019  macquarie.com                                              Overview of Macquarie                          Operating groups      3Q19 update        Outlook               Appendix     12
                                                                                                                                                                                                                                                                      12

Stable earnings

5 year earnings volatility relative to Macquarie                                                                                                                 10 year earnings volatility relative to Macquarie
(since GFC)                                                                                                                                                      (includes GFC)

                                                                                                                                                                                 3.9x
4.0                                                                                                                                                              4.0
                3.7x
                                                                                                                                                                                                       3.5x

                                     3.0x
3.0                                                                                                                                                              3.0

2.0                                                                                                                                                              2.0
                                                                                                                                                                                                                   1.7x
                                                           1.5x                 1.4x                                                                                                                                            1.4x

                                                                                                     1.0x                                                                                                                                      1.0x
1.0                                                                                                                                                              1.0
                                                                                                                           0.7x
                                                                                                                                                                                                                                                             0.6x

  -                                                                                                                                                                -
             Global            Global Banks             Global              Domestic             Macquarie             Domestic                                               Global                Global     Global Banks   Domestic       Macquarie     Domestic
           Investment                                 Fund/Asset             Asset                                      Majors                                              Investment            Fund/Asset                   Asset                        Majors
             Banks                                    Managers              Managers                                                                                          Banks                Managers                   Managers

This page compares the historical earnings volatility among certain firms, and is not intended to represent that Macquarie has a comparable business model, risks or prospects to any other firm mentioned.
Volatility of P&L is defined as standard deviation of P&L divided by average P&L (coefficient of variation), based on most recent annual disclosures. Source: Bloomberg as at 26 February 2019.
Macquarie  Citi's 16th Australian and New Zealand Investment Conference 2019  macquarie.com                                            Overview of Macquarie                         Operating groups               3Q19 update                   Outlook              Appendix     13
                                                                                                                                                                                                                                                                                         13

 Strong shareholder returns

   For purchases made and held to sale Macquarie has consistently outperformed the ASX 200, Diversified Financials
   and MSCI World Capital Markets Index

                                                                                             1                                                                  1
                            Outperformance / (underperformance) vs ASX200                                       Average outperformance vs ASX200

  1000

                                                                                                                                                                                                                                                 Outperformance        Outperformance
                                                                                                                                                                                                                     Outperformance                vs ASX 200          vs MSCI World
                                                                                                                                                                                                                           vs                      Diversified         Capital Markets
    800                                                                                                                                                                                                                ASX 2001                    Financials1             Index1

                                                                                                                                                                                            Since listing                 6,406%                         n/a2               n/a2

    600
                                                                                                                                                                                              10 years                     972%                        669%               1,043%

                                                                                                                                                                                               5 years                     153%                        116%                188%
    400

                                                                                                                                                                                               3 years                      91%                         84%                 95%

    200

       0
        Jul-96       Jun-98        Jun-00       Jun-02        Jun-04       Jun-06       Jun-08        Jun-10       Jun-12        Jun-14       Jun-16       Jun-18

Data to 28 Feb for purchases made at different purchase points on a monthly basis. Source: Bloomberg. 1. Total shareholder returns. 2. Macquarie was listed prior to the formation of the MSCI World Capital Markets Index and ASX 200 Diversified Financials Index.
Macquarie  Citi's 16th Australian and New Zealand Investment Conference 2019  macquarie.com                         Overview of Macquarie           Operating groups   3Q19 update      Outlook   Appendix         14
                                                                                                                                                                                                                        14

 Long term ratings stability
 Macquarie Bank Limited
   Standard & Poor’s Ratings Movements from 2007
                                  AA+
      Rating movement (notches)

                                    AA
                                   AA-                       3                                     5                 6              5                                                                      2007
                                    A+      0                                 2                                                                    6                                 5
                                                                                                                                                                       1                         6
                                     A
                                    A-
                                                                                                                                                                                                           2019
                                  BBB+
                                   BBB                                                                                                                                                                   Intra-period
                                         Macquarie    JPMorgan    Credit Suisse           UBS AG               Bank of   Citibank       Morgan Stanley     Goldman Sachs     Barclays     Deutsche          ratings
                                           Bank      Chase Bank        AG                                      America                      Bank               Bank1          Bank2         Bank          movement

                                                                                                                                                                                                              #
   Moody’s Ratings Movements from 2007                                                                                                                                                                   No. ratings
                                                                                                                                                                                                         movements
     Rating movement (notches)

                                   AAA
                                   Aa1
                                   Aa2                      4                                                                                                                                            MBL has
                                   Aa3      1                                                      7                 8              6                                                                   maintained
                                    A1
                                                                            4                                                                                                         4                 its S&P ‘A’
                                                                                                                                                  3                    2                        7        rating for
                                    A2
                                    A3
                                  Baa1
                                  Baa2
                                                                                                                                                                                                         27
                                                                                                                                                                                                        YEARS
                                         Macquarie    JPMorgan    Credit Suisse         UBS AG                 Bank of   Citibank       Morgan Stanley     Goldman Sachs     Barclays     Deutsche
                                           Bank      Chase Bank        AG                                      America                      Bank               Bank           Bank2         Bank

1. Goldman Sachs bank only rated by Standard & Poor’s from 2012. 2.Barclays Bank PLC. As at 2 February 2019.
Macquarie  Citi's 16th Australian and New Zealand Investment Conference 2019  macquarie.com                                               Overview of Macquarie                          Operating groups               3Q19 update                    Outlook                         Appendix                     15
                                                                                                                                                                                                                                                                                                                        15

Funded balance sheet remains strong
Term liabilities cover term assets

These charts represent Macquarie’s funded balance sheets at the respective dates noted above. 1. ‘Other debt maturing in the next 12 months’ includes Structured Notes, Secured Funding, Bonds, Other Loans, Loan Capital maturing within the next 12 months and Net Trade Creditors.
2. ‘Debt maturing beyond 12 months’ includes Loan Capital not maturing within next 12 months. 3. Non-controlling interests netted down in ‘Equity and hybrids’, ‘Equity Investments and PPE’ and 'Loan assets (Incl. op leases) >1 year'. 4. ‘Cash, liquids and self-securitised assets’ includes self-securitisation
of repo eligible Australian assets originated by Macquarie. 5. ‘Loan Assets (incl. op lease) < 1 year’ includes Net Trade Debtors. 6. ‘Loan Assets (incl. op lease) > 1 year’ includes Debt Investment Securities. 7. ‘Equity Investments and PPE’ includes Macquarie’s co-investments in Macquarie-managed funds
and equity investments.
Macquarie  Citi's 16th Australian and New Zealand Investment Conference 2019  macquarie.com                                             Overview of Macquarie                          Operating groups               3Q19 update              Outlook   Appendix   16
                                                                                                                                                                                                                                                                        16

Diversified issuance strategy
Term funding as at 30 Sep 18 diversified by currency1, tenor2 and type

Note: All data presented in these charts represents drawn facilities. 1. Equity has been allocated to the AUD currency category. 2. Securitisations have been presented on a behavioural basis and represent funding expected to mature in >1yr.
Macquarie  Citi's 16th Australian and New Zealand Investment Conference 2019  macquarie.com                                           Overview of Macquarie                          Operating groups               3Q19 update                   Outlook    Appendix   17
                                                                                                                                                                                                                                                                            17

Strong regulatory ratios
Bank Group
December 2018

1. ‘Harmonised’ Basel III estimates are calculated in accordance with the BCBS Basel III framework. 2. Average LCR for Dec 18 quarter is based on an average of daily observations.
3. Includes the capital conservation buffer in the minimum CET1 ratio requirement. In Nov 18, APRA released a draft update to ‘Prudential Standard APS 110 Capital Adequacy’ proposing a minimum requirement for the leverage ratio of 3.5%, effective Jan 22.
Macquarie  Citi's 16th Australian and New Zealand Investment Conference 2019  macquarie.com                                            Overview of Macquarie                          Operating groups               3Q19 update                   Outlook                        Appendix                      18
                                                                                                                                                                                                                                                                                                                     18

 Basel III capital position
 APRA Basel III Group capital at December 2018 of $A20.4b, Group capital surplus of $A4.0b1,2

1. Calculated at 8.5% RWA including the capital conservation buffer (CCB), per APRA ADI Prudential Standard 110. The APRA Basel III Group capital surplus is $A5.2b calculated at 7% RWA, per the internal minimum Tier 1 ratio of the Bank Group. 2. Based on materiality, the 8.5% used to calculate Group
capital surplus does not include the countercyclical capital buffer (CCyB) of ~11bps. The individual CCyB varies by jurisdiction and the Bank Group’s CCyB is calculated as a weighted average based on exposures in different jurisdictions. In Nov 18 the CCyB in the United Kingdom increased from 0.5% to 1.0%
increasing the Bank Group’s CCyB to ~11bps. 3. APRA Basel III ‘super-equivalence’ includes the impact of changes in capital requirements in areas where APRA differs from the BCBS Basel III framework and includes full CET1 deductions for equity investments $A0.4b; differences in mortgages
treatment $A0.7b; capitalised expenses $A0.4b; investment into deconsolidated subsidiaries $A0.2b; DTAs and other impacts $A0.4b. 4. Includes Foreign Currency Translation Reserve movement.
Macquarie  Citi's 16th Australian and New Zealand Investment Conference 2019  macquarie.com                                            Overview of Macquarie                          Operating groups               3Q19 update                    Outlook                       Appendix            19
                                                                                                                                                                                                                                                                                                          19

Regulatory update
• Regulatory capital1
Regulatory
 – APRA is yet to release final standards for Australian banks to ensure that their capital levels can be considered ‘unquestionably strong’.
update
   Based on existing guidance, Macquarie’s surplus capital position remains sufficient to accommodate likely additional requirements
 – In Aug 18, APRA released a discussion paper setting out potential options to improve the transparency, international comparability and
        flexibility of the capital framework. The proposals are not intended to change the amount of capital that ADIs are required to hold2
      – In Nov 18, APRA released a draft update to APS 110 proposing a minimum requirement for the leverage ratio of 3.5%, effective Jan 223
        (MBL’s leverage ratio is 4.9% at Dec 18)
      – In Nov 18 APRA released a discussion paper4 outlining their approach for loss-absorbing capacity to support orderly resolution of Australian
        ADIs
        – The framework would require the Big Four to increase Tier 2 capital by 4-5% of RWAs
        – For other ADIs, including MBL, the need for additional loss-absorbing capacity will be considered by APRA as part of resolution planning,
            and will be no greater than that required for the Big Four

• Royal Commission
      – Macquarie notes the publication of the Final Report of the Royal Commission into Misconduct in the Banking, Superannuation and Financial
        Services Industry and the recommendations contained within it
      – Macquarie is closely monitoring the implementation of the Report’s recommendations and will participate in industry and public consultation
        as appropriate

1. The APRA Capital Framework applies to the Bank Group only. 2. ‘Improving the transparency, comparability and flexibility of the ADI capital framework’; 14 Aug 18. 3. ‘Draft Prudential Standard APS 110 Capital Adequacy’; 27 Nov 18. 4. ‘Increasing the loss-absorbing capacity of ADIs to support
orderly resolution’; 08 Nov 18.
Macquarie  Citi's 16th Australian and New Zealand Investment Conference 2019  macquarie.com   Overview of Macquarie   Operating groups   3Q19 update   Outlook   Appendix   20
                                                                                                                                                                               20

Regulatory update
• Germany
Regulatory
 – Macquarie continues to cooperate with German authorities in relation to a historical German lending transaction in 2011. The total amount
update
   at issue is not material and MGL has provided for the matter
 – Macquarie was one of over 100 financial institutions involved in this market, from which it withdrew in 2012. Consistent with our standard
      practice, Macquarie received extensive external legal advice in relation to the transaction
    – Although no current staff members have been interviewed to date, as expected as part of their ongoing investigation, the German authorities
      have formally classified 22 current and former staff members as persons of interest or suspects under German law, including the Group
      CEO and the former Group CEO

• Brexit
    – As previously stated, Macquarie does not believe that the UK’s withdrawal from the European Union (EU) will be a material event for the
      Group
    – Progress on licence applications to supplement existing EU licences is well advanced and work with regulators to secure these prior to 29
      March 2019 is ongoing
    – Macquarie is subject to application processes that may cause one or more licences to be issued in the second quarter of calendar year
      2019. Contingency arrangements are being put in place for a small number of clients who could be affected by this if the UK leaves the EU
      without a withdrawal or transition agreement on 29 March 2019
    – Macquarie has a longstanding and deep commitment to the UK as the hub for the EMEA region’s operations and this will continue to be the
      case. Macquarie has been in the UK for 30 years with over 1,500 staff based there as at December 2018
Macquarie  Citi's 16th Australian and New Zealand Investment Conference 2019  macquarie.com                                                 Overview of Macquarie                           Operating groups                3Q19 update                     Outlook                        Appendix                       21
                                                                                                                                                                                                                                                                                                                              21

Capital management update
• Impact of changes to CAF business structure:
  – As previously foreshadowed, the transfer of the CAF Principal Finance and CAF Transportation businesses from the Bank Group to the
     Non-Bank Group occurred on 10 December 2018 following
     a meeting of MBL shareholders (which includes holders of Macquarie Income Securities) which approved the transaction
  – In connection with the transfer, MBL returned $A2.04b of capital to MGL. Additionally, the transfer resulted in a post-tax increase in ordinary
     equity for MBL of approximately $A0.3b which was paid as
     a dividend to MGL1
• MSIS has been transferred into CAF Asset Finance in the Bank Group while its fiduciary businesses, such as the infrastructure debt business
  (MIDIS), will move into MAM in the Non-Bank Group on receipt of the required approvals
• On 25 February 2019, MGL announced the offer of Macquarie Group Capital Notes 4 (MCN4)2 (the “Offer”) and subsequently announced the
  results of the Bookbuild on 27 February 2019
  – Offer size of $A750 million with the ability to raise more or less
  – Full details of this Offer and the terms and conditions of MCN4 are set out in the Prospectus lodged with the Australian Securities and
     Investments Commission and Australian Securities Exchange on 25 February 2019
  – The Closing Date for the Offer is 22 March 2019 and Issue Date is 27 March 2019

1. Via the intermediate holding company, Macquarie B.H. Pty Ltd. 2. This announcement does not constitute an offer of any securities (including the MCN4) for sale or issue. No action has been taken to register or qualify MCN4 or the Offer or to otherwise permit a public offering of MCN4 outside Australia.
In particular, this announcement does not constitute an offer of securities for sale in the United States. Neither the MCN4 nor the Ordinary Shares have been or will be registered under the US Securities Act of 1933, as amended (the “US Securities Act”), or the securities laws of any state or other jurisdiction of
the United States, and they may not be offered, sold or resold in the United States or to, or for the account or benefit of, any U.S. person (as defined in Rule 902(k) of Regulation S under the US Securities Act) except pursuant to an exemption from the registration requirements of the US Securities Act and
applicable US State Securities laws.
Macquarie  Citi's 16th Australian and New Zealand Investment Conference 2019  macquarie.com     Overview of Macquarie   Operating groups      3Q19 update   Outlook        Appendix     22
                                                                                                                                                                                           22

Long standing conservative
risk management framework
 Macquarie’s core risk management principles have remained stable and continue to be effective
 The key aspects of Macquarie’s risk management approach are:

                   Ownership of risk at                                                      Understanding worst-case                            Requirement for independent
                    the business level                                                              outcomes                                     sign-off by Risk Management

   Business heads responsible for identifying                                     Risk management approach based on                           Risk Management Group (RMG) signs
   risks within their businesses and ensuring                                     examining the consequences of worst                         off all material risk acceptance decisions
   these are managed appropriately                                                case outcomes and determining whether
                                                                                                                                              For material proposals, RMG opinion is
                                                                                  risks can be tolerated
   Seek a clear analysis of the risks before                                                                                                  sought at an early stage in the decision-
   taking decisions                                                               Adopted for all material risk types and                     making process. The approval document
                                                                                  often achieved by stress testing                            submitted to senior management includes
                                                                                                                                              independent input from RMG on risk and
                                                                                                                                              return

    Macquarie’s approach to risk is supported by the Risk Management Group
    Macquarie determines aggregate risk appetite by assessing risk relative to earnings, with allowance made for
     the loss-absorbing ability of the current regulatory capital surplus
Macquarie  Citi's 16th Australian and New Zealand Investment Conference 2019  macquarie.com   Overview of Macquarie   Operating groups   3Q19 update   Outlook   Appendix            23

02                         Operating groups

                                                                                                                                                                    © MACQUARIE 2019
Macquarie  Citi's 16th Australian and New Zealand Investment Conference 2019  macquarie.com                                          Overview of Macquarie                         Operating groups              3Q19 update                   Outlook                       Appendix                     24
                                                                                                                                                                                                                                                                                                              24

About Macquarie

Annuity-style businesses                                                                                                                                                                                   Markets-facing businesses
Macquarie Asset Management (MAM)                                                                                                                                                                           Commodities and Global Markets (CGM)
• Top 501 global asset manager with $A532.1b2,3 of assets under                                                                                                                                            • Integrated, end-to-end offering across global markets including
  management4, diversified across regions, products, asset                                                                                                                                                   equities, fixed income, foreign exchange and commodities
  classes and investor types                                                                                                                                                                               • Provides clients with risk and capital solutions across physical
• Provides investment solutions to clients across a range of                                                                                                                                                 and financial markets
  capabilities, including infrastructure, real estate, agriculture,                                                                                                                                        • Diverse platform covering more than 25 market segments, with
  equities, fixed income, private credit, liquid alternatives and                                                                                                                                            more than 160 products
  multi-asset solutions
                                                                                                                                                                                                           • Growing presence in commodities (natural gas, LNG, NGLs,
                                                                                                                                                                                                             power, oil, coal, base metals, iron ore, sugar and freight)
Corporate and Asset Finance (CAF)
• Global provider of specialist finance and asset management
  solutions, with a $A21.6b2,5 asset and loan portfolio
                                                                                                                                       1H19                                                                • Global institutional securities house with strong Asia-Pacific
                                                                                                                                                                                                             foundations covering sales, research, ECM, execution and
                                                                                                                                                                                                             derivatives and trading activities
• Asset Finance delivers a range of tailored finance solutions                                                                          Net profit
  globally across a variety of industries and asset classes                                                                                                                                                Macquarie Capital (MacCap)
• Principal Finance provides flexible primary financing solutions
                                                                                                                                       contribution
                                                                                                                                                                                                           • Global capability in advisory, capital raising services and
  and engages in secondary market investing, across the capital                                                                                                                                              investing activities
  structure. It operates globally in the corporate, transport and real
  estate sectors                                                                                                                                                                                           • Provides clients with specialist expertise, innovative advice and
                                                                                                                                                                                                             flexible capital solutions across a range of sectors and products
                                                                                                                                                                                                           • Invests own capital by utilising its balance sheet, investing
Banking and Financial Services (BFS)                                                                                                                                                                         alongside partners to develop assets, build businesses and
• Macquarie’s retail banking and financial services business with                                                                                                                                            create platforms, focusing on green energy, infrastructure,
  total BFS deposits6 of $A51.0b2, Australian loan and lease                                                                                                                                                 technology sectors and private equity clients
  portfolio7 of $A61.3b2,8 and funds on platform9 of $A82.6b2
• Provides a diverse range of personal banking, wealth
  management, business banking and vehicle asset finance
  products and services to retail clients, advisers, brokers and
  business clients

Net profit contribution is management accounting profit before unallocated corporate costs, profit share and income tax. Pie chart is based on 1H19 net profit contribution from operating groups as reported on 2 Nov 18 and has not been restated for business reorganisations affecting MAM, CAF and BFS
that occurred during Dec 2018. 1. P&I Largest Money Managers 2018. 2. As at 31 Dec 18. 3. Including MSIS, total AUM $A540.0b as at 31 Dec 18. MSIS transferred from MAM to CAF on 1 Dec 18. 4. AUM is calculated as proportional enterprise value at measurement date including equity value and net
debt of the underlying assets of funds and managed assets. AUM excludes uninvested equity in MIRA. The infrastructure debt business (MIDIS) within MSIS will transfer to MAM subject to regulatory approvals. 5. Compared to $A21.3b restated as at 30 Sep 18. 6. BFS deposits exclude corporate/wholesale
deposits. 7. The Australian loan and lease portfolio comprises residential mortgages, loans to Australian businesses, vehicle asset finance, insurance premium funding and credit cards. 8. Compared to $A60.0b restated as at 30 Sep 18. 9. Funds on platform includes Macquarie Wrap and Vision.
Macquarie  Citi's 16th Australian and New Zealand Investment Conference 2019  macquarie.com        Overview of Macquarie              Operating groups        3Q19 update            Outlook                Appendix        25

   Macquarie Asset
   Management
    Actively manages money for investors
    across multiple asset classes

        FY18 Net profit contribution*
        $A1,685 million
                                                                   10%
                                                                   on FY17
                                                                                                     No.1                                                         Top 50
                                                                                                     infrastructure manager                                       global asset manager4
                                                                                                     globally2

                                                                                                     140+ infrastructure                                          $A346.2 billion
                                                                                                     and real assets used by
     Equities        Fixed income           Infrastructure        Real Estate                                                                                      MIM investment funds5
                                                                                                     ~100 million                                                  building retirement savings
                                                                                                     people every day3                                             of people all over the world
      Energy           Agriculture           Multi-asset            Specialist
                                                                  investments

       33%*
                           $A532.1 billion
                           assets under management1                                             *Based on FY18 net profit contribution from operating groups.
                                                                                                1. Macquarie Asset Management AUM as at 31 December 2018. Including MSIS, total AUM $A540.0b as at 31 December 2018.
                                                                                                MSIS transferred from MAM to CAF on 1 December 2018.
                                                                                                2. Based on AUM. Willis Towers Watson Global Alternatives Survey 2017 (published July 2017).
                                                                                                3. MIRA Credentials, 31 March 2018.
                                                                                                4. P&I Largest Money Managers.                                                                                           25
                                                                                                5. As at 31 Dec 18.
Macquarie  Citi's 16th Australian and New Zealand Investment Conference 2019  macquarie.com                                         Overview of Macquarie                         Operating groups              3Q19 update                   Outlook             Appendix      26
                                                                                                                                                                                                                                                                                    26

Macquarie Asset Management
Growth in base fees

   Net Profit Contribution1 ($Am)                                                                       Base Fees ($Am)                                                                                    AUM ($Ab)2

                         1H        2H                                                                                                                                                                     550                                                               532.1
                                                                                                                             1H        2H
                                                                                                                                                                                                                                     484                              495
                                                                                                                                                                                                          500                                     477           480
   1,800                                                        1,685                                   1,800
                                         1,644
   1,600                                             1,538                                                                                    1,569 1,574 1,608                                           450          425
                              1,450                                                                     1,600
                                                                                                                                  1,372                                                                   400
   1,400                                                                                                1,400         1,262
                                                                                                                                                                                                          350
   1,200          1,051                                                                                 1,200
                                                                                                                                                                                                          300
   1,000                                                                                                1,000                                                                      884
                                                                              762                                                                                                                         250
      800                                                                                                  800
                                                                                                                                                                                                          200
      600                                                                                                  600                                                                                            150
      400                                                                                                  400                                                                                            100
      200                                                                                                  200                                                                                              50
           0                                                                                                     -                                                                                             -
                  FY14 FY15 FY16 FY17 FY18 FY19                                                                        FY14 FY15 FY16 FY17 FY18 FY19                                                                 Mar 14 Mar 15 Mar 16 Mar 17 Mar 18 Dec 18

1. Net profit contribution is management accounting profit before unallocated corporate costs, profit share and income tax. 2. As at 31 December 2018. Including MSIS, total AUM $A540.0b as at 31 December 2018. MSIS transferred to CAF on 1 December 2018.
Macquarie  Citi's 16th Australian and New Zealand Investment Conference 2019  macquarie.com                                         Overview of Macquarie                         Operating groups               3Q19 update                    Outlook                      Appendix             27
                                                                                                                                                                                                                                                                                                      27

MIRA: Historical Income

                                         MIRA performance fees and other income $Am (LHS)                                                     Average base fees (RHS)1                                                                                                             86
   $Am                                   MIRA base fees $Am (LHS)                                                                            Average performance fees (RHS)                        2                                                                                          % of EUM
  1,400                                                                                                                                                                                     2, 3                                                                       77                      2.0%
                                         MIRA EUM at period end ($Ab)                                                                        Average other income (RHS)

                                                                                                                                                                                                                                                            67                                 1.8%
                                                                                                                                                                                                                                               66
  1,200
                                                                                                                                             60                                                                                                                                                1.6%
                                                                                                                                                                                             Base fees since FY11
                                                                                                                                                                                             Ave: 1.1%
  1,000                                                                                                                                                                                                                           52                                                           1.4%

                                                                                                                                                                                                                                                                                               1.2%
     800            Base fees
                    Ave: 1.0%; St dev: 0.2%
                                                                                                                                                                                                                                                                                               1.0%
                                                                                                                                                                                              36
     600                                                                                                            30
                                                                                                                                                                                                                                                                                               0.8%

                    Performance fees                                                                                                                                                                                                                                                           0.6%
     400            Ave: 0.5%; St dev: 0.4%

                    Other income                                                                                                                                                                                                                                                               0.4%
     200            Ave: 0.2%; St dev: 0.4%
                                                                                                                                                                                                                                                                                               0.2%
                   1

          -                                                                                                                                                                                                                                                                                    -
                FY97        FY98         FY99        FY00        FY01        FY02         FY03        FY04        FY05        FY06         FY07        FY08        FY09        FY10         FY11        FY12        FY13         FY14        FY15        FY16        FY17         FY18

1.. Average base fees (%) calculated as base fees per financial year / average EUM (Invested). 2. Average performance fees and other income (%) calculated as performance fees and other income per financial year / period end EUM. 3. Other income represents net operating income less base and
performance fees for each financial year and includes other income relating to certain MIRA fund assets historically included in the Corporate segment. Base fees and performance fees for real estate funds included from FY05 onwards.
Macquarie  Citi's 16th Australian and New Zealand Investment Conference 2019  macquarie.com         Overview of Macquarie                    Operating groups           3Q19 update          Outlook   Appendix        28

   Corporate and
   Asset Finance
    Finances the assets people use every day

        FY18 Net profit contribution
        $A1,206 million
                                                                   1%
                                                                   on FY17
                                                                                                     1,000,000+ 260+ planes2                                                   A leading global aircraft lessor
                                                                                                     smartphones leased to
                                                                                                     customers worldwide
                                                                                                                                                                               $A37 billion+
                                                                                                      Largest independent                                                      invested across more than
      Aircraft            Energy            Technology              Mining                            meter funder in UK                                                       590+ Principal Finance deals
                                                                  equipment

    Healthcare          Multi-family       Infrastructure
                                                                   Specialist
                                                                                                     9 million+
                                                                                                     meters provided to
                                                                                                                                                                               in 9 years3

                                                                                                                                                                               Largest specialist infrastructure
                                                                 investments
                                                                                                     homes and businesses                                                      debt asset manager4

       24%*
                           $A21.6 billion                                                       * Based on FY18 net profit contribution from operating groups.
                           asset and loan portfolio1                                            1. At 31 December 2018, not part of a distribution network or vertically integrated utility.
                                                                                                2. Including orders.
                                                                                                3. At 30 September 2018.
                                                                                                4. PDI Top 50, 2017. MIDIS AUM of $A7.8 billion as at 31 December 2018.

                                                                                                                                                                                                                    28
Macquarie  Citi's 16th Australian and New Zealand Investment Conference 2019  macquarie.com                                               Overview of Macquarie                           Operating groups               3Q19 update                    Outlook                         Appendix                       29
                                                                                                                                                                                                                                                                                                                           29

Corporate and Asset Finance
Asset and loan portfolios

  Net Profit Contribution1 ($Am)                                                                         Asset Finance Portfolio2 ($Ab)                                                                          Principal Finance Portfolio3 ($Ab)
                                                                                                         35                                                                                                    12
                         1H         2H                                                                                                                                                                                                    11.2
  1,400                                                                                                                                           29.9
                                                                                                                                                                29.7           29.8         29.6
                                                          1,198         1,206                            30
  1,200                                      1,130                                                                                              AWAS                                                           10                                        9.5
                               1,112                                                                                                                                                                                        9.0
                                                                                                         25
  1,000                                                                                                                                       ESANDA
                                                                                                                                                                                                                  8
                   826                                                                                                                                                                                                                                                  6.8
                                                                                                         20
     800                                                                                                                           17.5
                                                                                                                     16.5
                                                                                                                                                                                                                  6
                                                                                                         15                                                                                                                                                                           4.7
     600                                                                                                                                                                                                                                                                                            4.1
                                                                                       437                                                                                                                        4
     400                                                                                                 10

                                                                                                           5                                                                                                      2
     200

           -                                                                                                -                                                                                                      -
                  FY14 FY15 FY16 FY17 FY18 FY19                                                                   Mar 14 Mar 15 Mar 16 Mar 17 Mar 18 Sep 18                                                             Mar 14 Mar 15 Mar 16 Mar 17 Mar 18 Sep 18

1. Net profit contribution is management accounting profit before unallocated corporate costs, profit share and income tax. 2. Excludes the impact of the transfer of the Vehicles portfolio from CAF to BFS in December 2018. 3. Includes Real Estate Structured Finance legacy run-off portfolio and equity portfolio.
Macquarie  Citi's 16th Australian and New Zealand Investment Conference 2019  macquarie.com        Overview of Macquarie                  Operating groups         3Q19 update               Outlook               Appendix        30

   Banking and
   Financial Services
    A technology-driven Australian
    retail bank and wealth manager
                                                                                                     Award winning
        FY18 Net profit contribution*
        $A560 million
                                                                   9%
                                                                   on FY17
                                                                                                     digital banking offering1
                                                                                                                                                                   $A51.0 billion
                                                                                                                                                                   total deposits2
                                                                                                     Australia’s 1
                                                                                                                  st
                                                                                                     open banking platform                                         Australian loan and lease
                                                                                                     gives customers control                                       portfolio of
      Personal
      banking
                            Wealth
                          management
                                                     Business
                                                     banking
                                                                          Vehicle
                                                                          finance
                                                                                                     over their data
                                                                                                                                                                   $A61.3 billion3
   Credit cards           Investments           Property services          Vehicle                    A leading Australian                                         30+ years bringing innovation and
   Home loans           Financial advice          Professional           loans and                    vehicle financier                                            competition to Australian consumers
  Bank accounts              Wrap                   services               leasing

                                                                                                      600,000+
                                                                                                      vehicles
                                                                                                                                                                   Rebuilt our tech stack and are the
                                                                                                                                                                   first to offer lending and retail deposits
                                                                                                                                                                   on one core banking system
                           More than
       11%*                1 million
                           Australian clients
                                                                                                * Based on FY18 net profit contribution from operating groups.
                                                                                                1. Best Digital Banking Offering & Most Innovative Card Offering at 2017 Australian Retail Banking awards / Winner
                                                                                                in the 2018 Mozo Experts Choice Awards in the Travel Money/ International Money Transfer category.
                                                                                                2. At 31 December 2018. BFS deposits exclude corporate/wholesale deposits.
                                                                                                3. At 31 December 2018.

                                                                                                                                                                                                                                30
Macquarie  Citi's 16th Australian and New Zealand Investment Conference 2019  macquarie.com                                            Overview of Macquarie                          Operating groups                  3Q19 update                 Outlook                        Appendix                        31
                                                                                                                                                                                                                                                                                                                       31

Banking and Financial Services
Growth in BFS deposits and loans

 Net Profit Contribution1 ($Am)                                                                          BFS Deposits2 ($Ab)                                                                                          Australian loan
                                                                                                                                                                                                                      and lease portfolio3 ($Ab)
                   1H         2H                                                                        60
                                                                                                        55                                                                                                                  Australian Mortgages            Business Lending             Other       Vehicles
 600                                                                 560                                                                                                                  51.0
                                                        513                                             50                                                                  45.7
                                                                                                                                                              44.5
 500                                                                                                    45                                                                                                                                                                                             61.3
                                                                                                                                                40.4
                                                                                                        40                        37.3                                                                               60
 400                                                                                                    35          33.3
                                          350                                                                                                                                                                        50
                                                                                   296                  30                                                                                                                                                                               40.6
                             285
 300           260                                                                                                                                                                                                   40                                      35.1          35.8
                                                                                                        25                                                                                                                                    30.4
                                                                                                        20                                                                                                           30
 200                                                                                                                                                                                                                            21.5
                                                                                                        15                                                                                                           20
 100                                                                                                    10
                                                                                                                                                                                                                     10
                                                                                                          5
       -                                                                                                   -                                                                                                            -
              FY14 FY15 FY16 FY17 FY18 FY19                                                                      Mar 14 Mar 15 Mar 16 Mar 17 Mar 18 Dec 18                                                                    Mar 14 Mar 15 Mar 16 Mar 17 Mar 18 Dec 18

1. Net profit contribution is management accounting profit before unallocated corporate costs, profit share and income tax. During FY14, Group Treasury revised internal funding transfer pricing arrangements relating to BFS’s deposit and lending activities. FY13 comparatives have been restated to reflect the
current methodology. 2. BFS deposits exclude any Corporate/Wholesale deposit balances. 3. The Australian loan and lease portfolio comprises residential mortgages, loans to Australian businesses, vehicle asset finance, and other includes insurance premium funding and credit cards. Vehicles portfolio moved
from CAF Asset Finance to BFS effective 1 Dec 2018.
Macquarie  Citi's 16th Australian and New Zealand Investment Conference 2019  macquarie.com        Overview of Macquarie                  Operating groups     3Q19 update   Outlook     Appendix        32

   Commodities and
   Global Markets
    Provides clients with access to markets,
    financing, financial hedging, research and
    market analysis and physical execution

        FY18 Net profit contribution
        $A910 million
                                                                   6%
                                                                   on FY17                           No.2
                                                                                                      physical gas
                                                                                                                                                                      Derivatives
                                                                                                                                                                      House of the Year2
                                                                                                      marketer in North America1                                      Energy

          30
          years
                +                       20
                                        years
                                              +                    15
                                                                   years
                                                                                                      Differentiated insights on                                       Direct access to  50+
        in metals,
     equities, futures
     and FX markets
                                     in agricultural
                                        markets
                                                                  in energy
                                                                   markets                            2,000+ stocks                                                    equity exchanges and
                                                                                                                                                                       liquidity venues
                                                                                                      globally

                           Market trading across

       18%*                160+
                           products in 25+ market segments
                                                                                                * Based on FY18 net profit contribution from operating groups.
                                                                                                1. Platts 3Q CY18.
                                                                                                2. 2018 Energy Risk Awards.

                                                                                                                                                                                                      32
Macquarie  Citi's 16th Australian and New Zealand Investment Conference 2019  macquarie.com                                           Overview of Macquarie                          Operating groups              3Q19 update                    Outlook                       Appendix                   33
                                                                                                                                                                                                                                                                                                               33

Commodities and Global Markets
Integrated, end-to-end offering across global markets

 Net Profit Contribution1 ($Am)                                                                                                                                                    Net Operating Income2
                           1H         2H                                                                                                                                                               Investment and
  1,000                                                                    971                                                                                                                          other income
                                       899                                                   910                                                                                                             2%

                     833                                 844
                                                                                                                                                                                                      Equities net
     800                                                                                                                                                                                              interest and
                                                                                                                700                                                                                 trading income
                                                                                                                                                                                                          12%                              Risk
                                                                                                                                                                                                                                        management
                                                                                                                                                                                                                                         products
     600                                                                                                                                                                                                                                   24%
                                                                                                                                                                                       Credit, interest
                                                                                                                                                                                         rates and
                                                                                                                                                                                          foreign
                                                                                                                                                                                         exchange                                                   Lending &
     400                                                                                                                                                                                    18%                                                     financing
                                                                                                                                                                                                                                                       8%

                                                                                                                                                                                                                Brokerage,
     200                                                                                                                                                                                                        commission                                             Inventory
                                                                                                                                                                                                               and other fee                                        management,
                                                                                                                                                                                                                  income                                            transport and
                                                                                                                                                                                                                    31%                                                 storage
          -                                                                                                                                                                                                                                                               5%
                   FY14              FY15              FY16               FY17              FY18              FY19

1. Net profit contribution is management accounting profit before unallocated corporate costs, profit share and income tax. 2. For the full year ended 31 Mar 18, excluding impairment charges, provisions, net gains on sale and internal management (charge)/revenue, based on the Management Discussion &
Analysis income classifications.
Macquarie  Citi's 16th Australian and New Zealand Investment Conference 2019  macquarie.com        Overview of Macquarie                 Operating groups         3Q19 update              Outlook            Appendix        34

   Macquarie
   Capital
    Advises and invests alongside clients and
    partners to realise opportunity

                                                                                                     No.1 global infrastructure                                         Global
                                                                                                                                                                        in green energy
                                                                                                                                                                                        leader
        FY18 Net profit contribution*
                                                                   45%                               finance       adviser1
        $A700 million                                              on FY17
                                                                                                     No.1 completed                                                     60+ green energy projects
                                                                                                     M&A deals in ANZ2                                                  under development or construction

                                                                                                     Most Innovative Investment                                         Project & Infrastructure
                                                                                                     Bank for Infrastructure and                                        Finance Award
             Energy             Infrastructure      Real estate      Technology
                                 and utilities                                                       Project Finance3                                                   Best Project Sponsor6
                                                                                                      Australian Renewable Energy
                                                                                                      Deal of the Year – Wind –                                         Project & Infrastructure
     Telecommunications,          Resources         Industrials        Financial                      Coopers Gap Wind Farm4                                            Finance Award
    media and entertainment                                           institutions                                                                                      Best Power Financing –
                                                                                                      Best Financial Structure –                                        Norte III6
                                                                                                      Transport (Silver) D4/R7
                                                                                                      Highway PPP, Slovak Republic5

       14%*
                           $A352 billion
                           completed deals in FY187                                             * Based on FY18 net profit contribution from operating groups.
                                                                                                1. Inframation (CY18, by volume). 2. Dealogic (CY18, by volume). 3. The Banker (2018). 4. The Asset (2018).
                                                                                                5. Partnerships Awards (2018). 6. LatinFinance (2018). 7. Dealogic and IJGlobal for Macquarie Group completed
                                                                                                M&A, balance sheet positions, ECM and DCM transactions converted as at 31 Mar 2018. Deal values reflect the
                                                                                                full transaction value and not an attributed value.                                                                        34
Macquarie  Citi's 16th Australian and New Zealand Investment Conference 2019  macquarie.com                                            Overview of Macquarie                          Operating groups               3Q19 update   Outlook   Appendix   35
                                                                                                                                                                                                                                                            35

Macquarie Capital
Globally diversified with a core strength in real assets

     Net Profit Contribution1 ($Am)                                                                                                                                                 Income by region2

                          1H         2H                                                       700
       700

       600

                                                                            483
       500                                                451
                                         430
                                                                                                               406
       400

                       280
       300

       200

       100

            -
                     FY14              FY15             FY16              FY17              FY18             FY19

1. Net profit contribution is management accounting profit before unallocated corporate costs, profit share and income tax. 2. Income by region reflects FY18 net operating income excluding internal management revenue/(charge).
Macquarie  Citi's 16th Australian and New Zealand Investment Conference 2019  macquarie.com   Overview of Macquarie   Operating groups   3Q19 update   Outlook   Appendix            36

03                         3Q19 update

                                                                                                                                                                    © MACQUARIE 2019
Macquarie  Citi's 16th Australian and New Zealand Investment Conference 2019  macquarie.com                                               Overview of Macquarie                             Operating groups   3Q19 update   Outlook   Appendix   37
                                                                                                                                                                                                                                                      37

3Q19 overview
• Satisfactory trading conditions with significant realisations in 3Q19 across the Group
• Macquarie’s annuity-style businesses’ (MAM, CAF and BFS) combined 3Q19 ​net profit contribution1
      slightly up on pcp (3Q18)
       – FY19 YTD2 net profit contribution1 down on FY18 YTD2 mainly due to:
         lower performance fees in MAM; offset by timing of transactions in CAF Principal Finance; and continued
         growth in BFS
• Macquarie’s markets-facing businesses’ (CGM and MacCap) combined 3Q19 net profit contribution1
      significantly up on pcp
       – FY19 YTD2 net profit contribution1 significantly up on FY18 YTD2 primarily due to:
         higher principal revenue in MacCap; and the strong performance of the commodities platform in CGM

1. Net profit contribution is management accounting profit before unallocated corporate costs, profit share and income tax. 2. YTD refers to the nine months to 31 Dec for the relevant year.
Macquarie  Citi's 16th Australian and New Zealand Investment Conference 2019  macquarie.com                                            Overview of Macquarie                          Operating groups               3Q19 update                   Outlook                        Appendix                     38
                                                                                                                                                                                                                                                                                                                   38

3Q19
                                                                                    Macquarie Asset Management                                                  Corporate and Asset Finance                                                Banking and Financial Services

                                                                                    29%
                                                                                    1H19 contribution1
                                                                                                                                                                17%
                                                                                                                                                                1H19 contribution1
                                                                                                                                                                                                                                           11%
                                                                                                                                                                                                                                           1H19 contribution1

Overview                                                                         • AUM of $A532.1b2 at Dec 18, down 2% on
                                                                                     Sep 18 predominately driven by market
                                                                                     movements
                                                                                                                                                             • Asset Finance and Principal Finance portfolio of
                                                                                                                                                                 $A21.6b at Dec 18, broadly in line with Sep 18
                                                                                                                                                                                                                                         • Total BFS deposits6 of $A51.0b at Dec 18, up
                                                                                                                                                                                                                                             3% on Sep 18
                                                                                                                                                             • Asset Finance originations in line with                                   • Australian mortgage portfolio of $A37.3b at
                                                                                 • MIRA: $A116.8b in EUM3, up 10% on Sep 18;                                     expectations                                                                Dec 18, up 3% on Sep 18
                                                                                     $A8.7b in new equity raised in 3Q19 including                           • Notable transactions include Asset Finance being • Funds on platform7 of $A82.6b at Dec 18, down
                                                                                     $A7.4b in Europe; $A1.0b of equity invested;
Annuity-style                                                                        $A1.2b of asset divestments; and $A24.3b of
                                                                                     equity to deploy at Dec 18
                                                                                                                                                                 awarded the next two years of funding for the
                                                                                                                                                                 rollout of second generation smart meters in the
                                                                                                                                                                 UK for one of the largest energy suppliers
                                                                                                                                                                                                                                             6% on Sep 18, mainly due to market movements
                                                                                                                                                                                                                                         • Business banking loan portfolio of $A8.1b at
                                                                                                                                                                                                                                             Dec 18, up 4% on Sep 18
                                                                                 • MIRA: Appointed as investment manager of
businesses                                                                           The Infrastructure Fund (TIF), a $A2.5b unlisted
                                                                                     infrastructure fund in Australia
                                                                                                                                                                 following a competitive tender process
                                                                                                                                                             • Principal Finance portfolio additions of $A0.6b
                                                                                                                                                                 in 3Q19
                                                                                                                                                                                                                                         • Australian vehicle asset finance portfolio8 of
                                                                                                                                                                                                                                             $A15.3b at Dec 18, down 1% on Sep 18
                                                                                 • MIM: $A346.2b in AUM, down 5% on Sep 18,                                  • Notable transactions include completion of
                                                                                     predominately driven by market movements and                                Principal Finance's acquisition of a 50% interest
                                                                                     net flows; awarded $A8.4b4 in new, funded                                   in a leading UK car park management and
                                                                                     institutional mandates and contributions                                    solutions company, and completion of the
                                                                                                                                                                 acquisition of a 50% interest in a portfolio of
                                                                                                                                                                 multifamily rental properties and development
                                                                                                                                                                 pipeline in the US
                                                                                                                                                             • Notable realisations included the sale of Principal
                                                                                                                                                                 Finance’s majority stake in Energetics, a leading
                                                                                                                                                                 UK multi-utility network provider, to a European
                                                                                                                                                                 infrastructure investor
                                                                                                                                                             • MIDIS’ total third party investor commitments
                                                                                                                                                                 increased to $A11.0b; closed a number of
                                                                                                                                                                 investments bringing total AUM to $A7.8b5

1. Based on 1H19 net profit contribution from operating groups as reported on 2 Nov 18 and has not been restated for business reorganisations affecting MAM, CAF and BFS that occurred during Dec 2018. Net profit contribution is management accounting profit before unallocated corporate costs, profit share
and income tax. 2. Compared to $A542.5b restated as at 30 Sep 18. 3. MIRA’s total EUM includes market capitalisation at measurement date for listed funds, the sum of original committed capital less capital subsequently returned for unlisted funds and mandates as well as invested capital for managed
businesses. 4. For the nine months to 31 Dec 18. 5. MIDIS AUM includes undrawn commitments of $A0.6b. 6. BFS deposits exclude corporate/wholesale deposits. 7. Funds on platform includes Macquarie Wrap and Vision.
8. Portfolio moved from CAF Asset Finance to BFS effective 1 Dec 2018.
Macquarie  Citi's 16th Australian and New Zealand Investment Conference 2019  macquarie.com                                           Overview of Macquarie                         Operating groups               3Q19 update   Outlook            Appendix              39
                                                                                                                                                                                                                                                                              39

3Q19
                                                                                   Commodities and Global Markets                                                                             Macquarie Capital

                                                                                   27%
                                                                                   1H19 contribution1
                                                                                                                                                                                              16%
                                                                                                                                                                                              1H19 contribution1

Overview                                                                         • Strong performance continued in North American Gas and Power,
                                                                                   albeit with fewer opportunities from storage and management of
                                                                                   transport positions in the latter part of the quarter
                                                                                                                                                                                          • 78 transactions valued at $A155b3 completed globally, up on pcp and prior
                                                                                                                                                                                              period (by value), driven primarily by advisory activity in Europe, Australia
                                                                                                                                                                                              and Americas, however Americas DCM activity down on a strong 2Q19
                                                                                   – Maintained ranking as No.2 physical gas marketer in North                                            •   Financial adviser to members of the supervisory board of Linde AG on its
                                                                                      America2                                                                                                combined enterprise value of ~€80b merger with Praxair, Inc

Markets-facing                                                                   • Continued strong performance in Fixed Income & Currencies
                                                                                   with increased client activity in structured FX in EMEA and
                                                                                   Asia-Pacific
                                                                                                                                                                                          •   Financial adviser to Wesfarmers Limited in relation to the ~$A19b demerger
                                                                                                                                                                                              of Coles Group Limited, the largest spin off in ASX history4
                                                                                                                                                                                          •   Financial adviser to KKR on its acquisition of BMC Software and joint
businesses                                                                       • Cash Equities impacted by challenging market conditions
                                                                                 • Improved results across the Futures platform driven by increased
                                                                                                                                                                                              bookrunner and joint lead arranger on the $US6.6b financing to support the
                                                                                                                                                                                              acquisition
                                                                                   client activity and volumes                                                                            •   Realisation of Macquarie’s 21.8% interest in Quadrant Energy through the
                                                                                                                                                                                              sale of 100% of the business to Santos Limited for $US2.2b, plus the
                                                                                                                                                                                              realisation of Macquarie’s 23.9% interest in PEXA, through a trade sale
                                                                                                                                                                                              process valuing 100% of the business at $A1.6b
                                                                                                                                                                                          •   Green Investment Group alongside Covanta invested in a 50% stake in Earls
                                                                                                                                                                                              Gate Energy Centre, a waste to energy plant to be constructed in Scotland
                                                                                                                                                                                          •   Green energy realisations included Markbygden ETT (Swedish onshore
                                                                                                                                                                                              wind), Westermost Rough (UK offshore wind) and Lincs (UK offshore wind)
                                                                                                                                                                                          •   No. 1 in ANZ for completed M&A5 and No. 2 in ANZ for ECM deals6
                                                                                                                                                                                          •   No. 1 Global Infrastructure Financial Advisor7 and No. 1 US LBO Loans
                                                                                                                                                                                              Bookrunner – Software & Services8

1. Based on 1H19 net profit contribution from operating groups. Net profit contribution is management accounting profit before unallocated corporate costs, profit share and income tax. 2. Platts Q3 CY18.
3. Dealogic and IJGlobal for Macquarie Group 3Q19 completed M&A, principal investments, ECM and DCM transactions, converted at 31 Dec 18 FX rate. Deal values reflect the full transaction value and not an attributed value.
4. Refinitiv (1 Apr 87 – 14 Jan 19, by ‘spin off’). 5. Dealogic CY18 (by volume). 6. Dealogic CY18 (by value). 7. Inframation CY18 (by volume and value). 8. Bloomberg CY18.
Macquarie  Citi's 16th Australian and New Zealand Investment Conference 2019  macquarie.com   Overview of Macquarie   Operating groups   3Q19 update   Outlook   Appendix            40

04                         Outlook

                                                                                                                                                                    © MACQUARIE 2019
Macquarie  Citi's 16th Australian and New Zealand Investment Conference 2019  macquarie.com                                             Overview of Macquarie                          Operating groups               3Q19 update                   Outlook                        Appendix                    41
                                                                                                                                                                                                                                                                                                                   41

Factors impacting short-term outlook
Annuity-style businesses                                                                                                                                                                            Markets-facing businesses
Macquarie Asset Management (MAM)                                                                                                                                                                    Commodities and Global Markets (CGM)
Base fees expected to be up, benefiting from strong capital                                                                                                                                         Strong customer base expected to drive consistent flow
raising and deployment in MIRA and platform acquisitions                                                                                                                                            across Commodities, Fixed Income, Foreign Exchange and Futures
Performance fees and investment-related income                                                                                                                                                      Business benefited from strong market conditions in 1H19
(net of impairments) expected to be down
                                                                                                                                                                                                    Macquarie Capital (MacCap)
Corporate and Asset Finance (CAF)
Asset Finance portfolio broadly in line
Timing and level of early prepayments
                                                                                                                                  1H19                                                              Assume market conditions broadly consistent with 1H19
                                                                                                                                                                                                    Fewer investment realisations expected given strong first three
                                                                                                                                                                                                    quarters of FY19
and realisations in Principal Finance                                                                                               Net profit
Reduced loan volumes in Principal Finance
                                                                                                                                   contribution
Banking and Financial Services (BFS)
Higher deposit, loan portfolio and platform volumes
NIM pressure due to higher costs and competitive pressures

                                                                                                      Corporate
                                                                                                      Compensation ratio to be consistent with historical levels
                                                                                                      Based on present mix of income, along with the favourable
                                                                                                      impacts of US tax reform, the FY19 effective tax rate is
                                                                                                      expected to be down on FY18

Net profit contribution is management accounting profit before unallocated corporate costs, profit share and income tax. Pie chart is based on 1H19 net profit contribution from operating groups as reported on 2 Nov 18 and has not been restated for business reorganisations affecting MAM, CAF and BFS that
occurred during Dec 2018.
You can also read