New Balance of State WorkForce Investment Board 2011 Plan - Serving Regions 5, 8, 9, and 11
←
→
Page content transcription
If your browser does not render page correctly, please read the page content below
New
  Balance
  of
  State

WorkForce
  Investment
  Board

2011
  Plan

                                 Serving
  Regions
  5,
  8,
  9,
  and
  11


                         1
SECTION
1:
EXECUTIVE
SUMMARY
3
SECTION
2:
LABOR
MARKET
ANALYSIS
3
SECTION
3:
OPERATIONAL
PLANS
14
SECTION
4:
KEY
PARTNERSHIPS
19
SECTION
5:
BUDGET
20
SECTION
6:
GOVERNANCE
AND
STRUCTURE
23
SECTION
7:
PROGRAM
CONTACT
PERSONS
AND
SIGNATURE
PAGE
40
2SECTION
1:
EXECUTIVE
SUMMARY
Four Indiana Economic Growth Regions have formed a partnership to create one Workforce
Investment Board, the New Balance of State Workforce Investment Board. The New Balance of
State Workforce Investment Board is the successor entity to the former Balance of State
Workforce Investment Board and will allocate funding, set policy, and define performance
metrics for the four Regional Workforce Boards serving regions 5, 8, 9, and 11. The Regional
Workforce Boards will continue to manage the daily business of the regions. This partnership
serves a labor force of approximately one million and is comprised of 35 counties.
This document summarizes the regional plans and presents information specific to the Workforce
Investment Board.
Theme: The focus of the New Balance of State Workforce Investment Board is to support and
add value to the Regional Workforce Boards in the joint effort to move Indiana’s workforce up
one level. Positive results will be obtained through careful planning, monitoring, and investment
in training for skills necessary to compete in the world marketplace and by connecting the
workforce with available opportunities. The challenge for workers is obtaining the right training
for the available jobs. The solution in many cases is a certificate or other credential for an entry-
level position with a career path, often termed “Middle Skills” job.
Initiative: The New Balance of State Workforce Investment Board joins regional leadership in
implementing plans by adding value to the regional programs and initiatives. Creating strong
partnerships to engage political, business, and education leaders in identifying available jobs,
training requirements, and available resources is fundamental. Effective distribution of resources
will be data-driven.
Informing locally elected officials of workforce development resources within their communities
will encourage greater use and impact of these resources. Active engagement of business
partners, such as Chambers of Commerce, will increase understanding of workforce board goals
to identify available jobs and training gaps. The inclusion of educational leaders is clearly
fundamental to align instruction with employment. While use of statistical data is important in
planning and projecting, the feedback of government, business, and education leaders on a
routine basis is critical to understand and properly respond to market forces and trends.
Action: The New Balance of State Workforce Investment Board will draw the four regions into
a collaborative partnership, create a forum for sharing best practices, and enhance the results of
taxpayer investment. Additional resources will be sought through application for both public and
private grants.
SECTION
2:
LABOR
MARKET
ANALYSIS
• All responses should be strongly supported by available data.
• What are the area’s primary business sectors by business size?
3Using the data supplied by each region, the first chart compiles the five largest business sectors
by number of employees reported in the regional plans, omitting employees not in those sectors.
The employee categories are then displayed by region, showing the top five reported categories,
including the remainder in a separate category labeled “other”. (Six categories are displayed in
Region 8 as it has a significant employee sector in education, which is unique among the
regions.)
Three large sectors are primary to each region: Manufacturing, Retail Trade, and Health Care
and Social Services. These three sectors account for the more than three-quarters of the top
employee categories. The data as broken down by region show very different mixes of these
sectors, forming a basis for regional economic differences.
Regions
5,
8,
9,
11
Employees
Manufacturing
Retail
Trade
107,757
Health
Care
and
Social
Services
89,523
Accommodation
and
367,842
Food
Service
Administrative
Support
86,005
Educational
Services
Transportation
and
51,696
Warehousing
5,400
49,513
all
other
17,629
Region
5
Employees
Manufacturing
24,564
Retail
Trade
42,285
Health
Care
and
147,285
Social
Services
32,866
Accommodation
and
Food
Service
31,000
Administrative
Support
all
other
18,000
4Region
8
Employees
Manufacturing
Retail
Trade
14,644
Health
Care
and
Social
31,305
Services
12,447
Accommodation
and
Food
Service
14,737
Public
Administration
17,629
Educational
Services
12,296
all
other
7,659
Region
9
Employees
Manufacturing
Retail
Trade
30,553
Health
Care
and
13,000
Health
Support
83,160
Hospitality
and
Tourism
10,675
Transportation
and
Warehousing
8,400
5,400
other
Region
11
Employees
Manufacturing
37,996
Retail
Trade
106,092
21,791
Healthcare
and
Social
Assistance
27,727
Public
Administration
23,854
all
other
5Section 2, question 2:
What are the current and projected employment opportunities within the local area?
Region 5 projects the high demand and high wage jobs will be middle –skills jobs, jobs that
require some additional training, such as Dental Hygienist. These jobs “represent the beginning
of a career pathway that will lead to a self sufficient paying Middle-Skills job”1
Region
5
Projected
employment
865
Manufacturing
Health
Care
290
OfMice/Administration
2,435
180
Logistics
Region 8 lists the industries which will offer more than 400 openings within the next two years.
The plan draws a distinction between these jobs and those which pay a “good wage” and creates
a separate list.
Region
8
Projected
employment
Food
Preparation
and
Serving
Related
Sales
and
Related
448
468
OfMice
and
Administrative
1,378
Support
650
Production
Education,
Training,
720
970
Library
Transportation
and
955
Material
Moving
Healthcare
Practitioners
and
Technical
1
Region 5 Plan, Page 5,
6Region
9
Projected
employment
100
142
143
187
Manufacturing:
Team
161
Assemblers/Production
Health
Care
863
Industrial/Mechanical
3,948
Education
Gaming
Supervisors
Region 9 is unique in projecting a large number of manufacturing jobs, emphasizing, “Such jobs
will constitute 16 percent of the labor due to a retiring workforce.”2
Heating,
AC,
Region
11
Projected
employment
Refrig.
Mechanics,
593
Management
analysts,
912
Human
Boilermakers,
Resources,
787
Training,
and
Labor
Relations,
840
Registered
Construction
Nurses,
5955
Engineers,
Operators,
850
First-‐Line
Supervisors/
Truck
Drivers,
Manager
of
Heavy
and
Construction
Tractor
Trailer,
Trades,
1259
5322
Construction
Accountants
Laborers,
and
Auditors,
1629
1402
Region 11 predicts nearly equal growth in the demand for registered nurses and truck drivers,
demonstrating two active and very different sectors of the economy.
Section 2, Question 3:
What are the area’s high-demand, high-wage occupations, as well as the job skills and
educational attainment needed for those occupations?
Region 5 has adopted a middle-skills job training policy to meet the demand for the jobs in the
chart below.
2
Region 9 Plan, Page 5, Emphasis added.
7Region
5
OfMice
and
Administrative
Support
12,888
Health
Care
Occupations
18,332
43,679
Logistics
20,504
Construction
Trades
34,462
Manufacturing
Region 8 “is committed to utilizing available funds to train individuals only for occupations that
are anticipated to have available job openings and pay a good wage.”3 The region identifies
occupations in demand, eligible for Workforce Investment Act training funds, and paying a good
wage. The region strives to include training that delivers a credential and makes use of the
abundance of local educational facilities.
Region 9 notes that manufacturing employs over 30,000 or one in every 4 people and will
produce thousands of available jobs in the next couple of years. These jobs will not represent
growth of the industry, but turnover of existing employees. “National workforce development
professionals are advocating that public monies be invested in a variety of short-term
occupational training methods that emphasize contextualized, industry-specific learning that
results in a nationally recognized credential.”4
Region
9
1,000
Logistics
1,250
Tourism
5,048
Health
Care
4,128
Occupations
Manufacturing
Region 11 added the training needed to qualify for the jobs listed in the projected employment
categories (see above, page 6). The training ranges from moderate on-the-job training
(Construction Laborer) to a Bachelor’s degree for Accountants/Auditors.
Section 2, Question 4:
What industries and occupations within the local area’s economy are expected to grow or
decline within the next three years and within the next ten years?
3
Region 8 Plan, Page 6.
4
Region 9 Plan, Page 7.
8The table below summarizes the responses by region, marking generalized sectors expected to
grow or decline by region, using information provided by each region.
Manufacturing is listed as a declining category in three of the four regions. Nearly all other
sectors are anticipated to grow, with the exception of retail sales and executives in Region 8.
Region 5 8 9 11
Manufacturing Decline Decline Decline Grow
Retail (sales) Decline Grow
Health Care Grow Grow Grow
Accommodation, Tourism, and Food & Beverage Grow Grow Grow
Office and Administration Grow Grow Grow
Logistics Grow Grow Grow Grow
Construction Grow Grow Grow
Business Occupation Specialists Grow
Post Secondary Teachers Grow
Computer Specialists Grow
Executives Decline
Section 2, Question 5:
Does the area have any ‘targeted’ business sectors that are unique from other areas within the
State? If so, describe the information and process utilized to establish the ‘targeted’ sector.
Regions 9 and 11 target the Manufacturing sector. Region 9 notes that the manufacturing sector
employs 1 of every 4 of its workers stating: “Working with manufacturing employers to ensure
that workers are qualified for advanced manufacturing jobs is a top priority.”
Similarly, Region 11 points to two studies of the local economy, the State’s Strategic Skills
Initiative and the WIRED grant, as identifying the target sector of Advanced Manufacturing. It
is a regional jobs engine, particularly for plastics and chemical manufacturing. Closely related to
manufacturing, Logistics is also a targeted sector. Health Care is an important regional sector
with “training modules to allow persons to enter the industry, continue education and to move up
the ladder to higher skilled and higher paying jobs…”5 Energy is cited as a long-term growth
sector and Region 11 has advisory groups to assist in developing economic and workforce
opportunities.
Regions 5 and 8 target Middle-Skills jobs in all sectors. Region 8 conducts annual research to
identify occupations that offer significant employment opportunities with good wages. “Rather
than targeting only a few business sectors, the Regional Workforce Board seeks to offer
customers a wide array of choices from which to select their career path.”6
Region 5 seeks to target actual employment opportunities available through “Preferred Employer
Partners”. These partnerships are created in response to employment opportunities and require
the employers to work closely with the WorkOne system in identifying real job opportunities that
the Workforce Investment Act client may secure. These jobs must be on a middle-skills career
5
Region 11 Plan, Page 4.
6
Region 8 Plan, Page 8.
9pathway and provide an employee with a permanent position, opportunity for advancement, and
other benefits.
Section 2, Question 6:
What does the area’s workforce look like statistically along the following categories:
Demographics, Educational Attainment, and Current High School Graduation Rate?
The workforce in the 35 county region is 1,012,5347. Approximately 50.68% of the population
is female and 49.32% is male.
Demographics by age:
Population Estimates by Age, 2009 Number Regional % State %
Preschool (0 to 4) 131,385 6.6% 6.9%
School Age (5 to 17) 356,056 17.9% 17.8%
College Age (18 to 24) 191,149 9.6% 10.0%
Young Adult (25 to 44) 524,814 26.4% 26.3%
Older Adult (45 to 64) 528,738 26.6% 26.0%
Seniors (65 and older) 254,775 12.8% 12.9%
Sources: U.S. Census Bureau; Indiana Business Research Center
Demographics by race:
Population Estimates by Race and Hispanic Regional State
Origin, 2009 Number % %
American Indian or Alaska Native Alone 4,419 0.2% 0.3%
Asian Alone 34,140 1.7% 1.5%
Black Alone 63,370 3.2% 9.2%
Native Hawaiian and Other Pac. Isl. Alone 676 0.0% 0.1%
White 1,864,703 93.8% 87.8%
Two or More Race Groups 19,609 1.0% 1.2%
Hispanic or Latino (can be of any race)
Non-Hispanic 1,941,639 97.7% 94.5%
Hispanic 45,278 2.3% 5.5%
Source: U.S. Census Bureau
For the combined regions, the population by age mirrors the state of Indiana, being only slightly
smaller or larger in all categories. Greater variation is seen in race with fewer minorities than the
state as a whole.
Region 5 states the 2010 Census show a single county, Hamilton County, contains almost 30%
of Region 5’s population and grew by over 33%. In addition, the minority population of Region
5 grew by over 132% and now constitutes almost 9% of the region. The graying of the
population was demonstrated by the increase from 18% to 21% for persons aged between 50 and
69.
Region 8 reports the Asian minority population of 2.1% is greater than the African American
1.9%.
In Region 9, population increased by 6% during 2000 to 2010, but this is less than the state’s
increase. The minority community grew by over 65% and now represents almost 5% of the
7
June 2011 Hoosiers By the Numbers. Attachment 4.
10Region 9 total. Over 10,000 persons of Hispanic descent are in the region, with nearly half that
number concentrated in Bartholomew County.
Region 11 holds that the group most in need of Workforce Investment Act services are “…those
with less than a ninth grade education and that hold no diploma”8, 11.8% of the population, or
32,096 people.
Educational Attainment (High School Diploma or equivalent, Associate, Bachelor, Advanced
Degree)
• Current High School Graduation Rate
o Region 5 reports that the high school graduation rate is in the high 90% for most of its
counties. Madison County is the exception with a dropout rate of over 18%.
o Only four of Region 8’s twenty public high schools had an average graduation rate of
less than 80%, with the remainder meeting or exceeding the state’s average of 84.1%.
o In Region 9, 85% of the population aged 25 and over have a high school degree or
greater. Dropout rates range from a low in Decatur of 2.2% to a high of 16.7% in
Jefferson. Overall, 85% of the population 25 years and older have attained a high
school degree.
o Region 11 supplies a chart comparing the educational attainment levels between 1990
and 2000. In 2000, 38.30% of the population over 25 had attained a high school
degree.
• Post Secondary
o Region 5 reports 39% of adults aged 25 or older have achieved a post-secondary
degree.
o Region 8 supplies a graph showing educational attainment of residents 25 years old
and older in 2009, stating “Despite the presence of Indiana University and Ivy Tech
Community College within the region, nearly three-fourths of these individuals have
less than an Associate Degree.”
o In Region 9, 38,700 high school graduates attempted to earn a post-secondary degree
but did not complete the requirements. Region 9 concludes, “In all, 76 percent of
Region 9’s adult population may be lacking the necessary level of education to
succeed in the 21st century labor market.”9
o Region 11 focuses its demographic analysis on the educational needs of the
population and the positive economic impact of attainment of a degree. Region 11
concludes: “The population groups in most need of Workforce Investment Act
services are those with less than a ninth grade education and those that hold no
diploma”.10
8
Region 11 Plan, Page 6.
9
Region 9 Plan, page 8.
10
Region 11 Plan, page 5
11Employed/Unemployed numbers and percentages11
Labor June May 2011 June
Area Employed Unemployed
Force 2010 Rate Rate 2011 Rate
Indiana 3,152,637 2,885,225 267,142 10.10% 8.30% 8.50%
BOS WIB* 1,012,534 937,309 75,225 8.90% 7.30% 7.40%
Region 5 472,798 438,542 34,256 8.60% 7.10% 7.20%
Region 8 153,761 141,688 12,073 9.10% 7.40% 7.90%
Region 9 162,501 149,126 13,375 10.20% 8.50% 8.20%
Region 11 223,474 207,953 15,521 8.30% 6.90% 6.90%
*New Balance of State Workforce Investment Board
This data displayed in graphic form:
Regions
5,
8,
9,
and
11
Labor
Force
223,474
Region
5
472,798
Region
8
162,501
Region
9
Region
11
153,761
Employed/Unemployed
June
2011
Region
11
Region
9
Employed
Region
8
Unemployed
Region
5
0
100,000
200,000
300,000
400,000
500,000
11
Hoosiers by the Numbers Labor Market Review, Statistical Data Report for June 2011.
Released August 2011. These data are not related to educational attainment.
12Regional
Unemployment
Rate
June
2011
12.00%
10.00%
8.00%
6.00%
June
2010
Rate
4.00%
June
2011
Rate
2.00%
0.00%
Region
5
Region
8
Region
9
Region
11
Based upon labor market information and demographics, what makes the area unique to its
contiguous areas and within the State as a whole?
All four regions point to the need to raise educational levels as a unique challenge. Region 5
explains its emphasis on training for middle-skills jobs and the need for post-secondary
educational attainment to meet the demands for these jobs. Region 8 summarizes its challenges
by noting the varying levels of education within the region and draws a link between the low
average wage per hour and the low educational attainment of the adult population.
Region 5 points to its geographic location and the large size of its population as unique. It
completely surrounds the state capitol, the “heart” of Indiana’s economy, and has nearly 50% of
the New Balance of State’s workforce and nearly 30% of the entire state’s workforce and
employers. Region 5 is different from other regions as it has a diversified economy, unlike other
regions’ dependence upon manufacturing.
Region 8 addressed this question with a review of the assets of its business sectors. For example,
the manufacturing sector has added life science related jobs. These advanced manufacturing
processes replace traditional manufacturing jobs. Tourism offers some unique local attractions,
from the offerings of the natural setting, the world-class educational institutions, to the
attractions of a casino destination. The jobs created directly and indirectly from the military
presence at NSA Crane are fundamentally important to the region. There is a significant effort to
nurture entrepreneurship, and Region 9 notes that 60% of the businesses in the region have fewer
than 5 employees.
Region 9 points to two metropolitan statistical areas, Columbus and Cincinnati, as making its
area unique. A $38 million initiative underwritten by the Lilly Endowment aids Region 9 in
advancing by one level the education, training, job placement and income of residents, mainly in
the Columbus area. A consortium of Workforce Boards, The Employers First Regional
Workforce Network, serves the Ohio, Indiana, and Kentucky tri-state area near Cincinnati with a
collective voice, “recognizing that cross-geographic issues impact the economic vitality of each
local area.”12
12
Region 9 Plan, Page 10.
13Region 11 states “There must be a systematic approach in assisting both the emerging and
existing workforce with identifying a career path, assessing skills, and implementing activities
that assist them in navigating their chosen path.”13 The region highlights its approach to building
skills in individuals and connecting the skills with industry-specific workforce pipelines makes it
unique.
SECTION
3:
OPERATIONAL
PLANS
Section 3, Questions 1 and 2
Provide the address, phone number and hours of operations for each WorkOne office located
within the area. Identify which offices are “full service” and “express”.
Please refer to each plan for the list.
o Region 5, page 11
o Region 8, page 11
o Region 9, page 11
o Region 11, page 7
Section 3, Question 3
Does the Workforce Investment Board/Regional Workforce Board use any performance metrics
in addition to Common Measures? If so, describe those metrics.
Regions 5 and 9 are implementing:
o % Of Workforce Investment Act clients who received training and obtained employment
o % Of Workforce Investment Act clients who obtained jobs in the field in which they
were trained
o % Of those in training who will receive a credential
The goal is to track “how investing its workforce development resources in occupational training
impacts a Workforce Investment Act client’s chances of obtaining a job in that relevant field that
will lead to a fruitful career pathway”.14
Region 8 has established target service levels and is “strongly committed to providing the
maximum amount of financial assistance possible directly to the customers”15 with a goal of
expending at least 50% of its funds on direct client costs, revised this year to 30% in anticipation
of decreased funding.
Region 11 adds the following tracking:
o The number of new customers by month and year-to-date
o Review specific customer services by month and year-to-date
o Individual training contracts by year-to-date
13
Region 11 Plan, Page 6.
14
Region 5 Plan, Page 13.
15
Region 8 Plan, Page 11.
14o Credentials according to type and degreed credentials according to field of study
o Monthly regional youth progress report
Section 3, Question 4
Describe how the Workforce Investment Board/Regional Workforce Board will track actual
performance against performance goals.
Performance is measured in at least three categories: training completed, credential obtained,
employment gained. The regions add to these in various ways, from additional metrics to track
the impact of dollars invested in training to measuring customer satisfaction through surveys.
Regions 5 and 9 have initiated studies of the outcomes of the Workforce Acceleration Grant
clients. Statistics collected include the number who complete training, the number who secure a
credential, and the number who obtain work with the credential that was received through the
grant. Using these statistics, the region will develop goals for 2012 and track performance
against these goals.
Both regions 5 and 9 are analyzing the impact of services provided in closing the gap in
education needs of the workforce.
Regions 8 and 11 submit regular written reports to the Regional Workforce Board comparing
goals and outcomes. Region 8 reviews available enrollment, placement, and performance data.
Region 11 maintains several committees, which, along with the Regional Workforce Board,
interpret and determine the quality, acceptability, and progress of services rendered.
Section 3, Question 5
Part 1: Complete Workforce Investment Act Adult and Dislocated Worker Services Matrix
These matrices outline the Core Services (workshops), Intensive Services (training), Other
Activities or Programs (Business services, etc.) and cost allocation associated with the service.
The target numbers of clients to be served in each category complete the projections. Refer to
the Regional plans as follows:
o Region 5, Attachment B
o Region 8, Attachment 2
o Region 9, Attachment B
o Region 11, Attachment F
Part 2: Describe the criteria to be used by the Workforce Investment Board/Regional Workforce
Board to determine if Workforce Investment Act Annual Adults Funds shall be considered
“limited.”
The policy adopted by the board for Region 5 calls for declaring funds limited in the event that
the percentage of Adult Workforce Investment Direct Client Funds remaining is less than the
percentage of the year remaining. Upon this declaration, Adult Workforce Investment Act
clients earning 100% or less of Economically Disadvantaged Criteria are eligible for Direct
Client funding.
Region 8 reviews the funds expended for the past year and compares this to the available funds
in the current program year, taking into account the historically high percentage of available
15funds expended. It considers past requests to transfer Workforce Investment Act Dislocated
Worker funds to Adult funds. This analysis leads to a determination of “limited” or “unlimited”.
Upon concluding funds are “limited” a priority scoring system is in effect. For Program Year
2011, funds have been determined to be “limited”.
Region 9’s board will consider Workforce Direct Client Services as limited when 75% of the
Adult funds have been obligated. These funds will remain limited until the end of the program
year or until program funding levels are replenished.
Region 11’s board follows Department of Workforce Development Policy 2007-25 and generally
considers the funds as limited as it meets one or more of the limitations.
Section 3, Question 6
Describe the process that the Workforce Investment Board/Regional Workforce Board will use to
ensure priority is provided to veterans and veterans’ spouses, low-income individuals, and
recipients of public assistance when Workforce Investment Adult Funds become “limited.”
Region 5 will use a “Priority Index List” to determine priority during times of such restrictions.
See Attachment C for the Priority Criteria worksheet.
Region 8 utilizes a “priority index form” and a point scoring system based on veteran status,
income sources, and other criteria.
Region 9 utilizes a “Priority Index” with a scoring system to determine the funding an eligible
adult may receive during times of restrictions.
Region 11 identifies veterans and spouses upon intake and assesses needs for service and has an
established order of service.
Section 3, Question 7
Workforce Investment Act Youth Services: Complete Youth Services Matrix
o Region 5, Attachment D
o Region 8, Attachment 3
o Region 9, Attachment D
o Region 11, Attachment H
Section 3, Question 8
Indicate the number of Youth Service staff persons located within the area.
Region 5: 1 Director, 5 Career Coaches, 5 Jobs for America’s Graduates Specialists, and 1 Jobs
for America’s Graduates Specialists Coordinator, a total of 12
Region 8: 6 full time staff equivalents
Region 9: 3 Youth Advisors, 1 Jobs for America’s Graduates provider
Region 11: 10
Section 3, Question 9
Describe specific outreach activities targeted to youth within the area.
16The New Balance of State Workforce Investment Board is forming a multi-regional Youth
Council. The Council will determine its focus and will also support and add value to the Youth
activities as determined by each Regional Workforce Board. In addition, the new Council will
work closely with the state Youth Council, supporting its initiatives and coordinating efforts
within the service area. The goal is to build strong partnerships with the regional Youth
programs and youth employment through leveraging the time and resources of the Youth
Council board members individually and as a group.
All regions recruit young people through posters displayed at the WorkOne Centers, in
educational settings through posters (of the Jobs for Americas Graduates program), partnership
with community organizations through referrals, employer referrals, court referrals, job fairs and
other appropriate settings.
Region 5: Summer youth employment program, Work Experience/Internship program, Jobs for
America’s Graduates Program, Industry Specific Demonstration Programs.
Region 8: Close coordination through relationships with community agencies, schools, and
employers among others.
Region 9: Jobs for America’s Graduates Program, Summer Employment Opportunities
Program, Internships/Paid Work Experience Program, And Post Secondary Scholarship Program
Region 11: In-School Program Recruitment is done for Jobs for America’s Graduates. Out of
school recruitment is done through coordination with community and judicial entities, schools,
and not-for-profits among others. Walk-ins at the WorkOne centers are also recruited.
Section 3, Question 10
How does the Workforce Investment Board/Regional Workforce Board measure the success of
Youth Service providers?
Region 5: goal of placement of 45% of job seekers in employment within 90 days and 65% gain
in workplace readiness skills.
Region 8: Target of 296 youth to be served, 65% of which must be older youth and have two
locally defined “most in need” characteristics. The targeted placement rate is 72%.
Region 9: The Department of Labor’s common measures will be used: 66% of all youth placed
in employment or education; 50% of youth attain a degree or certificate; 75% of youth gain in
literacy and numeracy
Region 11: Through enrollment, Common Measure performance goals, reporting and case
system documentation, successful program completion rates. These measures are reported
monthly and have follow-up mandates.
Section 3, Question 11
Other Services: How does the Workforce Investment Board/Regional Workforce Board ensure
that local staff coordinates activities with the State Rapid Response team/Dislocated Workers
Unit to perform the following:
• Securing and sharing information when there is a possibility of a mass layoff (50 or
more workers)?
• Coordinating activities where a layoff involves a company that is Trade certified?
Region 5’s Business Consultant will lead the local effort in partnership with the State Rapid
Response team. This leadership will determine locations for services, funding sources, provision
of information and other actions. The Region 5 board holds that “programs should be structured
17to respond to the needs of the region’s economic development mission to retain, expand and
attract business endeavors to the region.”16
Region 8’s WorkOne Coordinator serves as the Rapid Response Coordinator ensuring all
information and coordination will be shared as appropriate.
Region 9 will deploy a Rapid Response Team including the Director of Business Services as the
leader and seven other members including the Unemployment Insurance Project Manager,
Veteran’s Representative, and Small Business Development representative. The Region 9 Rapid
Response Team works closely with the Dislocated Worker Unit, reacts quickly to any WARN
notices, and keeps the Unit apprised of Rapid Response activities.
Region 11 staff work closely with several partners to learn of impending layoffs and craft a
response to the demands of the crisis. When a company seeks the benefits of the Trade
Adjustment Act, response efforts are initiated in order to communicate with all affected
employees.
Section 3, Question 12
How does the Workforce Investment Board/Regional Workforce Board ensure the coordination
of the following programs, at minimum, at each WorkOne?
• Unemployment Insurance
• Trade Act
• Title 38 Veterans’ Programs
• Worker Profiling and Reemployment Services and Reemployment and Eligibility
Assessment
Region 8 explains “…these services are all part of the integrated service delivery model
implemented in WorkOne offices throughout the region. Because the integrated service model is
designed to offer seamless delivery of services, customers will be able to access these programs
by following the normal customer flow process.”17
Each region describes the programs and the specific requirements of the programs. The regions
point to their management teams and partners and describe the approach taken to ensure the
timely delivery of program benefits to qualified customers.
Section 3, Question 13
Briefly describe the business services, specifically job recruitment, job posting and job matching
services that are offered within the area.
Region 5: The region employs two business consultants to deliver services to the business
community. These are added to the service provider staff and state employees also working in
this area. The team works to raise awareness among employers and deliver appropriately trained
workers. Efforts are concentrated on businesses that pay self-sufficient wages, offer benefits and
growth opportunities, and utilize and promote the WorkOne system.
Region 8: The Business Service Consultant and Business Services Team assist business to
utilize the available services. The team meets and works with other economic development
16
Region 5 Plan, page 18.
17
Region 8 Plan, page 15.
18organizations by holding job fairs, delivering labor market information, and providing office
space, testing, and support to employers for recruitment purposes.
Region 9: A total of 16 team members deliver services to businesses in the region. From
educating the business community about the available resources to hosting job fairs, many other
acts of partnership occur on a routine basis.
Region 11: Works with job seekers and employers by promoting Indiana Career Connect and
employers through efficient use of the program’s capabilities.
Section 3, Question 14
Describe how the Workforce Investment Board/Regional Workforce Board will ensure that
veterans’ priority of service will be carried out within the local area.
“Individuals who have served in active Military, Naval or Air Service, and spouses of Veterans
who are discharged under other than dishonorable conditions are eligible to receive Veterans’
priority for services.”18 Each region has appropriate signage at the centers informing Veterans of
their eligibility for service and adheres to state policy. The regions note their understanding of
the programs available to veterans and spouses and their efforts to deliver the services.
Region 5: Attachment G defines the Priority of Service Policy.
Region 8: In addition to appropriate signage and staff guidance, activity reports are provided for
the management team’s review.
Region 9: Attachment E is the Priority of Service Policy
Region 11: Veteran representatives are located in both the Vincennes and Evansville offices.
SECTION
4:
KEY
PARTNERSHIPS
Section 4, Question 1
Complete Key Workforce Investment Board/Regional Workforce Board Partnership Matrix
The matrices describe the name of the partner, a description of the partnership and shared
customers and/or interests. Examples of the partnerships each region maintains are touched upon
here; for further information, see each plan’s Key Partnership matrix as there are many more
partners revealing deep resources within each region.
Region 5 partners with Atterbury Job Corps to assist young people ages 16 through 24 with
career technical and academic training and employment opportunities.
Region 8 has a partnership with the Brown County Probation Department. The Department
refers individuals recently released from jail and the partners work to assist these individuals to
gain successful employment.
18
Region 8 Plan, page 17.
19Region 9 partners with the Community Education Coalition, focused on aligning and integrating
the Columbus, Indiana and region’s community learning system with economic growth and a
high quality of life. The region assists with grants, refers clients, and employers.
Region 11 has a partnership with the Chamber of Commerce of Southwest Indiana-Vanderburgh
County and mutually employs staff to assist business and job seekers.
o Region 5, Attachment H
o Region 8, Attachment 4
o Region 9, Attachment F
o Region 11, Attachment I
The Memorandum of Understanding of the New Balance of State Workforce Investment Board
is attached as Attachment 1. This documents formally records the Workforce Investment Act
required partners.
Describe how the Workforce Investment Board/Regional Workforce Board partners with
economic development entities within the local area and at the state level.
Each region reports strong partnerships with local economic development organizations.
Regions 5 and 8 show that economic development officials are also members of the Regional
Workforce Board. The many joint meetings and partnerships help coordinate retention and
expansion, to develop new employment opportunities, and to assist in developing recruitment
and training plans. The delivery of labor market information to the other economic development
organizations also promotes partnership.
Region 9 works with a consortium of Ohio, Kentucky and Indiana Workforce boards and
Northern Kentucky Chamber of commerce to determine skills gaps and how to address the gaps.
Region 11 is co-located with other economic development partners in the same building and
shares a staff member with the Evansville Chamber of Commerce and also the Perry County
Development Corporation.
SECTION
5:
BUDGET
Section 5, Question 1
Attach a copy of the Workforce Investment Board or Regional Workforce Board and its
Workforce Investment Act service providers proposed budgets for Program Year 2011 using
2010 allocation information.
Section 5, Question 2
Describe how the Workforce Investment Board or Regional Workforce Board monitors its
annual budget and the budgets of its service providers.
The regional boards review, approve, and monitor all annual spending. Each region contracts
with a Fiscal Agent to hold, disburse, and track all Workforce Investment Act funds. All four
regions contract with Crowe, Horwath for this service.
The regions’ fiscal agent presents and reviews a detailed report first to each finance committee
and then to each board at regularly scheduled meetings. The board meetings are advertised on
20regional websites and open to the public. Two of the four regions currently have monthly
meetings; one has bi-monthly meetings; the fourth region has quarterly meetings. The regional
board exercises authority to approve, modify, or deny all payments.
In addition to board review, annual financial audits are conducted by a contracted outside entity.
The Department of Workforce Development also conducts periodic review of the financial
records.
The New Balance of State Workforce Investment Board will meet and review its budget
expenditures as a regular agenda item from a standardized monthly budget report form. The
Indiana Department of Workforce Development serves as Fiscal Agent. The board action serves
to approve, modify, or deny all expenditures.
Workforce Investment Act funding regulations currently restrict administration costs at 10%, a
rule that applies to the regions as well as the workforce investment board. Regions are able to
under expend in administration and move the remaining funds to program costs. Region 8
reports it makes use of this flexibility.
Budgets are attached as follows:
o Workforce Investment Board, Attachment 2
o Region 5, Attachment I
o Region 8, Attachment 6
o Region 9, Attachment G
o Region 11, Attachment J
Section 5, Question 3
Describe how the Workforce Investment Board and Regional Workforce Board will ensure that
administrative spending is kept to a minimum.
• Explain how Workforce Investment Act administrative funds will be utilized, including
projected expenditures for the following categories:
o Staffing (administrative cost)
o Travel
o Outreach
o Other (describe)
o Provide any policies/procedures the Workforce Investment Board or Regional
Workforce Board will utilize to approve the following:
§ Hiring of staff
§ Travel
The New Balance of State Workforce Investment Board adheres to both the Workforce
Investment Act and Indiana Statute to adopt policy and allocate funds to the regional workforce
boards. Every effort to reduce the costs of the new board is undertaken, as it is well understood
that every dollar spent on board administration is one less dollar available for the regional
programs. For example, the New Balance of State Workforce Investment Board will utilize the
Department of Workforce Development as Fiscal Agent. This approach meets with approval
from the US Department of Labor and saves administrative dollars. In addition, the board
operates on a lean basis with a single staff member. Regional staff members assist at Workforce
Investment Board meetings to further contain costs and to form a close partnership.
21The New Balance of State Workforce Investment Board travel is in accordance with state policy
2010-14 found at:
http://www.in.gov/dwd/files/DWD_Policy_2010-14.pdf.
This policy sets limits for mileage below the IRS amount, requires use of rental vehicles for
longer mileage trips, caps the amount allowed for hotel rooms, and places other controls on
travel costs.
Outreach efforts will seek to maximize communication and education while minimizing costs.
Information will be shared electronically with board members, regional workforce board
members, operators and service providers, and other interested parties. Use of free social media
platforms will be explored for additional communication avenues. The New Balance of State
Workforce Investment Board will maintain a webpage on the Department of Workforce
Development site at no cost. Meetings will be held in no-cost venues.
Outreach to elected officials is an important aspect of the work of the New Balance of State
Workforce Investment Board. Efforts are made to include and inform the elected officials. This
includes visiting the officials individually, attendance at public meetings, distribution of
information detailing program availability, and requesting nominations for board vacancies. The
goal is to create a strong partnership with the elected officials to promote workforce development
resources and effectiveness in the community.
The New Balance of State Workforce Investment Board assists the Regional Workforce Boards
by sharing best practices, both to contain costs and increase program effectiveness. Future
actions could include joint bidding for items such as annual audit costs or fiscal agent, for some
or all of the Regional Workforce Boards.
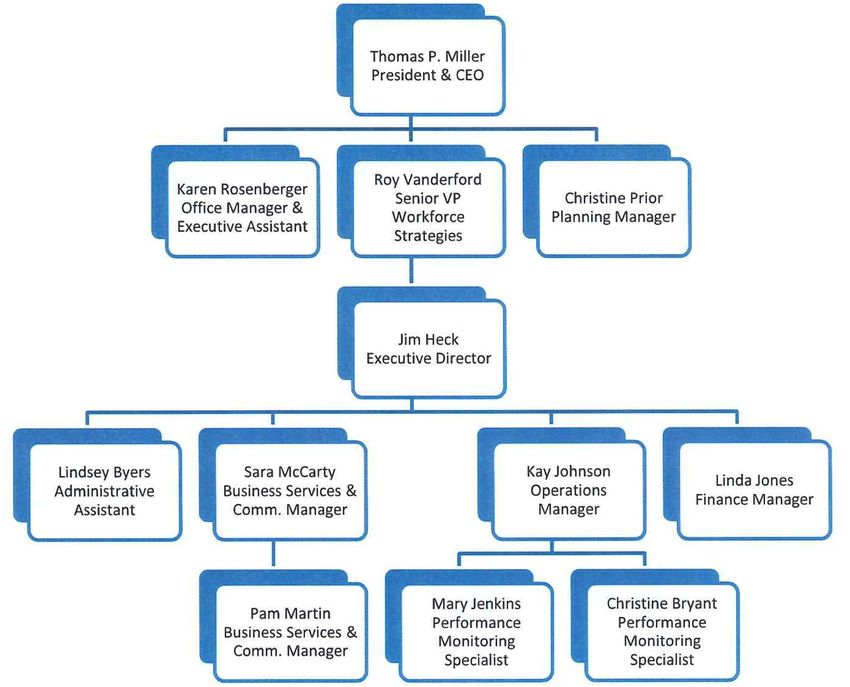
As submitted in the regional plans, Regions 5 and 9 describe actions to contain administrative
costs by cutting staff (two in Region 5; one in Region 9), re-negotiation of lease expenses, and
travel cost cutting efforts in a new reimbursement policy including outreach through webinars
and conference calls. Regions 5 and 9 contain administrative costs through shared staff (see the
organizational charts for more information).
All regions point to the competitive procurement process as a way to contain costs. Region 11
elaborates that contract negotiations are an effective tool within the competitive procurement
process that serve to minimize duplications.19
Region 8 reports it routinely under-expends on administrative costs allowing re-allocation of
funds to fill gaps in program needs. Region 8 takes action to specify the percentage of funds that
its service providers may expend on various categories. Region 9 cut administrative costs
through procurement of one service provider for both Adult/Dislocated Worker and Youth. In
addition, Regions 5 and 9 lease expenses were cut, and bundled telephone and Internet services
in the WorkOnes allowed for additional savings.
Outreach:
19
Region 11 Plan, page 20.
22No costs are directly associated with Outreach in the Regional Workforce Budgets. Regions 5
and 9 did not discuss this question; Regions 8 and 11 indicated that Outreach is a function of the
daily interaction of the Service Providers and WorkOne Coordinators.
Other:
Region 8 indicated cost of audits of the Board and Regional Operator and legal fees are
contained in this category.
Section 5, Question 4
Provide any policies/procedures the Workforce Investment Board and Regional Workforce
Boards will utilize to approve the following:
• Hiring of staff
• Travel
The New Balance of State Workforce Investment Board employs a single staff member.
Procurement is in accordance with the state hiring policy. Travel approval is in accordance with
state policy.
The Regional Workforce Boards do not employ staff and rely upon the Regional Operators to
provide contractual staff. The Boards use the competitive procurement processes to acquire
Operators and other service providers.
Regions 5 and 9 provide formal travel policies; Regions 8 and 11 reimburse reasonable and
directly related expenses through board approval.
SECTION
6:
GOVERNANCE
AND
STRUCTURE
Section 6, Question 1
Describe how the Workforce Investment Board and Regional Workforce Board consulted with
members of the public, including local elected officials, representatives of business, labor, and
economic development prior to the submission of this plan.
The Regional Workforce Boards took a variety of steps to gain input. Every region presented the
draft plan to the board for approval. Regions 5 and 9 called together the local economic
development organizations to solicit comments in addition to posting on their websites. Region
8 posted the draft plan on their website for review and comment and sent emails to local elected
officials and economic development specialists asking for input. Region 11 visited regional
mayors and attended county commission meetings to present the draft plan. In addition, Region
11 held meetings with local Chambers of commerce, the Central Labor Council, and economic
development groups. Region 11 presented it to the regional board’s sub-committee meetings.
The New Balance of State Workforce Investment Board creates its document from the submitted
regional plans that have had the benefit of community review. The Regional Operators were
provided with a draft document; three regions submitted comments that were incorporated into
the final document.
Section 6, Question 2
23Describe the role of the local elected officials in the governance and implementation of the
Workforce Investment programs in the local area. (Attach a copy of the Local Elected Officials’
Agreement and the County Chief Elected Officials’ agreement.)
The New Balance of State Workforce Investment Board recognizes the importance of the role of
the elected officials for overall direction of workforce development activities and in the
economy. An active program of meeting with the elected officials in the region is important to
create a partnership. These meetings will transmit economic data, reports on the available
programs, and solicit input for planning purposes. These activities will supplement and
complement the actions of the regional boards. Elected officials are active in nominating
members for board membership; one member of the board is a mayor. Three nominee members
of the Youth Council are elected officials.
Regions 5, 8, and 9 explain the role of elected officials as serving on the executive council and
selecting a “Regional Elected Official”. The elected officials appoint members of the Regional
Workforce Board when vacancies occur in accordance with statutory procedure. The elected
officials are invited to board meetings.
Region 11 annually attends county commission public meetings and meets with mayors
throughout the year. In addition, elected officials are invited to special bi-annual meetings to
discuss programs and outcomes.
Section 6, Question 3
Who is the chief elected official for the area, and how is liability for the misuse of Workforce
Investment Act funds assumed by the local elected officials?
The Chief Elected Official for the Workforce Investment Board service area is the Governor of
Indiana, Mitchell E. Daniels, Jr. As such, the Governor assumes all responsibility for the misuse
of Workforce Investment Act funds. This is seen as a major benefit for the individual regions.
The Chief Elected Official for each region is:
Region 5: John Richwine, Madison County Commissioner
Region 8: Shawna Girgis, Mayor of the City of Bedford
Region 9: Craig Luedeman, Mayor of the City of Seymour
Region 11: Jonathan Weinzapfel, Mayor of the City of Evansville
The regional Chief Elected Official represents all elected officials in the region in workforce
development matters.
Section 6, Question 4
Identify who the fiscal agent or entity responsible for the disbursal of Workforce Investment
grant funds is in the local area
New Balance of State Workforce Investment Board
Name: Randy Gillespie, Chief Financial Officer
Organization: Indiana Department of Workforce Development
Address: 10 N Senate Avenue SE 302
Indianapolis, IN 46204
Telephone Number: 317-232-7675
E-mail address: RGillespie@dwd.in.gov
24Region 5
Name: Carla Crowe
Organization: Crowe and Horwath
Address: 3815 River Crossing Parkway, Suite 300
Indianapolis, IN 46240-0977
Telephone Number: 317-225-2571
E-mail address: Carla.Crowe@crowehorwath.com
Region 8
Name: Scott Nickerson
Organization: Crowe Horwath
Address: 3815 River Crossing Parkway, Suite 300
Indianapolis, IN 46240-0977
Telephone Number: 317-706-2693
E-mail address: scott.nickerson@crowehorwath.com
Region 9
Name: Carla Crowe
Organization: Crowe and Horwath
Address: 3815 River Crossing Parkway, Suite 300
Indianapolis, IN 46240-0977
Telephone Number: 317-225-2571
E-mail address: Carla.Crowe@crowehorwath.com
Region 11
Name: Nancy Begle
Organization: Crowe Horwath
Address: 1149 S Balthazar Drive
Santa Claus, IN 47579
Telephone Number: 812-544-2121
E-mail address: nancy.begle@crowehorwath.com
Section 6, Question 5
Describe the nomination and selection process used to appoint members to the workforce
investment board.
The New Balance of State Workforce Investment Board began the process by sending a letter
signed by the Chairperson of the State Innovative Council, Paul Perkins. The letter was sent to
mayors, presidents of town councils, and to the president of the county commission in each of
the region’s thirty-five counties. The letter announced the formation of the new workforce
investment board and invited the participation of these elected officials in nominating members.
In addition, contacts were made with locally elected officials, Chambers of Commerce,
economic development agencies, and labor unions throughout the workforce development area to
surface nominees. The regional workforce boards and operators also submitted nominees.
Meetings were held with elected officials to seek their participation and to further inform them
on the new investment board.
Section 6, Question 6
Using available workforce data, describe how business representatives that serve on the
Workforce Investment Board are appointed to accurately reflect the employment opportunities
25(primary industries, business size) and the geographic diversity of the local workforce service
area.
The New Balance of State Workforce Investment Board used March 2011 data from Hoosiers by
the Numbers “quick stats” to research the top occupations by growth and the top ten employers
in the four regions. The following information was revealed:
Top Ten Occupations by Growth
5*
8
9
11
Registered
Nurses
Graduate
Teaching
Team
Assemblers
Registered
Nurses
Customer
Service
Reps
Assistants
Registered
Nurses
Food
Prep,
servers
Food
Prep,
servers
Food
Prep,
s ervers
Retail
Salespersons
Retail
Salespersons
Janitors,
Cleaners
Registered
Nurses
Food
Prep,
servers
Customer
Service
Truck
Drivers
Home
Health
Aides
Home
Health
Aides
Personal/home
care
Retail
Salespersons
Retail
Salespersons
Office
Clerks
aides
Laborers
and
freight
movers
Maids,
H ousekeeping
Truck
Drivers
Nursing
Aides
Office
Clerks
Office
Clerks
Shipping
Clerks
Janitors,
cleaners
Landscaping/Groundskeeping
Wait
staff
Nursing
Aides
Truck
Drivers
Bookkeeping,
Accounting,
Janitors,
Cleaners
Janitors,
Cleaners
Office
Clerks
Auditing
Nursing
Aides
Sales
Reps
*Includes
Marion
County
Of the top forty regional growing occupations, ten are medical, six are manufacturing or
warehousing, and three of the four regions show food preparation and servers in the top three
growth occupations.
The major employers by region are:
5**
8
9
11
Conseco
Inc.
+
U
S
Naval
Weapons
Argosy
Casino
Hotel
Whirlpool-‐-‐
Sallie
Mae
Loan
Svc
&
Support
Center
Columbus
Regional
closed
Data
Cook
Group,
Inc.
Hospital
Toyota
Resort
Club
General
Electric
Hill-‐Rom
Co
St.
Mary's
International
AFSCME
Geocom
Corporation
Hospital
St.
John's
Surgery
Perdue
Farms
Alsin
USA
Deaconess
Center
Baxter
Healthcare
Manufacturing
Hospital
Keihin
North
America
Pharmaceutical
Batesville
Casket
Mead
Johnson
Atterbury
Reserve
Visteon
Corporation
Belterra
Casino
Alcoa
Forces
Crane
Army
Wal-‐Mart
Bristol-‐Myers
Community
Hospital
Ammunition
Distribution
Center
USI
Anderson
GM
Powertrain
Cosco
Good
Samaritan
Knauf
Fiberglass
Paoli
Inc.,
Warehouse
Cummins,
Inc.
Hospital
GMBH
TJ
Maxx
Bankers
National
Life
Warehouse
Johnson
Memorial
Hospital
**Does not include
Marion Co.
26You can also read